

Abstract
We describe the genetic and kinetic defects in a congenital myasthenic syndrome due to the mutation εA411P in the amphipathic helix of the acetylcholine receptor (AChR) ε subunit. Myasthenic patients from three unrelated families are either homozygous for εA411P or are heterozygous and harbor a null mutation in the second ε allele, indicating that εA411P is recessive. We expressed human AChRs containing wild-type or A411P ε subunits in 293HEK cells, recorded single channel currents at high bandwidth, and determined microscopic rate constants for individual channels using hidden Markov modeling. For individual wild-type and mutant channels, each rate constant distributes as a Gaussian function, but the spread in the distributions for channel opening and closing rate constants is greatly expanded by εA411P. Prolines engineered into positions flanking residue 411 of the ε subunit greatly increase the range of activation kinetics similar to εA411P, whereas prolines engineered into positions equivalent to εA411 in β and δ subunits are without effect. Thus, the amphipathic helix of the ε subunit stabilizes the channel, minimizing the number and range of kinetic modes accessible to individual AChRs. The findings suggest that analogous stabilizing structures are present in other ion channels, and possibly allosteric proteins in general, and that they evolved to maintain uniformity of activation episodes. The findings further suggest that the fundamental gating mechanism of the AChR channel can be explained by a corrugated energy landscape superimposed on a steeply sloped energy well.
Keywords: congenital myasthenic syndrome, single channel kinetics, hidden Markov modeling, channel gating, energy landscape
INTRODUCTION
Communication throughout the nervous system relies on submillisecond electrical discharges within and between neurons and their effector organs. These electrical discharges are mediated by ion channels, which have evolved hydrophobic domains to anchor them in the cell membrane, and putative linkage structures that couple voltage sensors or neurotransmitter binding sites to the hydrophobic domains. The onset, duration, and fidelity of the electrical discharges are likely to be under considerable evolutionary pressure, and can be fine tuned by changes in amino acid sequences of the ion channels. Here, we show that a local region of the acetylcholine receptor ε subunit governs the fidelity of channel gating.
Ion channels are thought to open and close by switching among a small number of discrete states with rate constants invariant in time. Such a discrete state Markov description of ion channel function has received considerable support by kinetic studies over the past two decades (Korn and Horn 1988; McManus et al. 1988; Sine et al. 1990). Evolution has presumably fine tuned ion channels so free energy barriers between states confer rapid or slow opening and closing, depending on physiological requirements. However, the concept of a small number of free energy barriers with fixed heights contrasts with the prevailing concept that the protein free energy landscape is corrugated and dynamically fluctuating (Leeson and Wiersma 1995; Frauenfelder and Leeson 1998). The analysis described here supports the discrete state Markov view of ion channel function, but incorporates dynamics of a corrugated energy landscape to account for episode-to-episode changes in activation kinetics.
Episode-to-episode changes in channel kinetics have been described for a wide variety of ion channels. Nonuniform kinetics were evident when comparing sequences of closely spaced events from one channel with temporally distinct sequences from another (Sine and Steinbach 1987; Weiss and Magleby 1990; Bowlby and Levitan 1996). Additionally, abrupt changes in kinetics have been detected within a series of events from the same channel (Auerbach and Lingle 1986; Gibb et al. 1990; Naranjo and Brehm 1993; Milone et al. 1998). Between these two extremes, a phenomenon termed “wanderlust” kinetics was described in which individual channels changed their kinetics seemingly at random, spanning a wide range in open probability (Silberberg et al. 1996). Here, we show that mutating only one amino acid in the acetylcholine receptor (AChR) transforms its activation kinetics from predominantly uniform to highly variable.
Previous studies of congenital myasthenic syndromes (CMS) identified structural and mechanistic defects of the AChR that underlie the disease. In many such cases, consequences of the mutation could be assigned to changes in a single microscopic rate constant or class of rate constants in a mechanistic description of AChR activation, providing new insights into structure–function relationships (Engel et al. 1998). The present study shows that the mutation εA411P causes a congenital myasthenic syndrome, but that the mutation affects AChR activation kinetics in a fundamentally new way. Unlike previous CMS cases, where individual activation episodes appeared kinetically uniform (Ohno et al. 1996; Wang et al. 1999), activation episodes from εA411P AChRs exhibit wide-ranging kinetics. Applying hidden Markov modeling analysis to activation episodes from individual mutant AChRs, we show that the wide-ranging kinetics owes to greatly increased variability of channel opening and closing rate constants of individual channels.
MATERIALS AND METHODS
Mutation Analysis
All 12 exons of the AChR ε subunit gene were sequenced using genomic DNA isolated from blood (Ohno et al. 1996). The εA411P mutation results in gain of an AvaI restriction site; therefore, εA411P was tracked in family members by AvaI restriction analysis of PCR products. ε1293insG and εT159P were tracked in family members by allele-specific PCR. Allele-specific PCR was used to screen for the three mutations in 200 normal alleles.
Construction and Expression of Mutant AChRs
Human AChR subunit cDNAs were subcloned into the CMV-based expression vector pRBG4 (Lee et al. 1991). Mutations were constructed using the QuickChange mutagenesis kit (Stratagene). The presence of the desired mutation and the absence of unwanted mutations was confirmed by dideoxy sequencing. Human embryonic kidney fibroblasts (293HEK) were transfected with mutant or wild-type AChR subunit cDNAs using calcium phosphate precipitation as described (Bouzat et al. 1994). Some experiments used BOSC cells (Pear et al. 1993), a variant of the 293HEK cell line.
Surface expression of pentameric AChR in transfected HEK cells was determined with 125I-labeled α-bungarotoxin (α-bgt) (Ohno et al. 1996). Equilibrium binding of ACh by the expressed receptors was measured by competition against the initial rate of 125I-α-bgt binding (Ohno et al. 1996).
Patch-Clamp Recordings
Recordings were obtained in the cell-attached configuration at a membrane potential of −70 mV and a temperature of 22°C (Wang et al. 1999). Extracellular and pipette solutions contained (mM): 142 KCl, 5.4 NaCl, 1.8 CaCl2, 1.7 MgCl2, 10 HEPES, pH 7.4. Single-channel currents were recorded using an Axopatch 200B amplifier and sampled at 1-μs intervals using a PCI-6111E fast data acquisition board (National Instruments) interfaced with a Dell Precision 410 workstation running the program Acquire (Bruxton Corp.). For channel open probability determinations, data were filtered at a final bandwidth of 10 kHz, and channel events were detected by the 50% threshold crossing method using TAC software (Bruxton Corp.).
Hidden Markov Modeling Analysis
We used hidden Markov modeling (HMM) to analyze the kinetics of clusters of closely spaced openings due to individual AChR channels. Recordings were initially viewed at 10 kHz bandwidth to identify clusters of events from individual channels, and the corresponding unfiltered segments were selected for analysis. Individual clusters were identified using a critical closed duration that averaged 5 ms. This closed duration was determined from closed-time histograms as the point of intersection of the predominant closed dwell-time component with the succeeding closed time component (Wang et al. 1999).
HMM analysis was carried out using the method developed by Venkataramanan et al. 1998a, Venkataramanan et al. 1998b, which is incorporated into TAC 4.0.10 software (Bruxton Corp.). In brief, the method entails inverse filtering the signal to remove the effects of the patch-clamp amplifier and its associated anti-aliasing filter, decimating the digitized signal to reduce high frequency noise, and analyzing the resulting signal using an extension of the forward–-backward and Baum-Welch re-estimation algorithms (Venkataramanan et al. 1998a, Venkataramanan et al. 1998b). The resulting HMM output yields the most likely sequence of channel opening and closing events and the set of most likely rate constants in a kinetic description of the receptor activation processes.
Inverse filtering was achieved by passing a triangle wave into the speed test input of the patch clamp amplifier (Axopatch 200B; Axon Instruments, Inc.), recording the resulting step response at the amplifier output, and averaging several thousand step responses (Fig. 1 A). The inverse filter then used the averaged system step response and the theoretical step response to produce a digital moving average filter with defined coefficients that reconstructed the original unfiltered signal (Venkataramanan 1998). The power spectrum of noise recorded from a quiescent patch of membrane increases as (frequency)2 up to 100 kHz, but thereafter rolls off gradually and is punctuated by several high frequency spikes (Fig. 1 B). After inverse filtering and decimating to achieve an effective bandwidth of 100 kHz (Venkataramanan 1998), the noise spectral density again increases as (frequency)2, but rolls off sharply beyond ∼60 kHz.
Figure 1.

System step response and power spectra of baseline current from a channel-free segment of a recording. (A) The system step response is the average of 4,000 responses and is sampled at 0.2-μs intervals. (B) The unfiltered spectrum is in gray, and the inverse-filtered spectrum is in black; the inverse-filtered signal was decimated to produce an effective bandwidth of 100 kHz.
The HMM analysis of Venkataramanan et al. 1998a,Venkataramanan et al. 1998b models the signal from a patch clamp recording as the sum of correlated background noise and a discrete state Markov model. The correlated noise is modeled as the output of an autoregressive filter with Gaussian white noise as the input. The autoregressive filter contains a user-defined number of autoregressive coefficients to simulate correlated noise found in patch-clamp recordings. We used the following discrete-state Markov model for HMM analysis:
where two agonists (A) associate with the receptor (R) with the effective rate constant k+ and dissociate with the effective rate constant k−. Doubly occupied receptors (A2R) open with rate constant β, and open receptors (A2R*) close with rate constant α. Our analysis assumed zero conductance for all closed states and a single conductance for the open state. Because Fig. 1 is a simplified version of the standard description of AChR activation, we simulated data according to the standard kinetic description (Fig. 2) and applied HMM analysis assuming Fig. 1 (). Fig. 2 specifies two agonist binding steps, opening and closing of singly liganded receptors (β′ and α′), and channel block by agonist (k+B and k−B).
Scheme S1.

Scheme S2.

RESULTS
Molecular Genetics and Expression of Mutant AChR
We detected the εA411P (ε1231G→C) mutation in four myasthenic patients in three unrelated families. The mutation is located in the cytoplasmic domain known as the amphipathic helix (Finer-Moore and Stroud 1984), which spans between the M3 and M4 transmembrane domains. Each patient has had moderately severe symptoms since infancy involving weakness of ocular, facial, and limb muscles, a decremental electromyographic response, negative tests for anti–AChR antibodies, and responds partially to cholinesterase inhibitors. In family 1, two affected siblings are homozygous for εA411P (Fig. 2 A). In families 2 and 3, the affected patients are heterozygous for εA411P plus a second mutation, either ε1293insG or εT159P (ε475A→C) (Fig. 2B and Fig. C). ε1293insG is a previously characterized null mutation (Engel et al. 1996). None of the mutations was detected in 200 normal alleles. Thus, in each kinship, unaffected parents carry one mutant allele; unaffected siblings carry either one or no mutant allele.
Figure 2.
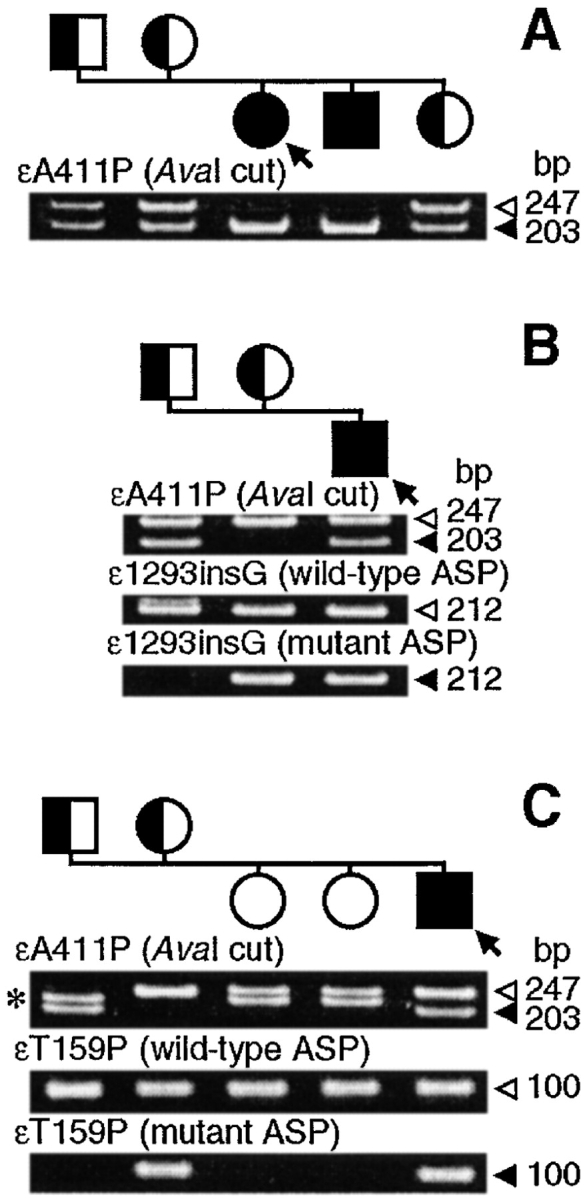
AvaI restriction analysis for εA411P and allele-specific PCR (ASP) for ε1293insG and εT159P of genomic DNA of propositi (arrows) and family members. (A–C) Families 1–3. Closed and open arrowheads point to mutant and wild-type fragments, respectively. Closed symbols indicate affected individuals carrying two mutant alleles; half-shaded symbols represent asymptomatic carriers harboring a single mutant allele. (C) The short fragments (*) represent the previously described εIVS11+10del20 polymorphism in intron 11 of the ε subunit gene, which has an allelic frequency of 22/248.
After transfection of 293HEK fibroblasts with the εA411P mutant and wild-type α, β, and δ subunit cDNAs, surface expression was reduced to 31.0 ± 10.9% (mean ± SD, n = 3) of wild-type. ACh binding to εA411P-AChR, determined by competition against 125I-labeled α-bgt binding, was indistinguishable from that of wild-type AChR. Parallel experiments using the εT159P mutant revealed reduced surface expression of 29.3 ± 11.1% (n = 4) of wild-type, but ACh binding was like that observed with α, β, and δ subunits alone, indicating that all of the α-bgt binding was due to α2βδ2 pentamers, which are predominantly desensitized (Ohno et al. 1996). Thus, in each kinship, εA411P, although recessive, determines the phenotype.
Consequences of εA411P for AChR Activation
To delineate mechanistic consequences of εA411P, we incorporated the mutant subunit into receptors containing normal α, β, and δ subunits in 293HEK fibroblasts, and recorded currents through single AChR channels (Wang et al. 1999). We applied ACh at a concentration of 30 μM, which is high enough to cause clustering of current pulses from individual AChR channels, but is low enough to minimize channel block by ACh (Ohno et al. 1996). Current pulses through individual wild-type AChRs appear stochastically distributed but kinetically uniform, whereas current pulses through εA411P AChRs exhibit a striking range of current kinetics (Fig. 3). Histograms of single channel open probability, computed for individual clusters, show a narrow distribution for wild-type AChRs, but show a much broader distribution for receptors containing εA411P, extending over nearly the entire range of open probability (Fig. 3).
Figure 3.

The εA411P mutation increases the range of open probabilities of individual AChR activation episodes. Each trace is from a single cluster of activation episodes elicited by 30 μM ACh for wild-type or εA411P AChRs. The left-hand edge of each trace is the start of the cluster. Corresponding histograms of open probability for all activation episodes in these two recordings are shown below. Traces are displayed at 10 kHz bandwidth.
Kinetic Steps Altered by εA411P
We next asked which steps in receptor activation, agonist binding or channel gating, are responsible for the wide range of open probabilities produced by εA411P. Because each episode of channel activity has its own kinetic signature, we sought an analysis method that could delineate activation rate constants from short segments of data. The standard interval likelihood analysis requires pooling of multiple clusters of activation episodes, and produces rate constants averaged over all the data (Qin et al. 1996). We therefore tested a recently developed method of kinetic analysis, hidden Markov modeling, to determine activation kinetics of individual AChR activation episodes (Venkataramanan 1998; Venkataramanan et al. 1998a,Venkataramanan et al. 1998b). HMM was originally designed for analysis of data with a low signal-to-noise ratio, thus allowing increased bandwidth and detection of very brief current pulses (Chung et al. 1990).
We applied HMM analysis to segments of data originating from individual activation episodes for both wild-type and mutant receptors. ACh was applied at a concentration of 30 μM, a concentration that minimizes channel block by ACh and singly liganded openings, and single-channel currents were acquired at a sampling frequency of 1 MHz. We identified data segments containing activity of only one channel, inverse-filtered them to produce an effective bandwidth of 100 kHz, and analyzed each segment by HMM, assuming Fig. 1 as the Markov model (see materials and methods).
Applied to a single AChR activation episode, HMM analysis produces both an idealized sequence of channel opening and closing events and a set of rate constants in Fig. 1. Comparison of the idealized event sequence with the same recording filtered at our standard bandwidth of 10 kHz reveals close correspondence between idealized and recorded current pulses (compare Fig. 4, middle with bottom). Moreover, HMM resolves additional brief current pulses owing to the increased bandwidth of 100 kHz.
Figure 4.

HMM analysis of individual activation episodes for wild-type and εA411P AChRs. (Top) Filtered at 100 kHz bandwidth (see materials and methods); (bottom) the same record filtered at 10 kHz bandwidth; (middle) the most likely current pulse sequences determined by HMM. For εA411P, a particularly low open probability cluster is illustrated.
We then constructed histograms of the fitted rate constants, depositing one entry from each activation episode into the appropriate bin of the corresponding rate-constant histogram. When plotted on a logarithmic abscissa, each rate constant distributes as a Gaussian function for both wild-type and εA411P AChRs (Fig. 5). Remarkably, εA411P greatly expands the distributions for channel opening and closing rate constants (β and α), but does not affect the distributions for agonist binding rate constants (k+ and k−) (Fig. 5; Table ).
Figure 5.

Distribution of activation rate constants for individual activation episodes. For each rate constant histogram, one entry corresponds to the most likely Fig. 1 rate constant for an individual episode of channel activity. The bell-shaped curves are fitted Gaussian distributions, with fitted parameters given in Table . Data are from single patches, with 304 clusters for wild-type, 434 for εA411P, and 50 for simulated data. Note that in simulated data the distributions for gating steps (α and β) are slightly narrower than distributions from wild type AChRs, but are much narrower than distributions from εA411P AChRs (see Table ).
Table 1.
Summary of HMM Analyses for AChRs from Different Cell-attached Patches and for Simulated Data
| Wild type | n* | α | Log(α) | SD | β | Log(β) | SD | k+ | Log(k+) | SD | k− | Log(k−) | SD |
|---|---|---|---|---|---|---|---|---|---|---|---|---|---|
| 1 | 277 | 3548 | 3.55 | 0.08 | 66069 | 4.82 | 0.08 | 2455 | 3.39 | 0.15 | 17378 | 4.24 | 0.09 |
| 2 | 347 | 2455 | 3.39 | 0.12 | 69183 | 4.84 | 0.1 | 2512 | 3.4 | 0.16 | 14125 | 4.15 | 0.13 |
| 3 | 311 | 2951 | 3.47 | 0.11 | 64565 | 4.81 | 0.11 | 1778 | 3.25 | 0.11 | 17378 | 4.24 | 0.13 |
| 4 | 341 | 3631 | 3.56 | 0.09 | 67608 | 4.83 | 0.1 | 2399 | 3.38 | 0.09 | 16596 | 4.22 | 0.12 |
| 5 | 304 | 3548 | 3.55 | 0.08 | 83176 | 4.92 | 0.06 | 2138 | 3.33 | 0.09 | 16218 | 4.21 | 0.11 |
| 6 | 211 | 3631 | 3.56 | 0.07 | 70795 | 4.85 | 0.06 | 2042 | 3.31 | 0.06 | 21878 | 4.34 | 0.07 |
| Average | 3294 | 3.51 | 0.09 | 70233 | 4.85 | 0.09 | 2221 | 3.34 | 0.11 | 17262 | 4.23 | 0.11 | |
| εA411P | |||||||||||||
| 1 | 399 | 4365 | 3.64 | 0.13 | 81283 | 4.91 | 0.11 | 2239 | 3.35 | 0.12 | 20417 | 4.31 | 0.11 |
| 2 | 144 | 3981 | 3.6 | 0.08 | 77625 | 4.89 | 0.11 | 1995 | 3.3 | 0.09 | 16982 | 4.23 | 0.1 |
| 3 | 156 | 4571 | 3.66 | 0.14 | 47863 | 4.68 | 0.12 | 2455 | 3.39 | 0.11 | 26303 | 4.42 | 0.12 |
| 4 | 65 | 4467 | 3.65 | 0.22 | 67608 | 4.83 | 0.15 | 1995 | 3.3 | 0.12 | 22387 | 4.35 | 0.18 |
| 5 | 99 | 3631 | 3.56 | 0.11 | 66069 | 4.82 | 0.13 | 1622 | 3.21 | 0.1 | 21878 | 4.34 | 0.09 |
| 6 | 126 | 3467 | 3.54 | 0.15 | 53703 | 4.73 | 0.15 | 2512 | 3.4 | 0.15 | 12303 | 4.09 | 0.2 |
| 7 | 84 | 3981 | 3.6 | 0.16 | 66069 | 4.82 | 0.11 | 1905 | 3.28 | 0.11 | 16982 | 4.23 | 0.19 |
| 8 | 434 | 5370 | 3.73 | 0.16 | 85114 | 4.93 | 0.16 | 1445 | 3.16 | 0.11 | 25119 | 4.4 | 0.12 |
| Average | 4229 | 3.62 | 0.14 | 68167 | 4.83 | 0.13 | 2021 | 3.30 | 0.11 | 20296 | 4.30 | 0.14 | |
| Simluation model | Status | ||||||||||||
| Fig. 1 | Simulation | 4500 | 3.65 | — | 100000 | 5.00 | — | 2000 | 3.30 | — | 17000 | 4.23 | — |
| HMM fit | 3311 | 3.52 | 0.06 | 69183 | 4.84 | 0.05 | 2291 | 3.36 | 0.08 | 18197 | 4.26 | 0.09 | |
| Fig. 2 | Simulation | 1800 | 3.26 | — | 47000 | 4.67 | — | 3600 | 3.56 | — | 17000 | 4.23 | — |
| HMM fit | 2042 | 3.31 | 0.06 | 46774 | 4.67 | 0.08 | 1905 | 3.28 | 0.12 | 14791 | 4.17 | 0.16 | |
| Fig. 2 | Simulation | 3300 | 3.52 | — | 85000 | 4.93 | — | 3600 | 3.56 | — | 21000 | 4.32 | — |
| HMM fit | 3467 | 3.54 | 0.06 | 66069 | 4.82 | 0.05 | 1862 | 3.27 | 0.13 | 15849 | 4.2 | 0.09 |
For each patch containing either wild-type or mutant AChR (left), the number of clusters of activation episodes is given, along with the HMM-fitted rate constants, the logarithm of the rate constants and the standard deviation of the Gaussian fit to the logarithmically transformed rate constant distributions (see Fig. 5). Simulated data (100 clusters each) were generated as described in the and analyzed by HMM. For Fig. 2, simulation parameters were from Wang et al. 1999. *Number of clusters.
Mean values for channel closing and agonist association and dissociation rate constants are slightly affected by εA411P, but the mean of the channel opening rate constant is not affected (Fig. 5; Table ). Changes in mean values of the rate constants are relatively small compared with the greatly expanded distributions of the channel gating rate constants.
Analysis of Simulated Data by HMM
The observed Gaussian distributions of the rate constants could potentially result from the stochastic nature of single-channel data. We therefore simulated idealized channel events using a single value for each rate constant in Fig. 1 (Clay and DeFelice 1983), superimposed baseline noise from our recording apparatus, and analyzed the data by HMM (see ). We also accounted for the stochastic variation in the number of channel events per cluster by incorporating into Fig. 1 a desensitization step with an appropriate onset rate constant. HMM analysis of simulated data again reveals a Gaussian distribution for each rate constant (Fig. 5), even though single values were used in the simulation, reflecting the degree of variability inherent in HMM applied to stochastically distributed data. For channel opening and closing rate constants, the distributions for simulated data are slightly narrower than observed for wild-type AChR, indicating that the gating of individual wild-type AChRs shows slightly greater variability than expected for discrete values of the rate constants (Fig. 5; Table ). On the other hand, the distributions for simulated data are much narrower than observed for individual εA411P AChRs (Fig. 5; Table ), indicating a greatly expanded range for each gating rate constant. We also simulated data according to Fig. 2, which includes two sequential agonist binding steps, singly liganded openings and channel block by ACh. Assuming the simplified Fig. 1 in the HMM analysis, the distributions of the gating rate constants were again much narrower than observed for individual εA411P AChRs (Table ), indicating that omission of kinetic steps in Fig. 1 does not contribute to variability in gating rate constants. Thus, individual εA411P AChRs open and close at rates that are not fixed, but vary over a greatly expanded range.
Effect of Cluster Duration on Rate Constant Distributions
The number of openings in a cluster of channel events varies because each cluster terminates by stochastic entry into a desensitized state. Because the precision of the rate constants estimated by HMM increases with the number of events analyzed, variation in cluster duration could potentially contribute to the observed Gaussian distribution of the gating rate constants. We therefore compared cluster durations for wild-type and mutant AChRs. Approximately exponential distributions of cluster durations are observed for both wild type and εA411P AChRs, and the mean cluster durations differ only slightly for the two types of AChRs (Fig. 6). Cluster durations for our simulated data also distribute exponentially with a mean approximating that of the mutant AChR. Thus, the stochastic variation of cluster duration does not contribute to the expanded distributions of gating rate constants produced by εA411P.
Figure 6.
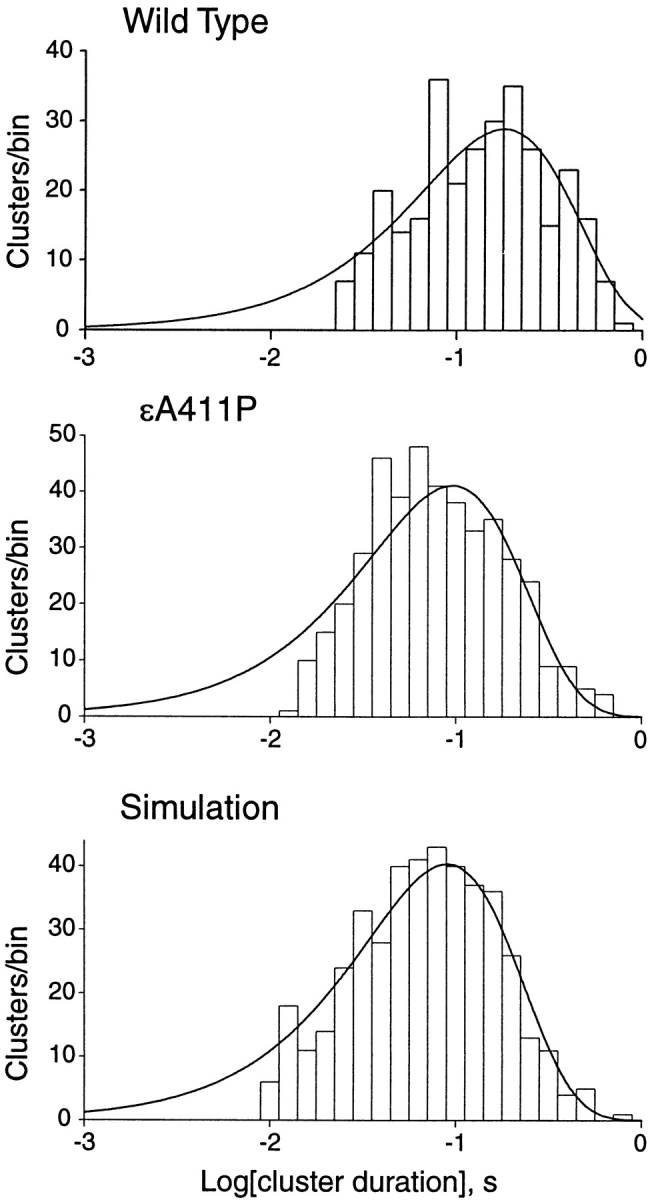
Distribution of cluster durations for wild-type and εA411P AChRs, and for simulated data. The smooth curves are fitted single exponentials.
Individual AChRs Activate in More than One Kinetic Mode
Although our recordings monitor current flow through one channel at any given time, a typical cell-attached patch of membrane contains multiple channels. We therefore asked whether each of the multiple receptors in a patch of membrane activates with intrinsically different kinetics, or whether an individual receptor can switch among different kinetic modes. Applying our previously described mode-switching detection method (Milone et al. 1998), we examined clusters of single-channel current pulses, looking for switches from one kinetic mode to another. The detection method imposes upon the sequence of openings and closings two consecutive 10-event windows, computes a function describing the kinetics in each window, and divides the function in the first window with that in the second. We call the resulting quantity the relative window mean, which reveals abrupt changes at the precise point of the mode switch for both wild-type and εA411P AChRs (Fig. 7). Additionally, open probability plotted for consecutive 10-event windows changes near the time of the mode switch (Fig. 7). Mode switches were infrequent, with 17 mode switches detected in 1,294 clusters for εA411P AChR (1.3%) and 40 mode switches in 2,077 clusters for wild-type AChR (1.9%). Although mode switches occurred at similar frequencies in wild-type and εA411P AChRs, detection of mode switches is contrast dependent, so the observed frequencies represent lower-limit values. Thus, switching among kinetic modes is a normal process within individual AChRs, the range of which is minimized by structures built into the wild-type AChR.
Figure 7.

Abrupt kinetic switches occur within individual AChR activation episodes. Each trace is an individual activation episode from either wild-type or εA411P AChR. The graphs below plot open probability for groups of 10 openings plus 10 closings across the activation episode. The lower graphs plot the relative window mean (RWM) computed for consecutive 10-event windows across the activation episode (Milone et al. 1998): RWM = {log[(τopenwindow1 × τclosedwindow2)/τopenwindow2 × τclosedwindow1]}2. The peak in the RWM plot reveals the time of the mode switch (vertical dashed lines).
Structural Specificity of εA411P
We next asked whether the increased kinetic variability is unique to mutations in the ε subunit, and further whether it is unique to mutation of alanine 411. We engineered proline into positions equivalent to εA411 in the homologous α, β, and δ subunits, as well as into positions 409–413 of the ε subunit, and recorded single channel currents through individual mutant AChRs. Corresponding mutations in either β or δ subunits do not affect the distribution of open probabilities (Fig. 8 A), while the mutated α subunit does not support expression of AChR, as indicated by lack of ACh-induced single-channel currents. On the other hand, proline mutations scanning this region of the ε subunit, εF409P, εV410P, εE412P, and εS413P, all broaden the distribution of open probabilities similar to the original εA411P mutation (Fig. 8 B). Thus, increased kinetic variability of the AChR is specific to mutations of the ε subunit, where the local region flanking alanine 411 maintains uniformity of AChR activation kinetics.
Figure 8.

Distribution of open probabilities from individual activation episodes for AChRs containing the indicated mutations. (A) The absence of consequences when mutations are introduced into β and δ subunits at positions equivalent to εA411P. (B) Broadening of the open probability distributions for mutations introduced along a five-residue stretch of the amphipathic helix of the ε subunit.
DISCUSSION
This work illustrates how clinical medicine can lead to advances in basic science and, further, how the emerging insights can extend far beyond the original disorder. The present myasthenic syndrome stems from widely ranging kinetics of channel gating and reduced surface expression of the εA411P-AChR, together with failure of the second mutant allele in each patient to rescue a normal phenotype. The molecular defect caused by εA411P, an alanine-to-proline mutation, structurally disturbs the amphipathic helix of which it is part, specifically affecting rates of opening and closing of the channel. Although the M2 domain forming the ion permeation pathway is far away from εA411 in the linear sequence, it may be physically close to the amphipathic helix in the three-dimensional structure (Miyazawa et al. 1999). The kinetic defect is clearly revealed using HMM analysis to compare the gating kinetics of one channel with those of another. The end result is establishment of a greatly increased number of kinetic modes accessed by the εA411P AChR.
The εA411P mutation is the most likely cause of myasthenia in these patients for several reasons. Myasthenia is present in patients homozygous for εA411P, or in heterozygotes with a second null mutation, but heterozygotes with a second normal ε allele are without symptoms; the normal ε allele therefore compensates for the mutant allele, indicating that εA411P is recessive. The reduced expression of εA411P-AChR may be sufficient by itself to cause myasthenia (Engel et al. 1996, Engel et al. 1998; Ohno et al. 1996), but the myasthenia is likely exacerbated by the kinetic defect. As the kinetic defect causes relatively small changes in mean rate constants for channel gating, the most likely way the kinetic defect could impair neuromuscular transmission would be if a kinetic mode with low open probability predominated at the patient endplates. Biopsy material was not available to investigate AChR function in patient endplates. Nonetheless, the observed kinetic instability caused by εA411P establishes an important locus for regulating kinetic uniformity of AChR channel gating.
The amphipathic helix, positioned on the cytoplasmic side of the membrane preceding the M4 transmembrane domain, was first highlighted by Fourier analysis of residue hydrophobicity as a function of sequence of Torpedo AChR subunits, combined with secondary structure analysis (Finer-Moore and Stroud 1984). The predicted amphipathic helix contains a hydrophobic surface running along its length, with much of the remaining surface containing positively and negatively charged residues. The putative helix extends from residues 376 to 435 of the homologous human ε subunit, and therefore is predicted to encompass the εA411P mutation. A more recent secondary structure prediction divides the original amphipathic helix into two α-helices, G and H, placing εA411 within helix G (Le Novere et al. 1999). Proline mutations inserted into helix G presumably disrupt its helical structure, in turn disrupting its interaction with neighboring cytoplasmic or transmembrane domains of the same or adjacent subunits.
Previous mutagenesis studies have implicated the amphipathic helix in contributing to AChR gating kinetics. Using chimeras of γ and ε subunits, Bouzat et al. 1994 found that sequence differences in the amphipathic helix confer about half of the fetal-to-adult kinetic switch in which channel open time changes from long to brief. Extensive mutagenesis of the amphipathic helix indicated that several residues in this region interact to confer the kinetic switch. Analysis of a congenital myasthenic syndrome revealed a duplication of six residues in the amphipathic helix (residues 413–418 of the human ε subunit) that caused mode-switching kinetics, which was readily detectable within clusters of events from individual channels (Milone et al. 1998). Thus the overall findings indicate that the amphipathic helix is an important structure for determining AChR gating kinetics.
The present results show that structurally perturbing the amphipathic helix causes AChR channel opening and closing kinetics to vary over a greatly increased range. Proline mutations alter gating kinetics only when they are placed in the ε subunit, which is uniquely present in the adult AChR. Altered kinetics also result when proline is placed one at a time in positions flanking εA411. As proline is expected to disrupt an α helix, our results strongly suggest that uniform channel gating kinetics depend upon a helical structure encompassing at least residues 409–413 of the ε subunit. Within the three-dimensional structure of the AChR, εA411 is most likely located in one of the five rod-like structures protruding from each subunit to form an inverted pentagonal cone extending into the cytoplasm (Miyazawa et al. 1999). Global consequences of the mutations are likely mediated through contacts in this pentagonal cone structure, although the reason for the unique specificity of the ε subunit remains unknown. Our findings suggest that the pentagonal cone stabilizes the global structure of the AChR, thus minimizing the kinetic range for channel gating.
Our findings suggest the following physical picture to account for episode-to-episode variation in channel gating kinetics. Opening and closing of the AChR channel are all or nothing global phenomena in which all five AChR subunits rotate back and forth in a concerted manner. For short periods of time, on the order of hundreds of milliseconds, the free energy barrier separating open and closed states does not change, producing kinetically uniform gating events within clusters of activation episodes from individual channels. However on an atomic scale, the protein is in constant motion, causing particular side chains or entire secondary structures to flip between stable configurations. These structural transitions, while not directly involving the gating machinery, change the global energetics of the AChR, incrementing activation energy for gating transitions up or down. To illustrate how this mechanism could broaden the distribution of gating rate constants, imagine that the AChR has two gating-control elements that flip at low frequency between two positions, called + and −, and that each flipping event changes activation energy for gating by the same amount. The three possible energy states of these elements are: ++ (enhancing gating), −− (impeding gating), and +− or −+ (neutral to gating). Probabilities of these states are predicted to follow a binomial distribution, akin to the Gaussian distribution of rate constants observed experimentally. More than two gating-control elements per receptor, or more configurations per element, would broaden the distribution. The wild-type AChR minimizes transitions of these gating-control elements, perhaps through evolution-driven changes in stabilizing structures such as the amphipathic helix.
Functional consequences of εA411P can also be viewed in terms of the energy landscape of the AChR. A protein's energy landscape is defined as potential energy as a function of the coordinates of all the atoms. Different stable conformations of the protein correspond to low points in the energy landscape, and reflect the number of structural degrees of freedom, which even for small proteins is expected to be very large. Energy landscapes have been classified into broad topological categories such as funnel-shaped with high barriers, funnel-shaped with low barriers, and flat with many similar-sized barriers (Frauenfelder and Leeson 1998). The energy landscape has been computed for small proteins, such as crambin (Garcia et al. 1997), but not for proteins as large as the AChR.
Our kinetic results suggest that the energy landscape of the AChR is shaped like a funnel, with corrugations running perpendicular to the long axis of the funnel. Each doubly liganded open or closed state corresponds to one such funnel, and transitions between open and closed states correspond to hops from one funnel to another. Evidence for an overall funnel-shaped landscape is the single mean value obtained for each gating rate constant for wild-type and εA411P AChRs, while evidence for corrugations in the funnel is the slow switching among a range of kinetic modes. For wild-type AChR, the kinetic range departs only slightly from that of a single kinetic mode, but our detection of infrequent mode switches shows that it can access multiple modes; these observations indicate a corrugated energy landscape superimposed upon a very steeply sloped funnel. For the εA411P AChR, on the other hand, the range and number of kinetic modes is greatly increased compared with the predominant single mode of wild-type AChR, and infrequent mode switches are detected. These observations indicate a corrugated energy landscape superimposed upon a much shallower funnel, accounting for the wide range of kinetic modes accessible to the εA411P AChR. The corrugations of the funnel correspond to the large energy barriers separating kinetic modes; these barriers are on the order of 30 kcal/mol, given an approximate mode-switching rate of 1 s−1 for wild-type and εA411P AChRs, and are much larger than the energy barriers governing channel gating. The overall results suggest that εA411P primarily diminishes the incline of the overall funnel-shaped energy landscape, while retaining the large energy barriers between stable states.
Other types of ion channels may potentially access multiple kinetic modes, as observed for the muscle AChR, and this may explain the nonuniform kinetics observed for many ion channels (Auerbach and Lingle 1986; Bowlby and Levitan 1996; Sine and Steinbach 1987; Gibb et al. 1990; Weiss and Magleby 1990; Naranjo and Brehm 1993; Milone et al. 1998). An allosteric protein's need to sharply define its free energy landscape may not be unique to ion channels, suggesting that kinetic stabilizing structures in other types of proteins await discovery. Deviation from evolution's carefully honed free energy landscape may be the basis for a new category of disease mechanism.
Acknowledgments
We thank Dan and Lin Ci Brown and Lalitha Venkataramanan for help implementing HMM analysis.
This work was supported by National Institutes of Health grants to S.M. Sine (NS31744) and A.G. Engel (NS6277), and a research grant from the Muscular Dystrophy Association to A.G. Engel.
Kinetic Simulations
We tested the HMM analysis method of Venkataramanan et al. 1998a,Venkataramanan et al. 1998b by simulating single channel currents according to discrete state Markov models, using either 1 or 2. Stochastically distributed dwell times were generated according to the relationship, t = −ln(RND)/k, where t is the dwell time, k is the sum of all rate constants leading away from the state in question, and RND is a random number between zero and one (Clay and DeFelice 1983). To produce episodes of channel opening and closing events with stochastically distributed durations, we added a desensitized state connected to the open state (A2R*) in 1 or 2. We chose the rate constant for entry into the desensitized state so that durations of the simulated activation episodes mimicked those of εA411P AChRs (6). After constructing idealized current pulses and sampling them at 1-μs intervals, we applied the rise time of our recording system to each opening and closing transition (1), and then added baseline noise recorded from a quiescent patch of membrane (9). Simulated data were inverse filtered and decimated to produce an effective bandwidth of 100 kHz before HMM analysis.
Figure 9.

Overview of HMM analysis applied to simulated data. Idealized channel events are generated using Fig. 1 (top, left), and the intervals digitized (1 MHz); the system step response is added to each conductance transition, noise from a quiescent segment of recording is added, the signal is inverse filtered and decimated to produce an effective bandwidth of 100 kHz, and HMM detects conductance transitions and produces a set of fitted Fig. 1 rate constants (k+′, k−′, β′, α′) that is compared with the input values.
We determined the optimal number of autoregressive coefficients (AR coefficients) used in HMM analysis by simulating data according to 1, together with rate constants that mimicked the kinetics of wild-type AChRs, and then varying the number of AR coefficients in the HMM analysis. Increasing the number of AR coefficients gave progressively better agreement between simulated and fitted rate constants (). However, for practical analysis of real data, the number of AR coefficients could not be increased beyond four; with four AR coefficients, analysis of data from one membrane patch required 4 d of computer time and, with each increment in AR coefficients, the computer time doubled.
Table 2.
Effect of Increasing the Number of Autoregression Coefficients in HMM Fitting
| n* | k+ | k− | β | α | |
|---|---|---|---|---|---|
| Simultation rates | 2000 | 17000 | 100000 | 4500 | |
| HMM fit | 2 | 2400 | 20000 | 51200 | 2300 |
| HMM fit | 3 | 2300 | 18500 | 57600 | 2700 |
| HMM fit | 4 | 2270 | 18700 | 63400 | 3020 |
| HMM fit | 5 | 2250 | 18200 | 66200 | 3200 |
| HMM fit | 6 | 2200 | 18100 | 67800 | 3300 |
| HMM fit, wild-type AChR | 4 | 2170 | 17040 | 68400 | 3200 |
| HMM fit, εA411P AChR | 4 | 1980 | 19540 | 64140 | 4040 |
The top row gives the Fig. 1 rate constants used to simulate data (see ), in units of s−1. All other rate constants are mean values from HMM fitting. For wild-type and εA411P AChRs, the fitted rate constants are mean values from one patch of membrane. *Number of autoregression coefficients.
We compared individual dwell times from the simulated data with those obtained by HMM analysis of the same data and found accurate detection of intervals longer than ∼5–8 μs. When a simulated event was briefer than this dead time, the brief event fused with adjacent events, and the detected event closely agreed with the composite-simulated event ().
Table 3.
Comparison of Simulated and HMM Detected Dwell Times
| Conductance level | Simulation duration | Composite duration | Fit duration | Conductance level | Simulation duration | Composite duration | Fit duration |
|---|---|---|---|---|---|---|---|
| 0 | 0.000143 | 0.000144 | 0 | 0.000763 | 0.000756 | ||
| 1 | 0.000070 | 0.000068 | 1 | 0.000103 | 0.000112 | ||
| 0 | 0.000023 | 0.000024 | 0 | 0.000028 | 0.000024 | ||
| 1 | 0.000543 | 1 | 0.000898 | 0.000896 | |||
| 0 | 0.000003* | 0 | 0.000237 | 0.000240 | |||
| 1 | 0.000038 | 0.000997 | 0.000996 | 1 | 0.000972 | 0.000968 | |
| 0 | 0.000005* | 0 | 0.000040 | 0.000040 | |||
| 1 | 0.000408 | 1 | 0.000557 | 0.000552 | |||
| 0 | 0.000020 | 0.000020 | 0 | 0.000458 | 0.000456 | ||
| 1 | 0.000316 | 0.000316 | 1 | 0.000086 | |||
| 0 | 0.000017 | 0.000016 | 0 | 0.000005* | 0.000469 | 0.000472 | |
| 1 | 0.000245 | 1 | 0.000378 | ||||
| 0 | 0.000006* | 0.000336 | 0.000336 | 0 | 0.000498 | 0.000500 | |
| 1 | 0.000085 | 1 | 0.000507 | ||||
| 0 | 0.000017 | 0.000016 | 0 | 0.000006* | 0.001423 | 0.001420 | |
| 1 | 0.000626 | 0.000628 | 1 | 0.000910 | |||
| 0 | 0.000012 | 0.000008 | 0 | 0.001479 | 0.001476 | ||
| 1 | 0.000304 | 1 | 0.000357 | 0.000360 | |||
| 0 | 0.000004* | 0.000652 | 0.000656 | 0 | 0.000011 | 0.000012 | |
| 1 | 0.000344 | 1 | 0.000110 | 0.000120 | |||
| 0 | 0.000020 | 0.000024 | 0 | 0.000008 | 0.000008 | ||
| 1 | 0.000667 | 1 | 0.000034 | 0.000028 | |||
| 0 | 0.000003* | 0.0001748 | 0.001748 | 0 | 0.000137 | 0.000128 | |
| 1 | 0.001078 | 1 | 0.000245 | 0.000248 |
Consecutive dwell times were simulated as described in , and results from HMM analysis are given for comparison. Simulation rate constants were in units of s−: k+ = 2,000, k− = 17,000, β = 100,000, α = 4,500. Conductance level 0 is the closed state of the channel, and level 1 is the open state. Bold numbers indicate individual events that fuse to form composite events due to intervening brief events. *Undetected brief events.
Although the present study was designed to document variability in rate constants underlying AChR activation, we also asked how accurately the rate constants were estimated. We simulated data according to three different kinetic schemes and analyzed the data using HMM, with 1 assumed as the Markov model. We first analyzed data simulated according to 1, using rate constants that yielded fitted values close to those obtained in our analysis of wild-type AChR data (). The results show that the simulation requires somewhat greater values of the gating rate constants to match those obtained for the wild-type AChR, suggesting that the channel might open as quickly as 100,000 s−1, and close as quickly as 4,500 s−1 (). Second, although we used ACh at a concentration that minimizes singly liganded openings and channel block by ACh, these processes might not be negligible. We therefore simulated data using 2, using our previously published activation rate constants for the human AChR determined by interval likelihood methods (Wang et al. 1999). The results show good agreement between simulated and fitted rate constants, indicating that the additional steps in 2 do not significantly contribute under our experimental conditions (). Finally, we simulated data according to 2, using rate constants that yielded the greater gating rate constants obtained in the present analysis of wild-type AChR data. The results show good agreement between simulated and fitted parameters for the channel closing rate constant, but suggest that the channel opening rate constant might be as great as 85,000 s−1 (). Further evidence for a rapid rate of channel opening is the fast relaxation of ionic currents obtained by rapid application of ACh to adult mouse AChRs (Maconochie and Steinbach 1998). The overall simulation results indicate that HMM yields accurate estimates for some rate constants, and lower limit estimates for very rapid rate constants.
Footnotes
Dr. Middleton's present address is Glaxo Wellcome Co., London, England UB6 0HE.
Abbreviations used in this paper: α-bgt, α-bungarotoxin; AChR, acetylcholine receptor; HMM, hidden Markov modeling.
References
- Auerbach A., Lingle C. Heterogeneous kinetic properties of acetylcholine receptor channels in Xenopus myocytes. J. Physiol. 1986;378:119–140. doi: 10.1113/jphysiol.1986.sp016211. [DOI] [PMC free article] [PubMed] [Google Scholar]
- Bouzat C., Bren N., Sine S.M. Structural basis of the different gating kinetics of fetal and adult acetylcholine receptors. Neuron. 1994;13:1395–1402. doi: 10.1016/0896-6273(94)90424-3. [DOI] [PubMed] [Google Scholar]
- Bowlby M., Levitan I. Kinetic variability and modulation of dslo, a cloned calcium-dependent potassium channel. Neuropharmacology. 1996;35:867–875. doi: 10.1016/0028-3908(96)00090-1. [DOI] [PubMed] [Google Scholar]
- Clay J., DeFelice L. Relationship between membrane excitability and single channel open-close kinetics. Biophys. J. 1983;42:151–157. doi: 10.1016/S0006-3495(83)84381-1. [DOI] [PMC free article] [PubMed] [Google Scholar]
- Chung S., Moore J., Xia L., Premkumar L., Gage P. Characterization of single channel currents using digital signal processing techniques based on hidden Markov models. Philos. Trans. R. Soc. Lond. B Biol. Sci. 1990;329:265–285. doi: 10.1098/rstb.1990.0170. [DOI] [PubMed] [Google Scholar]
- Engel A.G., Ohno K., Bouzat C., Sine S.M., Griggs R.C. End-plate acetylcholine receptor deficiency due to nonsense mutations in the ε subunit. Ann. Neurol. 1996;40:810–817. doi: 10.1002/ana.410400521. [DOI] [PubMed] [Google Scholar]
- Engel A., Ohno K., Wang H.-L., Milone M., Sine S.M. Molecular basis of congenital myasthenic syndromesmutations in the acetylcholine receptor. Neuroscientist. 1998;4:185–194. [Google Scholar]
- Finer-Moore J., Stroud R.M. Amphipathic analysis and possible formation of the ionic channel in an acetylcholine receptor. Proc. Natl. Acad. Sci. USA. 1984;81:155–159. doi: 10.1073/pnas.81.1.155. [DOI] [PMC free article] [PubMed] [Google Scholar]
- Frauenfelder H., Leeson D. The energy landscape in non-biological and biological molecules. Nat.Struct. Biol. 1998;5:757–759. doi: 10.1038/1784. [DOI] [PubMed] [Google Scholar]
- Garcia A., Blumenfeld R., Hummer G., Krumhansl J. Multi-basin dynamics of a protein in a crystal environment. Physica D. 1997;107:225–239. [Google Scholar]
- Gibb A., Kojima H., Carr J., Colquhoun D. Expression of cloned receptor subunits produces multiple receptors. Proc. R. Soc. Lond. B Biol. Sci. 1990;242:108–112. doi: 10.1098/rspb.1990.0112. [DOI] [PubMed] [Google Scholar]
- Korn S.J., Horn R. Statistical discrimination of fractal and Markov models of single- channel gating. Biophys. J. 1988;54:871–877. doi: 10.1016/S0006-3495(88)83023-6. [DOI] [PMC free article] [PubMed] [Google Scholar]
- Lee B.S., Gunn R.B., Kopito R.R. Functional differences among nonerythroid anion exchangers expressed in a transfected human cell line. J. Biol. Chem. 1991;266:11448–11454. [PubMed] [Google Scholar]
- Leeson D.T., Wiersma D.A. Looking into the energy landscape of myoglobin. Nat. Struct. Biol. 1995;2:848–851. doi: 10.1038/nsb1095-848. [DOI] [PubMed] [Google Scholar]
- Le Novere N., Corringer P.J., Changeux J.P. Improved secondary structure prediction for a nicotinic receptor subunitincorporation of solvent accessibility and experimental data into a two-dimensional representation. Biophys. J. 1999;76:2329–2345. doi: 10.1016/S0006-3495(99)77390-X. [DOI] [PMC free article] [PubMed] [Google Scholar]
- Maconochie D., Steinbach J.H. The channel opening rate of adult- and fetal-type of mouse muscle nicotinic receptors activated by acetylcholine. J. Physiol. 1998;506:53–72. doi: 10.1111/j.1469-7793.1998.053bx.x. [DOI] [PMC free article] [PubMed] [Google Scholar]
- McManus O.B., Weiss D.S., Spivak C.E., Blatz A.L., Magleby K.L. Fractal models are inadequate for the kinetics of four different ion channels. Biophys. J. 1988;54:859–870. doi: 10.1016/S0006-3495(88)83022-4. [DOI] [PMC free article] [PubMed] [Google Scholar]
- Milone M., Wang H.-L., Ohno K., Prince R., Fukudome T., Shen X.-M., Brengman J., Griggs R., Sine S.M., Engel A.G. Mode switching kinetics by a naturally occurring mutation in the cytoplasmic loop of the human acetylcholine receptor ε subunit. Neuron. 1998;20:575–588. doi: 10.1016/s0896-6273(00)80996-4. [DOI] [PubMed] [Google Scholar]
- Miyazawa A., Fujiyoshi Y., Stowell M., Unwin N. Nicotinic acetylcholine receptor at 4.6 A resolutiontransverse tunnels in the channel wall. J. Mol. Biol. 1999;288:765–786. doi: 10.1006/jmbi.1999.2721. [DOI] [PubMed] [Google Scholar]
- Naranjo D., Brehm P. Modal shifts in acetylcholine receptor channel gating confer subunit-dependent desensitization. Science. 1993;260:1811–1814. doi: 10.1126/science.8511590. [DOI] [PubMed] [Google Scholar]
- Ohno K., Wang H.-L., Milone M., Bren N., Brengman J.M., Nakano S., Quiram P., Pruitt J.N., Sine S.M., Engel A.G. Congenital myasthenic syndrome caused by decreased agonist binding affinity due to a mutation in the acetylcholine receptor ε subunit. Neuron. 1996;17:157–170. doi: 10.1016/s0896-6273(00)80289-5. [DOI] [PubMed] [Google Scholar]
- Pear W.S., Nolan G.P., Scott M.L., Baltimore D. Production of high-titer helper-free retroviruses by transient transfection. Proc. Natl. Acad. Sci. 1993;USA. 90:8392–8396. doi: 10.1073/pnas.90.18.8392. [DOI] [PMC free article] [PubMed] [Google Scholar]
- Qin F., Auerbach A., Sachs F. Estimating single-channel kinetic parameters from idealized patch clamp data containing missed events. Biophys. J. 1996;70:264–280. doi: 10.1016/S0006-3495(96)79568-1. [DOI] [PMC free article] [PubMed] [Google Scholar]
- Silberberg S., Lagrutta A., Adelman J., Magleby K. Wanderlust kinetics and variable Ca2+-sensitivity of Drosophila, a large conductance Ca2+-activated K+ channel expressed in oocytes. Biophys. J. 1996;70:2640–2651. doi: 10.1016/S0006-3495(96)79833-8. [DOI] [PMC free article] [PubMed] [Google Scholar]
- Sine S.M., Steinbach J.H. Activation of acetylcholine receptors by high concentrations of agonist. J. Physiol. 1987;385:325–359. doi: 10.1113/jphysiol.1987.sp016496. [DOI] [PMC free article] [PubMed] [Google Scholar]
- Sine S.M., Claudio T., Sigworth F.J. Activation of Torpedo acetylcholine receptors expressed in mouse fibroblastssingle channel current kinetics reveal distinct agonist binding affinities. J. Gen. Physiol. 1990;96:395–437. doi: 10.1085/jgp.96.2.395. [DOI] [PMC free article] [PubMed] [Google Scholar]
- Venkataramanan L., Walsh J.L., Kuc R., Sigworth F.J. Identification of hidden Markov models for ion channel currents. Part Icolored background noise IEEE (Inst. Electr. Electron. Eng.) Trans. Biomed. Eng 46 1998. 1901 1915a [Google Scholar]
- Venkataramanan L., Kuc R., Sigworth F.J. Identification of hidden Markov models for ion channel currents Part II: state-dependent excess noise. IEEEInst. Electr. Electron. Eng. Trans. Biomed. Eng1998. 46:1916 1929b [Google Scholar]
- Venkataramanan L. Hidden Markov modeling of ion channel currents. Ph.D. Dissertation. Yale University; New Haven, CT: 1998. [Google Scholar]
- Wang H.-L., Milone M., Ohno K., Shen X.-M., Tsujino A., Paola A., Tonali P., Brengman J., Engel A.G., Sine S.M. Acetylcholine receptor M3 domainstereochemical and volume contributions to channel gating. Nat. Neurosci. 1999;2:226–233. doi: 10.1038/6326. [DOI] [PubMed] [Google Scholar]
- Weiss D.S., Magleby K.L. Voltage dependence and stability of the gating kinetics of the fast chloride channel from rat skeletal muscle. J. Physiol. 1990;426:145–176. doi: 10.1113/jphysiol.1990.sp018131. [DOI] [PMC free article] [PubMed] [Google Scholar]