

Abstract
Insects detect sugars and amino acids by a specialized taste cell, the sugar receptor cell, in the taste hairs located on their labela and tarsi. We patch-clamped sensory processes of taste cells regenerated from the cut end of the taste hairs on the labelum of the flashfly isolated from the pupa ∼20 h before emergence. We recorded both single channel and ensemble currents of novel ion channels located on the distal membrane of the sensory process of the sugar receptor cell. In the stable outside-out patch membrane excised from the sensory processes, we could repeatedly record sucrose-induced currents for tens of minutes without appreciable decrease. An inhibitor of G-protein activation, GDP-β-S, did not significantly decrease the sucrose response. These results strongly suggested that the channel is an ionotropic receptor (a receptor/channel complex), activated directly by sucrose without mediation by second messengers or G protein. The channel was shown to be a nonselective cation channel. Analyses of single channel currents showed that the sucrose-gated channel has a single channel conductance of ∼30 pS and has a very short mean open time of ∼0.23 ms. It is inhibited by external Ca2+ and the dose–current amplitude relation could be described by a Michaelis-Menten curve with an apparent dissociation constant of ∼270 mM. We also report transduction ion channels of the receptor/channel complex type directly gated by fructose and those gated by L-valine located on the sensory process.
Keywords: sweet taste, ionotropic receptor, fleshfly, patch clamp, single channel current
INTRODUCTION
Sweetness is the most important taste modality for terrestrial animals that ingest sweet substances for nutrition. Vertebrates detect sweet substances by taste cells in the taste buds. A vertebrate taste cell usually has multiple transduction pathways to receive taste stimuli, which is one of the reasons for our difficulty in understanding vertebrate taste transduction. Sweetness received by the vertebrate taste cell has been reported to be transduced by a cascade mediated by second messengers, leading to closure of K+ channels (for review, see Kinnamon and Margolskee 1996; Lindemann 1996; Herness and Gilbertson 1999).
Flies have been used intensively as a model animal to study invertebrate taste reception (contact chemoreception; for review, see Morita and Shiraishi 1985; Morita 1992). They have a few hundred taste hairs on the labela and tarsi. Each labelar taste hair has four taste cells, one of which, the sugar receptor cell, is specialized to detect nutrients: sugars, fatty acids, nucleotides, and amino acids. The other three are the salt receptor cell, which detects monovalent cations, the water receptor cell, which responds most efficiently to pure water, and a receptor cell for unknown chemicals (Morita and Shiraishi 1985). The taste hair has a small pore at its tip to detect stimulant solution, and is divided into two lumina by cuticle layers: the inner lumen containing four sensory processes of the taste cells and the outer lumen containing receptor lymph. It has been shown that when the tip of the taste hair is stimulated by sugars, the receptor current flows within the outer lumen from the base to the tip, passes the cuticle layer at the tip, and may flow into the sensory process of the sugar receptor cell to initiate the receptor potential and action potentials (Morita 1992). Application of chemical modification reagents or enzymes to the sensory hair tip has revealed that the sensory process of the sugar receptor cell has several receptor sites (receptor molecules) with definite stimulant specificities: P sites activated by pyranose sugars, F sites for furanose sugars, R sites for aryl amino acids, A sites for alkyl amino acids, and the site for nucleotides (Shimada 1978; Morita and Shiraishi 1985; Amakawa et al. 1992; Ozaki et al. 1993; Furuyama et al. 1999). Little is known, however, about the transduction mechanisms of insect taste reception, either at the cell level or the ion channel level (Morita and Shiraishi 1985; Kijima et al. 1988, Kijima et al. 1994). Here, we used patch-clamp techniques to study the responses of the labelar taste cells of the fleshfly to sugars and found transduction ion channels directly gated by sugars localized on the distal membrane of the taste cell's sensory process.
MATERIALS AND METHODS
Labela of the fleshfly, Boettcherisca peregrina, were isolated from the pupa ∼12–24 h before emergence. Taste hairs were cut at the middle and the labela were incubated in normal fly Ringer solution containing (mM): 112 NaCl, 5 KCl, 0.9 CaCl2, 1.7 MgCl2, 1.2 NaHCO3, and 5 HEPES-Na, pH 7.1, for 8–20 h under oxygen gas bubbling, partly according to Zufall and Hatt 1991. Sensory processes of taste cells (50–100-μm long, 0.3–0.5 μm in diameter) grew out from the cut ends of taste hairs. After removing Ca2+ from the perfusion solution, their tips swelled into small spheres (2–5 μm in diameter; see Fig. 1). We patch-clamped the membranes of these small spheres in the cell-attached, whole-cell, and outside-out modes. The patch pipettes were prepared using thick-walled borosilicate glass capillaries (0.86 mm in inner diameter, GC150; Clark) to reduce the capacitance of glass wall and filled with the pseudointracellular solution containing (mM): 110 K-acetate, 20 KCl, 2 EGTA, 2 EDTA, 10 HEPES-Na, pH 7.1. All experiments were performed at room temperature (22 ± 1°C).
Figure 1.

Regenerated sensory processes from a cut end of a taste hair, and their patch-clamping. (A) Regenerated and swollen sensory processes in the Ca2+-free fly Ringer solution. (B) A swollen process patch-clamped in the cell-attached mode (seal resistance: >20 GΩ). It was then whole-cell clamped by rupturing the patch membrane, and then the outside-out patch was obtained by pulling out the pipette. Scale bars, 5 μm. (C) Schematic illustration of B. SPr, sensory process; SH, sensory hair cut in the middle; StP, stimulating pipette; PP, patch pipette.
The recording chamber was placed on the stage of an inverted differential interference microscope (IMT-2; Olympus Corp.). Electrical signals were amplified by an Axopatch 1-D amplifier (Axon Instruments, Inc.), and stored in a PCM recorder. The data was low-pass filtered with a four-pole Bessel filter at 2.2 kHz, A/D converted (14 bit, 20 KHz), and analyzed by a personal computer using pCLAMP6 (Axon Instruments, Inc.), Origin 5 (Microcal Software, Inc.) and Excel 97 (Microsoft Corp.) software.
Stimulant solution was prepared by dissolving a sugar or an amino acid in the Mg2+- and Ca2+-free fly Ringer solution. For puff application, four kinds of stimulant solution were usually filled in a four-channeled (quad style) glass micropipette with an opening diameter of ∼5–20 μm. The puff pipette was placed 10–20 μm away from the sensory process (see Fig. 1). Throughout the experiments, the experimental chamber was perfused gently with bathing solution. Data are given showing average values ± SEM.
When we constructed open- and closed-time histograms from single channel current records, the event numbers in the dwell time bins <0.20 ms decreased due to a time-resolution limit of the patch-clamp system (see Fig. 6 C). The best-fit exponential curves to the histograms were obtained by the maximum likelihood method (Colquhoun and Sigworth 1995), omitting four dwell-time bins <0.20 ms. In the estimation of open-channel probability from these histograms, we compensated for the decreased event numbers by replacing the experimental event numbers with estimated ones from the best-fit exponential curves.
Figure 6.
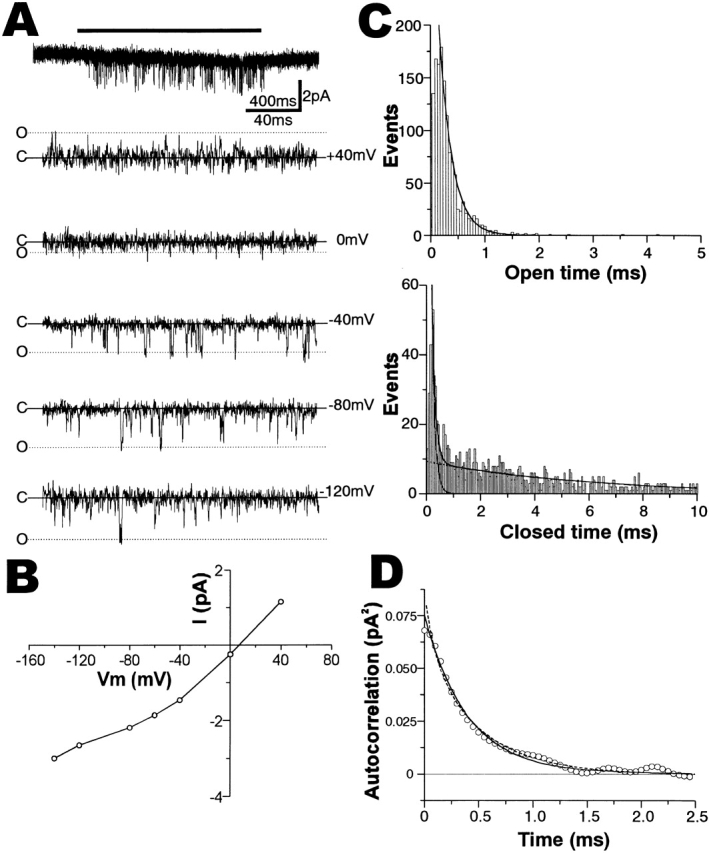
Single channel properties of the transduction channels. (A) Single-channel current traces activated by 250 mM sucrose. (Top) An overall view of the single-channel current activated by sucrose application for 2 s (shown by a horizontal bar) at −60 mV voltage clamp. It is shown in a condensed time scale (400 ms given above the horizontal scale bar). (Bottom five) The single-channel current during sucrose application at the various patch-clamp voltages indicated. These were obtained from different trials on the same outside-out patch. Solid lines with C showed a closed-state level. Currents in the fully open states are shown by dotted lines with O. (B) The current–voltage relationship obtained from A. (C) Open time distribution histogram at −60 mV (above). The mean open time determined by the best-fit exponential term (solid curve) was 0.23 ms. The closed-time histogram (below) was fitted by the sum of two exponential terms (solid curve), which had time constants of 0.12 and 5.9 ms, respectively (dotted curves). (D) The autocorrelation function calculated from the same single-channel record clamped at −60 mV (○). It was fitted by a single exponential term with a time constant of 0.41 ms (solid curve). The predicted autocorrelation curve from Fig. 1 (broken curve) was described by the sum of two exponential terms with time constants of 0.093 and 0.49 ms, respectively (see text). The value of the autocorrelation function at t = 0 gives the variance of current fluctuation.
Fluctuations of the sugar-induced currents obtained from the outside-out patches were analyzed by calculating their autocorrelation functions according to the former analyses of the current fluctuations in vivo (Kijima et al. 1988), with some modifications. The amplitudes and shapes of the sugar-induced currents significantly changed from trial to trial of puff application of sugars, even on the same outside-out patch. Thus, we could not use the average of the currents induced by several trials of puff application on the same patch as the basal current to calculate the fluctuation. Instead, we applied low-pass Gaussian filter at 4 Hz to each digitized sugar-induced current, and used the resultant smoothed current record as the basal current. In other words, we calculated the basal current as the time average of the actual current around each time point, by weighing with a Gaussian curve having the width parameter (the standard deviation) of 33 ms. This means neglecting the slow fluctuation below 4 Hz in the analysis, because we used the difference between the actual current and the basal current as the current fluctuation. When we fit the autocorrelation function by multiple exponential terms, the terms with the time constants larger than 40 [= 1,000/(2π × 4)] ms are neglected by this procedure. As seen in the results, the exponential terms with the time constant >5 ms were not relevant in this study. Thus, this procedure did not distort the kinetics of the channels studied here.
We used current records during sugar application for 2 s in nearly the steady state, for calculation of the autocorrelation function. The record was divided into 20 records for 100 ms and the record with large change >1% of the basal current within 100 ms was discarded. The autocorrelation function of 0–50 ms was calculated on each divided record and averaged. The autocorrelation function of the control current fluctuation for 2 s before stimulant application was subtracted from that of the fluctuation during the sugar application, and the autocorrelation function of net fluctuation of sugar-induced current was obtained.
When only the variances of current fluctuation were computed (Fig. 5 B), the current records and the basal currents were divided into 50-ms periods, and the variance of each period was calculated. Net variances were obtained by subtracting the average variance of the control record without sucrose application.
Figure 5.
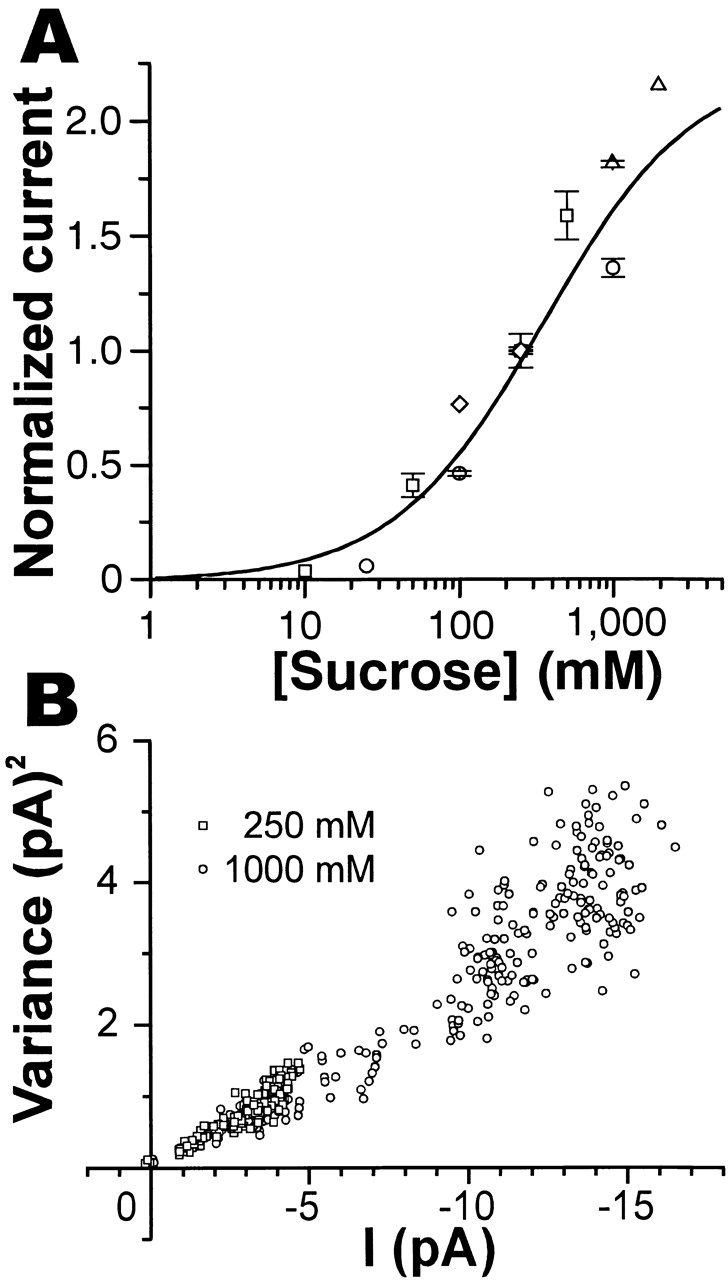
Dose–current and current–variance relationships of the sucrose-induced current. (A) A dose–current curve for sucrose. Sucrose-induced currents for various sucrose concentrations were normalized to the current at 250 mM sucrose in each outside-out patch voltage clamped at −60 mV (n = 5), and the relative magnitudes of the induced currents were plotted. Each point represents an average current (±SEM) that was in steady state for more than 1 s. Points with different symbols were obtained from different patches. Points without error bars indicate a single observation. Data were fitted by a Michaelis-Menten equation (a Hill equation with n = 1, see text) with K b = 271 mM (continuous curve). (B) A plot of variances of current fluctuation against the mean currents obtained from two current records induced by 250 mM (□) and 1 M (○) sucrose, respectively, on the same outside-out patch. Net variances were calculated in each 50-ms period after the start of sucrose application, including the rising phase of current after the start and the falling phase after the end of sucrose application, and plotted against net amplitudes of the sucrose-induced current. Therefore, sucrose concentrations may be the same as the applied concentrations only around the peaks of sucrose-induced currents (∼4.5 pA at 250 mM and ∼15 pA at 1 M sucrose), but lower at smaller currents. Sucrose was applied for 5 s in each trial.
In the most stable outside-out patches, the autocorrelation function of the control current fluctuation, which may consist of a white noise in the ideal condition, could be fitted by an exponential curve with a time constant of ∼0.09 ms. This value gives an estimate of the time resolution limit in our patch-clamp experiments, mainly determined by the seal resistance of the patch and the capacitances of the patched membrane and the patch-pipette.
RESULTS
General Characteristics of the Sucrose-gated Channels
We isolated a labelum from a pupa of the fleshfly, cut the largest type sensory hairs in the middle, and incubated them in fly Ringer solution. Sensory processes grew out from the cut end of the taste hair. After the external Ringer solution was changed to be Ca2+ free, the tips of the sensory processes swelled into small spheres, as shown in Fig. 1 A. We patch-clamped them (Fig. 1 B).
Under whole-cell current- or voltage-clamp conditions, about one-third (84 of ∼250) of the sensory processes isolated from pupae within ∼20 h before emergence responded to puff-applied sucrose by depolarization with a marked impulse-frequency increase or a rapid inward current, respectively, as seen in Fig. 2. The whole-cell current-clamp record at 0 pA (Fig. 2 A) reproduced the physiological response of the sugar-receptor cell in vivo: ∼10-mV depolarization from the resting potential of −47 mV caused an impulse frequency increase of ∼8/s in this example. When voltage clamped at −60 mV, the whole-cell inward current induced by 250 mM sucrose was ∼20 pA in this example (Fig. 2 B), and ranged from 5 to 40 pA (n = 34). Most of the whole cell voltage-clamped taste cells at −60 mV responding to sucrose generated impulses due to insufficient space clamp of the long process, at the basal part of which impulses may be generated. These responses showed little desensitization during a stimulation period of longer than 5 s (Fig. 2A and Fig. B, and Fig. 3 A; see discussion). The resting potential of the sensory process, estimated just after establishing its whole-cell clamp by rupturing the cell-attached membrane, was −47.9 ± 0.9 mV (n = 33) on average, and the input impedance 900 ± 105 MΩ (n = 16).
Figure 2.

Responses of a whole-cell clamped sensory process to puff-applied 250 mM sucrose for 5 s (shadowed bar). (A) Sucrose-induced depolarization of the membrane potential with increasing impulse frequency in a current clamp at zero current. (B) A sucrose-induced inward current developed with an increase in its fluctuation in the voltage clamp at −60 mV. (A and B) Traces were recorded successively from the same outside-out patch. The period of sucrose application (slanted bar) and the level (dotted line) of −50 mV (A) and zero current (B) are common.
Figure 3.
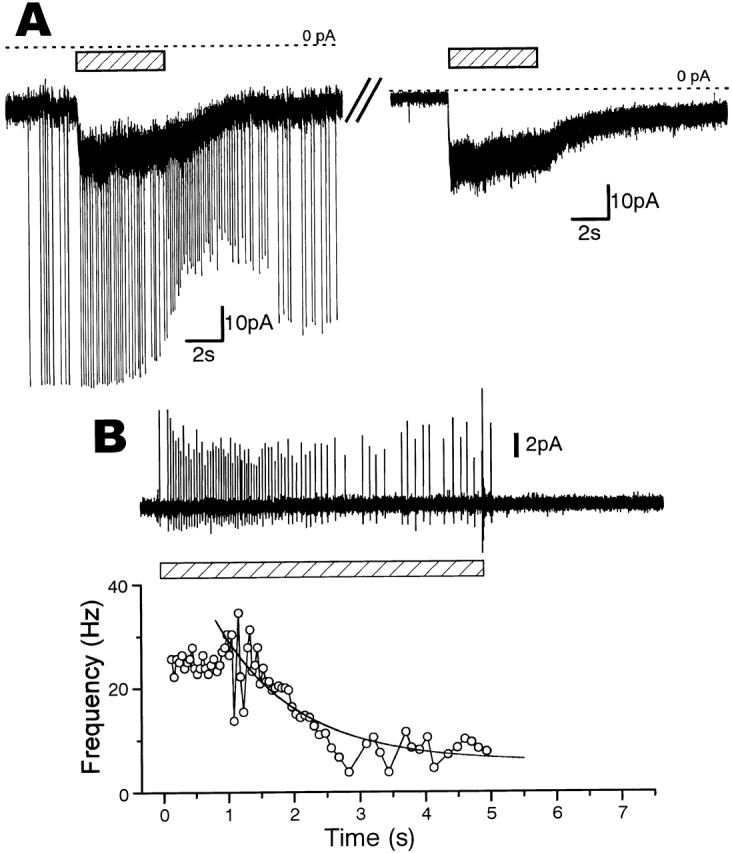
Sucrose-induced responses of sensory processes in the whole-cell, outside-out, and cell-attached mode. (A) An example in which almost the same magnitudes of currents were induced by sucrose (250 mM) in the whole-cell (left) and outside-out mode (right). These traces were recorded successively on the same sensory process voltage clamped at −60 mV. Dotted lines show zero levels of the currents. (B) An increase in impulse frequency induced by puff-application of sucrose (250 mM) to a swollen sensory process. This was recorded by the cell-attached patch-pipette (top). The time course of impulse frequency (reciprocal of the interval between successive impulses) during sucrose application in the top trace (○, bottom). The adaptation time course could be fitted by an exponential term with a time constant of 1.2 s (continuous line). The periods of sucrose application are shown by shadowed bars in A and B.
Outside-out patches were obtained by isolating the distal membrane from the whole-cell clamped sensory processes. They also generated inward currents at negative clamp voltages in response to sucrose (n = 26). Outside-out patches had extremely high input impedance (20.2 ± 3.4 GΩ; n = 7), and the inward currents induced by 250 mM sucrose were 0.1–40 pA.
In some sensory processes, the magnitudes of the sucrose-induced currents recorded successively in both the whole-cell and the outside-out modes were similar, as shown in Fig. 3 A as an example. The maximum amplitudes of the induced currents ever recorded in both modes were also similar (40 pA). These findings suggest that the sucrose-gated channels are localized on the distal part of the membrane of the sensory process near the patch pipette.
Moreover, the ratio of input conductances of the outside-out patches (G out) to those of the whole-cell patches (G whole) was much higher in the presence of 250 mM sucrose in the stimulating solution (G out/G whole = 0.58 ± 0.01; n = 11) than that in its absence (G out/G whole = 0.10 ± 0.04; n = 7). In this estimation, we measured the conductance of the whole-cell patch first, and then excised an outside-out patch membrane and measured it again. In addition, the resting membrane potential of outside-out patches was nearly 0 mV (n = 26), and we seldom observed activities of channels other than sucrose-induced channels in the single-channel recordings. These observations also suggest that the sucrose-gated channels and other channels responsible for resting membrane potential formation are distributed nonuniformly in the sensory process, the former at its distal part and the latter at its base or on the cell body.
The inward currents developed together with increases in current fluctuations in both whole-cell and outside-out patches, suggesting that channel openings and closings underlie the inward currents. These responses are caused by sucrose molecules, and not by the osmotic pressure of the puffer solution, because the same concentration of an almost nonstimulating sugar derivative, α-methyl d-mannopyranoside (Kijima et al. 1988), was not effective for both the whole-cell clamped sensory processes (n = 2) and the outside-out patches (n = 3). Fig. 4 A shows an example of the latter.
Figure 4.

Effects of an almost nonstimulating sugar, α-methyl d-mannopyranoside, and GDP-β-S on the currents of outside-out patches. The period of sugar application is shown by a shadowed bar. (A) A current trace when an almost nonstimulating sugar, α-methyl d-mannopyranoside (250 mM) was puff-applied from the stimulation pipette (top) and the control trace when 250 mM sucrose was applied to the same outside-out patch, which might contain <10 sucrose-activated channels (middle). A portion of this trace (where overlapped openings of channels rarely occurred) is shown in an expanded time scale (bottom). The expanded portion is shown by two lines. An estimated full-open level (dotted line with O) of a single-channel current and the basal level (continuous line with C) are shown. Time scales above and below the scale bar are for the top two traces and for the lower expanded trace, respectively. (B) Effect of 1 mM GDP-β-S added to the pseudo-internal solution in the patch pipette on the sucrose-induced current (250 mM) in a different outside-out patch. This current was recorded ∼2 min after formation of the outside-out patch and ∼3 min after establishment of whole-cell clamp.
When 250 mM sucrose and fructose were puff-applied to the same outside-out patches, there were many patches that responded to 250 mM sucrose, but did not to fructose (n = 12, see below). This result also showed that the channels are activated specifically by sucrose, but not by osmotic pressure change. This also suggests that the channel may be associated with the P site (Morita and Shiraishi 1985) and those associated with the F site may be different.
Moreover, when we puff-applied sucrose to the swollen sensory process patch clamped in the cell-attached mode, we could observe a sugar-induced impulse increase and its adaptation within a few seconds, as shown in Fig. 3 B (n = 5). Puff-applied α-Methyl d-mannoside also did not increase impulses in this mode (n = 1, not shown). This again showed that the response is not caused by the osmotic pressure change but by sucrose.
The pseudo-intracellular solution inside the patch pipette contained neither second messengers nor GTP to activate G proteins. With the most stable outside-out patch, we could observe sucrose-induced currents for >40 min, enough time for soluble molecules to diffuse into the pipette solution. This strongly suggests that soluble molecules inside the membrane are not necessary to evoke the sugar response, suggesting that transduction ion channels are directly activated by sucrose without the intermediacy of second messengers or G proteins; i.e., they are ionotropic receptors or of the receptor/channel complex type.
To confirm further that G proteins are not involved in the activation process of the ion channels, we added GDP-β-S, a nonhydrolyzable GDP analog and a potent inhibitor of G protein activation, to the pipette solution and examined its effects on the responses of the outside-out patches to 250 mM sucrose. Addition of 1 mM GDP-β-S to the internal solution did not significantly reduce the responses of the outside-out patches, as shown in Fig. 4 B (n = 3). This again suggests that G-proteins may not be involved in the transduction pathways. This suggestion is consistent with the previous result that the latency before the receptor current begins to flow after stimulating the intact taste hair tip by sucrose was very short, ∼1 ms (Kijima et al. 1994).
Sucrose-evoked currents increased in a dose-dependent manner. Inward peak currents induced by various concentrations of sucrose at −60 mV were normalized to the peak current produced by 250 mM sucrose in different outside-out patches. The dose–response curve thus obtained (Fig. 5) was curve-fitted by the following Hill equation ():
 |
1 |
where I is the inward peak current, Imax its maximum value, K d the dissociation constant, [S] the concentration of sucrose, and n is Hill's coefficient. It was best-fitted by this equation with n = 0.89 and a dissociation constant K d of 344 mM (sum of square differences = 0.69), or fitted with almost the same errors (sum of square differences = 0.70) by a Michaelis-Menten equation (n = 1) and K d of 271 mM (Fig. 5 A, solid curve), consistent with the study in vivo (Morita and Shiraishi 1968, see discussion). These results suggest that the transduction channel may be activated by the binding of one sucrose molecule to the P site receptor/channel complex.
Analyses of Single-Channel Currents and the Fluctuation of Ensemble Currents
Single-channel currents were occasionally observed (n = 4) on outside-out patches excised from sensory processes at a relatively early developmental stage, which may contain sucrose-gated channels at low density. Most channel openings in all the single channel records showed very short open times, causing short spike-like current deflections, as shown in Fig. 6 A. The single channels were activated by 250 mM sucrose application, as shown in Fig. 6 A (top, voltage clamped at −60 mV). The channel was active during several trials of sucrose application for 5–15 s with occasional resting periods. The currents flew outward at its openings at the clamped membrane voltage of +40 mV, reversed near 0 V, and flew inward at negative voltages (Fig. 6 A, bottom five). Most of the openings had smaller peak open-channel currents, when open dwell times were shorter, due to the time resolution limit of our experimental system (see below). However, we could estimate the full-open levels of the single-channel currents from the levels of long open-periods having fluctuations at their peaks (dotted lines). Fig. 6 B shows the I-V curve constructed from the full-open levels of the single-channel current records in Fig. 6 A. The reversal potential was +5.5 mV and the single-channel conductance was estimated to be 33 pS at ∼0 mV.
The reversal potentials were also estimated from the sucrose-induced ensemble currents. The I-V relations of the ensemble currents were obtained by applying a ramp voltage from −60 to +60 mV (see the traces of NaCl in Fig. 7B and Fig. C). It was 5.3 ± 0.9 mV (n = 9), in good agreement with that of the single-channel current, and suggested that the channel may permeate cations nonselectively.
Figure 7.
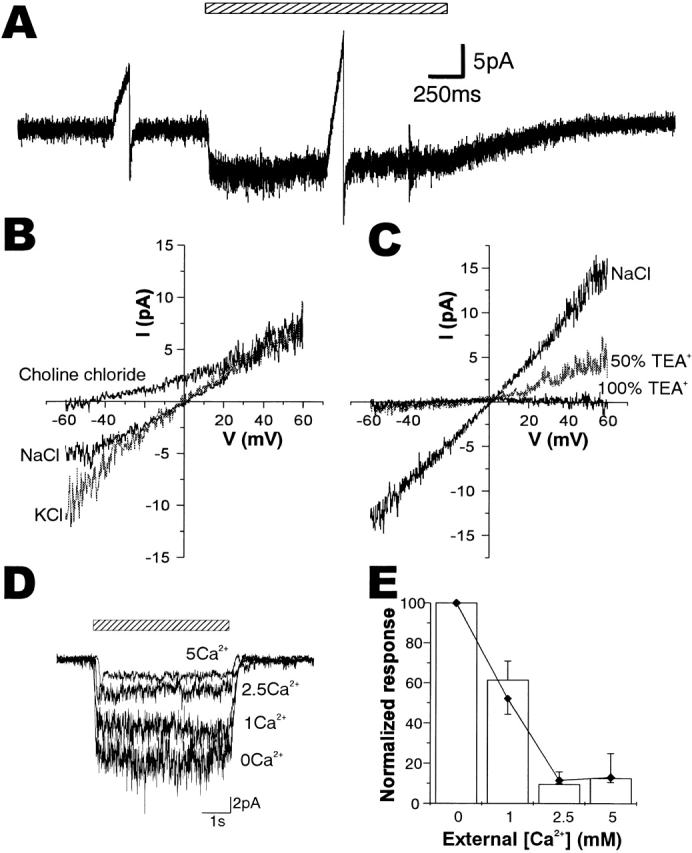
Ionic properties of sucrose-activated channels in the outside-out patches. (A) A sucrose-induced current record of an outside-out patch voltage clamped at −60 mV, in which two voltage ramps from −60 to +60 mV were inserted in the period of steady sucrose-induced current (right) and in the control period without sucrose application (left). (B) I-V relationships of the ensemble current induced by 250 mM sucrose obtained from the current traces responding to voltage ramps from −60 to +60 mV in the external Ca2+-free Ringer (NaCl) and in solutions in which Na+ was replaced by K+ (KCl, gray trace) and choline+ (choline chloride). The trace of NaCl was obtained from the record shown in A. (C) I-V relationships in external solutions in which NaCl was half (50% TEA+, gray trace) or fully (100% TEA+) replaced by TEA chloride. TEA+ blocked sucrose-activated channels from the extracellular side both inwardly and outwardly. (D) Inhibition of sucrose-induced currents by Ca2+ in the stimulant solution. Current traces induced by 250 mM sucrose on an outside-out patch in various concentrations of Ca2+ (given in millimolar) are shown. The period of stimulation is shown by a shadowed bar. (E) A plot of responses against Ca2+ concentration. Relative magnitude of conductances activated by 250 mM sucrose with voltage ramps from −60 to +60 mV (n = 3, open bars) and the variances of current fluctuations at −60 mV(♦) in various Ca2+ concentrations. SEMs are shown by vertical lines above (conductances) or below (variances) the data points.
Channel-gating kinetics by sucrose were examined next. The open-time histogram (Fig. 6 C, top) obtained from the above single-channel record was well fitted by a single exponential term with a very small mean open time of 0.23 ms. The closed-time distribution (Fig. 6 C, bottom) could be fitted by double exponential terms, with time constants of 0.12 ms (43% in area proportion) and 5.9 ms (57%), respectively. Analyzing these, we determined the rate constants of state transition, based on the channel model (Fig. 1):
Scheme S1.

where k+ = 0.38, k− = 4.5, β = 3.7, and α = 4.2 ms−1 at 250 mM sucrose, and k+ should be dependent on sucrose concentration (see ). The channel open probability, P o, estimated from open and closed dwell times after compensating lost dwell-times <0.20 ms, as described in materials and methods, was very small, ∼6.4% at 250 mM sucrose. It could also be calculated from Fig. 1 using the indicated rate constants, giving 6.5%, showing good coincidence of both estimations. These values were larger than the direct estimation of P o (5.4%) from the record by summing up open and closed times, respectively, without compensation of lost dwell times, because the proportion of lost open times was larger than that of lost closed times. In the other three single-channel records, the mean open time could be estimated from the open-time histograms, the open-channel probability directly from the records, as above, and the single-channel conductance from the records using the value of reversal potential (5.3 mV), but the closed-time distributions could not be determined because the total number of closed events was too small for curve fitting. The average of the mean open time at 250 mM sucrose was 0.20 ± 0.02 ms and that of P o estimated without compensation was 5.2 ± 0.7% (n = 4). The average single-channel conductance was 31 ± 1.3 pS.
The mean open time (0.2 ms) did not change either in the presence or absence of extracellular and intracellular Ca2+ and Mg2+, as judged by the analysis of outside-out patches containing a few channels, indicating that the very short mean open time is not due to a channel block by divalent cations.
The variances of current fluctuations increased with sucrose concentrations up to 2 M, almost in proportion to the amplitudes of sucrose-induced mean currents as shown in Fig. 5 B. This is reasonable because the channel open probability at an infinite sucrose concentration is calculated to be 0.47 from the above model by making k+ infinitely large, and does not exceed 0.5.
From the above analyses, the number of open channels on the whole cell-clamped sensory processes, in which currents of 5–40 pA were produced by 250 mM sucrose at −60 mV, was estimated to be 40–400. The number of activatable channels was calculated to be 200–2,000 from the open channel probability of 6.4%. This suggests the existence of a few thousand transduction channels excitable by sucrose on the distal membrane of a sensory process in vivo.
We analyzed sucrose-induced current fluctuations by calculating their autocorrelation function. As shown in Fig. 6 D, the autocorrelation function calculated from the single-channel current records used in Fig. 6A–C, could be well fitted by a single exponential term with a time constant of 0.41 ms (solid curve). On the other hand, Fig. 1 and the rate constants obtained above predicted the autocorrelation function (broken curve) described by double exponential terms with time constants of 0.093 ms (28% in amplitude) and 0.49 ms (72%). This predicted autocorrelation function was in good agreement with that directly calculated from the record (Fig. 6, ○) and also well fitted by a single exponential term with the time constant of 0.43 ms (not shown). These results indicated good coincidence between the analyses of dwell-time distributions and those of current fluctuations.
We judged that all four single-channel records described above are activated by sucrose and contain the same kind of channels as those in the sucrose-induced ensemble current records. The reasons of this judgement are as follows. (a) Channels in Fig. 4 A were not activated by α-methyl mannoside. We estimated the open-time distribution and the full-open current level of single channels in the outside-out patch of Fig. 4 A (containing <10 channels) by examining three portions of the record during sucrose application, in which small numbers of channels were active and overlapped openings rarely occurred. Total length of the examined portions was ∼900 ms, and a portion is shown in an expanded time scale in Fig. 4 A (bottom). The open-time distribution in these portions was fitted well by an exponential term and the mean open time was 0.21 ms. We also estimated the full-open single-channel current level as 2.0 pA at −60 mV. On the other hand, the averages of those values in the four single-channel records were 0.20 ± 0.02 ms and 2.0 ± 0.1 pA (at −60 mV). Both the mean open time and the single-channel current at −60 mV were agreed very well between the channels in Fig. 4 and those in the single-channel records, suggesting strongly that both channels are of the same kind. (b) The autocorrelation functions of the single-channel current fluctuations were well fitted by a single exponential term with the time constants (0.41 ± 0.01 ms), which were almost the same as that of the sucrose-induced current shown in Fig. 4 A (0.49 ms). (c) The reversal potential of the single-channel current in Fig. 6 (+5.5 mV) was the same as those of ensemble currents (5.3 ± 0.9 mV). (d) The single-channels were active only during sucrose application.
Most autocorrelation functions of ensemble current fluctuation obtained from both whole-cell and outside-out patches (n = 34, Fig. 8 A) were roughly fitted by a single exponential curve with a time constant of 0.3–0.8 ms, consistent with the single-channel analyses.
Figure 8.

Responses of sensory processes of the sugar receptor cells to fructose and L-valine. (A) An inward current induced by 250 mM sucrose in an outside-out patch at −60 mV (above) and its autocorrelation function (below). The autocorrelation function was fitted by a single exponential curve with a time constant of 0.31ms. (B) An inward current induced by 250 mM fructose at −60 mV (above) and its autocorrelation function fitted by an exponential term with a time constant of 0.61 ms (below), obtained from the same patch as in A. (C) A current induced by 50 mM L-valine at −60 mV (above) and its autocorrelation function fitted by an exponential term with a time constant of 0.11 ms (below), obtained from a different outside-out patch to that in A and B.
The magnitude of the single-channel current can also be estimated from the ratio of variance of current fluctuation to the mean current amplitude. The ratio gives i(1 − P o), where i is the single-channel current amplitude. Using the value of P o at 250 mM sucrose (0.064) estimated above and the reversal potential, we could calculate the single-channel conductance of the above single-channel record in Fig. 6 as 8.0 pS. This value is very small compared with the above direct estimate (33 pS). This is very natural because the estimation from the fluctuation analysis was done on the current record containing many short channel openings with attenuated single-channel current amplitudes smaller than the full-open level, as clearly seen in Fig. 6 A.
Ionic Properties of the Transduction Channel
Ion selectivity of sucrose-induced currents was examined by applying puffer solutions in which Na+ was replaced by a different cation to the outside-out patch. The I-V relation in a cation solution was obtained by applying a ramp voltage from −60 to +60 mV in the period of the steady sucrose-induced current and in the control period without sucrose, as shown in Fig. 7 A. The I-V relation of net sucrose-induced current was obtained as the difference between the sucrose-induced current and the control current during the ramp voltage insertions. As shown in Fig. 7 B, replacement of Na+ by K+ scarcely changed the profile of the I-V curve near 0 mV, and made the reversal potential a little negative (−3.0 ± 0.3 mV, n = 3). In more negative voltages (below −30 mV), however, the inward current amplitude was larger in K+ solution. Replacing external NaCl with choline chloride shifted the reversal potential negative to −41.5 ± 2.6 mV (n = 4, Fig. 7 B), confirming that the channels are not anion selective and indicating a low choline+ permeability. Half replacement with another large monovalent cation, triethanolamine+ (TEA+), depressed inward currents nearly completely and outward currents by ∼50%, with a reversal potential of −10.2 ± 1.3 mV (Fig. 7 C, n = 3). Full replacement completely depressed the current, suggesting a blocking action of TEA+ on the channel. The effect of TEA+ was at least partially reversible (not shown). These results reveal that the sugar-gated channels permeate small monovalent cations with a permeability ratio of PNa:PK:PCholine = 1.5:1:0.17, which was calculated using the Goldman-Hodgkin-Katz equation.
Extracellular Ca2+ suppressed sugar-induced inward and outward currents symmetrically when the ramp voltage was applied in the same way as in Fig. 7B and Fig. C, and did not affect the reversal potential (not shown). A physiological concentration of Ca2+ (1 mM) depressed the conductance by ∼40%, and 2.5 mM Ca2+ depressed the conductance by ∼90%, as shown in Fig. 7D and Fig. E. The variances of current fluctuations were also decreased in almost the same way with the increase in Ca2+ concentration (Fig. 7 E). As the variance is proportional to the number of open channels and to the square of the single-channel current, these results suggest that Ca2+ reduces the number of open channels without affecting the single channel current; i.e., inactivates the channels.
Channels Activated by Fructose and L-Valine
Finally, we tested the effects of other stimulants for the sugar receptor cell. Fructose is a stimulating sugar that activates a different receptor site (F-site) from the site for sucrose (P-site; Morita and Shiraishi 1985). Some of the outside-out patches excitable by sucrose, isolated from the pupa in its last stage, responded to fructose (n = 3, Fig. 8 B). Analyzing evoked currents, we found that the variance of current fluctuation was about one-third that of sucrose, in contrast with the similar amplitudes of evoked currents (Fig. 8A and Fig. B).
The ratio of variance of current fluctuation to the mean current amplitude gives i(1 − P o), where i is the single channel current amplitude, as described above. This value of the fructose-activated channel (Fig. 8 B) was ∼30% that of the sucrose-activated channel (A). Assuming similar small P os for both sucrose and fructose, this result suggests that the single-channel conductance of fructose-activated channels is about one third that of sucrose-activated channels, suggesting a different receptor–channel complex for fructose that has a smaller single-channel conductance. A small value of P o (6.4%) estimated from analyses of a sucrose-activated single-channel current (Fig. 6) and the proportionality between the variance of ensemble current fluctuation and the mean current amplitude (Fig. 5 B) show validity of the assumption of small P o, at least for the sucrose-activated channels. The time constant of the autocorrelation function was a little longer (∼0.6 ms, n = 3) than that of sucrose, but the reversal potential was almost the same (n = 2), suggesting that the fructose-activated channel is also a nonspecific cation channel. The longer time constant (0.6 ms) suggests that the smaller variance is not due to stronger attenuation of single-channel current amplitudes caused by the time-resolution limit.
Sugar-receptor cells are sensitive to some amino acids (Shimada 1978). One amino acid, L-valine, elicited large inward currents in all the tested whole cells and outside-out patches excitable by sucrose (Fig. 8 C). The variance of current fluctuations was very small compared with those induced by sucrose (∼1/20, n = 5). The autocorrelation function of net valine-induced currents could be fitted by an exponential term with a very small time constant of ∼0.1 ms (Fig. 8 C, below), suggesting that L-valine–gated channels are different from those gated by sucrose or fructose, having smaller single channel conductance and shorter open times. However, the time constant of ∼0.1 ms may be an overestimation because this value is similar to the time resolution limit (∼0.09 ms) of our experimental system. The true open/close kinetics of the lysine-gated channel may be more rapid and the variances of fluctuations may also be underestimated due to time-resolution limit.
DISCUSSION
In this paper, we have demonstrated the existence of novel transduction channels of the receptor–channel complex type gated directly by sucrose, and those probably gated directly by fructose and L-valine, on the distal part of the sensory process membrane of the sugar receptor cell. This may be the first study to report not only intracellular recordings of the insect taste cell, but also a patch-clamp study of the channels to transduce the insect taste sensation. In contrast to our findings, sugar sensation received by mammalian taste cells has been reported to be transduced by a cascade mediated by second messengers, leading to closure of K+ channels (Kinnamon and Margolskee 1996). Ion channels of the receptor–channel complex type have been reported to exist on mammalian taste cells to receive sourness (Ugawa et al. 1998), on frog taste cells to receive bitterness (Tsunenari et al. 1999), on catfish barbells (amino acid–activated channels; Kumazawa et al. 1998), and on crayfish claws (nicotinamide-activated channels; Hatt and Franke 1987). These studies, however, did not definitely show that these ionotropic channels work as the taste transduction channels in the physiological condition. In this study, we showed that the channels directly activated by sugars are localized on the distal part of the membrane of the sensory process, the precise locus of sugar reception, and cause physiological taste responses in the whole-cell current-clamped taste cell at zero current (Fig. 2 A). Furthermore, to our knowledge, no ion channels directly activated by sugars have been reported so far, regardless of the types of cells.
We showed that the channel gating is not mediated by soluble second messengers. However, this does not necessarily exclude modulatory roles for second messengers. There have been several works that reported enhancing or depressing effects of second messengers and their analogs on the fly taste responses (Liscia et al. 1989; Ozaki and Amakawa 1992; Koganezawa and Shimada 1997).
Earlier receptor current fluctuation analyses in vivo (Kijima et al. 1988) showed that the time constant of the autocorrelation functions of the current fluctuation induced by 50–200 mM sucrose was ∼3–4 ms, ∼5–10× larger than those we observed here (0.3–0.8 ms). This difference may be due to the high frequency filtering effects of the membrane capacitance of the sensory process, which was not voltage clamped in the in vivo experiments.
When we patch-clamped the small spherical membrane of the sensory processes in the cell-attached mode using a patch pipette containing 0.1 M sucrose, we could never observe channel activities within the patch. This suggests that the cytoskeleton might be broken in the swollen processes, as in the blebs grown from muscle cells (Standen et al. 1984), and that the sugar-gated channels might have escaped towards the base of the swollen process together with the broken cytoskeleton. In this condition, the channels at the base of the swollen process could respond to sucrose as observed in the cell-attached patch (Fig. 3 B). Just after we achieved the whole-cell clamp by rupturing the patch membrane, the swollen process deflated and the channels, with the cytoskeleton, might have returned to near the patch pipette. Consequently, we could observe sugar-induced responses even in the excised outside-out patch.
The developmental stage of pupae, when we could obtain stimulant-induced channel activities, suggests the timing for the transduction channels to appear during metamorphosis. Activities of sucrose-gated channels were never observed on labela isolated from pupae more than 2 d before emergence, but could be observed ∼25 h before emergence when we added the incubation time of the isolated labelum to the time of pupal development. This suggests that the sucrose-gated channel may be embedded in the sensory process membrane ∼25 h before emergence. About one third of the patches formed on the sensory processes in this stage could respond to sucrose. This proportion was larger than 1/4, expected from the number of sensory processes in a labelar taste hair. The reason for this may be that the sensory processes of the sugar and salt receptor are thicker than others, judged from the extracellularly recorded impulse amplitudes (see Morita and Shiraishi 1985). Thicker sensory processes may form larger swollen processes and may increase the chance to apply the patch-pipettes.
There were many outside-out patches that responded to sucrose but not to fructose. The patches isolated from the latest stage of pupal development that could respond to fructose always responded to sucrose if tested. This shows that fructose-gated channels appear later in development. On the other hand, the patches that responded to L-valine always responded to sucrose if tested, suggesting that the valine-gated channel appears no later than the sucrose-gated channel.
The apparent dissociation constant of the dose–response curve of sucrose (271 mM, Fig. 5) was much smaller than the “Beidler constant, K B” (the concentration of stimulant giving half-maximal cellular response, ∼68 mM; Morita and Shiraishi 1968) of the dose–response curve of sucrose obtained in vivo. This difference of the magnitude of K B and K d (about four times) can be explained by the equivalent circuit model of the fly taste cell, developed by Morita and Shiraishi 1985, in which K B is given as ():
 |
2 |
where n max is the number of open ion channels at the infinite sucrose concentration, γ the single-channel conductance, and G is the total conductance of the other part including that of the cell membrane, inside of the sensory process and the outer lumen of the taste hair. About four times difference agreed well with a former estimation on the blowfly, Phormina regina (Ninomiya et al. 1986).
The dissociation constant of sucrose could be calculated from Fig. 1 as the sucrose concentration at which the rate constant k + is given as ():
 |
3 |
under the assumption that k + is proportional to the sucrose concentration. It was 1.69 M, much larger than K d obtained from the dose–response curve (271 mM). One possibility to account for this difference is that Fig. 1 is a reduced model from more complex models, obtained by applying “steady/equilibrium approximation” (for review, see Kijima and Kijima 1997). One of the models to which this approximation can be applied is given in Scheme AI.
Little adaptation of the sugar- or amino-acid–gated channels was observed during stimulant application for 5–10 s in the whole-cell current- and voltage-clamped sensory processes or in the outside-out patches (Fig. 2 and Fig. 3 A), in spite of the marked adaptation observed in vivo (Ozaki and Amakawa 1992). However, when we applied sucrose from outside to the swollen sensory process patch clamped in the cell-attached mode, we could observe a sugar-induced impulse increase and its adaptation within a few seconds, as shown in Fig. 3 B. When the time course of impulse frequency was plotted during sucrose application, it showed adaptation with a time constant of 1.2 s in this case (Fig. 3 B, bottom). These findings suggest that the essential component(s) that causes adaptation is lost or does not work in the pseudo-intracellular solution in the patch pipette, which contains divalent cation chelators, EGTA and EDTA.
In conclusion, the fleshfly has transduction ion channels directly gated by sugars with very short latencies after stimulation, on the sensory processes of taste cells. This may make the fleshfly able to detect the nutrients with a very brief touch to foods by the labelum or tarsi.
For further elucidation of these transduction ion channels, studies on their molecular properties, including their cloning and structural characterization, will be necessary. Two protein molecules reported by Ozaki et al. 1993 as candidates of P- and F-site receptors may be the molecules of sucrose- and fructose-gated transduction channels described here, respectively.
Acknowledgments
We thank Professors Kenji Kuba, Tsutomu Kouyama, and Dr. Naoya Suzuki for reading the manuscript and valuable comments. We also thank Professors Tatsuya Haga and Motoyuki Tsuda for critical comments, and all members of K-lab., Department of Physics, Nagoya University, for their encouragement and advice.
An Example of Complex Channel Models to Account for the Apparent Dissociation Constant of Sucrose
In this model, we assume that there are three closed states: C11, C12, and C2, and that C11 and C12 are very rapidly converting with each other at 250 mM sucrose, as shown in 2.
Scheme S2.

We assume that the rate constant, k 1, is proportional to the sucrose concentration (expressing the sucrose binding step) and that:
 |
A1 |
Then, under the appropriate time resolution limit, states C11 and C12 are in rapid quasi-equilibrium and observed as one closed state, C1. Then, 2 reduces to 1 with the apparent rate constant, k + ():
 |
A2 |
In this model, the reduced rate constant k + is dependent on sucrose concentration in the same way as the Michaelis constant of an enzyme. The apparent dissociation constant is given as the sucrose concentration at which holds:
 |
A3 |
We can set rate constants, k 1 − k 4, to hold at 250 mM sucrose under the restriction of the relation .
In this model, the maximum channel open probability at infinite sucrose concentration is smaller than the value estimated in results (0.47).
Some other complex models, which reduce to 1 by applying the steady/equilibrium approximation, are also able to account for the apparent dissociation constant of sucrose obtained here.
Footnotes
Abbreviation used in this paper: TEA+, triethanolamine+.
References
- Amakawa T., Kawata K., Ozaki M. Nucleotide receptor-site on the labellar sugar receptor cell of the blowfly Phormia regina . J. Insect Physiol. 1992;38:365–371. [Google Scholar]
- Colquhoun D., Sigworth F.J. Fitting and statistical analysis of single channel records. In: Sakmann B., Neher E., editors. Single-channel recording. Second edition. Plenum Publishing Corp; New York, NY: 1995. pp. 483–587. [Google Scholar]
- Furuyama A., Koganezawa M., Shimada I. Multiple receptor sites for nucleotide reception in the labellar taste receptor cells of the fleshfly Boettcherisca peregrina . J. Insect Physiol. 1999;45:249–255. doi: 10.1016/s0022-1910(98)00120-6. [DOI] [PubMed] [Google Scholar]
- Hatt H., Franke C. Taste receptors in crayfishrecording of single nicotinamide-activated channels. Neurosci. Lett. 1987;73:137–142. doi: 10.1016/0304-3940(87)90007-3. [DOI] [PubMed] [Google Scholar]
- Herness M.S., Gilbertson T.A. Cellular mechanisms of taste transduction. Annu. Rev. Physiol. 1999;61:873–900. doi: 10.1146/annurev.physiol.61.1.873. [DOI] [PubMed] [Google Scholar]
- Kijima H., Kijima S. Theoretical approach to ion channel dynamics. In: Sokabe M., Auerbach A., Sigworth F.J., editors. Progress in Cell Research. Vol. 6. Towards Molecular Biophysics of Ion Channels. Elsevier Science Inc; New York, NY: 1997. pp. 295–304. [Google Scholar]
- Kijima H., Nagata K., Nishiyama A., Morita H. Receptor current fluctuation analysis in labellar sugar receptor of the fleshfly. J. Gen. Physiol. 1988;91:29–47. doi: 10.1085/jgp.91.1.29. [DOI] [PMC free article] [PubMed] [Google Scholar]
- Kijima H., Yamane S., Kazawa T., Nakano H., Goshima S. Transduction ion channels in insect taste cells. In: Kurihara K., Ogawa H., editors. Olfaction & Taste XI. Springer-Verlag; Tokyo, Japan: 1994. pp. 808–811. [Google Scholar]
- Kinnamon S.C., Margolskee R.F. Mechanisms of taste transduction. Curr. Opin. Neurobiol. 1996;6:506–513. doi: 10.1016/s0959-4388(96)80057-2. [DOI] [PubMed] [Google Scholar]
- Koganezawa M., Shimada I. The effects of G protein modulators on the labellar taste receptor cells of the fleshfly (Boettcherisca peregrina) J. Insect Physiol. 1997;43:225–233. doi: 10.1016/s0022-1910(96)00096-0. [DOI] [PubMed] [Google Scholar]
- Kumazawa T., Brand J.G., Teeter J.H. Amino acid–activated channels in the catfish taste system. Biophys. J. 1998;75:2757–2766. doi: 10.1016/S0006-3495(98)77719-7. [DOI] [PMC free article] [PubMed] [Google Scholar]
- Lindemann B. Taste reception. Physiol. Rev. 1996;76:718–766. doi: 10.1152/physrev.1996.76.3.719. [DOI] [PubMed] [Google Scholar]
- Liscia A., Crnjar R., Angioy A.M., Barbarossa I.T. GTP and cyclic GMP both enhance while cyclic AMP depresses the response to a furanose sugar of taste chemosensilla in the blowfly, Protophormia terraenovae . Comp. Biochem. Physiol. A Physiol. 1989;94:257–260. [Google Scholar]
- Morita H. Transduction process and impulse initiation in insect contact chemoreceptor. Zool. Sci. 1992;9:1–16. [Google Scholar]
- Morita H., Shiraishi A. Stimulation of the labellar sugar receptor of the fleshfly by mono- and disaccharides. J. Gen. Physiol. 1968;52:559–583. doi: 10.1085/jgp.52.4.559. [DOI] [PMC free article] [PubMed] [Google Scholar]
- Morita H., Shiraishi A. Chemoreception physiology. In: Kerkut G.A., Gilbert L.I., editors. Comprehensive Insect Physiology, Biochemistry and Pharmacology. Pergamon; Oxford, UK: 1985. pp. 133–170. [Google Scholar]
- Ninomiya M., Ozaki M., Kashiwara Y., Morita H. Destruction and reorganization of the receptor membrane in labellar chemosensory cells of the blowflyrecovery of response to sugars after destruction. J. Gen. Physiol. 1986;87:1003–1016. doi: 10.1085/jgp.87.6.1003. [DOI] [PMC free article] [PubMed] [Google Scholar]
- Ozaki M., Amakawa T. Adaptation-promoting effect of IP3, Ca2+, and phorbol ester on the sugar taste receptor cell of the blowfly, Phormia regina . J. Gen. Physiol. 1992;100:867–879. doi: 10.1085/jgp.100.5.867. [DOI] [PMC free article] [PubMed] [Google Scholar]
- Ozaki M., Amakawa T., Ozaki K., Tokunaga F. Two types of sugar-binding protein in the labellum of the fly—putative taste receptor molecules for sweetness. J. Gen. Physiol. 1993;102:201–216. doi: 10.1085/jgp.102.2.201. [DOI] [PMC free article] [PubMed] [Google Scholar]
- Shimada I. The stimulating effect of fatty acids and amino acid derivatives on the labellar sugar receptor of the fleshfly. J. Gen. Physiol. 1978;71:19–36. doi: 10.1085/jgp.71.1.19. [DOI] [PMC free article] [PubMed] [Google Scholar]
- Standen N.B., Stanfield P.R., Ward T.A., Wilson S.W. A new preparation for recording single-channel currents from skeletal muscle. Proc. R. Soc. Lond. B Biol. Sci. 1984;221:455–464. doi: 10.1098/rspb.1984.0044. [DOI] [PubMed] [Google Scholar]
- Tsunenari T., Kurahashi T., Kaneko A. Activation by bitter substances of a cationic channel in membrane patches excised from the bullfrog taste receptor cell. J. Physiol. 1999;519:397–404. doi: 10.1111/j.1469-7793.1999.0397m.x. [DOI] [PMC free article] [PubMed] [Google Scholar]
- Ugawa S., Minami Y., Guo W., Saishin Y., Takatsuji K., Yamamoto T., Tohyama M., Shimada S. Receptor that leaves a sour taste in the mouth. Nature. 1998;395:555–556. doi: 10.1038/26882. [DOI] [PubMed] [Google Scholar]
- Zufall F., Hatt H. Dual activation of a sex pheromone–dependent ion channel from insect olfactory dendrites by protein kinase C activators and cyclic GMP. Proc. Natl. Acad. Sci. USA. 1991;88:8520–8524. doi: 10.1073/pnas.88.19.8520. [DOI] [PMC free article] [PubMed] [Google Scholar]