

Abstract
By participating in the regulation of ion and voltage gradients, the Na-K pump (i.e., Na,K-ATPase) influences many aspects of cellular physiology. Of the four α isoforms of the pump, α1 is ubiquitous, α2 is predominant in skeletal muscle, and α3 is found in neurons and the cardiac conduction system. To determine whether the isoforms have different intracellular Na+ affinities, we used the Na+-sensitive dye sodium-binding benzofuran isophthalate (SBFI) to measure pump-mediated Na+ efflux as a function of [Na+]i in human HeLa cells stably transfected with rat Na-K pump isoforms. We Na+-loaded the cells, and then monitored the time course of the decrease in [Na+]i after removing external Na+. All transfected rat α subunits were highly ouabain resistant: the α1 isoform is naturally resistant, whereas the α2 and α3 isoforms had been mutagenized to render them resistant. Thus, the Na+ efflux mediated by endogenous and transfected pumps could be separated by studying the cells at low (1 μM) and high (4 mM) ouabain concentrations. We found that the apparent K m for Na+ efflux attributable to the native human α1 isoform was 12 mM, which was similar to the K m of rat α1. The α2 and α3 isoforms had apparent K m's of 22 and 33 mM, respectively. The cells expressing α3 had a high resting [Na+]i. The maximal activity of native α1 in the α3-transfected cells was only ∼56% of native α1 activity in untransfected HeLa cells, suggesting that transfection with α3 led to a compensatory decrease in endogenous α1 pumps. We conclude that the apparent K m(Na+) for rat Na-K pump isoforms increases in the sequence α1 < α2 < α3. The α3 isoform may be suited for handling large Na+ loads in electrically active cells.
Keywords: sodium-binding benzofuran isophthalate, transfection, ouabain, sodium affinity
introduction
The Na-K pump (Na,K-ATPase) has two main protein subunits, α and β. Four isoforms of the α subunit are known, and three of the β. Of the α isoforms, α1 is ubiquitous. It appears to be a “housekeeping” isoform in most tissues, but is expressed at high levels in epithelia with high rates of solute transport. The other isoforms have a more restricted distribution: α2 is found in muscle, adipose tissue, and brain; α3 is expressed in neural tissue and heart; and α4 is present in testis. The β subunit is essential for normal targeting and correct insertion of the α subunit into the cell membrane. In addition, the β subunit appears to have some influence on the catalytic properties of the enzyme, even though it is the α subunit that has the binding sites for Na+, K+, ATP, and ouabain ( Jaisser et al., 1994).
Although little is known about α4, the other α isoforms exhibit marked anatomic, developmental, and pathophysiologic diversity, suggesting that the α isoforms have different functional roles. Experiments in which single, defined α isoforms are transfected into cultured cells show that rat α isoforms differ in their sensitivity to ouabain: rat α1 is ouabain resistant (inhibited only by millimolar ouabain concentrations), whereas rat α2 and α3 are ouabain sensitive (completely inhibited by 1–5 μM ouabain). Nevertheless, work on transfected cells has been limited by techniques available for assessing functional differences (e.g., differences in affinity for Na+) among α isoforms. First, it is difficult to distinguish unambiguously the α2 and α3 isoforms in experiments on mammalian cells, which invariably express α1. Second, some assay systems consist of broken membranes, and thus are not “sided.” Third, even in sided preparations, previous transfection studies have not controlled intra- and extracellular ion concentrations independently. Such control is important because the Na-K pump rate depends on intracellular sodium concentration ([Na+]i) (Garay et al., 1973).
The objective of the present study was to measure the apparent K m for [Na+]i of the rat α1, α2, and α3 isoforms, transfected into human HeLa cells. One approach for assessing pump function would be to measure Na,K-ATPase activity. Such assays, however, are usually performed in broken (i.e., “unsided”) membranes. Other approaches would be to measure isotopic fluxes or pump current. However, [Na+]i usually cannot be measured in such experiments; [Na+]i must be clamped using a patch pipette or ionophores. Our approach was to use the Na+-sensitive dye SBFI (sodium-binding benzofuran isophthalate)1 (Minta et al., 1989; Harootunian et al., 1989) to monitor [Na+]i, and from these data compute a measure of the Na+ efflux (i.e., d[Na+]i/dt). We exploit a technique proposed by Negulescu and Machen (1990) for Na+ loading cells and using SBFI to monitor the subsequent rate of [Na+]i recovery (i.e., decrease).
We studied untransfected HeLa cells, as well as HeLa lines stably transfected with various rat α isoforms. All cells expressed the ouabain-sensitive, native human α1 subunit, as well as the native human β1 subunit of the Na-K pump. One line was stably transfected with rat α1, which is naturally ouabain resistant. Two other lines were transfected with rat α2 and α3 that had been mutagenized to render them ouabain resistant ( Jewell and Lingrel, 1991). Thus, we could use differential ouabain sensitivity to distinguish the transfected, ouabain-resistant rat α isoforms from the native, ouabain-sensitive human α1 pumps. Others have approached the question of whether the Na+ affinities of the pump isoforms are different using these cell lines ( Jewell and Lingrel, 1991; Munzer et al., 1994). We found that rat and human α1 isoforms have similar apparent K m values for [Na+]i, but that rat α2 and α3 have progressively higher K m values. Moreover, the cells expressing α3 had a very high resting [Na+]i.
materials and methods
Cells Studied
We used four HeLa-based cell lines (“Jewell-Lingrel cell lines”), three of which were transfected with rat α isoforms ( Jewell and Lingrel, 1991). All were kind gifts of Dr. Jerry Lingrel. The first was untransfected HeLa cells, which express only the human α1 Na,K-ATPase isoform. This isoform is ouabain-sensitive (>95% inhibition at 1 μM ouabain). The second HeLa cell line (α1-8G) was stably transfected with the unmodified, but naturally ouabain resistant, rat α1. The third line of HeLa cells (α2-2G) was transfected with a mutagenized rat α2 isoform of the Na-K pump, designated α2*. In this mutant isoform, two amino acid residues were changed so as to confer ouabain resistance (>95% inhibition at 4 mM ouabain). The fourth HeLa cell line (α3-5G) was stably transfected with a similarly mutagenized ouabain-resistant rat α3, termed α3*.
Cells were grown in DMEM plus 10% FCS supplemented with penicillin, streptomycin, and fungizone. The medium for the three cell lines transfected with rat α isoforms also contained 1 μM ouabain to inhibit the endogenous human α1 isoform, thereby applying selection pressure.
Solutions
Table I summarizes the composition of our solutions, all of which were made with ultrapure water (PICOpure water systems; Hydro Research, Triangle Park, NC). The pH was adjusted with HCl or NMDG (N -methyl-d-glutamate). The solutions for calibrating the intracellular dye had [Na+] values between 0 and 160 mM, and were made by mixing calibration buffers 1 (solution 4) and 2 (solution 5). The acetoxymethyl ester of SBFI was obtained from Molecular Probes, Inc. (Eugene, OR), and DMSO (dimethyl sulfoxide) from J.T. Baker, Inc. (Phillipsburg, NJ). Other chemicals were supplied by Sigma Chemical Co. (St. Louis, MO).
Table I.
Composition of Working Solutions
| Solution number | 1 | 2 | 3 | 4 | 5 | |||||
|---|---|---|---|---|---|---|---|---|---|---|
| Solution name | Standard buffer | Zero-Na+ buffer | Zero-K+ buffer | Calibration buffer 1 | Calibration buffer 2 | |||||
| NaCl | 150 | 0 | 150 | 0 | 30 | |||||
| Na gluconate | 0 | 0 | 0 | 0 | 130 | |||||
| KCl | 5 | 5 | 0 | 30 | 0 | |||||
| K gluconate | 0 | 0 | 0 | 130 | 0 | |||||
| NMDG | 0 | 153.6 | 8.6 | 3.6 | 3.6 | |||||
| CaCl2 | 1 | 1 | 1 | 1 | 1 | |||||
| MgSO4/7H2O | 1.2 | 1.2 | 1.2 | 1.2 | 1.2 | |||||
| PO4 | 0 | 2 | 2 | 2 | 2 | |||||
| Hepes | 32 | 32 | 32 | 32 | 32 | |||||
| Glucose | 10 | 10 | 10 | 10 | 10 | |||||
| NaH2PO4 | 2 | 0 | 0 | 0 | 0 | |||||
| Gramicidin | 0 | 0 | 0 | 10 μM | 10 μM | |||||
| Nigericin | 0 | 0 | 0 | 10 μM | 10 μM | |||||
| Monensin | 0 | 0 | 0 | 14.5 μM | 14.5 μM | |||||
| pH at 37°C | 7.40 | 7.40 | 7.40 | 7.10 | 7.10 |
Composition of solutions used. Entries are in millomolars unless otherwise specified. NMDG, N -methyl-d-glutamate.
Spectrofluorometry
We used a dual-beam spectrofluorometer (1681; SPEX Inc., Edison, NJ) to measure [Na+]i in a population of cells. Cells were grown on a 8-mm2 glass coverslip, which was inserted into a custom-designed ∼0.8-ml quartz flow-through cuvette. A thermistor in the cuvette permitted continuous temperature monitoring. The cuvette was continuously superfused with prewarmed medium delivered at 2.2 ml/min through water-jacketed Tygon tubing.
We grew the cells to 80–100% confluence, and then serum-starved them (0.5% FCS) 12 h before study. On the morning of the study, we loaded the cells with the Na-sensitive dye SBFI (Harootunian et al., 1989; Negulescu and Machen, 1990) as follows. The dye-loading solution was made by adding 7 μl DMSO and 7 μl of a Pluronic F-127 solution (20% in DMSO) to a vial containing 50 μg SBFI-AM. The vial was vortexed, and the contents diluted into 3 ml standard buffer (solution 1) at room temperature (RT). Coverslips were incubated in this solution at RT for 3–4 h, shielded from the light, with gentle agitation. Coverslips were then washed in standard buffer for 30 min at RT with agitation. A coverslip of dye-loaded cells was then inserted into the cuvette and an excitation scan obtained (excitation from 320 to 400 nM, emission at 505 nm). The coverslip was rejected if the excitation spectrum was not a smooth, skewed, bell-shaped curve with a peak intensity at ∼355 nM (characteristic of SBFI-free acid) (Harootunian et al., 1989), or if the peak intensity was not at least sixfold greater than that obtained from a coverslip of cells not loaded with dye.
We calculated [Na+]i as follows. First, we obtained fluorescence intensities at 505 nm, while exciting at either 340 or 380 nm. These I340 and I380 values were acquired continuously and sampled every 1.5–4.0 s. Second, we corrected these I340 and I380 values for the autofluorescence at the corresponding wavelengths, and computed the corrected I340/I380 ratio. Third, we converted these I340/I380 ratios to [Na+]i values using the data obtained from a two-point calibration performed at the conclusion of each experiment. In this calibration, we determined the I340/I380 ratio while exposing the cells to calibration buffers containing, first, 90 mM Na+ and, then, 0 mM Na+. For both buffers, the sum [Na+] + [K+] was 160 mM. To equalize [Na+]i and [Na+]o, we also included in the calibration buffers the monovalent cation ionophores gramicidin D (10 μM), nigericin (10 μM), and monensin (14.5 μM).2 (We show below that this ionophore combination did in fact equalize [Na+]i and [Na+]o.) As described in results, we used the I340/I380 ratios thus obtained at [Na+]i = 0 and 90 mM to convert the I340/I380 ratios obtained earlier in the experiment to [Na+]i values.
Although the majority of our experiments were done with the standard two-point calibration protocol described above, in the early stages of the project we performed some experiments with calibration procedures that differed in two ways. First, in some experiments, the high Na calibration buffer contained 30 instead of 90 mM Na+. For these experiments, we converted ratios to [Na+]i values using a formula slightly different from our standard one, exploiting data from multipoint calibration experiments (see results), which included both 30 and 90 mM Na+ data. This difference in calibration did not lead to appreciable differences in calculated [Na+]i values in the range between 0 and 50 mM (see Fig. 2, below), which includes virtually all of our data.
Figure 2.

Multipoint SBFI calibration in HeLa cells. SBFI-loaded, untransfected HeLa cells on glass coverslips were placed in a dual-beam spectrofluorometer and superfused with calibration buffers of varying [Na+], but a constant [Na+] + [K+] of 160 mM. pH was 7.10 at 37°C, to approximate intracellular pH. The calibration buffers contained three ionophores, as in Fig. 1, to equilibrate intra- and extracellular Na+. (A) Typical experiment showing effect of step changes in extracellular Na+ on SBFI fluorescence- excitation ratio (I340/I380). (B) Dependence of normalized fluorescence-excitation ratio ron [Na+]i. Ratios from eight experiments similar to the one shown in A were normalized to equal zero at [Na+] = 0 and 1 at [Na+] = 90, and then averaged. Error bars are omitted at the points for which they would have been smaller than the size of the symbol. The curve through the points is the result of a nonlinear least-squares fit for a right-rectangular hyperbola.
A second difference was that, in some early experiments, the calibration buffers contained gramicidin and nigericin, but not monensin. We later found that, although the two- and three-ionophore calibrations yielded the same I340/I380 ratios when [Na+]o was 0 mM, the two-ionophore method yielded lower ratios than the three-ionophore method when [Na+]o was 30–90 mM. This result suggested to us that gramicidin plus nigericin did not truly equilibrate [Na+]i with [Na+]o. As shown in results, however, our flame-photometry data confirmed that the three-ionophore method does indeed equilibrate [Na+]i with [Na+]o. Therefore, we performed additional experiments in which we sequentially perfused the cells with calibration buffer containing 90 mM Na+ and two ionophores, and then calibration buffer containing 90 mM Na+ and all three ionophores. We found that the addition of the third ionophore caused I340 and I380 to decrease by 4 and 7%, respectively. These results allowed us to correct I340 and I380 data in experiments in which we had calibrated with only two ionophores, thereby yielding accurate [Na+]i values.
As a confirmation that the above correction procedures were valid, we examined the ouabain-insensitive Na+ efflux (i.e., Na+ leak) in the various Jewell-Lingrel cell lines. Indeed, our corrected data were similar, regardless of whether the calibration buffer contained 30 or 90 mM Na+, or two or three ionophores.
Determination of [Na+]i by Flame Photometry
To independently validate our method for converting SBFI I340/I380 ratios to [Na+]i values, we used flame photometry to measure [Na+]i. Untransfected HeLa cells were grown in six-well tissue plates until 80–100% confluent. Three wells of each six-well plate were used for measuring extracellular and intracellular volume (ECFV, ICFV), with the other three wells being used for flame photometry measurements of total Na. All cells were incubated in calibration buffers containing gramicidin, nigericin, and monensin, and varying [Na+] as noted above. For the ECFV and ICFV determinations, the solutions also contained 14C-inulin and 3H-H2O (Amersham Corp., Arlington Heights, IL).
At the start of each of these experiments, we aspirated the culture medium and rinsed each well twice with 1 ml of the calibration buffer (prewarmed to 37°C) containing the selected [Na+] (0–90 mM). After aspirating the second of these 1-ml rinses, we added 1 ml of the selected calibration buffer to each well and placed the six-well plates in a sealed vessel containing a tray of buffer to minimize evaporation. We placed this vessel in a 37°C incubator for 1–2 h. We next took samples of the solution (i.e., ECF) in each well for subsequent scintillation counting. Next, we rinsed each well twice with 1 ml ice-cold choline chloride (160 mM) to minimize contamination by the original calibration buffer. Then, we added 0.5 ml lysis solution (Triton X-100, 0.5%) to each well and allowed cell lysis to proceed overnight with gentle shaking. We then scraped up and suspended any material adherent to the well, and aspirated this suspension. We rinsed the well with an additional 0.5 ml lysis solution, which we combined with the aspirate and centrifuged for 5 min at 15,000 rpm, discarding the pellet (Munzer et al., 1994).
We placed aliquots of samples containing isotopes in scintillation vials and counted them in a Tri-Carb 1600 TR (Packard Instrument Co., Inc., Downers Grove, IL). We separated counts for 14C and 3H using a channels-ratio method. We diluted the nonradioactive lysate samples (as needed), and measured [Na+] in a flame photometer (400; Corning Glass Works, Corning, NY). We also assayed by flame photometry buffer samples taken from each well at the conclusion of the incubation, as well as samples of unused calibration buffer, lysis solution, and ultrapure water in duplicate or triplicate.
In calculating [Na+]i, we assumed that the cell lysate represents ICF, contaminated with some ECF. Because 14C-inulin distributes only in the ECF, the ECFV of the lysate is equal to the 14C-cpm in the cell extract divided by the 14C-cpm/μl of buffer sample. Because 3H-H2O labels all the water in the sample, the corresponding quotient for 3H-cpm represents ECFV + ICFV. The [Na+] of the ECF, as well as the Na+ content (in micromoles) of the cell lysate, are known from flame photometry. Combining this information with the known ECF and ICF volumes allows calculation of the [Na+] of the ICF.
Immunoblotting
We prepared crude microsomes from cells grown to confluence as previously described (Zahler et al., 1996). The specific activity of Na,K-ATPase in such preparations from untransfected HeLa cells was ∼24 μmol Pi/mg protein per h. We loaded equal amounts (10–30 μg) of microsomal protein on 7% SDS polyacrylamide gels, performed electrophoresis, and transferred the proteins electrically to Immobilon-P membranes (Millipore Corp., Bedford, MA) as previously described (Zahler et al., 1996). We performed immunoblots using a 1:500 dilution of a monoclonal antibody (anti–LEAVE) raised to a pentapeptide (KNCLVKNLEAVE) common to the α1, α2 and α3 isoforms (Pressley, 1992) (kind gift of Dr. T. Pressley). We quantitated the results by including titrated amounts of SY5Y microsomal protein on each blot, measuring band intensity using densitometric scanning, and deriving from this a region where band intensity was a linear function of the amount of protein loaded (Lucchesi and Sweadner, 1991).
Data Analysis
Results are displayed as mean±SEM. Curve fits were performed using DeltaGraph 4.0 and Systat 5.1 for Macintosh. We used two approaches for analyzing data for Na+ dependence of pump flux. First, data were fitted by the highly cooperative model (Garay et al., 1973; Jewell and Lingrel, 1991)
 |
1 |
where K m = (K′)1/3 (Jewell and Lingrel, 1991), and the exponent is three because there are three Na+ binding sites. This method is has been used by previous investigators studying the Na+ dependence of pump flux in transfected cells (Munzer et al., 1994).
The second approach, feasible because our data had high resolution on the [Na+]i axis, was to fit to a cooperative model with variable Hill coefficient:
 |
2 |
where b is the Hill coefficient.
We also wished to determine statistically whether the effluxes in the presence of different ouabain concentrations were significantly different. Because the efflux data are heteroscedastic (standard errors are not random, but increase as [Na+]i increases; see Fig. 5), they are not well suited for evaluation by standard regression methods. Accordingly, we logarithmically transformed the data; the log effluxes were close to a linear function of [Na+]i, with uniform standard errors. We tested for equality of the slopes and intercepts of these linear regression lines. Finally, we tested for interisoform differences in the affinity constants for [Na+]i derived from the fitted curves using chi-square analysis and the asymptotic standard errors of estimate of the affinity constants.
Figure 5.
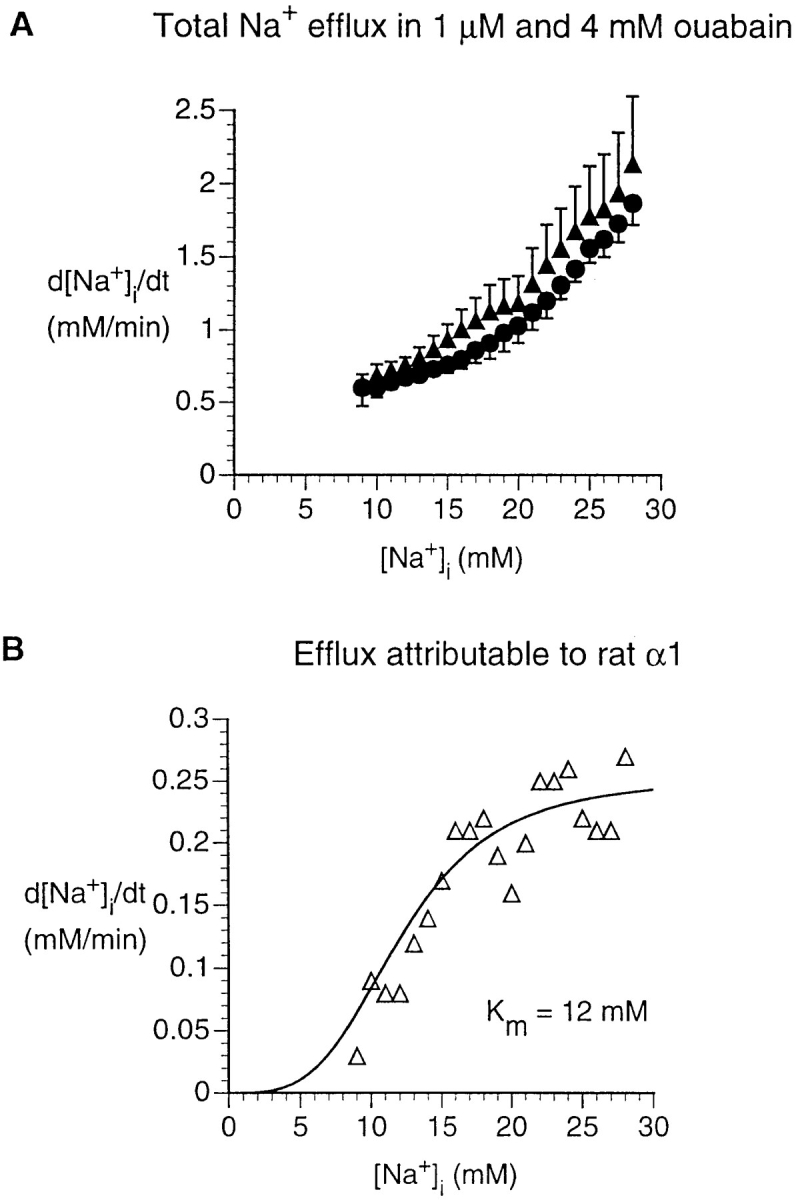
Na+ efflux in HeLa cells transfected with rat α1. (A) Dependence of rate of [Na+]i decrease on [Na+]i, computed from experiments similar to that shown in Fig. 3, but for cells transfected with rat α1. Data were obtained in the presence of either 1 μM ouabain (▴, n = 5) or 4 mM ouabain (•, n = 3). d[Na+]i/dt was calculated as in Fig. 4. Statistical analysis (see methods) shows that, whereas the slopes of the two curves (when logarithmically transformed) are not significantly different, the intercepts are significantly different (P < 0.001). (B) [Na+]i dependence of the Na+ efflux attributable to the rat α1 pump. The d[Na+]i/dt in the presence of 4 mM ouabain is interpreted as the Na+ leak, whereas the d[Na+]i/dt in the presence of 1 μM ouabain is interpreted as sum of the leak and the efflux mediated by the ouabain-resistant rat α1 pump (because 1 μM ouabain inhibits the endogenous HeLa-cell human α1 pumps). Thus the difference, shown in B, represents the efflux mediated by the rat α1 pump. The data were fit with a cooperative model with variable Hill coefficient (Eq. 2).
results
Validation of Ionophore Technique Used for Equilibrating Extracellular and Intracellular [Na+]
As described in methods, we incubated untransfected HeLa cells in calibration buffers containing three ionophores (gramicidin, nigericin, and monensin) and various levels of [Na+], with and without 14C-inulin and 3H-H2O. Scintillation counting showed that ECFV and ICFV were approximately equal, increasing the reliability of the calculation of [Na+]i. Combining these data with flame-photometry data for total Na+, we computed [Na+]i. As shown in Fig. 1, incubation with the three ionophores causes intracellular and extracellular [Na+] to become essentially equal over a wide range of [Na+]o values.
Figure 1.

Validation of ionophore technique for equalizing intra- and extracellular [Na+]. Untransfected HeLa cells grown in six-well tissue culture plates were incubated in buffers having a range of [Na+] values, and containing gramicidin D (10 μM), nigericin (10 μM), and monensin (14.5 μM). One set of wells contained 14C-inulin and 3H-H2O for measuring intra- and extracellular volume. A paired set was subjected to flame photometry for measuring total Na+. In five experiments, we sampled solution in each well at the conclusion of the incubation period, measuring [Na+] by flame photometry; [Na+] in these samples was within 2% of the [Na+] of the initial buffer. Each symbol represents the mean of three to seven pairs of wells. Error bars are omitted at the point for which they would have been smaller than the size of the symbol.
Multipoint Calibration of SBFI
Alternately exciting at 340 and 380 nm, while monitoring the emission at 505 nm, we determined the response of the I340/I380 fluorescence–excitation ratio to defined perturbations of [Na+]i using gramicidin, nigericin, and monensin to equilibrate [Na+]i with [Na+]o. A typical multipoint calibration experiment for SBFI in HeLa cells is shown in Fig. 2 A, where the I340/I380 ratio appears to closely track [Na+]o. Accordingly, we combined such multiple experiments and analyzed the resulting I340/I380 vs. [Na+] data, as follows.
Let r ([Na+]i) be the I340/I380 ratio as a function of [Na+]i. Then we define the normalized fluorescence– excitation ratio as
 |
3 |
where r (0) and r (90) are the ratios when [Na+]i is 0 and 90 mM, respectively. This transformation forces r to be zero when [Na+]i is 0, and 1 when [Na+]i is 90 mM. Combining data from eight similar experiments, we then calculated  as a function of [Na+]. The results, shown by the symbols in Fig. 2
B, indicate that the normalized I340/I380 ratio rises monotonically with [Na+]i. The tight confidence intervals (average SEM, 2.6 mM Na) indicate that changes in [Na+]i of 3 mM or less can be routinely detected. Finally, we fitted these data with a right rectangular hyperbola, obtaining the curve shown in Fig. 2
B. Rearranging the equation for this hyperbola, we can compute [Na+]i from the normalized ratio:
as a function of [Na+]. The results, shown by the symbols in Fig. 2
B, indicate that the normalized I340/I380 ratio rises monotonically with [Na+]i. The tight confidence intervals (average SEM, 2.6 mM Na) indicate that changes in [Na+]i of 3 mM or less can be routinely detected. Finally, we fitted these data with a right rectangular hyperbola, obtaining the curve shown in Fig. 2
B. Rearranging the equation for this hyperbola, we can compute [Na+]i from the normalized ratio:
 |
4 |
Measurement of Basal [Na+]i
We determined the basal [Na+]i for each of the cell lines by incubating the cells in standard buffer until the I340/I380 ratio reached a steady state, and then immediately calibrating. The results are shown in Table II. The basal [Na+]i value is 18.6 mM in untransfected HeLa cells, as compared with the value of 13 mM found by Boardman et al. (1974) in HeLa cells (see discussion). The basal [Na+]i for the α3-transfected cells, 50.3 mM, was significantly greater (P < 0.05 by ANOVA, Scheffé multiple comparison test) than the corresponding values for the other Jewell-Lingrel cell lines.
Table II.
Basal [Na+]i Values in Jewell-Lingrel Cell Lines
| Isoform transfected | Basal [Na+]i | n | ||
|---|---|---|---|---|
| None | 18.6 ± 4.6 | 5 | ||
| α1 | 11.5 ± 5.6 | 3 | ||
| α2 | 13.4 ± 2.7 | 6 | ||
| α3 | 50.3 ± 6.0 | 7 |
Basal [Na+]i values were determined in untransfected HeLa cells and in HeLa-based Jewell-Lingrel cell lines. Values are in millimolars. The value for the α3-transfected cells is significantly different (P < 0.05) from those for the other cell lines by ANOVA (Scheffé multiple comparison test).
Measuring [Na+]i Dependence of Na-K Pump Flux in Untransfected HeLa Cells
We determined the [Na+]i dependence of the Na-K pump flux using an approach described by Negulescu and Machen (1990). We obtained the pump flux as a function of [Na+]i because the Na-K pump activity is sensitive to [Na+]i, which it directly modulates. As shown in Fig. 3, we first Na+-loaded untransfected HeLa cells (which have only native, human α1 subunits) by incubation in zero-K+ buffer (segment ab). We then removed extracellular Na+, and simultaneously raised the [K+]o to 5 mM, while monitoring [Na+]i as Na+ left the cells (bc). When the I340/I380 ratio fell sufficiently, we performed a two-point calibration as described above (cd and de). In Fig. 3, ouabain was present during abc at a concentration (1 μM) high enough to completely inhibit the HeLa cell Na,K-ATPase ( Jewell and Lingrel, 1991). Thus, the Na+ efflux during bc represents the Na+ efflux mediated by “leak” pathways as a function of [Na+]i. In other experiments (not shown), ouabain was absent during abc so that the Na+ efflux during the equivalent of bc represented the Na+ efflux mediated both by the Na-K pump and leak pathways.
Figure 3.

Measurement of Na+ efflux. Untransfected HeLa cells were loaded with SBFI, and then I340/I380 data pairs were acquired continuously. Cells were exposed first to zero-K+ buffer (solution 3; segment ab), and then to zero-Na+ buffer (solution 2; segment bc), and finally to two different calibration buffers (mixed from solutions 4 and 5; cd and de). [Na+]i values were computed from I340/ I380 ratios, the calibration data from this experiment, and Eq. 4. Because the calibration buffers in this experiment contained two ionophores, we applied a correction (see methods) so that the computed [Na+]i values were comparable with those in experiments with three ionophores.
We then numerically differentiated the time course of decrease in [Na+]i (Fig. 3, segment bc) to yield d[Na+]i/dt as a function of [Na+]i. Fig. 4 A shows the results of this analysis both for experiments conducted in the presence (•) and absence of ouabain (▪). As expected, Na+ efflux was considerably higher in the absence of ouabain than in its presence, and the two curves are significantly different (P < 0.002). Moreover, the efflux was similar in low (1 μM) and high (4 mM) ouabain concentrations in this cell type (not shown), as would be expected, given the high ouabain affinity of the native human α1 in untransfected HeLa cells. From Fig. 4 A, we obtained the activation curve of the Na-K pump as a function of [Na+]i by subtracting the efflux in the presence of ouabain from the efflux in the absence of ouabain (Fig. 4 B). This activation curve indicates an apparent K m of 12 mM (fit with variable Hill coefficient, Eq. 2). Others, employing various methods, have obtained similar values: 16 mM in rat brain synaptosomes (Brodsky and Guidotti, 1990), and ∼10 mM in human erythrocytes (Garay and Garrahan, 1973).
Figure 4.

Na+ efflux in untransfected HeLa cells. (A) Dependence of rate of [Na+]i decrease on [Na+]i, computed from experiments similar to that shown in Fig. 3. Data were obtained either in the absence of ouabain (▪, n = 7), or with 1 μM or 1 mM ouabain added to the zero-K+ and zero-Na+ buffers (•, n = 9). d[Na+]i/dt was calculated from the time course of [Na+]i decline in the presence of zero-Na+ buffer (Fig. 3, segment bc). These calculations were performed at [Na+]i intervals of 1 mM. Statistical analysis (see methods) shows that the two curves are significantly different (P < 0.002). (B) [Na+]i dependence of the Na+ efflux attributable to the Na-K pump. The d[Na+]i/dt in the presence of ouabain is interpreted as the Na+ leak, whereas the d[Na+]i/dt in the absence of ouabain is interpreted as sum of the leak and the flux mediated by the Na-K pump. Thus the difference, shown here, represents the pump-mediated efflux. Data were fit with a cooperative model with variable Hill coefficient (Eq. 2).
Although we obtained d[Na+]i/dt data for [Na+]i values larger than 20 mM in the untransfected HeLa cells and the other Jewell-Lingrel cell lines, we found that values obtained immediately after the switch from zero-K+ buffer to zero-Na+ buffer, when [Na+]i was high and falling very rapidly (just after point b in Fig. 3), varied widely from experiment to experiment. A major reason for this variability is the inherent difficulty in computing accurate numerical derivatives (d[Na+]i/ dt) of digital data when [Na+]i is falling rapidly, because the tangent line is fitted to fewer data points. We thus chose to restrict the analysis to [Na+]i ranges in which the d[Na+]i/dt data were reproducible. Therefore, in each experiment, we identified the inflection point in the d[Na+]i/dt versus [Na+]i tracing, and analyzed only data for [Na+]i values lower than the inflection point. This approach had the practical effect of limiting the range of usable data to [Na+]i values from 0 through 30–35 mM.
Measuring [Na+]i Dependence of Flux Attributable to Exogenous Isoforms in Cells Transfected with Ouabain-resistant Pumps
For these experiments, we modified the above protocol to exploit the large difference in ouabain affinities between the native and the transfected Na-K pumps. We loaded cells with Na+ as above, and then exposed them to a 0-Na+/5-mM-K+ buffer (solution 2). In each case, we performed these two maneuvers either in the absence of ouabain, or at low (1 μM) or high (4 mM) ouabain concentrations. We interpreted the corresponding Na+ effluxes, calculated as d[Na+]i/dt, as follows:
| In presence of: | Na efflux represents: |
| high [ouabain] | Na+ leak |
| low [ouabain] | leak + resistant pump rate |
| no ouabain | leak + total pump rate |
Here, “resistant” pumps refers to the transfected rat isoforms, whereas the “sensitive” pumps are the human α1 isoforms endogenously expressed in HeLa cells. In a generalization of the above approach (Figs. 3 and 4), we subtracted high from low ouabain data, obtaining the activation curve of the resistant (i.e., rat) Na-K pump isoform as a function of [Na+]i. Similarly, subtracting low from zero ouabain data yields the activation curve of the sensitive (i.e., human) Na-K pump isoform.
Rat α1
We studied cells transfected with the rat α1 isoform, which is naturally ouabain resistant, at low and high ouabain concentrations (Fig. 5 A). The difference between these two Na+ effluxes represents the activity of the transfected rat pumps. As shown in Fig. 5 B, the maximal Na+ efflux attributable to the transfected rat α1 pumps was ∼0.25 mM/min, considerably less than that of the native human α1 pumps in untransfected HeLa cells, ∼0.64 mM/min (Fig. 4). This difference may be related to a relatively small number of exogenous pumps. The exogenous rat α1 pumps had apparent K m for [Na+]i of 12 mM, similar to that for the endogenous human α1 pumps in the transfected HeLa cells (Table III).
Table III.
Curve Fits
| Human α1 in untransfected HeLa cells | Human α1 in HeLa cells transfected with α3* | Rat α1 | Rat α2* | Rat α3* | ||||||
|---|---|---|---|---|---|---|---|---|---|---|
| Fit with variable Hill coefficient | ||||||||||
| Apparent K m (mM) | 12 | 13 | 12 | 22 | 33 | |||||
| Vmax (mM/min) | 0.64 | 0.36 | 0.25 | 1.8 | 2.5 | |||||
| Hill coefficient | 6.0 | 5.9 | 3.5 | 4.8 | 6.8 | |||||
| Fit with fixed Hill coefficient = 3 | ||||||||||
| Apparent K m (mM) | 17 | 16 | 12 | 33 | 44 | |||||
| V max (mM/min) | 1.2 | 0.52 | 0.27 | 3.7 | 3.8 |
Rat α2*
To study the rat α2* isoforms, we again compared experiments in α2*-transfected cells exposed to low and high ouabain concentrations (Fig. 6 A). The activation curve for Na+ efflux attributable to this mutated rat isoform had an apparent K m of 22 mM (Fig. 6 B). The maximal Na+ efflux attributable to the transfected rat α2* isoform was 1.8 mM/min, considerably greater than that for the transfected rat α1 (Table III).
Figure 6.
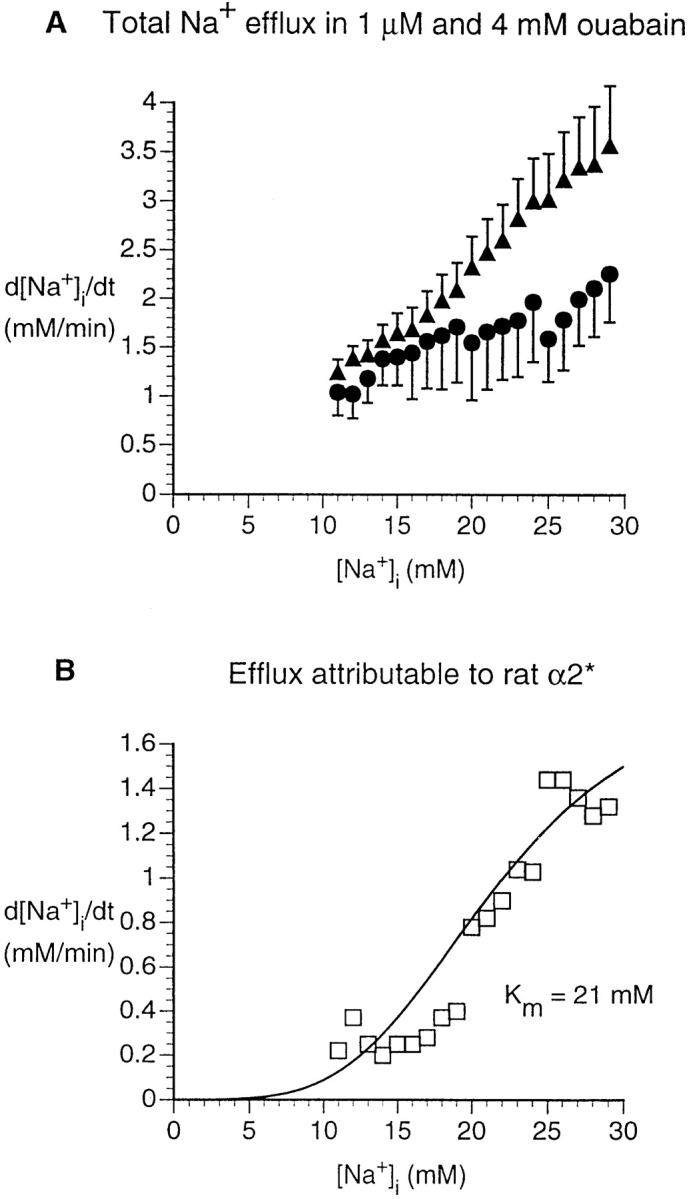
Na+ efflux in HeLa cells transfected with rat α2*. (A) Dependence of rate of [Na+]i decrease on [Na+]i, as in Fig. 5 (1 μM ouabain, ▴, n = 7; 4 mM ouabain, •, n = 7). Statistical analysis shows that the two curves are significantly different (P < 0.001). (B) Na+ efflux attributable to the rat α2* pump was calculated as in Fig. 5.
Rat α3*
We studied cells transfected with α3* (Fig. 7, A and B) in the same manner as for α1 and α2*. In the case of the α3*-transfected cells, the computed V max for the efflux attributable to α3* was ∼2.5 mM/min. More significantly, the activation curve (Fig. 7 B) is substantially shifted to the right, compared with the other isoforms studied. Fitting the α3*-flux data in Fig. 7 B using a cooperative model with a Hill coefficient of three (Eq. 1) (Garay et al., 1973) yielded a K m of ∼44 mM. This fit, however, is problematic for two reasons. First, the efflux is not above zero until [Na+]i is above ∼16 mM. Second, although there is a suggestion of saturation at an [Na+]i of ∼40 mM, we were unable to obtain data at higher [Na+]i values. Studying the same α3*-transfected cells with a different approach, Munzer et al. (1994) also noted that the α3* flux did not begin to increase until [Na+]i was above ∼22 mM. Their flux data, plotted as a function of [Na+]i, did not appear to saturate. Because our approach generated many more data points than that of Munzer et al. (1994), however, we were able to fit our data using a model with a variable Hill coefficient. The result was a much better fit than the model with a fixed Hill coefficient, and a K m of ∼33 mM.
Figure 7.
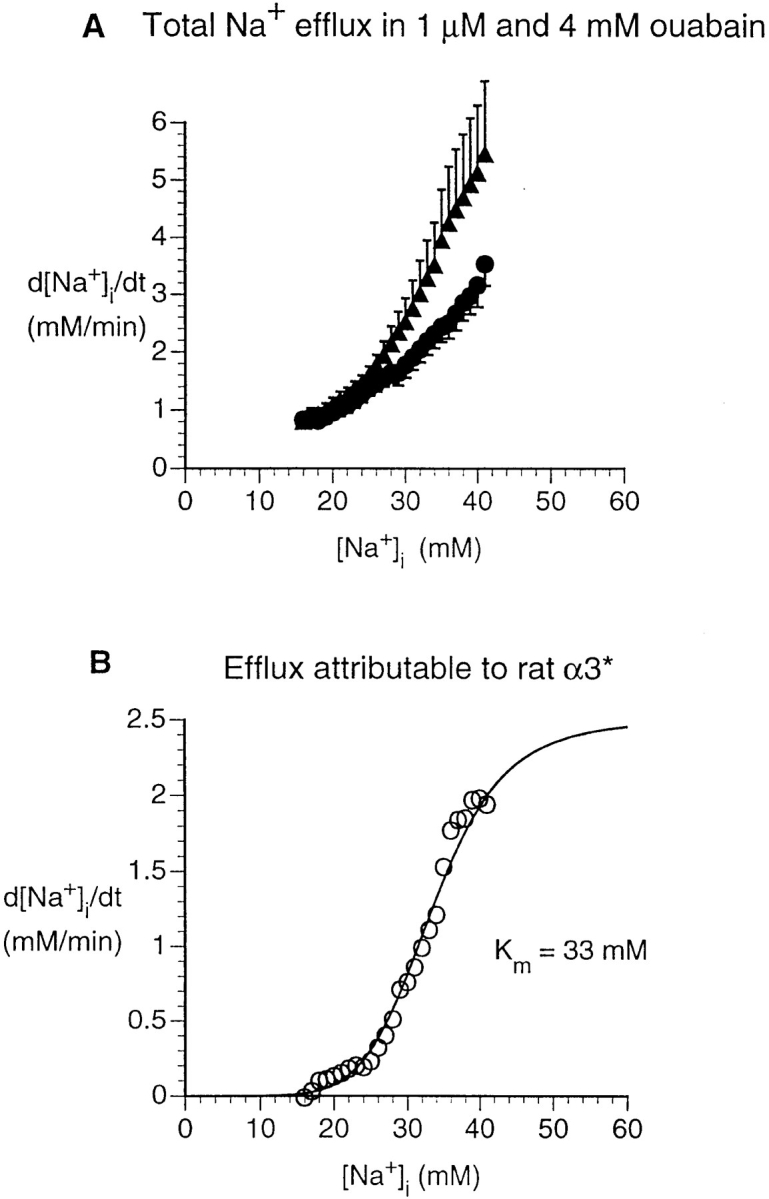
Na+ efflux in HeLa cells transfected with rat α3*. (A) Dependence of rate of [Na+]i decrease on [Na+]i, as in Fig. 5 (1 μM ouabain, ▴, n = 10; 4 mM ouabain, •, n = 10). Statistical analysis shows that the two curves are significantly different (P < 0.001). (B) Na+ efflux attributable to the rat α3* pump was calculated as in Fig. 5.
For the sake of comparison, we replotted the activation curves for the three transfected isoforms on the same axes (Fig. 8), normalizing the maximal pump flux for each isoform to unity. The K m values are in the sequence ∼12, ∼22, and ∼33 mM for the rat α1, α2*, and α3* isoforms, respectively. To assess whether these values represent true interisoform differences in affinity for [Na+]i, we tested the Na+ efflux curves for human α1, rat α2*, and rat α3* (Figs. 4 B, 6 B, and 7 B) against the corresponding curve for rat α1, using chi-square analysis for heterogeneity. Rat α2* and rat α3* were significantly different from rat α1 (P values < 0.001 and 0.005, respectively), but human α1 was not significantly different from rat α1 (P > 0.75). We also computed asymptotic standard errors of estimate for the affinity constants, and tested whether they were significantly different. The results were as follows: rat α2* vs. rat α1, P < 0.005; rat α3* vs. rat α1, P < 0.0005; rat α3* vs. rat α2*, P < 0.0005; human α1 vs. rat α1, not significant.
Figure 8.

Comparison of apparent Na+ affinities of three rat α isoforms. Because of differences in transfection efficiency and, perhaps, in maximal intrinsic pumping rate, the activation curves of the rat α isoforms shown in B of Figs. 5–7 are difficult to compare. Hence we normalized the maximal pump flux for each isoform to 1 and plotted the data for the three isoforms on the same axes. ▵, rat α1; □, rat α2*; ○, rat α3*.
Human α1 in HeLa Cells Transfected with Rat α3*
In the cells transfected with rat α3*, we also measured the efflux attributable to the endogenous human α1 isoform. The apparent K m for the human α1 isoform was 13 mM (Fig. 9 A and Table III), in close agreement with the K m for human α1 measured in untransfected HeLa cells, 12 mM. The maximal Na+ efflux attributable to the α1 isoform in α3*-transfected cells (⋄ in Fig. 9 B) was only 56% as great as in the control HeLa cells (+ in Fig. 9 B), suggesting that transfection of (mutated) α3 pumps leads to a compensatory decrease in endogenous α1 pumps. Indeed, in the HeLa cells transfected with rat α2*, the Na efflux attributable to the native α1 was unmeasurably low (not shown). As shown in Fig. 9 C, the K m values were indistinguishable for human α1 in untransfected HeLa cells, for human α1 in α3*-transfected HeLa cells, and for rat α1.
Figure 9.
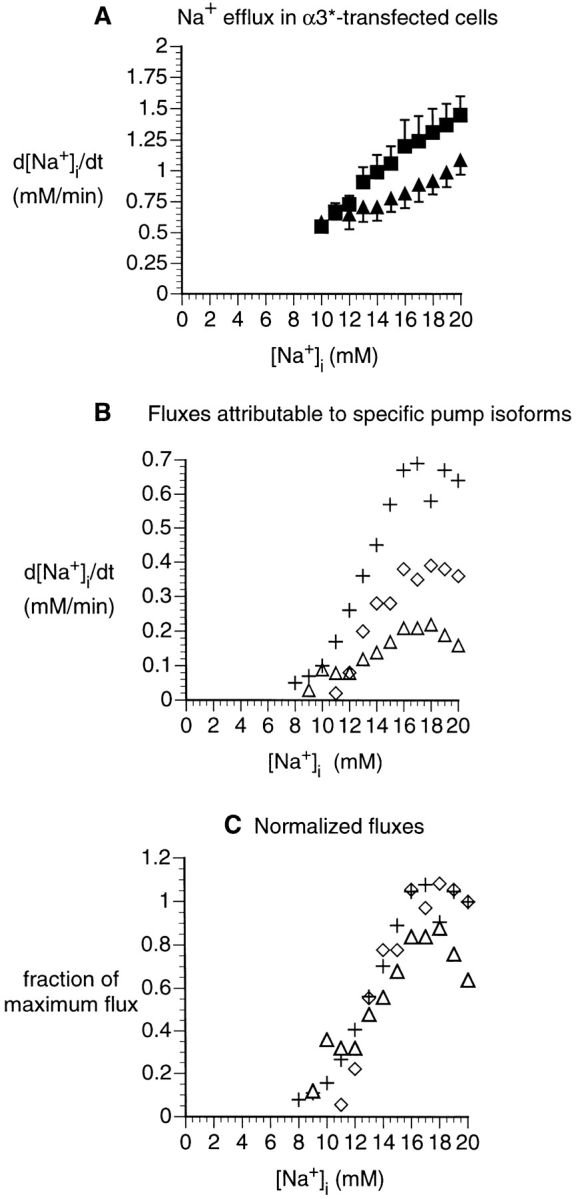
Comparison of Na+ effluxes attributable to human or rat α1 pumps in three cell lines. (A) Dependence of rate of [Na+]i decrease on [Na+]i, computed for α3*-transfected cells, from experiments similar to that shown in Fig. 7. Data were obtained either in the absence of ouabain (▪, n = 7), or with 1 μM ouabain (▴, n = 10). Statistical analysis (see methods) shows that the two curves are significantly different (P < 0.05). (B) [Na+]i dependence of the Na+ efflux attributable to the various α1 pumps. ⋄ represents the Na+ efflux attributable to the ouabain-sensitive pumps (native human α1 pumps) in the α3*-transfected HeLa cells. These values are computed from the data in A, assuming that the d[Na+]i/dt in 1 μM ouabain is the sum of the leak and the flux mediated by the ouabain-resistant rat α3* pump transfected into the cells, and that the d[Na+]i/dt in the absence of ouabain is the sum of the leak and the efflux mediated by both the native and transfected pumps. The [Na+]i dependencies of human α1 in untransfected HeLa cells (+, replotted from Fig. 4) and of rat α1 (▵, replotted from Fig. 5) are shown for comparison. (C) [Na+]i dependence of the Na+ efflux attributable to the various α1 pumps, with effluxes for each pump normalized to unity.
Estimation of Maximal Turnover Rate per Pump Site
Because of differences in transfection efficiency and, perhaps, in maximal intrinsic pumping rate, one must be cautious in comparing the activation curves of the rat α isoforms shown in B of Figs. 6–8. We thus sought to measure the number of pump sites of each isoform type in the transfected cells. Although pump-site quantitation is customarily done using 3H-ouabain binding, this technique is not feasible for rat α1, α2*, and α3* pumps because they are highly ouabain resistant. Instead, we measured the total amount of Na-K α-isoform protein using quantitative immunoblotting with anti–LEAVE (see methods), an antibody raised against an epitope common to the three Na-K pump α isoforms (Pressley, 1992).
The immunoblots showed a single major band with an apparent molecular mass of 100 kD, as previously described (Pressley, 1992). Using densitometric scanning referred to a standard curve on each blot, we found that the total Na-K pump immunoreactivity in microsomes from the α2*-transfected HeLa cells was 97% of that in untransfected HeLa cells (n = 3 determinations) and that of α3*-transfected cells was 93% of that in untransfected HeLa cells (n = 2). The pump-mediated Na+ efflux we measured in α2*-transfected cells was ∼2.8× that in untransfected HeLa cells, and the efflux in α3*-transfected cells was ∼4.5× that in untransfected HeLa cells. If we assume that the antibody recognizes all pumps equally well, and that an equal fraction of all immunoreactive pumps is at the plasma membrane in all cell lines, then it would appear that the transfected pumps have a higher intrinsic turnover rate than the native pumps. For example, if the activity per human α1 is the same in untransfected and α3*-transfected HeLa cells, the maximal activity per rat α3* pump would be 8.7-fold greater than that of human α1.
discussion
Advantages of Spectrofluorometry for Measuring Na+ Fluxes Mediated by the Na-K Pump
We have demonstrated that the Na+-sensitive dye SBFI can be used to measure the Na+ flux attributable to specific Na-K pump α isoforms, as a function of [Na+]i, in intact transfected cells. A special advantage of our spectrofluorometric approach is that we were able to study Na-K pump fluxes in a sided preparation with independent control over [Na+]i and [Na+]o. Additional advantages are that [Na+]i and d[Na+]i/dt were obtained simultaneously, and with good resolution for both [Na+]i and time. Measuring the fluxes at specific [Na+]i values is crucial because the Na-K pump flux is steeply [Na+]i dependent, and because many experimental interventions change both pump flux and [Na+]i simultaneously. To our knowledge, this is the first study of specific Na-K-pump isoforms in a sided preparation permitting independent control of [Na+]i and [Na+]o, the first systematic investigation of pump-mediated Na+ fluxes by means of spectrofluorometry, the first use of SBFI to study [Na+]i in transfected cells, and the first validation of an in vivo SBFI calibration using an independent method for measuring [Na+]i.
Summary of Results
Implications of Km values.
Our data indicate that the rat α3* isoform has a K m for [Na+]i that is more than threefold greater than that of rat α1. Rat α2* has an intermediate affinity. The Na-K pump ought to be most effective at clamping [Na+]i when the K m of the pump is close to [Na+]i. The existence of an α3 isoform with such a high K m might help prevent [Na+]i from rising excessively in cells subjected to high Na+ influxes (e.g., excitable cells during electrical activity). This advantage, however, would accrue only if the extra expression of α3 increased the total number of Na-K pumps, or if the α3 pumps had a higher turnover number. Alternatively, expression of α3, with its high K m, would cause the cell to have a high steady state [Na+]i, as we indeed observed. Such a high [Na+]i might be advantageous because it would reduce ATP use.
Our data also indicate that the K m values for the endogenous human α1 and transfected rat α1 are almost identical, even though the former is 1,000× more sensitive to ouabain than the latter, This similarity in K m values is consistent with the notion that the structural elements of the pump that determine ouabain binding (Lingrel and Kuntzweiler, 1994) can be modified independently of those that determine the K m for internal Na+.
Inverse relation between expression of endogenous and transfected pumps.
We also found that transfection of rat α2* or α3* pumps leads to a compensatory decrease in the activity of endogenous human α1. These observations are consistent with previous evidence that the total number of Na-K pump units expressed per cell is tightly regulated (Boardman et al., 1972; Fambrough et al., 1987; Pressley, 1992).
Earlier Work on Na+ Affinity of Pump Isoforms
To study the K m of the Na-K pump for intracellular Na+ (K m[Na+]i), it would be best to use a “sided” preparation in which one could control [Na+]i and [Na+]o independently, and thus vary the parameter of interest (i.e., [Na+]i) while leaving other relevant parameters (e.g., [Na+]o) fixed. Such an approach has previously been used only to study the native Na-K pumps of erythrocytes (e.g., Garay et al., 1973) and squid axons (e.g., Brinley and Mullins, 1967).
Pump isoforms in native tissues.
Varying [Na+]i while equalizing it to [Na+]o yields what might be called an “unsided” K m for Na+, K m[Na+]u. 86Rb fluxes in rat-brain synaptosomes, obtained in the presence of low and high ouabain concentrations, yielded apparent K m[Na+]u values of 17 mM for α1 and 49 mM for α2 plus α3 (Brodsky and Guidotti, 1990), consistent with our K m[Na+]i data. In contrast, ATPase assays on rat axolemma, which predominantly have the α3 isoform (Sweadner, 1985) and the pineal gland, which is predominantly α3β2 (Shyjian et al., 1990), yielded K m[Na+]u values that were lower than for kidney, which is predominantly α1.
Pump isoforms in transfected nonmammalian cells.
Several groups have studied Na-K pump physiology by transfecting cloned Na-K pump isoforms into mammalian cells. However, measuring K m[Na+] in such cells is complicated by the presence of the endogenous α1 isoform in mammalian cell lines. One way of circumventing this problem is to express mammalian α1 in nonmammalian cells that have little endogenous Na-K pump activity, such as Sf-9 insect cells (Blanco et al., 1993) or yeast (Horowitz et al., 1990). Thus, in membranes obtained from yeast cells transfected with α1β1, the K m[Na+]u for the Na,K ATPase activity was 9.3 mM, similar to the K m[Na+]i value we obtained for intact, untransfected HeLa cells, which also express α1β1 (Eakle et al., 1995).
Jewell-Lingrel cell lines: Km[Na+]u in membrane preparations.
Jewell and Lingrel (1991) circumvented the problem of endogenous Na-K pumps by transfecting ouabain-resistant pumps into cells whose native pumps are ouabain sensitive. Using differential ouabain sensitivity in crude plasma membranes from such cells, those authors found that the K m[Na+]u for the Na,K-ATPase activities of the transfected rat α1, α2*, and α3* isoforms were 3.5, 3.3, and 7.8 mM, respectively.3 Although these values are substantially lower than ours, both studies conclude that the K m for α3 is greater than that for the other isoforms. The difference in magnitude may reflect the use of an unsided vs. a sided preparation.
Jewell-Lingrel cell lines: immunoblotting and total Na,K-ATPase activity.
Putnam et al. (1994) immunoblotted the Jewell-Lingrel cell lines with an antibody that cross-reacts with human and rat α1, and also measured Na,K-ATPase activity. They found that transfecting with rat α1 or α2* decreases expression of immunoreactive α1, and that transfecting with rat α1, α2*, or α3* reduces ATPase activity of endogenous α1. These results are consistent with our efflux measurements. Putnam et al. also found that all three transfected lines had about half the total Na,K ATPase activity of untransfected HeLa cells. This result is at odds with our data, which show that the total Na-K pump flux was higher in the α2*- and α3*-transfected lines. The discrepancy could reflect either differences in assay methods (i.e., ATPase activity vs. flux), or in pump localization (total pumps vs. those in the plasma membrane).
Jewell-Lingrel cell lines: Km[Na+]u in intact cells in presence of monensin.
Munzer et al. (1994) studied the [Na+]i dependence of the pump-mediated 86Rb+ influx, using monensin as a tool to change [Na+]i in response to changes in [Na+]o. K m[Na+]u values derived by Munzer et al. (1994) from fitting their data to a cooperative three-site model are shown in Table IV (column 2). More recently, considering the competition between intracellular Na+ and K+ for cytoplasmic Na+ binding sites of the Na,K-ATPase in these transfected cells (Therien et al., 1996), this group revised its estimates for K m[Na+]u (column 3). Our K m[Na+]i values, obtained from the same Jewell-Lingrel cell lines, are similar to the K m[Na+]u values published by Therien et al. (1996). They concluded that the K m[Na+]u values are in the sequence α1 α2* < α3*, whereas our data indicate that the sequence is α1 < α2* < α3*.
Table IV.
Comparison between Pump-mediated Na+ Efflux Data in Jewell-Lingrel Cell Lines, as Measured in This Study and in Previous Publications
| Isoform transfected | K m for [Na+]i | Relative V max | Basal [Na+]i | |||||||||||
|---|---|---|---|---|---|---|---|---|---|---|---|---|---|---|
| Munzer et al., 1994 | Therien et al., 1996 | Present study | Munzer et al., 1994 | Present study | Munzer et al. 1994 | Present study | ||||||||
| None | Not done | Not done | 12 | Not done | — | 9.3 | 18.6 | |||||||
| α1 | 17.6 | 7.1 | 12 | — | Not done | 15.7 | 11.5 | |||||||
| α2* | 19.7 | Not done | 22 | 1.0 | 2.8 | 19.7 | 13.4 | |||||||
| α3* | 63.5 | 30.3 | 33 | 2.7 | 4.5 | 27.5 | 50.3 | |||||||
Values for basal [Na+]i and K m are in millimolars Na+. “Relative V max” is defined as the ratio (V max in the given cell line)/(V max of α1-transfected HeLa cells) for Munzer et al. (1994) data, or as (V max in the given cell line)/ (V max of untransfected HeLa cells) for present study. V max values were not normalized for pump number or transfection efficiency. Munzer et al. (1994) derived K m and V max values from a fit with fixed Hill coefficient of 3, whereas we performed fitting with a variable Hill coefficient (Eq. 2 and Table III). Munzer et al. (1994) measured basal [Na+]i of the Jewell-Lingrel cell lines under normal culture conditions, using flame photometry; we used SBFI.
It is reassuring that our data and those of Munzer et al. (1994) are so similar, given the differences in methods: (a) Munzer et al. (1994) measured fluxes with 86Rb, whereas we used SBFI. (b) Munzer et al. (1994) made their flux measurements in the presence of monensin, whereas we made ours in the absence of ionophores.4 (c) Munzer et al. (1994) did not measure [Na+]i directly, but assumed it to be equal to [Na+]o in their monensin-treated cells. We measured [Na+]i directly, in real time. (d) Our sampling technique allowed us to generate many more ([Na+]i, flux) data pairs along the [Na+]i activation curve, so that we were justified in fitting our data to a model with an additional parameter (i.e., variable Hill coefficient, as in Table IV).
Previous Work with SBFI
SBFI has been used to measure [Na+]i in many cell types (Harootunian et al., 1989; Harrison et al., 1992; Ahlemeyer et al., 1992). Some investigators have incidentally used SBFI to estimate an instantaneous Na+ flux. For example, Kondo et al. (1993) Na+ loaded cells of the thin ascending limb of Henle's loop by removing extracellular K+, and then measured the initial rate of [Na+]i decrease after restoring the K+. Similar experiments were reported by Harootunian et al. (1989) on fibroblasts and Borin et al. (1993) on vascular smooth-muscle cells. Because the above studies were performed only in the absence of ouabain, it was not possible to separate the Na-K pump flux from Na+ leak. Moreover, they measured the flux at a single [Na+]i, but did not attempt to measure the dependence of the Na+ efflux on [Na+]i.
SBFI Calibration Procedure
To increase the accuracy of our measurements, we calibrated the SBFI at two [Na+]o values in each experiment. Several ionophore combinations have been used to calibrate SBFI in vivo; however, we know of no example in which an independent measurement of [Na+]i was used to verify that any of these combinations truly equalizes [Na+]i and [Na+]o. Using untransfected HeLa cells, we systematically investigated the effects of adding gramicidin, nigericin, and monensin, stepwise in all possible sequences, to a calibration buffer containing 30–90 mM Na+. We found that the SBFI fluorescence– excitation ratio consistently increased when any one of the ionophores was added, even when the solution already contained one or two other ionophores (not shown). Adding ionophores had little effect, on the other hand, when the calibration buffer was Na-free. These results indicate that no two of the three ionophores were adequate to totally permeabilize the cells to Na+. We then demonstrated, using flame photometry, that the combination of gramicidin, nigericin, and monensin (Harootunian et al., 1989; Tepel et al., 1994) does in fact equalize [Na+]i and [Na+]o over a wide range of [Na+]o in HeLa cells.
Potential Limitations
Generalizability of conclusions.
Kinetic parameters of the Na-K pump α isoforms may depend, in part, on the tissue in which they are expressed (Therien et al., 1996). Cell-specific variations could arise from differences in such parameters as posttranslational modification, intracellular ionic composition, and membrane-lipid composition. Another variable is β-subunit isoforms. HeLa cells contain only the β1 isoform; it is possible that the kinetic properties of a specific α could be altered by pairing it instead with β2 or β3 ( Jaisser et al., 1992; Eakle et al., 1992; Cameron et al., 1994; Eakle et al., 1995).
Buffering and compartmentation.
In our flux analysis, we assume that Na+ buffering is negligible, as has been verified in gastric parietal cells (Negulescu and Machen, 1990). Previous studies have sometimes revealed differences between intracellular free Na+ and total cell Na+ content (Negulescu and Machen, 1990), or differences in [Na+]i among intracellular compartments. Borin et al. (1993), however, using digital imaging microscopy of SBFI-loaded smooth muscle cells, observed that, although the 340/380 fluorescence ratio was not uniform throughout the cell, the [Na+]i calculated from an in situ (i.e., intracellular) calibration was uniform.
Acknowledgments
We thank Wei Sun, Mark Lufburrow, Eugene Bang, and Dong-Hong Zhang for excellent technical assistance. We are very grateful to Drs. Jerry Lingrel and Beth Jewell-Motz for giving us the transfected HeLa cells. The anti–LEAVE antibody was a kind gift of Dr. T. Pressley. We also gratefully acknowledge helpful comments from Drs. Ed Benz, Satish Singh, Mark Bevensee, Joseph Hoffman, and Clive Orchard.
Supported by National Science Foundation grant IBN-9421171, National Institutes of Health Program Project Grant DK-17433, The Patrick and Catherine Weldon Donaghue Foundation, and The Connecticut Affiliate of The American Heart Association.
Abbreviation used in this paper
- SBFI
sodium-binding benzofuran isophthalate
Footnotes
Care was taken to thoroughly rinse the perfusion lines with 70% EtOH and distilled water between experiments so as to remove traces of ouabain and ionophores.
These results came from a three-site cooperative model.
We used ionophores only during the calibration phase of each experiment, after the efflux measurements were made.
references
- Ahlemeyer B, Weintraut H, Schoner W. Chick embryo heart cells with high and low intracellular calcium concentrations respond differently to ouabain. Biochim Biophys Acta. 1992;1136:91–98. doi: 10.1016/0167-4889(92)90089-t. [DOI] [PubMed] [Google Scholar]
- Blanco G, Xie ZJ, Mercer RW. Functional Expression of the α2-isoforms and α3-isoforms of the Na,K-ATPase in baculovirus-infected insect cells. Proc Natl Acad Sci USA. 1993;90:1824–1828. doi: 10.1073/pnas.90.5.1824. [DOI] [PMC free article] [PubMed] [Google Scholar]
- Boardman LJ, Lamb JF, McCall D. Uptake of 3H-ouabain and Na pump turnover rates in cells cultured in ouabain. J Physiol (Lond) 1972;226:619. doi: 10.1113/jphysiol.1972.sp009960. [DOI] [PMC free article] [PubMed] [Google Scholar]
- Boardman L, Huett M, Lamb JF, Newton JP, Polson JM. Evidence for the genetic control of the sodium pump density in HeLa cells. J Physiol (Lond) 1974;241:771–794. doi: 10.1113/jphysiol.1974.sp010684. [DOI] [PMC free article] [PubMed] [Google Scholar]
- Borin ML, Goldman WF, Blaustein MP. Intracellular free Na+in resting and activated A7r5 vascular smooth muscle cells. Am J Physiol. 1993;264:C1513–C1524. doi: 10.1152/ajpcell.1993.264.6.C1513. [DOI] [PubMed] [Google Scholar]
- Brinley FJ, Mullins LJ. Sodium extrusion by internally dialyzed squid axons. J Gen Physiol. 1967;50:2303–2331. doi: 10.1085/jgp.50.10.2303. [DOI] [PMC free article] [PubMed] [Google Scholar]
- Brodsky JL, Guidotti G. Sodium affinity of brain Na,K-ATPase is dependent on isozyme and environment of the pump. Am J Physiol. 1990;258:C803–C811. doi: 10.1152/ajpcell.1990.258.5.C803. [DOI] [PubMed] [Google Scholar]
- Cameron R, Klein L, Shyjian AW, Rakic P, Levenson R. Neurons and astroglia express distinct subsets of Na,K- ATPase α and β subunits. Mol Brain Res. 1994;21:333–344. doi: 10.1016/0169-328x(94)90264-x. [DOI] [PubMed] [Google Scholar]
- Eakle KA, Kim KS, Kabalin MA, Farley RA. High- affinity ouabain binding by yeast cells expressing Na, K-ATPase alpha subunits and the gastric H, K-ATPase beta subunit. Proc Natl Acad Sci USA. 1992;89:2834–2838. doi: 10.1073/pnas.89.7.2834. [DOI] [PMC free article] [PubMed] [Google Scholar]
- Eakle KA, Lyu RM, Farley RA. The influence of β subunit structure on the interaction of Na,K-ATPase complexes with Na+ . J Biol Chem. 1995;270:13937–13947. doi: 10.1074/jbc.270.23.13937. [DOI] [PubMed] [Google Scholar]
- Fambrough DM, Wolitsky BA, Tamkun MM, Takeyasu K. Regulation of the sodium pump in excitable cells. Kidney Int. 1987;32:S97–S102. [PubMed] [Google Scholar]
- Garay RP, Garrahan PJ. The interaction of sodium and potassium with the sodium pump in red cells. J Physiol. 1973;231:297–325. doi: 10.1113/jphysiol.1973.sp010234. [DOI] [PMC free article] [PubMed] [Google Scholar]
- Harootunian AT, Kao J, Eckert BK, Tsien RY. Fluorescence ratio imaging of cytosolic free Na+in individual fibroblasts and lymphocytes. J Biol Chem. 1989;264:19449–19457. [PubMed] [Google Scholar]
- Harrison SM, McCall E, Boyett MR. The relationship between contraction and intracellular sodium in rat and guinea pig ventricular myocytes. J Physiol. 1992;449:517–550. doi: 10.1113/jphysiol.1992.sp019100. [DOI] [PMC free article] [PubMed] [Google Scholar]
- Horowitz B, Eakle KA, Scheiner-Bobis G, Randolph GR, Chen CY, Hitzeman RA, Farley RA. Synthesis and assembly of functional mammalian Na,K-ATPase in yeast. J Biol Chem. 1990;265:4189–4192. [PubMed] [Google Scholar]
- Jaisser F, Canessa CM, Horisberger JD, Rossier BC. Primary sequence and functional expression of a novel ouabain-resistant Na,K-ATPase. The beta subunit modulates potassium activation of the Na,K-pump. J Biol Chem. 1992;267:16895–16903. [PubMed] [Google Scholar]
- Jaisser F, Jaunin P, Geering K, Rossier BC, Horisberger J-D. Modulation of the Na,K-pump function by β subunit isoforms. J Gen Physiol. 1994;103:605–623. doi: 10.1085/jgp.103.4.605. [DOI] [PMC free article] [PubMed] [Google Scholar]
- Jewell EA, Lingrel JB. Comparison of substrate dependence properties of the rat Na,K-ATPase α1, α2, and α3 isoforms expressed in HeLa cells. J Biol Chem. 1991;266:16925–16930. [PubMed] [Google Scholar]
- Kondo Y, Abe K, Igarashi Y, Kudo K, Tada K, Yoshinaga K. Direct evidence for the absence of active Na+reabsorption in hamster ascending thin limb of Henle's loop. J Clin Invest. 1993;91:5–11. doi: 10.1172/JCI116199. [DOI] [PMC free article] [PubMed] [Google Scholar]
- Lingrel JB, Kuntzweiler T. Na,K-ATPase. J Biol Chem. 1994;269:19659–19662. [PubMed] [Google Scholar]
- Lucchesi PA, Sweadner KJ. Postnatal changes in Na,K-ATPase isoform expression in rat cardiac ventricle. J Biol Chem. 1991;266:9327–9331. [PubMed] [Google Scholar]
- Minta A, Tsien RY. Fluorescent indicators for cytosolic sodium. J Biol Chem. 1989;264:19449–19454. [PubMed] [Google Scholar]
- Munzer JS, Daly SE, Jewell-Motz EA, Lingrel JB, Blostein R. Tissue- and isoform-specific kinetic behavior of the Na,K-ATPase. J Biol Chem. 1994;269:16668–16676. [PubMed] [Google Scholar]
- Negulescu PA, Machen TE. Intracellular ion activities and membrane transport in parietal cells measured with fluorescent dyes. Methods Enzymol. 1990;192:38–81. doi: 10.1016/0076-6879(90)92062-i. [DOI] [PubMed] [Google Scholar]
- Pressley TA. Phylogenetic conservation of isoform-specific regions within α-subunit of Na,K-ATPase. Am J Physiol. 1992;262:C743–C751. doi: 10.1152/ajpcell.1992.262.3.C743. [DOI] [PubMed] [Google Scholar]
- Putnam, D.S., E.A. Jewell, L. Lescale-Matys, C. Magyar, and A.A. McDonough. 1994. Na,K-ATPase abundance and activity in HeLa cells transfected with rat α isoforms. In The Sodium Pump: Structure, Mechanism, Hormonal Control and Its Role in Disease. E. Bamberg and W. Schoner, editors. Steinkopff, Darmstadt, Germany. 234–237.
- Shyjian AW, Cena V, Klein DC, Levenson R. Differential expression and enzymatic properties of the Na,K-ATPase α3 isoenzyme in rat pineal glands. Proc Natl Acad Sci USA. 1990;87:1178–1182. doi: 10.1073/pnas.87.3.1178. [DOI] [PMC free article] [PubMed] [Google Scholar]
- Sweadner KJ. Enzymatic properties of separated enzymes of the Na,K-ATPase. J Biol Chem. 1985;260:11508–11513. [PubMed] [Google Scholar]
- Tepel M, Schlotmann R, Teupe C, Zidek W. Effect of magnesium on cytosolic free sodium in human lymphocytes. Biol Chem Hoppe-Seyler. 1994;375:349–351. doi: 10.1515/bchm3.1994.375.5.349. [DOI] [PubMed] [Google Scholar]
- Therien AG, Nestor NB, Ball WJ, Blostein R. Tissue-specific versus isoform-specific differences in cation activation kinetics of the Na,K-ATPase. J Biol Chem. 1996;271:7104–7112. doi: 10.1074/jbc.271.12.7104. [DOI] [PubMed] [Google Scholar]
- Zahler R, Sun W, Ardito T, Brines M, Kashgarian M. Na,K-ATPase α isoform protein expression in heart and vascular endothelium: cellular and developmental regulation. Am J Physiol. 1996;270:C361–C371. doi: 10.1152/ajpcell.1996.270.1.C361. [DOI] [PubMed] [Google Scholar]