

Abstract
Mutations of the pore-region residue T442 in Shaker channels result in large effects on channel kinetics. We studied mutations at this position in the backgrounds of NH2-terminal–truncated Shaker H4 and a Shaker -NGK2 chimeric channel having high conductance (Lopez, G.A., Y.N. Jan, and L.Y. Jan. 1994. Nature (Lond.). 367: 179–182). While mutations of T442 to C, D, H, V, or Y resulted in undetectable expression in Xenopus oocytes, S and G mutants yielded functional channels having deactivation time constants and channel open times two to three orders of magnitude longer than those of the parental channel. Activation time courses at depolarized potentials were unaffected by the mutations, as were first-latency distributions in the T442S chimeric channel. The mutant channels show two subconductance levels, 37 and 70% of full conductance. From single-channel analysis, we concluded that channels always pass through the larger subconductance state on the way to and from the open state. The smaller subconductance state is traversed in ∼40% of activation time courses. These states apparently represent kinetic intermediates in channel gating having voltage-dependent transitions with apparent charge movements of ∼1.6 e0. The fully open T442S chimeric channel has the conductance sequence Rb+ > NH4 + > K+. The opposite conductance sequence, K+ > NH4 + > Rb+, is observed in each of the subconductance states, with the smaller subconductance state discriminating most strongly against Rb+.
Keywords: ion channel gating, conserved sequence, point mutation, patch clamp, mutagenesis
introduction
The traditional view of a voltage-gated ion channel has the voltage sensor, the gate, and the ion permeation pore as separate protein structures (Hille, 1992). However, structure–function studies have shown that mutations in the pore region can also affect gating (for reviews see Brown, 1993; Sigworth, 1994). In the case of voltage-gated potassium channels, Yool and Schwarz (1991) reported that mutations of F433 in Shaker shift the voltage dependence of activation in addition to changing the ion selectivity. Kirsch et al. (1992) and De Biasi et al. (1993a ,b) found two mutations in the pore region of a Kv2.1-Kv3.1 chimeric channel that affect both ion permeation and deactivation kinetics. Heginbotham et al. (1992) found that the double deletion of Y445 and G446 in Shaker results in a nonselective channel that also deactivates very slowly.
In the Shaker channel, mutations of T442 show large gating effects. This residue is the fourth in the potassium channel signature sequence TXXTXGYGD (Heginbotham et al., 1994) and is conserved among Shaker -like channels, inward rectifiers, Ca2+-activated potassium channels, cyclic nucleotide–gated channels, plant potassium channels, and potassium channels with two pore regions. The only alternative residue at this position, Ser, is present in the eag channel. Yool and Schwarz (1991) found that the Shaker T442S mutant channel has greatly prolonged openings as well as a negative shift in the voltage dependence of activation.
The 442 position in Shaker is adjacent to residues that affect ion permeation and block. Although Ala, Ser, Gly, and Asp substitutions for T442 leave the ion selectivity unchanged, some mutations of the succeeding residues V443 and the GYG motif disrupt ion selectivity (Heginbotham et al., 1994). A mutation of the preceding residue T441 affects internal tetraethylammonium (TEA)1 binding (Yellen et al., 1991). In a recent model of the potassium channel pore, the backbone carbonyl oxygen of T442 is proposed to contribute to one of the potassium ion binding sites (Durell and Guy, 1996). The combination of permeation and gating effects of mutations in this region therefore suggest that channel gating and ion permeation involve some of the same channel structures. For this reason we have carried out a more detailed analysis of the behavior of T442 mutant channels.
methods
Site-directed Mutagenesis and RNA Synthesis
All but one of the constructs used in this study were based on a Shaker B chimera (Lopez et al., 1994; kindly provided by Dr. L.Y. Jan, University of California, San Francisco, San Francisco, CA) in which the S6 sequence was substituted with the corresponding sequence from the mKv3.1 (also known as NGK2) channel, and in which the NH2-terminal inactivation sequence was removed. This chimeric channel, denoted SN (see Fig. 1), has a single-channel conductance approximately fourfold larger than Shaker when expressed in Xenopus oocytes. Cassette insertion mutagenesis was used to introduce mutations into SN. An oligonucleotide coding for Ser at the 442 position, as well as silent mutations for restriction sites BstEII, ActII, and SgrAI, was first synthesized (DNA Synthesis Laboratory, Yale University, New Haven, CT) and inserted into SN in pBluescript (Stratagene, La Jolla, CA) by using the restriction sites NsiI and HindIII; the latter site had been introduced when SN was constructed (Lopez et al., 1994). This new construct, denoted SNS, was further used to make other mutations at the 442 position. Oligos containing codons for Asp, Cys, Gly, His, Tyr, or Val were synthesized and inserted into SNS using the BstEII and SgrAI sites. The one construct not based on the SN chimera was SS (kindly provided by Dr. R. MacKinnon, Rockefeller University, New York), a Shaker H4 channel having a T442S mutation and the Δ6–46 NH2-terminal deletion. The amino acid sequence of Shaker H4 (Kamb et al., 1988) is identical to that of ShB (Schwarz and Jan, 1988) except for four amino acids in the COOH-terminal region. Mutations were verified by sequencing. The cDNAs were linearized with EcoO109I, and the capped, T3 run-off transcripts were stored at −70°C.
Figure 1.

Nomenclature of the mutations and comparison of their amino acid sequences. Dashes indicate residues identical to the sequence of Shaker. Expression of constructs was assayed by two-electrode voltage clamp. The constructs containing Cys, Asp, His, Val, and Tyr at position 442 failed to express ionic or gating currents when two batches of cRNA were injected into separate batches of oocytes. SS is based on the Shaker H4 construct, while SN and its derivatives were based on Shaker B, both with NH2-terminal truncations to remove fast inactivation.
Preparation of Oocytes and RNA Injection
Female toads (Xenopus laevis) were anesthetized by immersion in water containing 1.5 mg/liter 3-aminobenzoic acid ethyl ester (Sigma Chemical Co., St. Louis, MO), and oocytes were removed through a small abdominal incision. The follicular membranes were removed by incubating for 2–4 h in 2 mg/ml collagenase (type 1a; Sigma Chemical Co.) containing OR3 solution (Blumenthal and Kaczmarek, 1992), which consists of 50% Leibovitz's L-15 medium (GIBCO BRL, Gaithersburg, MD), 5 × 10⁴ U/liter nystatin (Sigma Chemical Co.), 20 mg/liter gentamycin (Sigma Chemical Co.), and 15 mM Hepes adjusted to pH 7.3. Defolliculated oocytes were washed repeatedly with OR3 to remove collagenase. Stage V–VI oocytes were selected and stored in OR3 solution at 20°C, before and after RNA injection. Volumes of 50– 100 nl of cRNA were injected using a microinjector (Drummond Scientific Co., Broomhall, PA). Concentrations of injected cRNA were varied to control the level of expression.
Measurements of Macroscopic Currents
Macroscopic currents were recorded in cell-attached membrane patches using conventional oocyte macropatch techniques (Stühmer et al., 1991) and the Pulse software (HEKA-Electronic, Lambrecht, Germany). Patch pipettes were pulled from Kimax glass capillaries (Kimble Products, Vineland, NJ) with tip diameters ranging from 2.5 to 25 μm and coated with Sylgard (Dow Corning Co., Midland, MI). The pipette solution contained 140 mM K-aspartate, 1.8 mM CaCl2, 10 mM Hepes and the bath solution contained 130 mM K-aspartate, 10 mM KCl, 1 mM EGTA, 10 mM Hepes; each was adjusted to pH 7.3. The liquid junction potential at the interface of these two solutions was estimated to be 0.8 mV; no correction was applied. Voltage pulses were applied from a holding potential of −100 mV, and the current signals were filtered at 2.5 kHz. Data were sampled at 12.5 kHz. For subtraction of linear leak and capacitive currents, a single P/4 pulse (Bezanilla and Armstrong, 1977) from a −120-mV leak holding potential accompanied each depolarizing pulse. To increase the signal-to-noise ratio, 5 or 10 sweeps were averaged before the data were stored. Displayed traces were additionally filtered with a Gaussian digital filter to the −3 db frequency indicated in the figure legends. Fits of time courses to exponential functions were performed by least-squares using the Igor data analysis program (WaveMetrics, Lake Oswego, OR).
Measurements of Single-Channel Currents
Single-channel recordings were made in inside-out patches and, in some cases, in cell-attached patches. We found no difference in the kinetics between data recorded by these two recording methods. Patch pipettes were pulled from 7052 glass (Garner Glass, Claremont, CA) with 1–2.5-μm tip diameters and were usually coated with Sylgard. Except as noted, the recording solutions were identical to those used in the measurements of macroscopic currents; for the selectivity experiments, Rb+, NH4 +, Cs+, Na+, Li+, or N-methyl-d-glucamine (NMDG) was substituted for K+ in the pipette solution. Filtering and sampling frequencies were the same as in macroscopic recordings. Channel activation was measured by depolarizations from a −100-mV holding potential to various voltages from −80 to +70 mV. Deactivation was measured at voltages from −100 to −200 mV after a prepulse whose amplitude and duration were appropriate to open the channel. Leak subtraction was performed using an average of the nearest null traces. Most of the measurements were performed on patches containing only one channel, as verified by recordings using a 500-ms voltage ramp from the holding potential to +100 mV. Single-channel patches were always used for measurements of first latencies. Multichannel patches were used in other cases (such as tail current experiments) where protocols were designed such that only one channel was activated at a time. Patches were discarded if endogenous ion channel activity existed, as judged by the conductance, kinetics, and reversal potentials of the channel events.
The analysis of the single-channel recordings was performed with various user-developed programs in the PowerMod environment (HEKA-Electronic) using the Modula-2 language. Data were filtered to 0.5–1-kHz bandwidth with a digital Gaussian filter to achieve an appropriate signal-to-noise ratio. Event detection was performed using the threshold-crossing analysis method (Colquhoun and Sigworth, 1995), except here a set of three thresholds was used to detect transitions among multiple current levels. An idealized event list was constructed in which the time of threshold crossing and current level were registered. Dwells with a duration less than 0.36/f c were ignored, where f c is the filter −3 db frequency.
The dwell times at each current level were fitted with a mixture of two exponential probability density functions using the maximum-likelihood method with simplex optimization (Colquhoun and Sigworth, 1995). Only dwell times longer than 0.5/f c were fitted. The fit was corrected for this left censor time and for the right censor time, which was the pulse duration. The maximum-likelihood fitting of dwells at sublevels yielded a fast component that had an extrapolated area usually <25% (the largest being 40%) of the total and had a time constant of 0.5 ms or less. This component likely resulted from extra threshold crossings due to noise or drift in the subconductance levels. The time constant of the slower component was taken as the mean dwell time τi in state i. No correction was made for the presence of false events (represented by the faster component) or missed events because, in the worst case, these accounted for only 9 and 5% of the total, respectively. A total of 50–2,500 events was fitted to obtain each τi value.
Rate constants were estimated as follows: let πij be the state entry probability, the probability that the channel enters state j when it exits state i, such that
 |
Values of πij were estimated from the event list. Then the rate constant from state i to state j was computed as
 |
The partial charge qij associated with each rate constant was estimated by fitting the voltage dependence of each transition rate kij to the exponential function
 |
Log-transformed values of kij(V) were fitted by least-squares.
Fast Solution Switching
A fast solution-switching experiment was carried out to compare the sublevel currents carried by different permeant ions. Solution switching was achieved by moving the interface between continuously flowing, parallel K+ and Rb+ solution streams relative to a stationary outside-out patch. The solution streams flowed from a pulled theta-glass capillary with a tip diameter of ∼300 μm, whose movement was driven by a linear stepper motor (model SF 77; Warner Instrument Co., Hamden, CT). The flow velocity of the solutions was 75–150 μm/ms, chosen to form a sharp solution interface while minimizing the chance of breaking the patch. Mechanical vibration artifacts were reduced by decreasing the stepper motor drive voltage to reduce its speed, and the residual artifacts were removed by subtracting averaged null traces from the trace with channel activity. After each experiment, the patch was broken by pressure applied to the pipette, and the rate of the solution switching was measured by monitoring the current steps resulting from changes in the liquid junction potential. In a typical experiment, the time between the 10 and 90% amplitude points of the junction potential change was 1.1 ms.
Simulations
To verify the single-channel analysis, artificial data were generated by a discrete-time algorithm as follows. At each time point, the program determines whether a transition is made out of the present state i by using a uniformly distributed random number. Letting δt be the sample interval, the probability of a transition is taken to be
 |
If a transition does occur, the exit state j is chosen with probability
 |
by using a second uniformly distributed random number. Gaussian random numbers were added to the simulated data to produce noise at the same signal-to-noise ratio as seen in the experimental data. After digitally filtering to the same bandwidth as used in the actual measurement, the simulated data were processed by the analysis programs for comparison with the experimental results. Statistical quantities are given as mean ± SEM.
results
Expression of Mutations at the 442 Position
We characterized mutations of T442 in the background of an NH2-terminal–truncated Shaker construct or in the Shaker-NGK2 chimera SN (Fig. 1). We first tested the expression of these mutations by two-electrode voltage clamp of Xenopus oocytes injected with each cRNA. The substitution of Ser for T442 in either background resulted in robust currents (Fig. 2), as did the Gly substitution in the SN background. On the other hand, substitutions of Cys, Asp, His, Val, or Tyr in the SN background resulted in no ionic current, even when concentrated cRNA from two separate batches was injected. We were also unable to detect gating currents from these mutants, which implies that the lack of current does not result from a simple blockage of the pore.
Figure 2.

Macroscopic currents from cell-attached patch recordings of the various channel types. (A) Activation currents were induced by depolarizing pulses from a −100-mV holding potential to potentials of: −50 to 100 mV (SN); −80 to 100 mV (SNS); −80 to 30 mV (SNG); and −80 to 60 mV (SS); all in steps of 10 mV except 20 mV for SNS. The post pulse was −140 mV. (B) Tail currents were recorded at voltages of −70 to −150 mV (SN) and −110 to −170 mV (SNS, SNG, and SS) after prepulses to 40 mV (SN) or 0 mV (SNS, SNG, and SS). Potassium ion concentration was 140 mM on each side of the patch. Currents were filtered at 1 kHz. Note the different time scale for SN currents. (C) Representative G-V curves for each channel type, calculated from the macroscopic currents assuming a linear I -V relationship. Superimposed on each curve is a fit of a Boltzmann function. The midpoint voltage V 1/2 and effective charge q for each channel type were −41.7 ± 2.7 mV, 5.1 ± 1.1 e0 (SN, n = 3); −66.3 ± 3.4 mV, 7.5 ± 1.2 e0 (SNS, n = 6); −87.9 ± 1.9 mV, 9.2 ± 0.8 e0 (SNG, n = 3); −66.8 ± 2.8 mV, 10.7 ± 1.6 e0 (SS, n = 4). (D) Voltage dependence of the activation time constant τa, estimated by fits of an exponential function to the activation time course, starting from the time when the amplitude is 50% of the final value. (E) Voltage dependence of the activation delay time δa obtained in the same fits as the time at which the extrapolated exponential crosses the current baseline. (F) Voltage dependence of deactivation time constants τd estimated by single-exponential fits. The apparent charge q was 0.80 e0 (SN), 0.96 e0 (SNS), 0.84 e0 (SNG), and 0.83 e0 (SS), as estimated by fitting the last five data points (lines) with the exponential function τ(V) = τ(0)exp(qV/kT).
Mutations of T442 Slow Channel Deactivation but Have Little Effect on Channel Activation
Macroscopic currents from each channel type are shown in Fig. 2, A and B. All the three mutant channels showed activation time courses similar to SN, but the tail currents of the mutants decayed with a much slower time course. The G-V curves (Fig. 2 C) show that the activation voltage dependence of the T442 mutants is steeper and is shifted toward negative voltages. The change in voltage dependence can be explained by the stabilizing effect of the mutations on the channel open state, as suggested by single-channel recordings (see below).
The T442 mutations seemed to have little effect on the activation kinetics. The activation time course was characterized by fitting a single exponential function to the macroscopic current starting at the time when the current is 50% of its final value. The “activation time constant” τa is taken to be the time constant of the fitted exponential, while the “activation delay” δa was obtained by extrapolating the fitted exponential to the current baseline. Schoppa and Sigworth (manuscript submitted for publication) have shown that, at depolarized potentials, τa approximates the rate of the slowest activation step, while δa approximates the sum of dwell times in the other states in the activation pathway. Fig. 2, D and E, shows that the mutations have very little effect on the magnitude and voltage dependences of these parameters at depolarized voltages.
When fitted with a single exponential, the deactivation time course of the SN channel has a time constant of 1.8 ms at −100 mV (Fig. 2 B); the same value is obtained in Shaker channels under these conditions (Zagotta et al., 1994a ; Schoppa, N.E., and F.J. Sigworth, manuscript submitted for publication). All of the T442 mutations resulted in much slower deactivation. The time constant at −100 mV was 310 ms for SS, which has the Ser mutation in the Shaker background. For mutations in the SN background, the time constants were similar: 590 ms for SNS and 250 ms for SNG. The voltage dependence of decay kinetics is essentially unchanged by the mutations, however, representing a partial charge movement of 0.8 to 0.9 eo in each case (Fig. 2 F).
Fig. 3 shows representative single-channel currents from each mutant. The SN channel has a large conductance, about four times that of wild-type Shaker channels (Lopez et al., 1994); we measure a slope conductance of 95 pS near −100 mV with an external solution containing 140 mM K+. The SNS and SNG mutants have lower conductances of 44 and 41 pS, respectively. SS has a conductance of 49 pS. All three T442 mutants have remarkably long channel open times, especially in view of the negative potentials (−60 and −70 mV) at which the recordings were made. The mutant channels also have a reduced frequency of brief closures compared to SN channels. The long-lasting openings are consistent with the slow deactivation seen in the macroscopic currents.
Figure 3.

Single-channel currents from five channel types, recorded in inside-out patches. (A) Representative single- chan-nel current traces of the SN channel and its derivatives. Potassium ion concentration was 140 mM on each side of the membrane. Channels were activated by a depolarization from a −100-mV holding potential to −60 mV (SN) or −70 mV (SNS and SNG). The tail potential was −140 mV (SN) or −120 mV (SNS and SNG). Note the different time scale for the SN current, which also has a larger single-channel conductance. Some dwells in subconductance levels are indicated by arrows. (B) Single-channel currents of Shaker and its derivative SS. Two selected sweeps recorded in symmetrical 140 mM K+ show the “nonbursting” and “bursting” behaviors of SS. The first sweep contains a brief dwell at a sublevel during activation (arrow) as well as a clear “staircase” of conductances during deactivation. Also shown are five successive sweeps from a truncated Shaker B channel, recorded with 5 mM external K+. Some dwells at subconductance levels are indicated by arrows. For the recording from the NH2-terminal–truncated Shaker B channel, the pipette solution contained 5 mM K-aspartate, 135 mM NMDG-aspartate, 1.8 mM CaCl2, and 10 mM Hepes. All recordings were filtered at 1 kHz. The recordings of SN and SS currents used uncoated patch pipettes, which yielded larger background noise.
In view of the prolonged open times, it is surprising that the activation kinetics of mutant channels are similar to those of SN channels. One possibility would be that the only kinetic effect of the mutations is on the stability of the open state. If so, then the latency to first opening should be unaffected by the mutations. We therefore measured the first latencies of SN and SNS single-channel currents at various voltages (Fig. 4). Despite the large difference in their behavior after first openings, the two-channel types showed very similar first-latency distributions at each voltage (Fig. 4, B and D). The median first latency at −60 mV for SN was 38 ± 2 ms (n = 4); for SNS the value was 32 ± 4 ms (n = 3). Thus, it appears that the main kinetic difference between SNS and SN channels is the prolongation of the channel open times.
Figure 4.

First latencies of SN and SNS single-channel currents. (A and C) Representative traces at various depolarizations in single-channel patches from oocyte expressing SNS (A) or SN (C). The dotted line marks the beginning of the depolarizations. (B and D). The cumulative first-latency distributions are plotted for SNS (B) and SN (D) at the potentials indicated. First latencies were measured as the time to first opening, to either sub- or main conductance level.
Zagotta et al. (1994b) showed that the stabilization of the open state, for example through a decreased channel closing rate, leads to cooperative behavior and a steeper voltage dependence of channel activation. Thus, the increase in steepness of the activation curves of the T442 mutants (Fig. 2 C) is not unexpected, given the remarkable stabilization of the open state by the T442 mutations. The negative shift of the activation curves can also be understood from the stabilization of the open state, which tends to shift the gating equilibrium toward channel opening.
There Are at Least Two Subconductance Levels in SNS
Besides the lengthening of open times, all three channel types having T442 mutations showed intermediate levels of conductance. Some examples of dwells in these sublevels are marked with arrows in Fig. 3. In SNS single-channel records elicited by depolarizations in the range −60 to −90 mV, dwells at one or two distinct conductance levels are typically seen before the channel reaches the fully open state. During channel deactivation, a “staircase” of conductance steps is also observed. The same behavior is seen in SNG channels. The SS channels also show the same subconductance behavior in some sweeps, but in others there are long periods of very rapid flickering; an example of each of these “modes” is shown in Fig. 3 B. We chose the SNS channels for further analysis because they do not show this complicated behavior.
As reported by Hoshi et al. (1994), wild-type Shaker channels show subconductance levels, but this activity seems to be of a different kinetic nature. We observe lower conductance levels that persist typically for tens of milliseconds and occur randomly throughout the recording (Fig. 3 B), rather than being visited mainly upon activation or deactivation as is seen with the T442 mutants. From a large set of recordings, Schoppa and Sigworth (manuscript submitted for publication) estimated that of the total open time of NH2-terminal– truncated Shaker channels, 17% is spent in conductance levels below the main level. We observed occasional periods of this kind of subconductance activity also in SN channels.
To characterize the sublevels in SNS, we made amplitude histograms of the single-channel current by accumulating all the data points in the portion of the record when the channel was making opening or closing transitions (Fig. 5 A). Representative histograms for activation at −70 mV and deactivation at −140 mV are shown in Fig. 5 B. At −70 mV, only a single sublevel could be distinguished, but at more negative potentials a smaller sublevel is also apparent. We shall call these sublevels sub2 and sub1, respectively. As shown in Fig. 5 C, the amplitude of each current level showed a linear voltage dependence in the voltage range tested. Sublevel currents were generally noisier than the fully open channel current, as indicated by the increased width of their Gaussian components in the fits to the histograms.
Figure 5.

Amplitudes of the three current levels in SNS channels. (A) Representative current trace showing channel activation at −70 mV and deactivation at −140 mV. Boxes indicate regions of this trace used in constructing the amplitude histograms. (B) Amplitude histograms of the single- channel current at the two voltages, accumulated from portions of 380 sweeps as in A. Filter bandwidth was 1 kHz. Superimposed are fits of three (−70 mV) or four (−140 mV) Gaussian functions; the midpoint of each Gaussian is taken to be the mean current amplitude. The standard deviations (in pA) of the Gaussian components are as follows. For −70 mV: 0.25 (closed), 0.36 (sub2), 0.25 (open); for −140 mV: 0.30 (closed), 1.0 (sub1), 0.54 (sub2), 0.50 (open). (C) The mean current amplitudes at different voltages. The superimposed linear fits yield the slope conductances shown.
When channels make many transitions, all-points amplitude histograms of this sort can be distorted, and the peaks broadened, by the data samples that represent transitions between current levels. One approach is to exclude from histograms the samples near identified transitions (Colquhoun and Sigworth, 1995; Chapman et al., 1997). In the present case, the number of transition points is sufficiently small that this correction is not required. For example, each histogram in Fig. 5 B represents 380 sweeps and contains more than 200,000 entries. Of these, we calculate that fewer than 2,500 entries arise during current transitions.
SNS Sublevels Correspond to Intermediate Steps in the Activation Process
The question we asked next was whether each of the sublevels is necessarily traversed when a channel passes from the resting closed state to the final open state. We addressed this question by measuring from single-channel activation time courses at −70 mV the dwell times in sub1 and sub2 using a set of three thresholds, as shown in Fig. 6 A. The threshold values were chosen to be the midpoints between the various current levels of the channel (0, 0.37, 0.70, and 1.0 times the fully open channel current) as derived from the fits in Fig. 5 C. Measurements were made only during the initial activation of the channel, i.e., between the time of first leaving the closed current level and the time of first entering the fully open level. Assuming that each current level represents a single state, the dwell times at a given level are expected to have a single-exponential distribution whose time constant is determined by the sum of the rates of transitions leading away from that state. Although at this potential the sub1 peak is not visible in amplitude histograms, substantial dwells in sub1 were detected by the threshold analysis. The dwell times at sub1 could not, however, be described by a single-exponential distribution (Fig. 6 B). The excess of short events in the sub1 distribution accounted for ∼60% of the total.
Figure 6.

Sublevels of the SNS single-channel current during activation. (A) Representative traces at −70 mV. Solid lines show channel closed and open levels; dashed lines (θ1, θ2, and θ3) are thresholds at 10, 50, and 85% of the open amplitude. In the upper trace, the channel spends t 1 = 2.9 ms in the sub1 state and t 2 = 3.9 ms in the sub2 state before reaching the open state. In the lower trace, the channel appears to open instantaneously into sub2, but a finite t 1 is measured because of filtering. Filter bandwidth is 1 kHz. (B) Cumulative histogram of measured dwell times t 1 in sub1 (solid curve) accumulated from 140 events. The dashed curve is the cumulative distribution from a simulation of 250 events with mean lifetime τSub1 and fraction f Sub1 of nonzero dwells in sub1 as given. (C) A scheme for channel activation that accounts for the distributions of t 1 and t 2. Channels can open through two distinct pathways, allowing sub1 to be skipped but always traversing sub2. (D) Cumulative histogram of 140 dwell times at sublevel sub2. The dashed curve is from a simulation of 250 events with the given mean dwell time and fraction of nonzero dwells.
The excess of short events in the distribution might be expected to arise from a second component of the dwell time distribution. Another possibility, however, is that they arise from an artifact of the analysis procedure. When an instantaneous step in current occurs, the recorded time course will show a slow transition from one level to another because of the effect of filtering. A large transition, say from zero to the sub2 current level, will result in a finite time delay between crossing the lower and upper thresholds that bracket the sub1 current level (θ1 and θ2 in Fig. 6 A), even in this case when the dwell time in sub1 is zero. To test whether the short events in the sub1 distribution might arise from this mechanism, we ran a simulation using a kinetic scheme like that shown in Fig. 6 C with various values for the parameters. The dotted curve in Fig. 6 B is the distribution of apparent dwell times at sub1 from the model parameters shown. The distribution is well described by the model, which has 59% of the channel openings occurring as transitions from a closed state (close2) directly to the sub2 state. On the other hand, the distribution of apparent dwells at sub2 is well described by a simple exponential distribution of dwells, although parameters corresponding to the case in which 10% of openings proceed directly to the open state also provides an acceptable fit (Fig. 6 D). In view of the fact that this small fraction is probably not significant, in the final model (Fig. 6 C) we allow channels to open only after passing through the sub2 state. We conclude that during activation, an SNS channel has an ∼40% chance of traversing the sub1 state, and essentially always passes through the sub2 state, on its way to the fully open state.
When a channel enters directly into sub2 on activation, does it pass from the same closed state that leads to sub1? This question cannot be answered from our experiments. It is possible, and we believe likely, that the two sublevels are entered from different closed states; we have drawn the scheme In Fig. 6 C reflecting this possibility.
Transitions between States Are Voltage Dependent
The activation of a Shaker potassium channel involves many intermediate transitions, each of which is voltage dependent and therefore involves charge movement (Bezanilla et al., 1994; Zagotta et al., 1994a ). We were therefore interested in testing whether transitions between the conductance states in the SNS channel were voltage dependent. From single-channel recordings at various membrane potentials, we again used a set of three thresholds to measure the dwell times in each current level and to determine the exit state following each dwell; this is illustrated for tail currents in Fig. 7. We found that the dwell times at each conductance level are voltage-dependent, as shown in Fig. 8. The open time becomes shorter at hyperpolarized voltages, with a mean value of 50.5 ms at −120 mV. The dwell times at sub1 and sub2 have their maximum values of 5.3 and 9.4 ms at −100 and −120 mV, respectively. At more hyperpolarized and more depolarized voltages, the mean dwell time at each sublevel is smaller. There is also a class of brief closures that completely interrupt the current in the open state (see for example Fig. 7 A). These are also voltage dependent, having a smaller mean duration at more hyperpolarized voltages.
Figure 7.
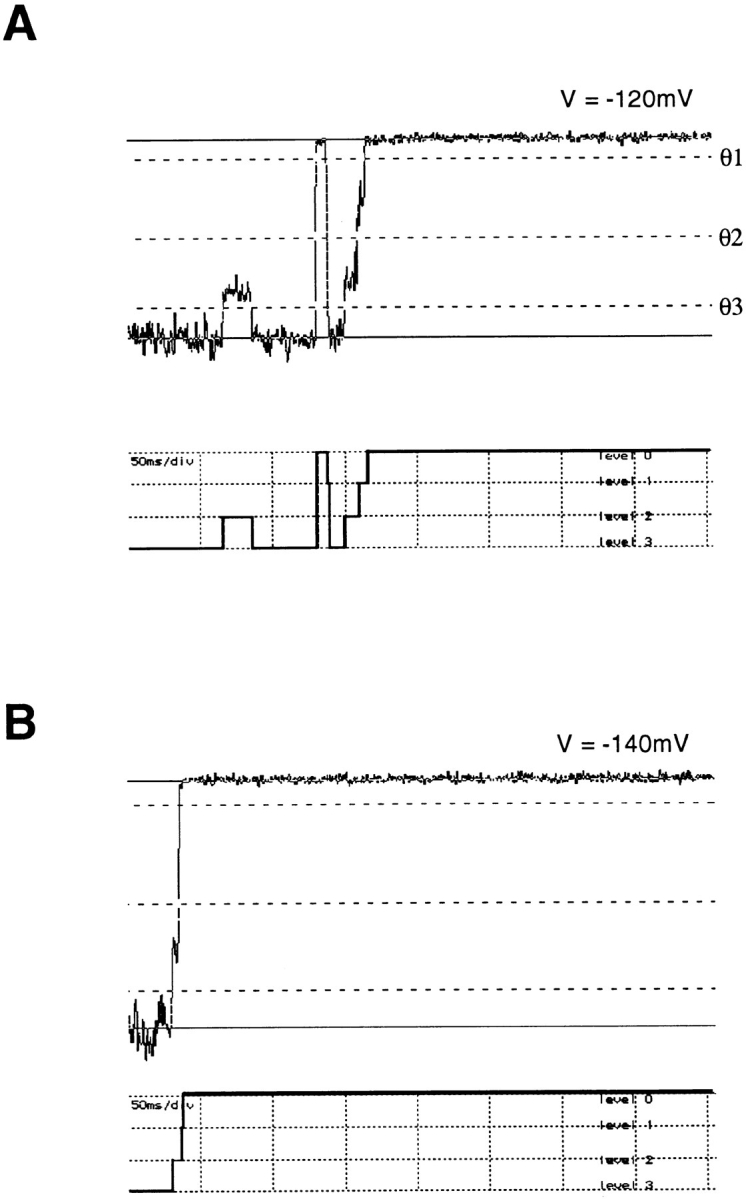
Examples of single-channel tail currents of SNS at −120 mV (A) and −140 mV (B). Solid lines show channel closed and open levels, while dashed lines indicate thresholds θ1, θ2, and θ3 at 10, 50, and 85% of the open level. Data filtered at 1 kHz. Below each trace is the idealized current time course.
Figure 8.

Voltage dependence of mean dwell time in the open state and the two substates. Data points at each voltage represents the mean value, with the number of measurements marked in parentheses (except the data at −30 mV, which represents a single measurement). The curves are the values predicted from the kinetic scheme In Fig. 9.
The estimates of rate constants obtained in the voltage range from −70 to −140 mV are summarized in Fig. 9 along with a kinetic scheme. In this scheme, again, the SNS channel can open via two paths: one passes through both substates while the other traverses only the sub2 state. A distinct closed state, closed3, follows the open state to account for the brief closures. According to the scheme, the sub1–sub2 and sub2– open transitions involve substantial charge movements, 1.56 and 1.62 eo, respectively. Although its parameters were obtained from measurements at more negative voltages, the scheme accounts quite well for the measured dwell times in the sub2 state at −40 and −30 mV (Fig. 8). At 0 mV the dwell times in sub1 and sub2 are expected to be quite short, 0.31 and 0.82 ms, respectively.
Figure 9.

Voltage dependence of transition rates. Rate constants were computed as described in Methods from single-channel activation time courses at −70 mV (n = 3 patches) and deactivation time courses at −100 (n = 2), −120 (n = 4), and −140 mV (n = 3). Superimposed on each plot is an exponential fit of the voltage dependence. The kinetic scheme (inset) summarizes the measurements from both activation and deactivation. Values for the rate constants (in s−1) are given for V = −120 mV. The partial valence associated with each rate constant is given in parentheses.
SNS Substates Have Different Ion Selectivities
Most potassium channels are permeable to Rb+ and NH4 + in addition to K+. Two simple measures of the selectivity of a channel are the so-called permeability ratio, obtained from the reversal potential under biionic conditions, and the conductance ratio, comparing current carried by the various ions. These quantities have been determined by Heginbotham and MacKinnon (1993) and by Perez-Cornejo and Begenisich (1994) for Shaker channels. By both measures, K+ is the most permeant ion of the three; the permeability ratios have the sequence K+ > Rb+ > NH4 +, but the conductances follow the sequence K+ > NH4 + > Rb+. We list values for these parameters from the work of Heginbotham and MacKinnon (1993) in Table I. We performed similar measurements on SN and SNS channels in inside-out patches, although under somewhat different ionic conditions. We first tested the selectivity of SN under biionic conditions with 140 mM Rb+ or NH4 + in the pipette solution and 140 mM K+ in the bath. The reversal potentials were −10 and −56 mV, yielding the permeability ratios given in the table and a sequence identical to that of Shaker, K+ > Rb+ > NH4 +. To evaluate the conductance ratios, Heginbotham and MacKinnon (1993) measured conductances near 0 mV in symmetrical solutions; we used a less rigorous approach, comparing the single-channel currents under biionic conditions at −120 mV, where current is assumed to be carried predominantly by the test ion. In SN channels, the conductance sequence so obtained was K+ > NH4 + > Rb+, again the same as in Shaker.
Table I.
Comparison of the Selectivities of SN, SNS, and Shaker
| Channel (state) | Permeability ratio | Current at −120 mV | ||||||||
|---|---|---|---|---|---|---|---|---|---|---|
| P Rb/P K | P NH4/P K | i K | i NH4 | i Rb | ||||||
| pA | ||||||||||
| Shaker | 0.66 | 0.09 | 1.8 | 1.4 | 0.9 | |||||
| SN | 0.67 | 0.11 | 11.7 | 7.8 | 3.6 | |||||
| SNS (open) | 0.82 | 0.17 | 4.8 | 5.4 | 6.2 | |||||
| SNS (sub2) | — | — | 3.6 | 3.2 | 2.6 | |||||
| SNS (sub1) | — | — | 2.0 | 0.8 | 0.4 | |||||
Reversal potentials measured under biionic conditions, with 140 mM of each test cation X in the external solution and 140 mM K+ in the internal solution. The permeability ratio of ion X relative to K+ was calculated according to P X/P K = exp(FV rev/RT ). The single channel-current amplitude i was estimated at −120 mV from current amplitude histograms as shown in Fig. 5. Data for Shaker were taken from Heginbotham and MacKinnon (1993), with currents at −120 mV estimated from the slope conductances from their measurements in ∼100 mM solutions; if obtained under our conditions, the Shaker current values would be larger by a factor ∼2 because of the difference in concentrations and the nonlinearity of the single-channel I-V relationship.
SNS channels also conduct Rb+ and NH4 + currents, but no inward current was detected from SNS at the single-channel level when Na+, Li+, Cs+, or NMDG ion was used in the pipette solution. The reversal potentials under biionic conditions were −5 mV (Rb+/K+) and −45 mV (NH4 +/K+), yielding the same permeability sequence as Shaker. The conductance sequence was different, however. Both NH4 + and Rb+ currents had larger single-channel conductances, with the sequence Rb+ > NH4 + > K+ (Table I).
NH4 + and Rb+ currents through the SNS channel (Fig. 10 A) are similar to K+ current in that they both show long, stable openings. They also show sublevels. Like those in K+ current, the sublevels in Rb+ and NH4 + currents are brief compared to the open levels and are traversed as the channel activates and deactivates. Fig. 10 B shows a representative single-channel tail current time course at −140 mV for each permeant ion. Amplitude histograms obtained at −140 mV (Fig. 10 C) show clear peaks for two or three sublevels in NH4 + and Rb+, respectively. We performed a kinetic analysis of the sublevels in Rb+, like that shown in Fig. 6. We found that the intermediate (S2′′) sublevel was traversed almost every time, while the small (S1′′) sublevel was frequently skipped during deactivation at −120 mV, a phenomenon also seen with K+ currents. The general kinetic behavior suggested that S1′ and S2′ sublevels in NH4 + currents and the S1′′ and S2′′ sublevels in Rb+ correspond to the same kinetic states as the sub1 and sub2 levels in K+ current. However, in the amplitude histogram of Rb+ current, there is a third peak, S3′′, at a current level that is larger than the S2′′ sublevel. In single-channel recordings, this current level appears with a short dwell time, as illustrated in Fig. 10 B.
Figure 10.

SNS single-channel currents with K+, NH4 +, or Rb+ as the permeant ions. (A) Single-channel currents recorded from inside-out patches, with 140 mM of the test ion in the pipette and 140 mM K+ in the bath. The voltage protocol is shown at the bottom. Note the small current in NH4 + at −60 mV, due to proximity to the reversal potential of −45 mV under these conditions. (B) Representative tail currents at −140 mV for each permeant ion. The open level is marked by an arrowhead. The S2′′ and S3′′ sublevels in Rb+ current are also indicated. (C) Amplitude histograms of tail currents at −140 mV for each permeant ion, accumulated from recordings filtered at 1 kHz. The data for K+ are the same as in Fig. 5 C; for NH4, the standard deviations of the fitted Gaussians are 0.1, 1.0, 0.9, and 1.1 pA for closed, sub1, sub2, and open levels, respectively. For Rb+, the standard deviations are 0.2 for the closed level, 0.6 for each sublevel, and 0.5 for the open level.
The existence of an extra current level in Rb+ places in some doubt our assignment of the sublevels. As a further test of the identity of the sublevels in NH4 + and Rb+ that correspond to sub1 and sub2 in K+ current, we performed rapid solution-switching experiments. During recordings of single-channel deactivation, the solution bathing an outside-out patch was rapidly changed. Through the accumulation of many trials, recordings were obtained in which the permeant ion was changed between K+ and Rb+ while the current was in each conducting level. Fig. 11 A shows representative sweeps from these experiments, which show changes in current level consistent with the identification of S2′′ in Rb+ with sub2, and S1′′ with the sub1 conductance level. A comparison of the current levels before and after the solution switching in many sweeps (Fig. 11 B) confirms the identification. The additional level S3′′ appears to arise from a short-lived, degenerate state whose conductance level is indistinguishable from sub2 in K+ but becomes visible in Rb+ currents.
Figure 11.

Solution switching experiment. (A) In an outside- out patch, the channel is activated by a depolarization to −70 mV from the −100-mV holding potential. Switching of the external solution occurs during the tail current at −120 mV, as shown by the dotted lines. In traces 1, 2, and 4, the K+ → Rb+ switching occurs while the channel is at the open level; in traces 3 and 5, it occurs while the channel is at sub2 sublevel. Trace 4 shows Rb+ → K+ switching while the channel is at sub2. Trace 6 shows Rb+ → K+ switching while the channel is at sub1. The pipette solution contained 130 mM K-aspartate, 10 mM KCl, 1 mM EGTA, 10 mM Hepes, and the bath solution contained 140 mM K-aspartate, 1.8 mM CaCl2, 10 mM Hepes; each was adjusted to pH 7.3. (B) Scatter plot of mean current values obtained before and after solution switching. Mean current was calculated only from the traces in which the current levels were stable for at least 5 ms both before and after the solution switching.
It is interesting to note in Fig. 11 A that upon switching from K+ to Rb+, the current in the open state increases in magnitude, while the two substate currents are seen instead to decrease. A comparison of the conductances when K+, Rb+, or NH4 + is the permeant ion shows in fact that the sublevels have a reversed conductance sequence. That is, while the SNS open state has the conductance sequence Rb+ > NH4 + > K+, the sub1 and sub2 states have the sequence K+ > NH4 + > Rb+ (Table I). This phenomenon has been seen at each voltage tested, ranging from −70 to −140 mV; Fig. 12 plots the current levels with the various permeant ions at −120 mV. We conclude that the SNS channel has different ion selectivities when it is in different conductance states and preferably selects against the larger NH4 + and Rb+ ions at the lower conductance levels.
Figure 12.

Amplitudes of each current level in SNS channels at −120 mV when K+, NH4 +, or Rb+ is the external ion.
discussion
The Shaker potassium channel is highly selective for K+ over Na+ and other monovalent ions. Heginbotham et al. (1994) found that the GYG motif in the P region of the Shaker potassium channel is important for this ion selectivity. When some residues in and near this motif are mutated, the resulting channels lose their selectivity for K+. These observations, along with experiments involving toxin blockade and chemical labeling of mutant channels (MacKinnon and Miller, 1989; MacKinnon and Yellen, 1990; Lü and Miller, 1995), have confirmed that residues in the P region form part of the ion permeation pore. T442 is two residues upstream from the GYG motif, and although the substitution of Ala, Gly, Asn, or Ser for T442 does not disrupt channel selectivity (Heginbotham et al., 1994), mutations at the neighboring position V443 can render the channel nonselective. The preceding residue T441 has been associated with internal TEA binding (Yellen et al., 1991) and ion selectivity (Yool and Schwarz, 1995, 1996). In a recent structural model of the Shaker potassium channel (Durell and Guy, 1996), the T442 residue is located at the inner end of the pore, with its backbone carbonyl oxygen forming one of the K+ ion binding sites.
Within the K+ channel superfamily, T442 is as highly conserved as the GYG motif itself, with the only alternative at this position being the conserved substitution of Ser in the eag channel (Warmke and Ganetzky, 1994). We found that the conservative mutations to Ser or Gly result in functional channels that have, however, altered single- channel conductance and very large changes in channel kinetics. Large changes in the side-chain structure at the 442 position, such as the charged side-chain of Asp, the imidazole ring of His, the phenyl group of Tyr, or the sulfhydryl group of Cys result in no detectable ionic or gating currents. Even a Val substitution is lethal, even though it is similar to Thr in volume and side-chain structure. These results are consistent with the view that T442 forms an important part of the pore structure.
Mutations at T442 Increase the Stability of the Open State
It has been reported that mutations at T442 decrease the rate of deactivation and change the voltage dependence of activation (Yool and Schwarz, 1991; Yellen et al., 1991; Heginbotham et al., 1994). These are among the most dramatic changes in gating that have been observed as a result of mutations in the pore region. Our results confirmed that both Ser and Gly mutations at this position made deactivation extremely slow, both in the background of an NH2-terminal truncated Shaker H4 clone (yielding the SS mutant) and in the background of a Shaker -NGK2 chimera (SN, yielding the mutants SNS and SNG). Single-channel recordings from these mutants showed that the open state is greatly stabilized, such that the open time of the mutant channels is two or three orders of magnitude longer than that of the wild-type channel. This stabilization of the open state can also explain the negative shift of the G-V relationship observed in the mutant channels. We used the SNS channel for the detailed characterization of single-channel properties because its single-channel behavior was simpler; the corresponding SS channel showed an additional, rapid bursting mode of activity that is difficult to analyze.
It appears that the mutations of T442 leave the earlier steps in the activation process unaffected. We draw this conclusion from both the macroscopic activation time courses and the first latencies of the single-channel currents. The macroscopic currents of the T442 mutants and the background channel all show comparable activation time constants, suggesting that the rate-limiting step in the activation pathway is not affected by the mutations. The activation delay time, which reflects the overall rate of other gating steps, is also unchanged. At the single-channel level, we demonstrated that despite the very different open times, the SN and SNS channels have very similar first-latency distributions. These results are consistent with the idea that the T442 mutations affect the gating predominantly through the stabilization of the open state.
The fact that substitution of Ser or Gly at the 442 position stabilizes the open state suggests that the Thr residue at this position participates in a specific interaction that destabilizes the open state. It is not clear what kind of interaction this may be, although it is tempting to imagine that the hydroxyl group may form a specific hydrogen bond when the channel is in closed states. The increase in channel open time and open probability with the mutations corresponds to a moderate free energy change ΔΔG of about −1 kcal/mol for each subunit.
Subconductance States in Shaker and Other Channel Types
Chapman et al. (1997) have recently characterized subconductance states in the wild-type Kv2.1 channel and in two mutants. A total of four subconductance levels were seen; they were observed most often before the channel reached the fully open state during a depolarizing pulse. In the Kv2.1 channel, the sublevels were prominent only at small depolarizations, although in a slowly activating mutant, named drk1-LS, the sublevels were readily seen at large depolarizations as well. With this mutant, dwells in sublevels were seen to precede full channel openings in 70 to 80% of the single-channel activation time courses. The authors concluded that the sublevels reflect intermediate states in the activation process.
The mutant Shaker channels studied here show very similar behaviors. We observed only two main subconductance levels, but the relatively long dwell times at these levels allowed us to characterize their kinetics in the SNS channel. The subconductance levels are preferentially visited during channel activation and deactivation. Their dwell times are strongly voltage dependent, having the largest values near −100 mV. With a probability approaching 100%, an activating channel passes through the larger subconductance state sub2 before entering the open state and passes back through sub2 during deactivation as well.
There are some differences between the behavior of the channels studied by Chapman et al. (1997) and the SNS channels studied here. First, the SNS subconductance states are relatively noisy, showing larger current fluctuations than the open state does. It is possible that the fluctuations mask (or even arise from) transitions among additional subconductance states, having closely spaced conductance levels. An example of a poorly resolved conductance level is S3′′, a low-occupancy state that can be resolved in Rb+ but that is not visible with other permeant ions, presumably because it cannot be distinguished from sub2. In contrast, the current levels in Kv2.1 and its mutants are more stable and well defined. Second, there are differences in kinetics of transitions, such that in SNS the unidirectional state sequences closed → sublevel → open and open → sublevel → closed are seen quite often, while in the Kv2.1 channels the transitions among closed and sublevel states appear to be much more reversible. Third, we find the rates of transitions among sub1, sub2, and the open state to be quite voltage dependent. The dwell times in sublevels of Kv2.1 appear to be similarly voltage dependent, but the drk1-LS mutant is remarkable in having nearly voltage-independent dwell times in sublevels, when the traces presented for depolarizations to 0 and +40 mV are compared. This voltage independence might be related to the fact that the drk1-LS channel also has a nearly voltage-independent activation time course.
Subconductance states have been reported in many other channel types (for review see Fox, 1987). Ferguson et al. (1993) observed in rat muscle calcium-activated K+ channels a behavior not unlike that described here, in which channels enter or leave the open state from short-lived subconductance states. The dwell times in the substates are very brief, on the order of 50 μs, and somewhat less than half of the opening or closing transitions appear to occur to substates rather than directly to fully open or closed states. Schneggenburger and Ascher (1997) have described novel subconductance behavior in a mutant NMDA receptor channel. The substate has altered ion selectivity and, most interestingly, is seen to have transition rates that depend on the electrochemical gradients of ions, leading to a violation of microscopic reversibility in gating. We did not see irreversible gating in SNS channels, but it should be kept in mind that the limitations in voltage range imposed by voltage-dependent gating make it more difficult in this case to manipulate the electrochemical potential of ions. Finally, it should be kept in mind that wildtype Shaker channels also show a kind of subconductance behavior (Hoshi et al., 1994; Schoppa, N.E., and F.J. Sigworth, manuscript submitted for publication; Fig. 3 B), but unlike that seen here in SNS channels, the transitions to subconductance states appear to be very weakly coupled to activation.
Origin of Sublevels
Activation of the Shaker potassium channel involves many kinetic transitions, each of which is voltage dependent (Bezanilla et al., 1994; Zagotta et al., 1994a ). We find that the voltage dependences of the transitions from sub1 to sub2 and from sub2 to the open state each correspond to a charge movement of about 1.6 e0. The fact that the charge movements in the two transitions are essentially equal suggests that these transitions arise from structurally equivalent conformational changes, for example equivalent motions occurring in separate subunits. The magnitude of these charge movements is larger than that of any individual step in a model of Shaker channel activation from our laboratory (Schoppa, N.E., and F.J. Sigworth, manuscript submitted for publication), but it is quite similar to the value of 1.42 e0 proposed for the final steps leading to channel opening in a simpler activation model proposed by Zagotta et al. (1994b).
Chapman et al. (1997) have pointed out that subconductance levels can arise in two different ways. One possibility is that they represent distinct, partially open conformations of the channel pore. In Fig. 13 A, we present a hypothesis of this sort, based on the model of Zagotta et al. (1994b). In this model, each channel subunit can undergo two voltage-dependent transitions, and the channel's open state results when each subunit is in its final, permissive state. In Fig. 13 A, the two main sublevels described here correspond to the configurations in which two or three subunits are in the permissive state, resulting in a partially conducting pore. In this model, the effect of the T442S mutation would be to stabilize the permissive states; this would lengthen the open times and make dwells in the sublevels long enough to be observable. Since each subunit undergoes identical transitions, the model predicts the same charge movement for the sub1 ′ sub2 and sub2 ′ open transitions. Another prediction of this model is that the channel must traverse the state having three permissive subunits (state 13 in Fig. 13, corresponding to sub2) before it can reach the final open state 14. On the other hand, there exist two alternative pathways by which the channel can reach state 13; one is through the sub1 state 11, while the other is through the closed state, 12. Thus the topology of this scheme can account for our observations that sub2 is tightly coupled to the open state, while sub1 is frequently skipped when the channel activates and deactivates.
Figure 13.

Two speculative gating schemes. (A) The scheme of Zagotta et al. (1994b) is shown, in which a single subunit undergoes two voltage-dependent conformational transitions (inset) to reach a permissive state (circles). Subunit transitions occur independently, with the exception of a slowed transition from the open state 14 to state 13. The scheme has been modified to identify sublevels sub1 and sub2 with states in which two or three subunits are in the permissive state. (B) The scheme Is modified to include a distinct allosteric transition (dotted line) that follows activation of the subunits. The allosteric transition is assumed to be very rapid and switches between fully conducting and nonconducting states. Allosteric equilibria are influenced by a common factor θ that is greatly increased by the T442S mutation. In both schemes, the conducting states are represented by filled symbols.
The other possibility is that subconductance levels arise from rapid switching between fully open and fully closed states. A mechanism like this has been documented for sublevels arising from blockers of the Ca-activated K+ channel (Moss and Moczydlowski, 1996). A scheme Incorporating this idea is shown in Fig. 13 B, where transitions from nonconducting to conducting states of the channel involve a distinct allosteric transition with very fast rates. The sublevels seen in single-channel recordings would then result from the averaging effect of filtering on the rapidly flickering current, so that the apparent conductance would depend on the ratio of forward to reverse rates of the allosteric transition, which is different for the different states. (The presence of rapid flickering in the fully open state of the channel could explain the excess noise seen in Shaker's open state as well.) The effect of the T442S mutation would be to modify the equilibria of the allosteric transition, making opening much more favorable and thereby rendering the sub1 and sub2 conducting states visible. Similarly to the other scheme, this model predicts the identical charge movements to occur in the sub1 ′ sub2 and sub2 ′ open transitions and predicts that the sub2 state will be visited on the way to and from the final open state.
Of these two schemes, we favor the alternative shown in Fig. 13 A. This scheme Is attractive because the distinct open states provide a simple explanation for the different ion selectivities of the sublevels. Chapman et al. (1997) also argued against the alternative class of schemes involving rapid switching because of the lack of excess noise in their sublevel currents. Nevertheless, there are disagreements in detail between the kinetics we observe and what would be predicted by the scheme In Fig. 13 A. The forward rates we measure for the steps sub1 → sub2 and sub2 → open are much more voltage dependent than the rate constant γ in the model of Zagotta et al. (1994b). Furthermore, from this scheme one expects that dwells in sub1 and sub2 should be visible in wildtype Shaker channels. Based on the rate constants of Zagotta et al., the dwell time in state 13 at 0 mV is about 300 μs, which would result in brief but readily visible sublevels. Such behavior has not been reported in Shaker channels, but we are presently investigating the possibility of its existence.
Subunit Effects on Permeation
Each subunit appears to contribute to the ion permeation pore of the Shaker channel, which is located in the center of the tetrameric protein (Li et al., 1994) and is formed in part by the four P loops (MacKinnon, 1995). This idea is supported by the fact that each subunit has an additive effect on the affinity of the pore blocker TEA (Heginbotham and MacKinnon, 1992; Kavanaugh et al., 1992). It has also been found that in related channel types, including Na+ channels (Heinemann et al., 1992), Ca2+ channels (Ellinor et al., 1995), and cyclic nucleotide–gated channels (Liu et al., 1996), the selectivity properties are influenced by individual subunits or protomeric domains, such that a mutation in a single subunit or domain can dramatically alter the ion selectivity properties.
Because of the particular voltage dependence of dwell times in the sublevels, we were unable to characterize the selectivity of the subconductance states through the measurement of reversal potentials. However, measurements of inward currents through SNS channels showed differing ion selectivities, consistent with the idea that the pore structure changes as the channel activates. We therefore speculate that transitions among the conductance states represent voltage-dependent conformational changes in each subunit, which affect the pore structure. It is interesting to note that the lower-conductance states of the channel tend to exclude the large Rb+ ions. This effect is reminiscent of state-dependent selectivity in the alamethicin channel, where the lowest-conductance state does not pass Ca2+ or Tris ions (Hanke and Boheim, 1980). The subconductance state in a mutant NMDA receptor (Schneggenburger and Ascher, 1997) is also more selective for the smaller Na+ ions over Cs+ ions.
Acknowledgments
We thank Dr. R. MacKinnon for suggesting a closer look at the T442S mutant and for providing the SS construct. We thank Dr. L.Y. Jan (Yale University School of Medicine) for the SN construct, V. Pantani (Yale University School of Medicine) for help with the solution-exchange stepper, Y. Yan (Yale University School of Medicine) for assistance with mutagenesis, and Dr. J. Neyton (Ecole Normale Supérieure, Paris, France) for reading the manuscript.
This work was supported by National Institutes of Health grant NS-21501.
Footnotes
Abbreviations used in this paper: NMDG, N -methyl-d-glucamine; TEA, tetraethylammonium.
references
- Bezanilla F, Armstrong CM. Inactivation of the sodium channel. I. Sodium current experiments. J Gen Physiol. 1977;70:549–566. doi: 10.1085/jgp.70.5.549. [DOI] [PMC free article] [PubMed] [Google Scholar]
- Bezanilla F, Perozo E, Stefani E. Gating of Shaker K+channels: II. The components of gating currents and a model of channel activation. Biophys J. 1994;66:1011–1021. doi: 10.1016/S0006-3495(94)80882-3. [DOI] [PMC free article] [PubMed] [Google Scholar]
- Blumenthal EM, Kaczmarek LK. Modulation by cAMP of a slowly activating potassium channel expressed in Xenopusoocytes. J Neurosci. 1992;12:290–296. doi: 10.1523/JNEUROSCI.12-01-00290.1992. [DOI] [PMC free article] [PubMed] [Google Scholar]
- Brown AM. Functional bases for interpreting amino acid sequences of voltage dependent K channels. Annu Rev Biophys Biomol Struct. 1993;22:173–198. doi: 10.1146/annurev.bb.22.060193.001133. [DOI] [PubMed] [Google Scholar]
- Chapman ML, VanDongen HMA, VanDongen AMJ. Activation-dependent subconductance levels in the drk1 K channel suggest a subunit basis for ion permeation and gating. Biophys J. 1997;72:708–719. doi: 10.1016/s0006-3495(97)78707-1. [DOI] [PMC free article] [PubMed] [Google Scholar]
- Colquhoun, D., and F.J. Sigworth. 1995. Fitting and statistical analysis of single-channel records. In Single-Channel Recording. 2nd Ed. B. Sakmann and E. Neher, editors. Plenum Press, New York. 483–588.
- De Biasi M, Drewe JA, Kirsch GE, Brown AM. Histidine substitution identifies a surface position and confers Cs+ selectivity on a K+pore. Biophys J. 1993a;65:1235–1242. doi: 10.1016/S0006-3495(93)81154-8. [DOI] [PMC free article] [PubMed] [Google Scholar]
- De Biasi M, Hartmann HA, Drewe JA, Taglialatela M, Brown AM, Kirsch GE. Inactivation determined by a single site in K+pores. Pflugers Arch. 1993b;422:354–363. doi: 10.1007/BF00374291. [DOI] [PubMed] [Google Scholar]
- Durell SR, Guy HR. Structural model of the outer vestibule and selectivity filter of the Shaker voltage-gated K+channel. Neuropharmacology. 1996;35:761–773. doi: 10.1016/0028-3908(96)00097-4. [DOI] [PubMed] [Google Scholar]
- Ellinor PT, Wang J, Sather WA, Zhang JF, Tsien R. Ca++ channel selectivity at a single locus for high-affinity Ca++interactions. Neuron. 1995;15:1121–1132. doi: 10.1016/0896-6273(95)90100-0. [DOI] [PubMed] [Google Scholar]
- Ferguson WB, McManus OB, Magleby KL. Opening and closing transitions for BK channels often occur in two steps via sojourns through a brief lifetime subconductance state. Biophys J. 1993;65:702–714. doi: 10.1016/S0006-3495(93)81097-X. [DOI] [PMC free article] [PubMed] [Google Scholar]
- Fox JA. Ion channel subconductance states. J Membr Biol. 1987;97:1–8. doi: 10.1007/BF01869609. [DOI] [PubMed] [Google Scholar]
- Hanke W, Boheim G. The lowest conductance state of the alamethicin pore. Biochim Biophys Acta. 1980;596:456–462. doi: 10.1016/0005-2736(80)90134-0. [DOI] [PubMed] [Google Scholar]
- Heginbotham L, MacKinnon R. The aromatic binding site for tetraethylammonium ion on potassium channels. Neuron. 1992;8:483–491. doi: 10.1016/0896-6273(92)90276-j. [DOI] [PubMed] [Google Scholar]
- Heginbotham L, MacKinnon R. Conduction properties of the cloned Shaker K+channel. Biophys J. 1993;65:2089–2096. doi: 10.1016/S0006-3495(93)81244-X. [DOI] [PMC free article] [PubMed] [Google Scholar]
- Heginbotham L, Abramson T, MacKinnon R. A functional connection between the pores of distantly related ion channels as revealed by mutant K+channels. Science (Wash DC) 1992;258:1152–1155. doi: 10.1126/science.1279807. [DOI] [PubMed] [Google Scholar]
- Heginbotham L, Lu Z, Abramson T, MacKinnon R. Mutations in the K+channel signature sequence. Biophys J. 1994;66:1061–1067. doi: 10.1016/S0006-3495(94)80887-2. [DOI] [PMC free article] [PubMed] [Google Scholar]
- Heinemann SH, Terlau H, Stuhmer W, Imoto K, Numa S. Calcium channel characteristics conferred on the sodium channel by single mutations. Nature (Lond) 1992;356:441–443. doi: 10.1038/356441a0. [DOI] [PubMed] [Google Scholar]
- Hille, B. 1992. Ionic Channels of Excitable Membranes. 2nd Ed. Sinauer Associates, Inc. Sunderland, MA.
- Hoshi T, Zagotta WN, Aldrich RW. Shaker potassium channel gating. I: Transitions near the open state. J Gen Physiol. 1994;103:249–278. doi: 10.1085/jgp.103.2.249. [DOI] [PMC free article] [PubMed] [Google Scholar]
- Kamb A, Tseng-Crank J, Tanouye MA. Multiple products of the DrosophilaShaker gene may contribute to potassium channel diversity. Neuron. 1988;1:421–430. doi: 10.1016/0896-6273(88)90192-4. [DOI] [PubMed] [Google Scholar]
- Kavanaugh MP, Hurst RS, Yakel J, Varnum MD, Adelman JP, North RA. Multiple subunits of a voltage-dependent potassium channel contribute to the binding site for tetraethylammonium. Neuron. 1992;8:493–497. doi: 10.1016/0896-6273(92)90277-k. [DOI] [PubMed] [Google Scholar]
- Kirsch GE, Drewe JA, Hartmann HA, Taglialatela M, de Biasi M, Brown AM, Joho RH. Differences between the deep pores of K+channels determined by an interacting pair of nonpolar amino acids. Neuron. 1992;8:499–505. doi: 10.1016/0896-6273(92)90278-l. [DOI] [PubMed] [Google Scholar]
- Li M, Unwin N, Stauffer KA, Jan YN, Jan LY. Images of purified Shaker potassium channels. Curr Biol. 1994;4:110–115. doi: 10.1016/s0960-9822(94)00026-6. [DOI] [PubMed] [Google Scholar]
- Liu DT, Tibbs GR, Siegelbaum SA. Subunit stoichiometry of cyclic nucleotide-gated channels and effects of subunit order on channel function. Neuron. 1996;16:983–990. doi: 10.1016/s0896-6273(00)80121-x. [DOI] [PubMed] [Google Scholar]
- Lopez GA, Jan YN, Jan LY. Evidence that the S6 segment of the Shaker voltage-gated K+channel comprises part of the pore. Nature (Lond) 1994;367:179–182. doi: 10.1038/367179a0. [DOI] [PubMed] [Google Scholar]
- Lü Q, Miller C. Silver as a probe of pore-forming residues in a potassium channel. Science (Wash DC) 1995;268:304–307. doi: 10.1126/science.7716526. [DOI] [PubMed] [Google Scholar]
- MacKinnon R. Pore loops: an emerging theme in ion channel structure. Neuron. 1995;14:889–892. doi: 10.1016/0896-6273(95)90327-5. [DOI] [PubMed] [Google Scholar]
- MacKinnon R, Miller C. Mutant potassium channels with altered binding of charybdotoxin, a pore-blocking peptide inhibitor. Science (Wash DC) 1989;245:1382–1385. doi: 10.1126/science.2476850. [DOI] [PubMed] [Google Scholar]
- MacKinnon R, Yellen G. Mutations affecting TEA blockade and ion permeation in voltage-activated K+channels. Science (Wash DC) 1990;250:276–279. doi: 10.1126/science.2218530. [DOI] [PubMed] [Google Scholar]
- Moss GW, Moczydlowski E. Rectifying conductance substates in a large conductance Ca2+-activated K+channel: evidence for a fluctuating barrier mechanism. J Gen Physiol. 1996;107:47–68. doi: 10.1085/jgp.107.1.47. [DOI] [PMC free article] [PubMed] [Google Scholar]
- Perez-Cornejo P, Begenisich T. The multi-ion nature of the pore in Shaker K+channels. Biophys J. 1994;66:1929–1938. doi: 10.1016/S0006-3495(94)80986-5. [DOI] [PMC free article] [PubMed] [Google Scholar]
- Schneggenburger R, Ascher P. Coupling of permeation and gating in an NMDA-channel pore mutant. Neuron. 1997;18:167–177. doi: 10.1016/s0896-6273(01)80055-6. [DOI] [PubMed] [Google Scholar]
- Schwarz TL, Jan LY. Multiple potassium-channel components are produced by alternative splicing at the Shaker locus in Drosophila. Nature (Lond) 1988;331:137–142. doi: 10.1038/331137a0. [DOI] [PubMed] [Google Scholar]
- Sigworth FJ. Voltage gating of ion channels. Q Rev Biophys. 1994;27:1–40. doi: 10.1017/s0033583500002894. [DOI] [PubMed] [Google Scholar]
- Stühmer W, Conti F, Stocker M, Pongs O, Heinemann SH. Gating currents of inactivating and non-inactivating potassium channels expressed in Xenopusoocytes. Pflugers Arch. 1991;418:423–429. doi: 10.1007/BF00550881. [DOI] [PubMed] [Google Scholar]
- Taglialatela M, Kirsch GE, VanDongen AM, Drewe JA, Hartmann HA, Joho RH, Stefani E, Brown AM. Gating currents from a delayed rectifier K+channel with altered pore structure and function. Biophys J. 1992;62:34–36. doi: 10.1016/S0006-3495(92)81770-8. [DOI] [PMC free article] [PubMed] [Google Scholar]
- Taglialatela M, Drewe JA, Kirsch GE, De Biasi M, Hartmann HA, Brown AM. Regulation of K+/Rb+ selectivity and internal TEA blockade by mutations at a single site in K+pores. Pflugers Arch. 1993;423:104–112. doi: 10.1007/BF00374967. [DOI] [PubMed] [Google Scholar]
- Warmke JW, Ganetzky B. A family of potassium channel genes related to eag in Drosophilaand mammals. Proc Natl Acad Sci USA. 1994;91:3438–3442. doi: 10.1073/pnas.91.8.3438. [DOI] [PMC free article] [PubMed] [Google Scholar]
- Yellen G, Jurman ME, Abramson T, MacKinnon R. Mutations affecting internal TEA blockade identify the probable pore-forming region of a K+channel. Science (Wash DC) 1991;251:939–942. doi: 10.1126/science.2000494. [DOI] [PubMed] [Google Scholar]
- Yool AJ, Schwarz TL. Alteration of ionic selectivity of a K+channel by mutation of the H5 region. Nature (Lond) 1991;349:700–704. doi: 10.1038/349700a0. [DOI] [PubMed] [Google Scholar]
- Yool AJ, Schwarz TL. Interactions of the H5 pore region and hydroxylamine with N-type inactivation in the Shaker K+channel. Biophys J. 1995;68:448–458. doi: 10.1016/S0006-3495(95)80206-7. [DOI] [PMC free article] [PubMed] [Google Scholar]
- Yool AJ, Schwarz TL. Anomalous mole fraction effect induced by mutation of the H5 pore region in the Shaker K+channel. Biophys J. 1996;71:2467–2472. doi: 10.1016/S0006-3495(96)79440-7. [DOI] [PMC free article] [PubMed] [Google Scholar]
- Zagotta WN, Hoshi T, Dittman J, Aldrich RW. Shaker potassium channel gating. II: Transitions in the activation pathway. J Gen Physiol. 1994a;103:279–319. doi: 10.1085/jgp.103.2.279. [DOI] [PMC free article] [PubMed] [Google Scholar]
- Zagotta WN, Hoshi T, Aldrich RW. Shaker potassium channel gating. III: Evaluation of kinetic models for activation. J Gen Physiol. 1994b;103:321–362. doi: 10.1085/jgp.103.2.321. [DOI] [PMC free article] [PubMed] [Google Scholar]