Abstract
The collecting duct regulates Na+ transport by adjusting the abundance/activity of epithelial Na+ channels (ENaC). In this study we have investigated the synthesis, degradation, endocytosis, and activity of ENaC and the effects of aldosterone on these processes using endogenous channels expressed in the A6 cell line. Biochemical studies were performed with a newly raised set of specific antibodies against each of the three subunits of the amphibian ENaC. Our results indicate simultaneous transcription and translation of α, β, and γ subunits and enhancement of both processes by aldosterone: two- and fourfold increase, respectively. The biosynthesis of new channels can be followed by acquisition of endoglycosidase H–resistant oligosacharides in α and β subunits and, in the case of α, by the appearance of a form resistant to reducing agents. The half-life of the total pool of subunits (t 1/2 40–70 min) is longer than the fraction of channels in the apical membrane (t 1/2 12–17 min). Aldosterone induces a fourfold increase in the abundance of the three subunits in the apical membrane without significant changes in the open probability, kinetics of single channels, or in the rate of degradation of ENaC subunits. Accordingly, the aldosterone response could be accounted by an increase in the abundance of apical channels due, at least in part, to de novo synthesis of subunits.
Keywords: biotinylation, cellular traffic, short-circuit current, open probability, ENaC
INTRODUCTION
Approximately 2% of the total daily sodium filtered by the kidney is reabsorbed by epithelial sodium channels (ENaC)* from the distal tubule. Under physiological conditions, ENaC activity is adjusted to match variations in daily sodium intake to the status of the extracellular volume (Garty and Palmer, 1997; Alvarez de la Rosa et al., 2000). Given the importance of ENaC on the maintenance of extracellular volume and blood pressure, many mechanisms have evolved to regulate the kinetics, synthesis, degradation, and subcellular localization of these channels.
In spite of the progress made on the understanding of ENaC regulation at the molecular level, many questions remain to be answered, in particular those regarding biosynthesis and traffic of channels and how these processes are regulated by aldosterone. It is well established that aldosterone binds to the mineralocorticoid receptor and functions as a transcriptional factor; however, the mechanisms by which aldosterone stimulates ENaC in the renal epithelium have not been satisfactorily elucidated. For instance, in rat kidney one study reported that aldosterone increased mRNA levels of the β and γ subunits but little of α (Asher et al., 1996), whereas another study showed increase of only α mRNA (Stokes and Sigmund, 1998). At the protein level aldosterone has been shown to significantly increase only the α subunit in rat kidney (Masilamani et al., 1999) and in A6 cells (May et al., 1997). Other studies have found mainly posttranslational effects such as increases in open probability (Kemendy et al., 1992), or have postulated translocation of channels from an intracellular pool to the plasma membrane in the early portion of the collecting tubule (Masilamani et al., 1999; Loffing et al., 2001).
In this work we have used the A6 cell line derived from Xenopus laevis kidney to examine the biosynthesis, cellular traffic, degradation, and activity of endogenously expressed ENaC both in the absence and presence of aldosterone. A6 cells not only express ENaC but also they respond to aldosterone by increasing channel activity in a way that parallels the physiological response of the mammalian collecting duct. In addition, all the genes that regulate the activity of ENaC have been originally identified or later found in this cell line (channel-activating enzyme 1 [CAP1], serum- and glucocorticoid-induced kinase (sgk), K-Ras, Nedd4–2) (Vallet et al., 1997; Mastroberardino et al., 1998; Chen et al., 1999; Kamynina et al., 2001). Hence, A6 cells constitute a good model to examine the regulation of ENaC by aldosterone. Studies were done with endogenous channels to avoid potential artifacts introduced by overexpression of subunits. Biosynthesis and degradation of channels were studied using a new set of three antibodies specific for each of the Xenopus epithelial sodium channel (xENaC) subunits, whose characterization is included in this work. Activity of ENaC was assessed with the patch-clamp technique and measurements of transepithelial voltage (VT) and equivalent short-circuit current (Isc).
MATERIALS AND METHODS
Plasmid Constructs
Full-length α, β, and γ Xenopus ENaC subunit cDNAs (Puoti et al., 1995) were subcloned in pcDNA3.1 (Invitrogen). Green fluorescent protein (GFP) was fused to the NH2-terminus of αENaC in the pEGFP-C1 vector (CLONTECH Laboratories, Inc.). All constructs were sequenced at the HHMI/Keck sequencing facility at Yale University.
Antibody Generation and Purification
Rabbit polyclonal antibodies against the three Xenopus ENaC subunits were generated against glutathione S-transferase (GST) fusion proteins containing the sequences H544-N632 for α, T149-N226 for β, and R566-L660 for γ. Affinity purification of sera was done by absorption first, to a GST Hi-trap column (Amersham Pharmacia Biotech), and subsequently to a column containing the specific GST fusion protein.
Cell Culture and Transfection
A6 cells were provided by Dr. John Hayslett (Yale University, New Haven, CT) (Hayslett et al., 1995). Cells were maintained in amphibian medium (0.75× DMEM, 10% FBS, buffered with sodium bicarbonate) in an incubator set at 27°C and with 1.5% CO2. All experiments were performed between passages 105 and 115. Cells were expanded on plastic dishes and then seeded on permeable supports (Transwell® polycarbonate membrane with a pore size of 0.4 μm; Costar). For biochemical experiments we used filters of an area of 4.7 cm2 and for measurements of Isc we used filters of 0.33 cm2. After 8 d in culture, cells were washed twice with serum-free amphibian medium and kept for two more days in the same medium before the experiments were performed. Transient transfection of A6 cells grown on plastic dishes was performed with Lipofectamine (Life Technologies).
Metabolic Labeling and Immunoprecipitations
Cells were washed twice with serum-free amphibian medium without methionine and cysteine and incubated for 15 min in the same medium. Cells were then labeled with a mixture of [35S]methionine and [35S]cysteine (150 μCi/ml; Amersham Pharmacia Biotech) for different periods of time. When appropriate, chase medium containing a 10-fold molar excess of both methionine and cysteine was added and cells were returned to the incubator for different periods of time. Immunoprecipitation of ENaC subunits was performed as described (Shimkets et al., 1998). Protein concentration in the lysates was measured with the bicinchoninic acid procedure (Pierce Chemical Co.) and equal amounts of protein were processed. GFP-αENaC fusion protein was immunoprecipitated with a commercial polyclonal antibody (CLONTECH Laboratories, Inc.). The amounts of antibodies and protein-A beads added to recover the immune complexes were titrated to ensure complete recovery of antigens from the lysates. The batches of antibodies used in all experiments were the same and the protein-A beads of equal binding capacity. Complete recovery of antigens was tested in the following way. First we immunoprecipitated the antigen with 5 μl of crude serum and 100 μl of a 1:5 (vol/vol) slurry of protein-A beads (Sigma-Aldrich). The remaining lysate was reextracted with 100 μl of protein-A beads. This was done to test if all the antibody from the first immunoprecipitation was removed with the initial amount of beads. Next, we added fresh antibody and beads and repeated the procedure. The conditions with which all antigens were recovered in the first immunoprecipitation were chosen for all subsequent experiments. The total amount of proteins in the lysate was kept constant.
Where indicated, immunoprecipitates were treated with PNGase-F (New England Biolabs, Inc.), endoglycosidase H (Endo-H) (Roche Biochemicals), calf intestinal alkaline phosphatase (New England Biolabs, Inc.), or shrimp alkaline phosphatase (Roche Biochemicals) following the manufacturer's instructions. Immune complexes were resolved in 10% SDS-PAGE and transferred to Immobilon-P (Millipore). Membranes were exposed to Biomax MR film (Eastman Kodak Co.) with a Biomax intensifying screen. Scanning of autoradiographs and densitometry analysis were performed in a GS-800 Densitometer and Quantity One software (Bio-Rad Laboratories).
In a group of experiments, cells were pulse-labeled with [35S]methionine and [35S]cysteine and then incubated with chase medium for one hour in the presence of iodoacetamide (Sigma-Aldrich). Cells were lysed and αENaC was immunoprecipitated as described above.
Membrane Protein Biotinylation
Biotinylation and recovery of apical membrane proteins were performed essentially as described (Gottardi et al., 1995) using Sulfo-NHS-SS-Biotin (Pierce Chemical Co.). For chase experiments, cells were returned to the incubator after finishing the biotinylation procedure. Protein concentration in the cell lysates was measured with the BCA kit (Pierce Chemical Co.) and equal amounts of total protein were processed. Biotinylated proteins were recovered with streptavidine-agarose beads (Pierce Chemical Co.). The amount of added beads was adjusted to ensure complete recovery of biotinylated proteins from lysates. Biotinylated proteins were eluted from the beads by heating to 90°C in SDS-PAGE sample buffer.
Western Blot Analysis
After separation in 10% SDS-PAGE gels, proteins were transferred to Immobilon-P membranes (Millipore) and ENaC subunits were detected by Western blotting with affinity purified anti-xENaC antibodies at 1:2,000 dilution. Actin and calnexin were detected with commercially available antibodies (mouse monoclonal antiactin antibody, Chemicon International; rabbit polyclonal anticalnexin antibody, StressGen Biotechnologies). Anti–rabbit or anti–mouse IgG secondary antibodies conjugated to peroxidase (Sigma-Aldrich) were used at 1:10,000 dilution and the signal was developed with the ECL+ system (Amersham Pharmacia Biotech). Quantification of Western blot signals was performed as described for immunoprecipitation experiments.
Northern Blot Analysis
Total RNA from A6 cells grown on filters was extracted with the RNeasy kit (QIAGEN) and quantified by absorption spectroscopy. RNA was fractionated on glyoxal/dimethyl sulfoxide agarose gels and transferred to nylon membranes as described (Sambrok et al., 1989). Probes including the entire cDNA of each of the xENaC subunits or β-actin were labeled with 32P-dCTP by random priming and used to detect the specific mRNAs by hybridization and autoradiography. Intensities of bands were quantified with a laser-scanning densitometer and normalized to the signal given by β-actin.
Equivalent Short-circuit Current Measurements
The VT and Isc across confluent monolayers of A6 cells were measured with Ag/AgCl2 electrodes (made at Yale electronics shop) connected to a DVC-1000 voltage/current-clamp apparatus (World Precision Instruments). Transepithelial resistance (RT) was calculated from VT and Isc using Ohm's law.
Patch-clamp Experiments
For patch clamp experiments A6 cells were grown on 0.33-cm2 transparent permeable supports (Falcon; Becton Dickinson). 7 d after seeding, serum was removed from cultures for 24 h (control group) and 100 nM aldosterone was added for ∼12 h (aldosterone-treated group). Cups were cut 4–5 mm above the membrane with a fine saw before placement on the recording chamber to allow access to the apical membrane with the patch pipette and perfusion of the apical and basolateral sides of the filters. Cell-attached patches were performed with patch pipettes pulled from borosilicate glass (LG16; Dagan Corporation) using a micropipette puller (PP-83; Narishige, Scientific Instrument Lab). Pipettes were fire-polished to a final tip diameter of 1 μm and coated with Sylgard when filled with solutions had resistances of 5–10 MΩ. Unitary currents were recorded with an Axopatch-200B amplifier (Axon Instruments, Inc.) using a DigiData 1200 interface and pClamp 8.01 software both from Axon Instruments, Inc. Data were acquired at 2 kHz, filtered at 1 kHz, and stored on a computer hard disc for analysis.
The composition of the pipette solution was (in mM): 100 NaCl, 3 KCl, 1 CaCl2, 10 HEPES, pH adjusted to 7.4. Chamber solution was serum-free culture medium buffered to pH 7.4 with 10 mM HEPES. Recordings were done at 40 mV in the pipette and at room temperature.
The apparent number of channels per patch was determined from the maximal number of transitions observed during at least 10 min of continuous recording. Open probability was calculated from the value of NPo using pClamp software.
Statistical Analysis
Data points represent the mean of N number of independent experiments ± SEM. Differences between groups were evaluated with nonpaired t test. P and N values are given in the text or figure legends.
RESULTS
Characterization of Specific Antibodies Against Xenopus ENaC Subunits
We developed specific antibodies against α, β, and γ subunits from xENaC. Specificity of the antibodies was first tested by their ability to immunoprecipitate xENaC subunits expressed in transiently transfected A6 cells and [35S]-radiolabeled for 15 min. α subunit was detected as a single band migrating at 85 kD, β subunit at 100 kD, and γ subunit at 90 kD (Fig. 1 A). Electrophoretic migration of each of the proteins corresponds to the molecular weight of the core glycosylated form as predicted by the sequence of the corresponding cDNA (Puoti et al., 1995). No signal was detected in untransfected cells (Fig. 1 A). We next used the antibodies to detect endogenous xENaC expressed in A6 cells grown on filters for at least 8 d and [35S]-radiolabeled for 2 h. The α antibody immunoprecipitated two bands, one at 85 kD, previously shown in transfected cells, and a second one that migrated at 65 kD. Both bands could be competed away by including GST-α fusion protein in the immunoprecipitation mix and were undetectable with preimmune serum (Fig. 1 B). Anti-β antibody immunoprecipitated proteins of 100 and 115 kD, whereas the γ antibody recovered a single band of 90 kD. In both cases the bands were not present when the immunoprecipitation was competed with the corresponding fusion protein or when preimmune serum was used (Fig. 1 B). Affinity-purified antibodies detected the same bands when used on Western blots of a crude microsomal fraction of A6 cells grown on filters (Fig. 1 C).
Figure 1.
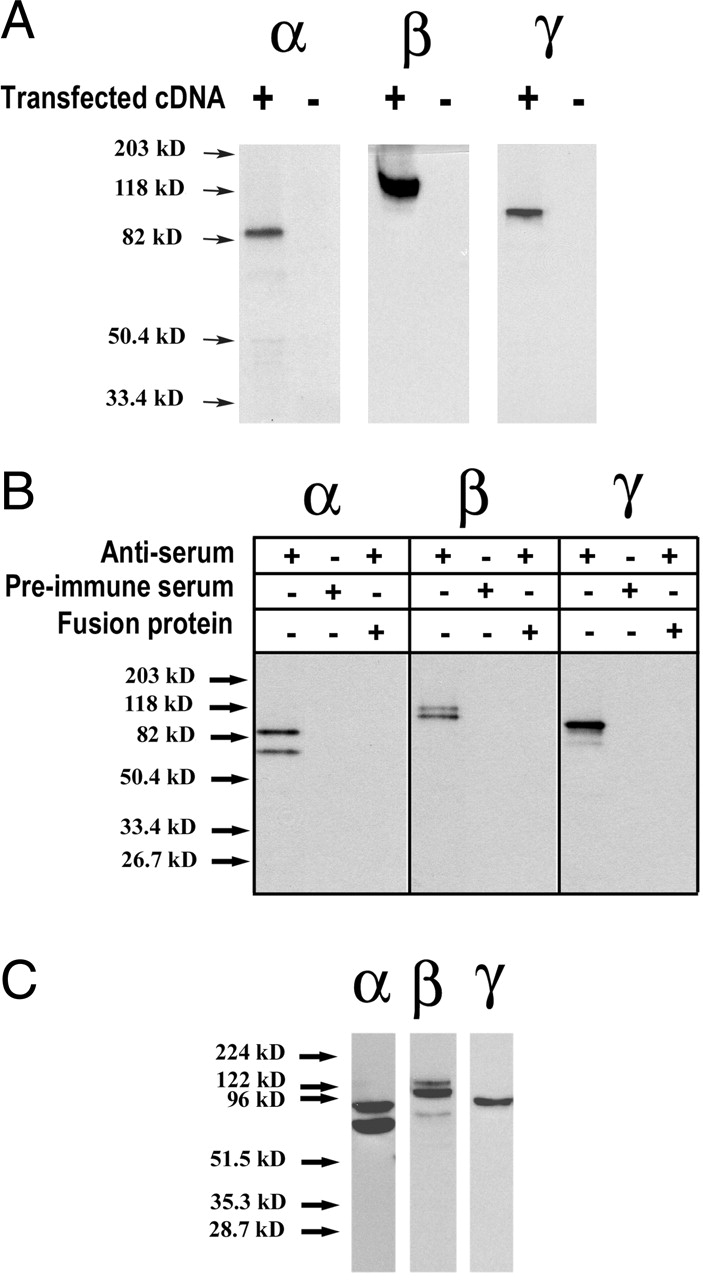
Antibody characterization and recognition of endogenously expressed ENaC in A6 cells. (A) A6 cells grown on plastic were transiently transfected with plasmid constructs containing α, β, or γ ENaC subunits. Cells were pulse-labeled for 15 min with [35S]-methionine and [35S]-cysteine and each subunit was immunoprecipitated with anti-Xenopus ENaC antibodies. Negative controls of mock-transfected cells were included in each experiment. (B) Polarized A6 cells grown on filters were [35S]-labeled for 2 h and endogenous ENaC subunits were immunoprecipitated with anti-Xenopus ENaC antibodies. Controls, including the immunogenic fusion proteins or with preimmune serums, are also shown. (C) Microsomal proteins from A6 cells grown on filters were resolved on a 10% SDS-PAGE, transferred to membranes, and detected with the specific xENaC antibodies by Western blots.
State of Glycosylation of the ENaC Subunits in A6 Cells
The state of glycosylation of the ENaC subunits was investigated in polarized A6 cells grown on permeable supports. Cells were radiolabeled for 2 h and ENaC subunits were recovered from whole-cell lysates by immunoprecipitation. Samples were treated with PNGase-F or with Endo-H to remove N-linked oligosacharides or the mannose sensitive component, respectively. The anti-α antibody immunoprecipitates two proteins, as previously shown in Fig. 1 B. Treatment with PNGase-F shifts migration of the 85-kD band (marked with an asterisk in Fig. 2) to ∼75 kD, which is the predicted mol wt of the nonglycosylated α subunit, whereas the 65-kD band (marked with X) shifts to 55 kD. The 10-kD change after deglycosylation in the two α bands suggests that they have the same number of N-linked oligosaccharides.
Figure 2.
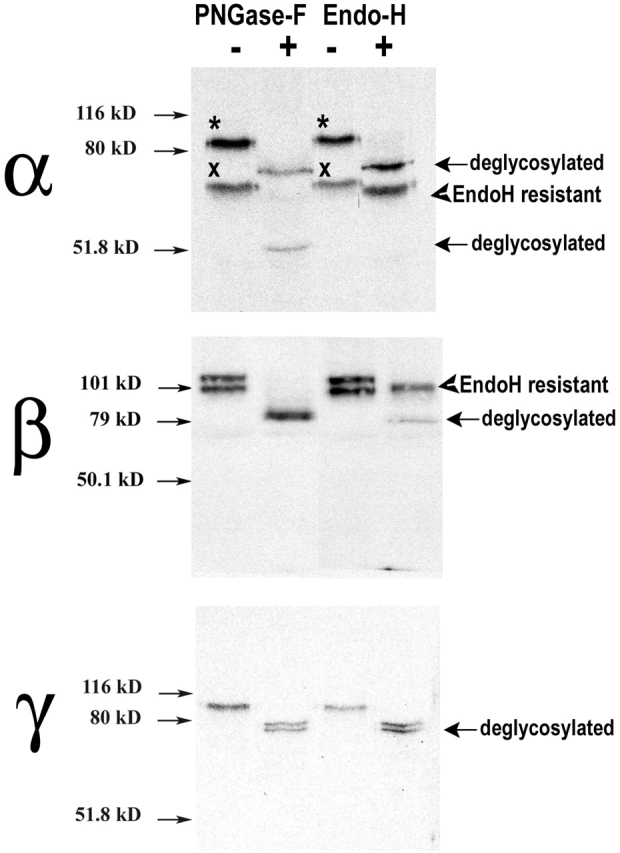
Glycosylation of ENaC subunits. A6 cells grown on filters were metabolically labeled for 2 h and α, β, and γ subunits were immunoprecipitated with the corresponding specific antibody. Parallel samples were treated with PNGase-F or Endo-H. Deglycosylated bands are indicated with arrows. Arrowheads point to endo-H–resistant bands. Asterisks mark the slower migrating bands and crosses mark the faster migrating bands of the α subunit.
Digestion with Endo-H shifts the 85-kD α band to 75 kD, whereas the 65-kD band is almost completely resistant. These results indicate that the 65-kD α band is located in the Golgi and/or post-Golgi compartments where sugars become resistant to digestion by Endo-H.
The anti-β antibody immunoprecipitates proteins of 115 and 100 kD. Both are sensitive to PNGase-F, which brings the mol wt to 80 kD, as predicted from the cDNA sequence. In contrast, Endo-H deglycosylates only the 100-kD protein and leaves intact the 115 kD; hence, the latter contains more matured sugars (Fig. 2).
The γ subunit was recovered from the lysates as a single band of ∼90 kD, which was sensitive to PNGase-F and Endo-H. After treatment with these enzymes, the γ subunit appears as a doublet that could represent partial deglycosylation (Fig. 2).
Maturation of the α Subunit Gives Rise to a Form with Smaller Apparent Mol Wt
As indicated in the previous section, Xenopus α subunit is detected on SDS-PAGE as two bands, 85 and 65 kD, suggesting that a fraction of the α proteins undergoes a posttranslational modification that changes its mobility. We investigated the nature of the modification by first examining whether the change in apparent MW results from a proteolytic cleavage of the α subunit. It has been previously postulated that ENaC residing in the apical membrane might be activated by extracellular proteases (trypsin) (Chraibi et al., 1998) or proteases tethered to the apical membrane, such as CAP1 (Vallet et al., 1997), that could cleave the extracellular domain of the subunits. Since our antibody recognizes the COOH terminus of α, the change in molecular size can only be explained by a loss of residues from the NH2 terminus of the protein. A fusion protein linking GFP to the NH2 terminus of αENaC was generated and the cDNA construct was transfected in A6 cells. After metabolic labeling for 2 h, we recovered α subunits by immunoprecipitation with a commercial polyclonal anti-GFP antibody or with the antibody against the COOH terminus of the α subunit. As shown in Fig. 3 A, both antibodies immunoprecipitated the two proteins. One band was detected at ∼115 kD, the expected molecular weight for the GFP-α fusion protein, whereas the second band was detected at ∼95 kD, a 20-kD difference, as was observed with the wild-type αENaC. This result indicates that the change in mobility of α is not due to proteolysis because the NH2 and COOH termini are present in the protein.
Figure 3.
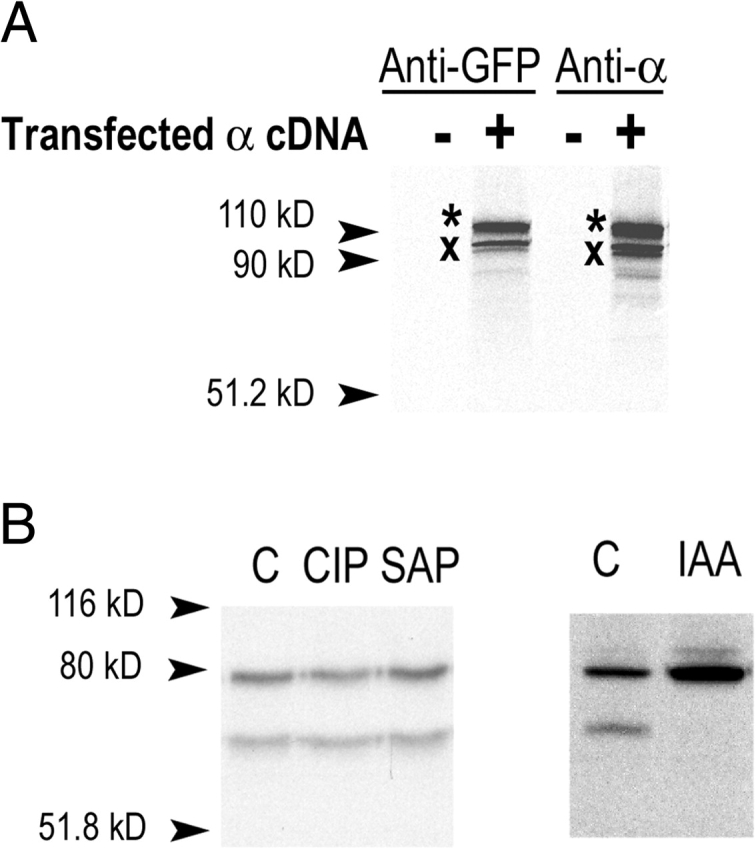
Maturation of xENaC α subunit. (A) A6 cells grown on plastic were transiently transfected with a plasmid construct expressing a GFP-αENaC fusion protein. Cells were metabolically labeled for 2 h and the recombinant protein was immunoprecipitated with antibodies against α COOH terminus or against GFP. Negative controls of mock-transfected cells are shown. (B) Endogenously expressed αENaC in A6 cells grown on permeable supports was immunoprecipitated and treated with phosphatases CIP or SAP. Independently, cells were treated with IAA. The slower migrating band of the α subunit disappeared after treatment with IAA.
We next investigated the possibility that phosphorylation could account for the aberrant migration in SDS-PAGE. Immunoprecipitated [35S]-radiolabeled αxENaC was treated with phosphatases (calf intestinal alkaline phosphatase or shrimp alkaline phosphatase). Neither of these enzymes altered the migration of the two bands, indicating that phosphorylation is not implicated in the change of mobility (Fig. 3 B). In contrast, alkylation with iodoacetamide (IAA) in the presence of the reducing agent DTT completely eliminated the lower band (Fig. 3 B). This result indicates that the Xenopus α subunit is prone to form disulfide bridges resistant to reducing agents. Moreover, the formation of stable disulfide bridges does not occur in recently synthesized protein, but after it has acquired resistance to Endo-H (Fig. 2). The most convincing evidence that the 65-kD band corresponds to a modification of the α subunit is provided by pulse-chase experiments (see Fig. 6 A), which will be described later in this section.
Figure 6.
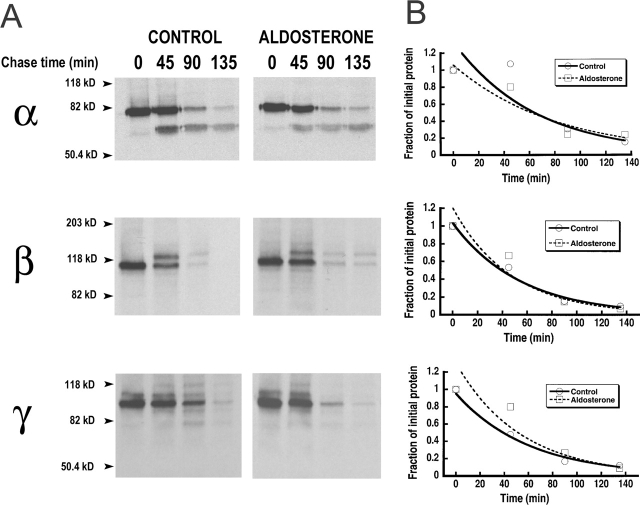
Turnover of the total cellular pool of ENaC subunits without and with aldosterone. (A) Control cells or cells pretreated with aldosterone for 6 h were pulse-labeled with [35S]-methionine and [35S]-cysteine for 30 min and then chased with cold medium for the indicated periods of time (minutes). α, β, and γ subunits were immunoprecipitated from the lysates and resolved on SDS-PAGE. A representative autoradiograph of each subunit is shown. (B) Scanning densitometry values from autoradiographs shown in A. Values were normalized to the 0 time-point.
Steady-state Levels of Total and Cell Surface ENaC Subunits
We next examined the levels of expression of the three subunits of ENaC in the whole cell and in the apical plasma membrane and the effect of aldosterone on the abundance of channels in these cellular locations. Levels of expression of α, β, and γ subunits were assessed by Western blot analysis of whole cell lysates and of surface biotinylated proteins (Fig. 4 B). Western blots of total protein indicated that aldosterone increases the abundance of the three subunits by three- to fivefold as shown in the graphs from Fig. 4 B (open circles), where each data point represents the mean value (±SEM) from densitometric analysis of five independent experiments.
Figure 4.
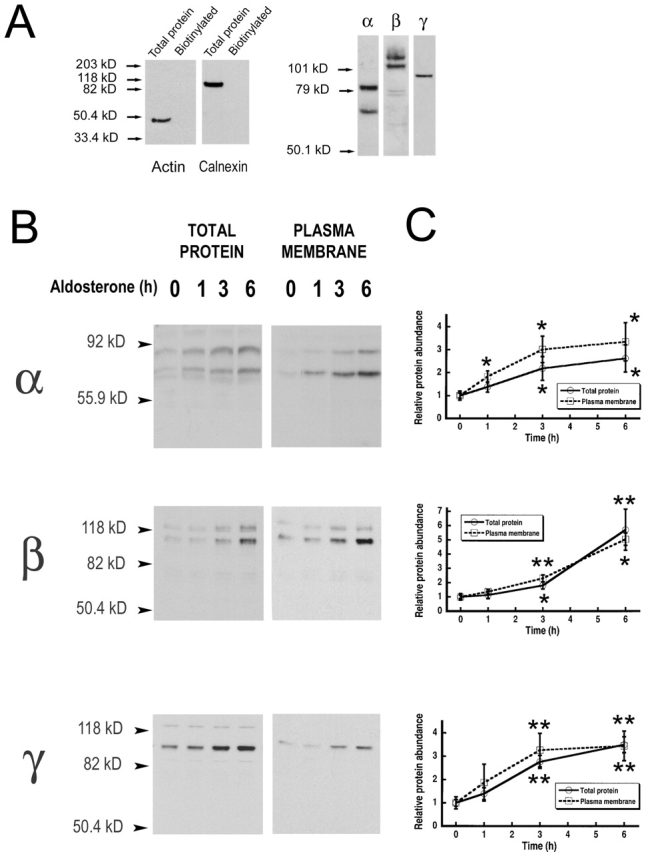
Steady-state levels of total and cell surface ENaC subunits. (A) A6 cells apical plasma membrane proteins were biotinylated, recovered from cell lysates with streptavidine beads, and analyzed by Western blot with antibodies against actin, calnexin, and xENaC subunits. Actin and calnexin blots include a lane with an extract of total proteins and a lane with biotinylated protein. (B) A6 cells were treated for indicated times with 100 nM aldosterone followed by apical biotinylation. Aliquots of cell lysates containing 20 μg of protein were analyzed by Western blot with anti–xENaC antibodies (total protein). Biotinylated proteins were recovered with streptavidine-agarose beads and analyzed by Western blot (plasma membrane). Representative experiments are shown for each subunit. (B) Time course of the change in abundance of total (circles) and surface (squares) subunits examined by scanning densitometry. Each data point represents the mean ± SE of five experiments. Student's t tests were used to compare the value at each time point with the value at 0 h. Asterisks above dotted line refer to plasma membrane values. Asterisks below solid line refer to total protein values. *, P < 0.05; **, P < 0.01.
Expression of apical channels was evaluated by surface biotinylation of apical proteins with an impermeant analogue of biotin. Biotinylated proteins were recovered with streptavidine-agarose beads and detected with specific antibodies for each of the subunits of xENaC. To ensure that only ENaC resident in the plasma membrane and not in intracellular compartments was being detected by this procedure, we performed controls with intracellular proteins. Actin, a cytoskeletal protein, and calnexin, an abundant ER-resident plasma membrane protein, were used as controls for the specificity of surface biotinylation. These proteins could be detected in cell lysates, but not in the pool of proteins recovered after apical biotinylation (Fig. 4 A), indicating that neither surface biotinylation nor the recovery procedure of biotinylated proteins was contaminated by intracellular proteins.
The levels of biotinylated α, β, and γ subunits followed a progressive increment after treatment with aldosterone of similar magnitude as the one detected in whole cell lysates (Fig. 4 B). The aldosterone effect was already apparent at 3 h and reached a peak at 6 h (squares Fig. 4 B).
Interestingly, biotinylation of the apical proteins detected core and complex-glycosylated α and β subunits, and only core-glycosylated γ; thus, complex glycosylation is not required to reach the plasma membrane.
Synthesis of ENaC Subunits
The increased abundance of ENaC subunits induced by aldosterone can reflect an increase in the rate of synthesis, a decrease in the rate of degradation, or a combination of these two processes. We first investigated the rate of synthesis of the three subunits in the presence of aldosterone. Cells were treated with aldosterone for 0, 1, 3, or 6 h, metabolically labeled for a 15-min pulse and immunoprecipitated with ENaC antibodies. Fig. 5 A shows a representative example of the rate of synthesis of α, β, and γ ENaC and Fig. 5 B shows the time course of the aldosterone effect on protein synthesis obtained by averaging four independent experiments. Aldosterone increased the rate of synthesis of the three subunits with similar kinetics. Maximal effect, fourfold increase, was observed with a pretreatment of 6 h, although at 3 h there was already a significant increase in protein synthesis.
Figure 5.
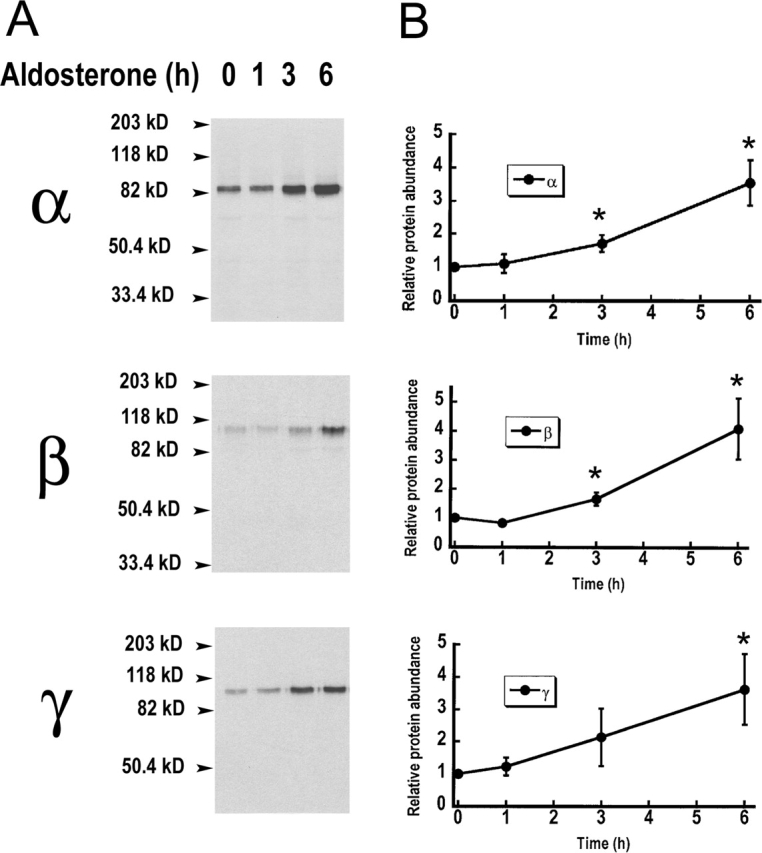
Aldosterone effects on the rate of synthesis of ENaC subunits. (A) A6 cells grown on filters were pretreated with 100 nM aldosterone for the indicated periods of time (in hours). Cells were then metabolically radiolabeled for 15 min and ENaC subunits were immunoprecipitated. A representative example for α, β, and γ subunits is shown. (B) Graphs represent the time course of the rate of synthesis of subunits in the presence of aldosterone. Values were normalized to the 0 time-point. Autoradiographs were analyzed by scanning densitometry. Each data point is the mean ± SE of four independent experiments. *, P < 0.05.
In the experiment shown in Fig. 5 A, the α subunit is detected as a single band that migrates at 85 kD. The 65-kD band does not show in this experiment because during the 15 min of labeling, modification and processing of the α subunit have not yet occurred, and only the early 85-kD band is apparent. The same is true for the β subunit.
Rate of Degradation and Half-life of ENaC Subunits in the Whole Cell and in the Apical Membrane
The previous experiments demonstrated a coordinated increase in the steady-state abundance and in rate of synthesis of the three subunits induced by aldosterone. However, aldosterone could also increase the levels of ENaC protein by stabilizing the subunits. To address this possibility we examined the rate of degradation in the absence and presence of aldosterone. Pulse-chase experiments of metabolically radiolabeled cells were used to assess the t 1/2 of the whole population of ENaC expressed in cells. Each of the subunits was immunoprecipitated after several chase periods as indicated in Fig. 6 A. Pulse-chase experiments of the α subunit show that during the 30-min pulse only the 85-kD band is present. The 65-kD band appears during the chase and is evident at the 45 min time-point. This experiment demonstrates that the upper band gives origin to the lower form. To calculate the true half-life of the α subunit we added the intensity of the two bands at each time point. The values from densitometric analysis of the X-ray films are shown in Fig. 6 B. The curves represent the fit of the data to a single exponential with t 1/2 values for control and aldosterone-treated cells of 72 and 60 min for α, 40 and 41 min for β, and 40 and 52 min for γ. This experiment was repeated twice with similar results.
Fig. 6 A also shows maturation of the β subunit. During the pulse only the 110-kD band is evident. During the chase, the higher, more glycosylated, form first appears at the 45 min time point.
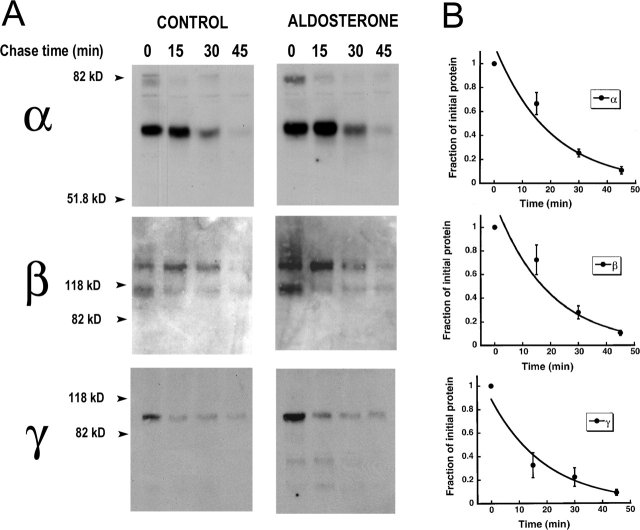
The results demonstrate that aldosterone does not change the rate of degradation of the whole population of channels in the cell. However, from a physiological perspective the stability of channels expressed at the apical membrane is of greater importance since this is the population that determines the rate of sodium reabsorption. The t 1/2 of channels in the plasma membrane was examined by pulse-chase experiments of biotinylated apical proteins. Fig. 7 A shows Western blots of α, β, and γ subunits from cells biotinylated on the apical membrane and then chased for the indicated periods of time. After 45 min of chase all three subunits residing in the apical membrane have been almost completely degraded in the control and aldosterone-treated groups. No statistical difference assessed by t test was observed in the two groups and the data from both conditions were analyzed together (notice the small error bars for all three curves). Fig. 7 B shows plots of the normalized values fitted to a single exponential. The predicted t 1/2s were 16.5 min for α subunit (n = 12), 17 min for β (n = 11), and 11 min for γ (n = 10).
Figure 7.
Stability of ENaC in the apical plasma membrane of A6 cells. (A) Control and aldosterone-treated A6 cells were biotinylated on the apical membrane and chased for the times indicated (min). Western blots of recovered biotinylated apical subunits. (B) Time curse of the decay in surface subunits measured by scanning densitometry normalized to the 0 time-point. Each data point is the mean ± SE of 12 (α), 11 (β), or 10 (γ) independent experiments.
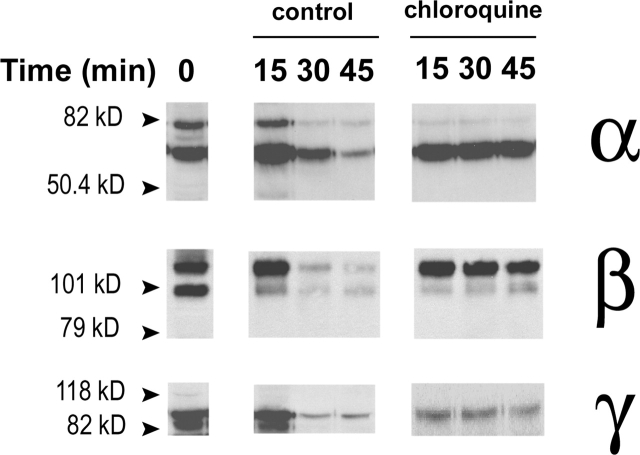
To further investigate the pathway of degradation of the apical channels we examined the effects of blocking lysosomal activity with chloroquine. Proteins from the apical membrane were biotinylated and then chased in the absence or presence of chloroquine. As indicated in Fig. 8 , in the control cells the subunits of ENaC almost disappeared after 45 min of chase, whereas in chloroquine-treated cells the subunits remained stable, indicating that most of the apical channels are removed from the plasma membrane and then degraded in lysosomes.
Figure 8.
Chloroquine effects on the half-life of ENaC subunits in the plasma membrane. A6 cells were treated as in Fig. 7, except that 100 μM chloroquine was added to one group of cells during the chase time. Western blots are shown for each of the three ENaC subunits for the control and chloroquine treated cells.
These experiments show that apical channels are degraded faster than intracellular channels and that the degradation of the three subunits occurs in a synchronous fashion. Moreover, aldosterone does not affect the stability of ENaC inside the cell or at the apical membrane.
Effect of Aldosterone on Transcription of the xENaC Subunits
So far, the data indicate that aldosterone increases the synthesis of the three subunits. It is not clear, in kidney as well as in A6 cells, whether this effect is mediated by increased transcription of the subunits stimulated directly by aldosterone or whether an aldosterone-induced protein increases the translation of the subunits. We investigated a direct effect of ENaC transcription by measuring mRNA levels of α, β, and γ in A6 cells at various times points after stimulation with aldosterone (Fig. 9 A). The densities of bands corresponding to the ENaC subunits from Northern blots were normalized to the density of Xenopus β-actin in the same blot and the values were plotted in the graphs shown in Fig. 9 B, where each data point is the average of four independent experiments. A small but consistent increase in mRNA abundance of the three subunits was detected after stimulation with aldosterone. The effect reached a peak of 1.5- to 2-fold increase after 3 h of treatment. This effect, although modest, could account for the fourfold increase in the abundance of protein. However, we cannot rule out that additional mechanisms increase the translation of the subunits.
Figure 9.
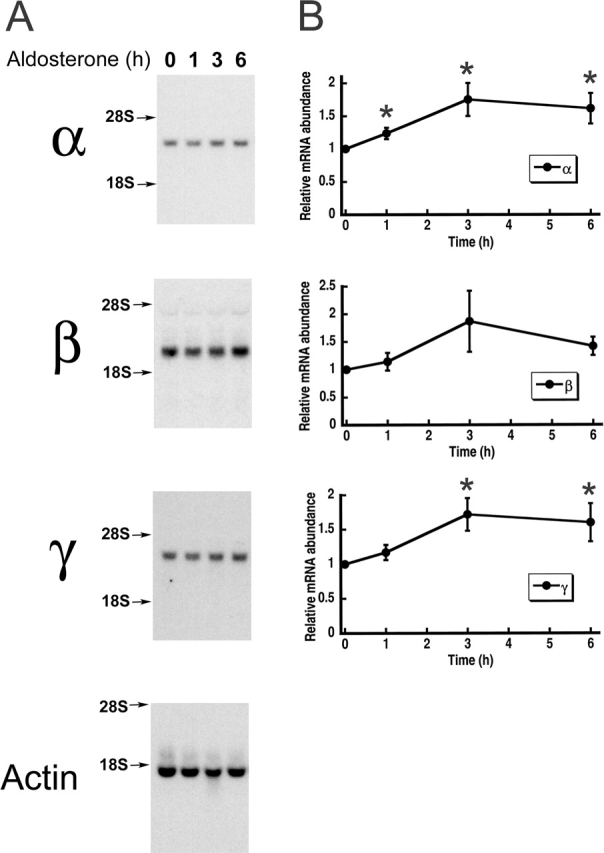
Time-course analysis of aldosterone effects on the abundance of mRNA from ENaC subunits. (A) A6 cells were grown for 10 d on filters, switched to serum-free medium for 2 d, and pretreated with 100 nM aldosterone for the indicated periods of time (in hours). Total RNA was extracted and analyzed by Northern blot with specific probes for α, β, and γ xENaC subunits. Xenopus β-actin served as an internal standard for RNA loading. (B) Intensity values were obtained with a phosphorimager and were normalized to the control. Each data point in the graph represents the mean ± SE of four independent experiments. *, P < 0.05.
Effects of Aldosterone on xENaC Activity
Finally, we addressed whether, in our experimental model and conditions, the increase abundance of apical subunits is accompanied by a similar increase in channel function. We determined ENaC activity and the time course of the aldosterone response in A6 cells by measuring the amiloride-sensitive component of equivalent Isc. Addition of 100 nM aldosterone increased the Isc fourfold from a basal level of 10.7 ± 1.4 μA/cm2 to 42 ± 2.3 μA/cm2 after 6 h of treatment (squares Fig. 10) . The effect was evident at 1 h as indicated by the small but significant difference in Isc between the 0 and 1 h data points (P < 0.01, n = 10). The Isc from control cells remained stable over the 6-h period of observation (circles Fig. 10). The increase in Isc was paralleled by a change in the VT from −40.1 ± 3.3 mV to −84.7 ± 5 mV, and by a decrease in RT from 3.8 ± 0.5 to 2 ± 0.1 kOhms/cm2. The values we obtained with and without aldosterone agree with previously published results from several groups, indicating that under our experimental conditions A6 cells exhibited the standard behavior (Bindels et al., 1988; Vallet et al., 1997; Stockand et al., 2001).
Figure 10.
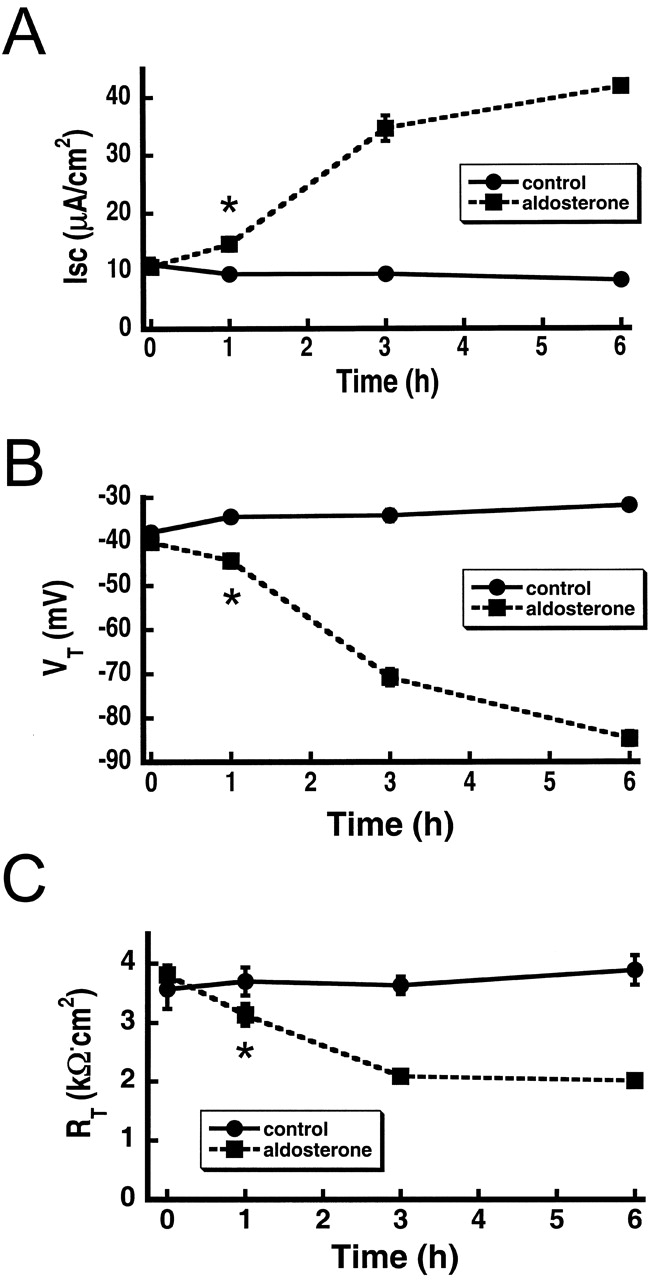
Effect of aldosterone on the electrical properties of A6 cells grown on permeable supports. (A) Time course of Isc (μA/cm-2) from control cells (circles) and 100 nM aldosterone-treated cells (squares). (B) VT (mV). (C) RT (kΩ/cm2). Measurements were done 10 d after seeding. Each data point represents the mean ± SD of 10 independent measurements. *, P < 0.05.
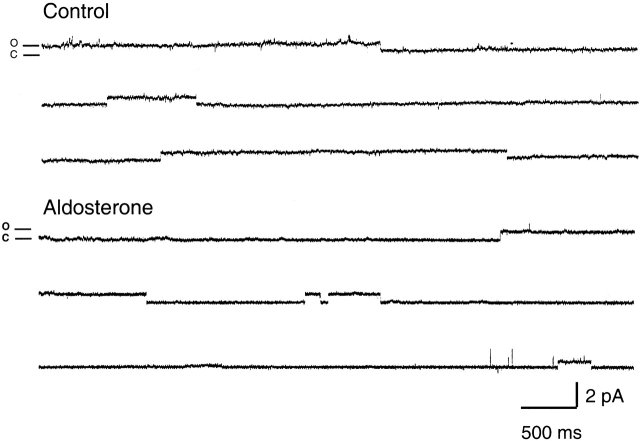
We wished to further test our results by examining ENaC unitary currents with the patch clamp technique. After seven days in culture serum was removed for 24 h. The control group was kept for 8–12 h without serum and the treated group received 100 nM of aldosterone for 6–12 h before experiments. Only channels with small conductance (5 pS) and long open and closed events characteristic of ENaC kinetics were considered. Visual inspection of records did not reveal any significant differences in the kinetics of channels from control and aldosterone-treated cells. In both conditions channels exhibited long open and closed events, as illustrated by the representative examples of single-channel patches shown in Fig. 11 . However, the frequency of finding ENaC in the patch was approximately five times greater in aldosterone-treated than in control cells.
Figure 11.
Representative examples of ENaC unitary currents from control and aldosterone-treated A6 cells. Traces show single-channel cell-attached patches from the apical membrane of A6 cells grown on permeable supports. The pipette solution contained 140 mM Na. Pipette voltage was 40 mV. Open and closed levels are indicated on the left. Bars in the right lower corner indicate current and time scales. Data were acquired at 2 kHz and filtered at 1 kHz for display.
The number of channels per patch was obtained by counting channel levels observed during the whole length of the recording. In patches containing only two levels (open and shut), 6 min of continuous recording was enough to achieve >0.95 confidence of the presence of only one channel (Marunaka and Eaton, 1991). However, in patches containing more levels it was not possible to determine with certainty the number of channels. Therefore, the values are given as apparent number of channels per patch (N) and not as absolute values. We analyzed only patches that lasted for at least 6 min: 15 and 27 patches from control and aldosterone groups, respectively. Table I summarizes the data. The average number of channels per patch in control and aldosterone-treated cells was similar in the two conditions, 1.47 ± 0.64 vs. 1.68 ± 1.0, respectively. However, patches with more than three channels were only seen in the aldosterone group.
TABLE I.
Properties of Patches from Control and Aldosterone-treated Cells
| Control | Aldosterone | |||||
|---|---|---|---|---|---|---|
| Po | N | Time | Po | N | Time | |
| min | min | |||||
| 0.89 | 1 | 12.3 | 0.37 | 1 | 6.1 | |
| 0.94 | 1 | 6.4 | 0.20 | 1 | 10.3 | |
| 0.08 | 1 | 10 | 0.05 | 1 | 14.7 | |
| 0.83 | 1 | 8.2 | 0.48 | 1 | 12.7 | |
| 0.27 | 1 | 9.1 | 0.10 | 1 | 8.6 | |
| 0.59 | 1 | 6.2 | 0.17 | 1 | 10.3 | |
| 0.74 | 1 | 6.5 | 0.72 | 1 | 5.9 | |
| 0.82 | 1 | 13.2 | 0.81 | 1 | 13.4 | |
| 0.06 | 1 | 7.60 | 0.54 | 1 | 6.5 | |
| 0.48 | 2 | 7.70 | 0.09 | 1 | 7.3 | |
| 0.60 | 2 | 12.9 | 0.41 | 1 | 14.2 | |
| 0.14 | 2 | 8.50 | 0.43 | 1 | 9.4 | |
| 0.58 | 2 | 13.3 | 0.59 | 1 | 8.6 | |
| 0.61 | 2 | 8.60 | 0.04 | 1 | 7.1 | |
| 0.58 | 3 | 6.60 | 0.88 | 1 | 12.6 | |
| 0.17 | 1 | 11.9 | ||||
| 0.47 | 1 | 13.3 | ||||
| 0.72 | 1 | 5.9 | ||||
| 0.91 | 2 | 11.1 | ||||
| 0.43 | 2 | 8.9 | ||||
| 0.32 | 2 | 7.6 | ||||
| 0.17 | 2 | 5.2 | ||||
| 0.59 | 3 | 10.6 | ||||
| 0.33 | 3 | 6.9 | ||||
| 0.48 | 3 | 5.9 | ||||
| 0.38 | 4 | 11.3 | ||||
| 0.47 | 4 | 9.6 | ||||
| 0.51 | 4 | 10.1 | ||||
| Mean ± SD | 0.55 ± 0.29 | 1.47 ± 0.64 | 9.14 ± 2.59 | 0.42 ± 0.24 | 1.68 ± 1.0 | 9.50 ± 2.8 |
| Mean ± SD | 0.58 ± 0.35 | 1 | 8.94 ± 2.46 | 0.40 ± 0.27 | 1 | 10.48 ± 3 |
N is the number of channels per patch. It was estimated by the maximal number of channel levels observed during the whole duration of the recording. Po was calculated by dividing NPo by N. Time (in minutes) indicates the duration of the recording. Only patches that lasted at least 6 min were included in the analysis. The last two rows show the mean ± SD of the values for all patches and for single-channel patches, respectively.
The open probability (Po) was calculated by dividing the value of NPo by the calculated N. When all the patches were taken for the calculation, the Po of control and aldosterone-treated cells were 0.55 ± 0.29 and 0.42 ± 0.24, respectively. These values were not statistically different. Since the calculation of the number of channels present in the patch is more reliable in patches with single channels, we also calculated the Po, taking only single-channel patches: 9 from control and 18 from the aldosterone group. The values were 0.58 ± 0.35 and 0.40 ± 0.27, respectively.
Together, the path clamp data indicate that aldosterone increases the number of active channels in the apical membrane, whereas the Po is not significantly affected.
DISCUSSION
Biosynthesis of xENaC in A6 Cells
Like other multimeric proteins, synthesis and assembly of ENaC subunits are carefully controlled to ensure that only correctly assembled channels reach the plasma membrane. Our results indicate that in A6 cells transcription and translation of α, β, and γ subunits occur in a coordinated fashion, such that none of the subunits is limiting for the production of channels. Transcription and translation of ENaC occur at a slow rate under basal conditions and aldosterone enhances both processes. The effect of aldosterone on transcription is modest, only a twofold increase in the abundance of mRNA, whereas the effect on translation results in a fourfold increase in the rate of synthesis of the three subunits. The small but consistent increase in mRNA levels could be sufficient to increase the synthesis of subunits by approximately fourfold; however, an additional and direct effect of aldosterone on translation cannot be ruled out. The magnitude and time course of the increase in subunits abundance was mirrored by similar increases in Isc (fourfold); therefore, an increase in channel number alone could account for the whole aldosterone response in A6 cells.
At the protein level our results differ from the ones obtained by May et al. (1997) in A6 cells. After 6 h of aldosterone treatment, they found an approximately six- and twofold increase in the rates of synthesis of α and β, but not of γ, subunits (May et al., 1997). These results led them to propose that the α subunit was limiting in the formation of new channels. Several technical details differed between the study of May et al. (1997) and the present work. Our studies were designed chiefly to optimize immunoprecipitations and Western blots to be quantitative.
Studies performed in heterologous systems, transfected cells (Hanwell et al., 2002), and injected Xenopus oocytes (Valentijn et al., 1998) have not detected any molecular modifications that would indicate maturation of channels through the biosynthetic pathway (for review see Rotin et al., 2001). Here we report and characterize modifications of the endogenous xENaC subunits in A6 cells. We show that α and β subunits acquire resistance to Endo-H during maturation. Interestingly, in the plasma membrane there is a mixed population of Endo-H–sensitive and –resistant subunits, indicating that complex glycosylation is not required for assembly and targeting of channels to the plasma membrane. We also report that a fraction of α subunits form disulfide bridges resistant to reducing agents. The modification induces a faster migration on SDS-PAGE, changing the apparent mol wt to 65 kD. This form of the α subunit carries exclusively Endo-H–resistant oligosaccharides; therefore, it is localized not in the ER but in Golgi/post-Golgi compartments. The 65-kD α subunit represents the major component at the apical membrane and is the form that becomes phosphorylated in A6 cells (unpublished data). The functional significance of complex glycosylation and the propensity of α to form resistant disulfide bridges are currently unknown, but they represent useful tools to follow the maturation of ENaC through the biosynthetic pathway. It is worth noticing that in the work by May et al. (1997), the 65-kD α subunit was not detected because they only performed 15-min pulse-label experiments. As we have shown in Fig. 6, this band appears 30–45 min after the completion of synthesis.
Abundance and Stability of ENaC at the Apical Membrane
Our results demonstrate that in A6 cells aldosterone changes the abundance of xENaC in the apical membrane by a fourfold increase that takes place in a coordinated fashion for the three subunits. At 1 h after stimulation we did not detect a significant increase, but the relatively low sensitivity of the biotinylation technique does not rule out a small increment at this time point. The increase was clearly apparent at 3 h and continued for the following hours of treatment. These results, together with the increase in Isc and the higher frequency of finding ENaC in patches, support the notion that aldosterone incorporates channels in the apical membrane, in contrast to activation of channels already present in the plasma membrane. Incorporation of channels to the apical membrane seems to reflect an increase in synthesis and delivery of newly synthesized channels. However, additional translocation of preexisting channels from a still not defined intracellular compartment could also contribute to the aldosterone response. The turnover of channels at the apical membrane (t 1/2 12–17 min) is shorter than in the intracellular compartments (t 1/2 40–70 min). However, in each of these locations the three subunits are degraded at similar rates. The short half-life of the subunits, in particular the short resident time in the plasma membrane, suggests that ENaC activity could be regulated, at least in part, by changing the rate of channel endocytosis. It has been documented previously that mutations in the COOH termini of the β and γ subunits decrease the rate of retrieval from the plasma membrane and thus increase the number of channels and sodium reabsorption in patients with Liddle's syndrome (Schild et al., 1996; Shimkets et al., 1997). Here, we found that aldosterone did not increase the stability of apical channels; no changes in the t 1/2 of any of the three subunits were observed with aldosterone treatment. Recent reports have suggested that phosphorylation of Nedd4–2 by sgk, an aldosterone-induced kinase (Chen et al., 1999), may decrease the rate of endocytosis of ENaC (Debonneville et al., 2001; Snyder et al., 2002). However, in a previous publication we showed that sgk did not affect the retrieval of ENaC from the plasma membrane of oocytes. Moreover, channels with deletions of the COOH termini from the three subunits, and thus unable to bind Nedd4–2, were able to increase sodium current in response to sgk (Alvarez de la Rosa et al., 1999). Since the role of sgk in the aldosterone response has not yet been elucidated, it is premature and not supported by the results from this study, to conclude that aldosterone affects endocytosis of ENaC. The role of sgk in the aldosterone response is a question we are currently investigating. The values we obtained for the turnover rates of the subunits of ENaC at the apical membrane are shorter to the ones recently published in a transfected MDCK cell line (Hanwell et al., 2002), where it was found that the three ENaC subunits had a t 1/2 of ∼1 h. However, Hanwell's data and ours contrast with the results obtained by Weisz et al. (2000) in A6 cells. They reported a t 1/2 for apical α and γ subunits longer than 24 h, whereas the t 1/2 for β was much shorter (∼6 h) (Weisz et al., 2000; Kleyman et al., 2001). The difference may arise from the use of different antibodies against the xENaC subunits. Their anti–α ENaC antibody detected only a 180-kD protein or protein complexes, rather than the 85- and 65-kD bands seen here.
Mol Wt of the Subunits in the Apical Membrane: Implications for Regulation of Channel Function
Several mechanisms proposed to regulate the activity of ENaC in the plasma membrane modify the molecular weight of the subunits. For instance, Nedd4 is thought to ubiquitinate the NH2 termini of α and γ subunits before endocytosis of ENaC (Staub et al., 1997). Addition of a single ubiquitin moiety should increase the mol wt of the subunits by ∼8 kD, a change readily detectable in SDS-PAGE. However, we were unable to detect any changes in mol wt on the subunits in the plasma membrane or in the population of channels that had been endocytosed and awaited degradation in the lysosome (Fig. 8). Perhaps ubiquitin is rapidly removed from the ENaC subunits after endocytosis preventing its detection. Another regulatory protein that has been proposed to modify ENaC is CAP1. CAP1 is a serine protease tethered to the apical membrane by a GPI anchor. It was first cloned from A6 cells and was shown to increase ENaC activity (Vallet et al., 1997). Although it was not demonstrated, it was suggested that cleavage of the extracellular domain of one of the subunits mediated the activation. Later, Masilamani et al. (1999) invoked cleavage of the γ subunit to explain the appearance of a band of lower molecular weight than the wild-type γ subunit in Western blots from aldosterone-treated animals. We detected only subunits with the full amino acid sequence at the apical membrane of A6 cells. Either the cleaved subunits are present in low abundance below the sensitivity of our detection assays or CAP1 has an indirect mechanism of action in A6 cells.
Effects of Aldosterone on Number and Po of ENaC in the Apical Membrane
Extensive characterization of xENaC kinetics was beyond the scope of this work. Our purpose was to correlate the biochemical data with the activity of ENaC given by functional channels at the plasma membrane. Moreover, our studies sought the relative change in number of channels and Po induced by aldosterone and not the absolute values of these parameters. Cell-attached patches from the apical membrane of A6 cells grown on permeable supports revealed the presence of unitary currents with properties characteristic of ENaC both in control and in aldosterone-treated cells. The chief difference between the two groups was the abundance of channels as manifested by a higher frequency of obtaining patches with channels (fourfold higher in the aldosterone group) and the slight increase in the number of channels per patch in the aldosterone-treated cells. On the other hand, Po was variable in both groups and not statistically different. We observed long open and close events in both groups, suggesting that the kinetics of individual channels were not different. Our observations agree with results from noise analysis that showed an increase in the number of channels induced by aldosterone without changes in Po in A6 cells (Helman et al., 1998). However, other studies have proposed that aldosterone activates ENaC by methylation of channels and this modification increases the Po and changes the kinetics of ENaC in aldosterone-treated A6 cells (Rokaw et al., 1998; Stockand et al., 1999, 2001). In rat kidney, methyl donors did not affect ENaC activity (Frindt and Palmer, 1996). An explanation for the differences may be that we only took into consideration channels with the canonical features of ENaC: small conductance and long mean open and closed times. Whereas in the previous works, channels with different kinetics and conductance were included in the analysis (Stockand et al., 2001).
In summary, the patch-clamp data indicate that aldosterone increased the number of active ENaC channels in the apical membrane and thus agree and support the results from the biotinylation experiments.
Do Our Findings in Cell Culture Apply to the Intact Animal?
The low abundance and inaccessibility of principal cells from the collecting duct make it difficult to perform the type of biochemical studies needed to elucidate the biosynthesis of ENaC and molecular mechanisms that mediate the aldosterone response. Using a cell line overcomes these problems but raises the question of whether the results can be extended to the physiology of ENaC in whole animals. Specifically, we would like to know whether aldosterone is required for transcription and translation of ENaC under basal conditions and whether increased aldosterone levels are followed by new synthesis and more channels in the whole animal. Numerous lines of evidence from in vivo studies indicate that transcription of ENaC in the kidney takes place in the absence of aldosterone. In a knockout mouse of the mineralocorticoid receptor gene, mRNA from the three subunits of ENaC and a small amiloride-sensitive component of Na+ reabsorption by the kidney (1/4 of wild-type animals) were detected (Berger et al., 1998). Similarly, in adrenalectomized rats the mRNAs from the three ENaC subunits are expressed in the kidney (Stokes and Sigmund, 1998). Unfortunately, in these and in other in vivo studies it has not been shown whether protein abundance correlates with the levels of mRNA. However, rats maintained on a normal chow do express ENaC, as demonstrated by Western blot analysis (Masilamani et al., 1999). In spite of presence of channels, microperfusion (Reif et al., 1986; Tomita et al., 1985) and patch-clamp studies on the rat CCD (Pacha et al., 1993) have repeatedly shown little ENaC activity in control animals. These findings have led to propose that, at least in some species, channels may not reach the plasma membrane in the absence of high levels of aldosterone. A mechanism(s) that controls surface expression of channels may operate more tightly in vivo than in cultured cells in which ENaC gets to the apical membrane and is functionally active without steroids (glucocorticoids or mineralocorticoids). Whether sgk is responsible for this difference is an open question.
Acknowledgments
The authors wish to thank Dr. J. Hayslett for providing the A6 cell line and for helpful discussions.
This work was supported by the National Institutes of Health grant NIH-RO1-DK54062 (to C. Canessa) and by a research fellowship from the National Kidney Foundation (to D. Alvarez de la Rosa).
Footnotes
Abbreviations used in this paper: CAP1, channel-activating protease 1; ENaC, epithelial sodium channel; Endo-H, endoglycosidase H; GFP, green fluorescent protein; GST, glutathione S-transferase; IAA, iodoacetamide; Po, open probability; RT, transepithelial resistance; sgk, serum- and glucocorticoid-induced kinase; VT, transepithelial potential difference; xENaC, Xenopus epithelial sodium channel.
References
- Alvarez de la Rosa, D., P. Zhang, A. Naray-Fejes-Toth, G. Fejes-Toth, and C.M. Canessa. 1999. The serum and glucocorticoid kinase sgk increases the abundance of epithelial sodium channels in the plasma membrane of Xenopus oocytes. J. Biol. Chem. 274:37834–37839. [DOI] [PubMed] [Google Scholar]
- Alvarez de la Rosa, D., C.M. Canessa, G.K. Fyfe, and P. Zhang. 2000. Structure and regulation of amiloride-sensitive sodium channels. Annu. Rev. Physiol. 62:573–594. [DOI] [PubMed] [Google Scholar]
- Asher, C., H. Wald, B.C. Rossier, and H. Garty. 1996. Aldosterone-induced increase in the abundance of Na+ channel subunits. Am. J. Physiol. 271:C605–C611. [DOI] [PubMed] [Google Scholar]
- Berger, S., M. Bleich, W. Schmid, T.J. Cole, J. Peters, H. Watanabe, W. Kriz, R. Warth, R. Greger, and G. Schutz. 1998. Mineralocorticoid receptor knockout mice: pathophysiology of Na+ metabolism. Proc. Natl. Acad. Sci. USA. 95:9424–9429. [DOI] [PMC free article] [PubMed] [Google Scholar]
- Bindels, R.J., J.A. Schafer, and M.C. Reif. 1988. Stimulation of sodium transport by aldosterone and arginine vasotocin in A6 cells. Biochim. Biophys. Acta. 972:320–330. [DOI] [PubMed] [Google Scholar]
- Chen, S.Y., A. Bhargava, L. Mastroberardino, O.C. Meijer, J. Wang, P. Buse, G.L. Firestone, F. Verrey, and D. Pearce. 1999. Epithelial sodium channel regulated by aldosterone-induced protein sgk. Proc. Natl. Acad. Sci. USA. 96:2514–2519. [DOI] [PMC free article] [PubMed] [Google Scholar]
- Chraibi, A., V. Vallet, D. Firsov, S.K. Hess, and J.D. Horisberger. 1998. Protease modulation of the activity of the epithelial sodium channel expressed in Xenopus oocytes. J. Gen. Physiol. 111:127–138. [DOI] [PMC free article] [PubMed] [Google Scholar]
- Debonneville, C., S.Y. Flores, E. Kamynina, P.J. Plant, C. Tauxe, M.A. Thomas, C. Munster, A. Chraibi, J.H. Pratt, J.D. Horisberger, et al. 2001. Phosphorylation of Nedd4-2 by Sgk1 regulates epithelial Na(+) channel cell surface expression. EMBO J. 20:7052–7059. [DOI] [PMC free article] [PubMed] [Google Scholar]
- Frindt, G., and L.G. Palmer. 1996. Regulation of Na channels in the rat cortical collecting tubule: effects of cAMP and methyl donors. Am. J. Physiol. 271:F1086–F1092. [DOI] [PubMed] [Google Scholar]
- Garty, H., and L.G. Palmer. 1997. Epithelial sodium channels: function, structure, and regulation. Physiol. Rev. 77:359–396. [DOI] [PubMed] [Google Scholar]
- Gottardi, C.J., L.A. Dunbar, and M.J. Caplan. 1995. Biotinylation and assessment of membrane polarity: caveats and methodological concerns. Am. J. Physiol. 268:F285–F295. [DOI] [PubMed] [Google Scholar]
- Hanwell, D., T. Ishikawa, R. Saleki, and D. Rotin. 2002. Trafficking and cell surface stability of ENaC expressed in epithelial MDCK cells. J. Biol. Chem. 277:9772–9779. [DOI] [PubMed] [Google Scholar]
- Hayslett, J.P., L.J. Macala, J.I. Smallwood, L. Kalghatgi, J. Gassala-Herraiz, and C. Isales. 1995. Vasopressin-stimulated electrogenic sodium transport in A6 cells is linked to a Ca(2+)-mobilizing signal mechanism. J. Biol. Chem. 270:16082–16088. [DOI] [PubMed] [Google Scholar]
- Helman, S.I., X. Liu, K. Baldwin, B.L. Blazer-Yost, and W.J. Els. 1998. Time-dependent stimulation by aldosterone of blocker-sensitive ENaCs in A6 epithelia. Am. J. Physiol. 274:C947–C957. [DOI] [PubMed] [Google Scholar]
- Kamynina, E., C. Debonneville, M. Bens, A. Vandewalle, and O. Staub. 2001. A novel mouse Nedd4 protein suppresses the activity of the epithelial Na+ channel. FASEB J. 15:204–214. [DOI] [PubMed] [Google Scholar]
- Kemendy, A.E., T.R. Kleyman, and D.C. Eaton. 1992. Aldosterone alters the open probability of amiloride-blockable sodium channels in A6 epithelia. Am. J. Physiol. 263:C825–C837. [DOI] [PubMed] [Google Scholar]
- Kleyman, T.R., J.B. Zuckerman, P. Middleton, K.A. McNulty, B. Hu, X. Su, B. An, D.C. Eaton, and P.R. Smith. 2001. Cell surface expression and turnover of the alpha-subunit of the epithelial sodium channel. Am. J. Physiol. 281:F213–F221. [DOI] [PubMed] [Google Scholar]
- Loffing, J., M. Zecevic, E. Feraille, B. Kaissling, C. Asher, B.C. Rossier, G.L. Firestone, D. Pearce, and F. Verrey. 2001. Aldosterone induces rapid apical translocation of ENaC in early portion of renal collecting system: possible role of SGK. Am. J. Physiol. 280:F675–F682. [DOI] [PubMed] [Google Scholar]
- Marunaka, Y., and D.C. Eaton. 1991. Effects of vasopressin and cAMP on single amiloride-blockable Na channels. Am. J. Physiol. 260:C1071–C1084. [DOI] [PubMed] [Google Scholar]
- Masilamani, S., G.H. Kim, C. Mitchell, J.B. Wade, and M.A. Knepper. 1999. Aldosterone-mediated regulation of ENaC alpha, beta, and gamma subunit proteins in rat kidney. J. Clin. Invest. 104:R19–R23. [DOI] [PMC free article] [PubMed] [Google Scholar]
- Mastroberardino, L., B. Spindler, I. Forster, J. Loffing, R. Assandri, A. May, and F. Verrey. 1998. Ras pathway activates epithelial Na+ channel and decreases its surface expression in Xenopus oocytes. Mol. Biol. Cell. 9:3417–3427. [DOI] [PMC free article] [PubMed] [Google Scholar]
- May, A., A. Puoti, H.P. Gaeggeler, J.D. Horisberger, and B.C. Rossier. 1997. Early effect of aldosterone on the rate of synthesis of the epithelial sodium channel alpha subunit in A6 renal cells. J. Am. Soc. Nephrol. 8:1813–1822. [DOI] [PubMed] [Google Scholar]
- Pacha, J., G. Frindt, L. Antonian, R.B. Silver, and L.G. Palmer. 1993. Regulation of Na channels of the rat cortical collecting tubule by aldosterone. J. Gen. Physiol. 102:25–42. [DOI] [PMC free article] [PubMed] [Google Scholar]
- Puoti, A., A. May, C.M. Canessa, J.D. Horisberger, L. Schild, and B.C. Rossier. 1995. The highly selective low-conductance epithelial Na channel of Xenopus laevis A6 kidney cells. Am. J. Physiol. 269:C188–C197. [DOI] [PubMed] [Google Scholar]
- Reif, M.C., S.L. Troutman, and J.A. Schafer. 1986. Sodium transport by rat cortical collecting tubule. Effects of vasopressin and desoxycorticosterone. J. Clin. Invest. 77:1291–1298. [DOI] [PMC free article] [PubMed] [Google Scholar]
- Rokaw, M.D., J.M. Wang, R.S. Edinger, O.A. Weisz, D. Hui, P. Middleton, V. Shlyonsky, B.K. Berdiev, I. Ismailov, D.C. Eaton, et al. 1998. Carboxylmethylation of the beta subunit of xENaC regulates channel activity. J. Biol. Chem. 273:28746–28751. [DOI] [PubMed] [Google Scholar]
- Rotin, D., V. Kanelis, and L. Schild. 2001. Trafficking and cell surface stability of ENaC. Am. J. Physiol. 281:F391–F399. [DOI] [PubMed] [Google Scholar]
- Sambrok, J., E.F. Fritsch, and T. Maniatis. 1989. Molecular Cloning. A Laboratory Manual. Cold Spring Harbor Laboratory Press, Cold Spring Harbor, NY.
- Schild, L., Y. Lu, I. Gautschi, E. Schneeberger, R.P. Lifton, and B.C. Rossier. 1996. Identification of a PY motif in the epithelial Na channel subunits as a target sequence for mutations causing channel activation found in Liddle syndrome. EMBO J. 15:2381–2387. [PMC free article] [PubMed] [Google Scholar]
- Shimkets, R.A., R.P. Lifton, and C.M. Canessa. 1997. The activity of the epithelial sodium channel is regulated by clathrin-mediated endocytosis. J. Biol. Chem. 272:25537–25541. [DOI] [PubMed] [Google Scholar]
- Shimkets, R.A., R. Lifton, and C.M. Canessa. 1998. In vivo phosphorylation of the epithelial sodium channel. Proc. Natl. Acad. Sci. USA. 95:3301–3305. [DOI] [PMC free article] [PubMed] [Google Scholar]
- Snyder, P.M., D.R. Olson, and B.C. Thomas. 2002. Serum and glucocorticoid-regulated kinase modulates Nedd4-2-mediated inhibition of the epithelial Na+ channel. J. Biol. Chem. 277:5–8. [DOI] [PubMed] [Google Scholar]
- Staub, O., I. Gautschi, T. Ishikawa, K. Breitschopf, A. Ciechanover, L. Schild, and D. Rotin. 1997. Regulation of stability and function of the epithelial Na+ channel (ENaC) by ubiquitination. EMBO J. 16:6325–6336. [DOI] [PMC free article] [PubMed] [Google Scholar]
- Stockand, J.D., R.S. Edinger, N. Al-Baldawi, S. Sariban-Sohraby, O. Al-Khalili, D.C. Eaton, and J.P. Johnson. 1999. Isoprenylcysteine-O-carboxyl methyltransferase regulates aldosterone-sensitive Na(+) reabsorption. J. Biol. Chem. 274:26912–26916. [DOI] [PubMed] [Google Scholar]
- Stockand, J.D., S. Zeltwanger, H.F. Bao, A. Becchetti, R.T. Worrell, and D.C. Eaton. 2001. S-adenosyl-L-homocysteine hydrolase is necessary for aldosterone-induced activity of epithelial Na(+) channels. Am. J. Physiol. 281:C773–C785. [DOI] [PubMed] [Google Scholar]
- Stokes, J.B., and R.D. Sigmund. 1998. Regulation of rENaC mRNA by dietary NaCl and steroids: organ, tissue, and steroid heterogeneity. Am. J. Physiol. 274:C1699–C1707. [DOI] [PubMed] [Google Scholar]
- Tomita, K., J.J. Pisano, and M.A. Knepper. 1985. Control of sodium and potassium transport in the cortical collecting duct of the rat. Effects of bradykinin, vasopressin, and deoxycorticosterone. J. Clin. Invest. 76:132–136. [DOI] [PMC free article] [PubMed] [Google Scholar]
- Valentijn, J.A., G.K. Fyfe, and C.M. Canessa. 1998. Biosynthesis and processing of epithelial sodium channels in Xenopus oocytes. J. Biol. Chem. 273:30344–30351. [DOI] [PubMed] [Google Scholar]
- Vallet, V., A. Chraibi, H.P. Gaeggeler, J.D. Horisberger, and B.C. Rossier. 1997. An epithelial serine protease activates the amiloride-sensitive sodium channel. Nature. 389:607–610. [DOI] [PubMed] [Google Scholar]
- Weisz, O.A., J.M. Wang, R.S. Edinger, and J.P. Johnson. 2000. Non-coordinate regulation of endogenous epithelial sodium channel (ENaC) subunit expression at the apical membrane of A6 cells in response to various transporting conditions. J. Biol. Chem. 275:39886–39893. [DOI] [PubMed] [Google Scholar]


