

Abstract
The mechanism whereby cAMP stimulates Cl− flux through CFTR ion channels in secretory epithelia remains controversial. It is generally accepted that phosphorylation by cAMP-dependent protein kinase increases the open probability of the CFTR channel. A more controversial hypothesis is that cAMP triggers the translocation of CFTR from an intracellular pool to the cell surface. We have monitored membrane turnover in Calu-3 cells, a cell line derived from human airway submucosal glands that expresses high levels of CFTR using membrane capacitance and FM1–43 fluorescence measurements. Using a conventional capacitance measurement technique, we observe an apparent increase in membrane capacitance in most cells that exhibit an increase in Cl− current. However, after we carefully correct our recordings for changes in membrane conductance, the apparent changes in capacitance are eliminated. Measurements using the fluorescent membrane marker FM1–43 also indicate that no changes in membrane turnover accompany the activation of CFTR. Robust membrane insertion can be triggered with photorelease of caged Ca2+ in Calu-3 cells. However, no increase in Cl− current accompanies Ca2+-evoked membrane fusion. We conclude that neither increases in cAMP or Ca2+ lead to transport of CFTR to the plasma membrane in Calu-3 cells. In addition, we conclude that membrane capacitance measurements must be interpreted with caution when large changes in membrane conductance occur.
Keywords: exocytosis, endocytosis, membrane capacitance, FM1-43, caged calcium
INTRODUCTION
CFTR is a chloride-selective ion channel responsible for cAMP-induced Cl− secretion across the apical membranes of epithelial cells (for review see Quinton 1999). However, the mechanisms whereby cAMP activates Cl− flux are still a matter of debate. It is well established that protein kinase A–dependent phosphorylation of the regulatory domain of CFTR increases the probability of channel opening (Tabcharani et al. 1991; Bear et al. 1992; Fuller and Benos 1992; Gadsby et al. 1995; Al-Nakkash and Hwang 1999). It also has been reported that cAMP stimulates translocation of CFTR from an intracellular pool to the plasma membrane (Bradbury et al. 1992; Schwiebert et al. 1994; Takahashi et al. 1996; Moyer et al. 1998; Peters et al. 1999; Howard et al. 2000). However, this “trafficking hypothesis” for activation of CFTR is controversial (Santos and Reenstra 1994; Hug et al. 1997; Loffing et al. 1998; Liu et al. 1999). In an attempt to reconcile the conflicting literature, it has been suggested that both pathways for CFTR activation are important in epithelial cells, whereas changes in channel trafficking may be absent in nonepithelial cells (Bradbury 1999; but see also Takahashi et al. 1996). We have tested the trafficking hypothesis of CFTR activation in the Calu-3 epithelial cell line. Calu-3 cells are derived from human airway submucosal glands and express high levels of CFTR (Shen et al. 1994).
To monitor membrane turnover in Calu-3 cells, we have used two independent and complementary techniques that have been widely used to study exocytosis and endocytosis in individual neuroendocrine cells. Membrane capacitance measurements are a sensitive indicator of the increase in membrane surface area that accompanies vesicle exocytosis. Conversely, decreases in capacitance accompany endocytosis (for review see Gillis 1995). Whereas capacitance measurements have a very high sensitivity, they are only capable of reporting the difference between the rates of exocytosis and endocytosis. In addition, it is not trivial to accurately estimate changes in capacitance in the face of large changes in membrane conductance that occur upon the activation of ion channels. In contrast, use of the fluorescent styrl dye FM1–43 can distinguish exocytosis from endocytosis (Smith and Betz 1996) and is not vulnerable to artifacts introduced by activation of ion channels, but is a less sensitive assay than membrane capacitance measurements.
Using these two techniques, we find no evidence for changes in membrane turnover upon activation of the CFTR current by cAMP. In addition, we see no further activation of the CFTR current after triggering exocytosis with photorelease of caged Ca2+. Our results are consistent with the notion that the cAMP signaling cascade stimulates Cl− flux by activating CFTR that is already present on the surface membrane.
MATERIALS AND METHODS
Cell Preparation and Solutions
Calu-3 cells obtained from the American Type Culture Collection were grown in Eagle's MEM supplemented with 10% FBS. The cell line was maintained under standard tissue culture conditions (37°C, 5% CO2). For patch-clamp studies, cells were seeded on small sterile coverglass chips in 35-mm tissue culture dishes for 1–2 d before use.
For the [Cl]i = 24 mM and [Cl]o = 156 mM ionic condition, the pipette solution contained the following (in mM): 20 TEA-Cl, 5 Tris-creatine phosphate, 10 MgATP, 10 EGTA, 10 HEPES, 2 MgCl2, 5.5 glucose, 85 aspartic acid, and 5 pyruvic acid, pH 7.4, with CsOH. The bath solution contained the following (in mM): 145 NaCl, 5 KCl, 2 MgCl2, 1 CaCl2, 5 HEPES, 5 glucose, and 20 sucrose, pH 7.4, with NaOH. For the [Cl]i = 125 mM and [Cl]o = 30 mM ionic condition, the pipette solution contained the following (in mM): 101 CsCl, 5 Tris-creatine phosphate, 20 TEA-Cl, 10 MgATP, 10 EGTA, 10 HEPES, 2 MgCl2, and 5.5 glucose, pH 7.4, with CsOH. The bath solution contained the following (in mM): 19 NaCl, 126 isethionic acid, 5 glucose, 5 Tris•OH, 5 KCl, 2 MgCl2, and 1 CaCl2, pH 7.4, with NaOH.
In caged cAMP experiments, the solutions were the same as the [Cl]i = 125 mM, [Cl]o = 30 mM ionic condition above, but the pipette solution also included 100 μM o-(2-nitrophenyl)ethyl-cAMP (Molecular Probes) diluted from a 20-mM stock dissolved in DMSO. In caged Ca2+ experiments, the pipette solution contained the following (in mM): 90 CsCl, 18 TEA-Cl, 36 HEPES, 1.8 MgCl2, 7 nitrophenyl EGTA, 6.3 CaCl2, 0.2 fura2-FF, and 2 Na2ATP, pH 7.2, with CsOH.
In some experiments, CFTR current was activated by including 10 μM forskolin plus 200 μM 8-(4-chlorophenylthio)-adenosine-3′,5′-cAMP (8-CPT-cAMP), a membrane-permeant cAMP derivative, in the bath solution. In some experiments, CFTR current was augmented by adding 20 μM genistein or inhibited by adding 50 μM glibenclamide to the bath.
Electrophysiology and Data Acquisition
Whole-cell patch-clamp experiments were performed at room temperature (∼23°C) using an EPC-9 patch-clamp amplifier and the “PULSE” acquisition program (HEKA Elektronik). Pipettes were pulled from Kimax glass capillaries and had resistances of 1.5–6 MΩ. Pipettes were coated with wax and fire polished. The pipette potential was held at either −18 mV ([Cl]o = 156 mM, [Cl]i = 24 mM ionic condition) or +15 mV ([Cl]o = 30 mM, [Cl]i = 125 mM ionic condition).
Capacitance measurements were performed with either the “sine + dc” (Lindau-Neher) method implemented in PULSE software (Lindau and Neher 1988; Gillis 1995, Gillis 2000), a “sine + square hybrid” method (described below), or a dual frequency method (Rohlicek and Schmid 1994). All three methods assume a three element equivalent circuit for a cell in the whole-cell configuration consisting of an access resistance (Ra) in series with the parallel combination of the membrane resistance (Rm) and membrane capacitance (Cm). For the “sine + dc” and “sine + square” methods, a sinusoidal voltage stimulus (amplitude 20 mV, frequency 1.5 kHz) was applied, and the resulting sinusoidal current was processed with the PULSE software lock-in amplifier to produce estimates of the real (A) and imaginary (B) admittance of the cell. The admittance estimates, together with an estimate of the dc conductance (Gt = 1/(Ra + Rm)) are processed to produce estimates of the three equivalent circuit elements. In particular, the Cm value is given by:
 |
where ω = 2πfc, with fc denoting the stimulus frequency.
With the sine + dc technique, Gt is computed using the measured dc value of the current together with an assumed reversal potential of the cell (Erev) according to:
 |
where Vdc is the dc value of the stimulus sinusoid. We assigned Erev a constant value of −36.5 mV (the mean reversal potential of seven measurements made early during development of the CFTR current, SD = 5.3 mV) for the [Cl]o = 156 mM, [Cl]i = 24 mM condition, and +36.3 mV (the mean of four measurements, SD = 2.3 mV) for the [Cl]o = 30 mM, [Cl]i = 125 mM condition.
A disparity between the assumed value of Erev and the true value, which changes during the recording, will bias Cm estimates. Therefore, in the sine + square method, we estimated Gt more directly by interrupting the stimulus sine wave approximately once per second to apply ±20-mV square wave pulses, 4 ms in duration (Okada et al. 1992). The difference in steady-state current (measured after the decay of the capacity transient) divided by the voltage step was used as the estimate of Gt.
For caged cAMP methods, we needed to resolve relatively fast changes in conductance, so we used a dual frequency method that does not require an estimate of Gt. The two stimulus frequencies (2.3 kHz, 20 mV amplitude and 3.9 kHz, 12 mV amplitude) result in four measured quantities (real and imaginary admittance at each frequency) that can be used to calculate the three unknown parameters using the equations of Rohlicek and Schmid 1994.
Caged Ca2+ Experiments
The calibration methods used for caged Ca2+ experiments have been previously published (Heinemann et al. 1994; Gillis et al. 1996). The pipette solution included nitrophenyl-EGTA (Ellis-Davies and Kaplan 1994; a gift from G.C.R. Ellis-Davies, MCP Hahnemann University, Philadelphia, PA) as the Ca2+ cage (7 mM, 90% loaded with Ca2+) and fura2-FF (membrane-impermeant K+ salt; Teflabs) as a Ca2+ indicator dye. The Ca2+ indicator was excited at 360 and 390 nm using a monochromator (T.I.L.L. Photonics), and the resulting fluorescent signal (535 ± 25 nm) was measured using a photomultiplier. Caged Ca2+ was photolyzed using a flash lamp (model JML-C1; Rapp Optoelectronik). Both the flash lamp and the monochromator were coupled to the epifluorescent port of a microscope (model IX-70; Olympus) using a combining condensor (T.I.L.L. Photonics). The objective used for both focusing the excitation light and collecting fluorescent light was a 40× 1.15 numerical aperture water immersion lens (model U-APO; Olympus).
Measurement of Membrane Turnover Using FM1–43
7 μM FM1–43 was included in the bath solution and was excited at 465 nm. The resulting fluorescence (535 ± 25 nm) was measured by a photomultiplier tube. The background fluorescence measured from a region of the coverslip without a cell was subtracted from the records. The fluorescence signal was calibrated in terms of membrane surface area (membrane capacitance) in Fig. 6 and Fig. 7. This calibration was obtained by noting the average change in FM1–43 fluorescence (14 cells) per pF increase in membrane capacitance resulting from exocytotic insertion of membrane upon photorelease of caged Ca2+.
Figure 6.

FM1–43 fluorescence measurements fail to detect changes in the rate of membrane turnover upon activation of CFTR current in Calu-3 cells. (A) [Cl]i = 24 mM and [Cl]o = 156 mM. An outward current is evoked by CPT-cAMP plus forskolin. The vertical bars indicate the expected change in fluorescence for exocytosis of 1 pF (∼100 μm2) of cell membrane (materials and methods). Note that the slope of the fluorescence trace (solid line) does not change upon activation of the current. (B) [Cl]i = 125 mM and [Cl]o = 30 mM. In this case, an inward current is evoked. Again, there is no change in the rate that FM1–43 fluorescence increases.
Figure 7.

Photorelease of caged Ca2+ triggers massive exocytosis in Calu-3 cells and decreases the CFTR current. (A) The current trace is represented by a solid line, whereas the dashed line depicts Gm. The bottom trace indicates the intracellular Ca2+ concentration measured using fura2-FF. CPT-cAMP plus forskolin was added to the bath 17 s before the start of the trace. The vertical bar indicates the expected change in FM1–43 fluorescence for exocytosis of 1 pF (∼100 μm2) of cell membrane. (B) Expanded time scale shows the Cm and current response during the first 8 s after the flash and corresponds to the interval denoted by the gray rectangle in A.
Photobleach of internalized FM1–43 could result in an underestimation of membrane uptake, therefore, control experiments were performed where the illuminating lamp was either turned off or the fraction of time that the lamp was on was increased or decreased. None of these maneuvers affected the slope of measured fluorescent changes, so we concluded that photobleach was not a problem under our experimental conditions. The fraction of time that the illuminating light source was on was always <2%.
Fluid Level Control
The fluid level in the perfusion chamber was monitored with a sensitive infrared sensor (Cell MicroControls). Recordings with fluid level fluctuations greater than ±0.05 mm were discarded.
RESULTS
Whole-Cell Patch-Clamp Recording of CFTR Chloride Current
A typical example of cAMP-activated CFTR Cl− current in Calu-3 cells is depicted in Fig. 1 A. In this cell, Gm increased from 1.8 to 44 nS over a time course of several minutes after adding 200 μM CPT-cAMP plus 10 μM forskolin to the bath solution. Fig. 1 B depicts the I-V relationship of the fully developed cAMP-activated current in this cell. The magnitude of current evoked by CPT-cAMP plus forskolin is quite variable (Hwang et al. 1997), and cells with an activated current of <200 pA were not analyzed further. The mean amplitude of fully activated current at −18 mV for responsive cells is 375 ± 142 pA (n = 13).
Figure 1.
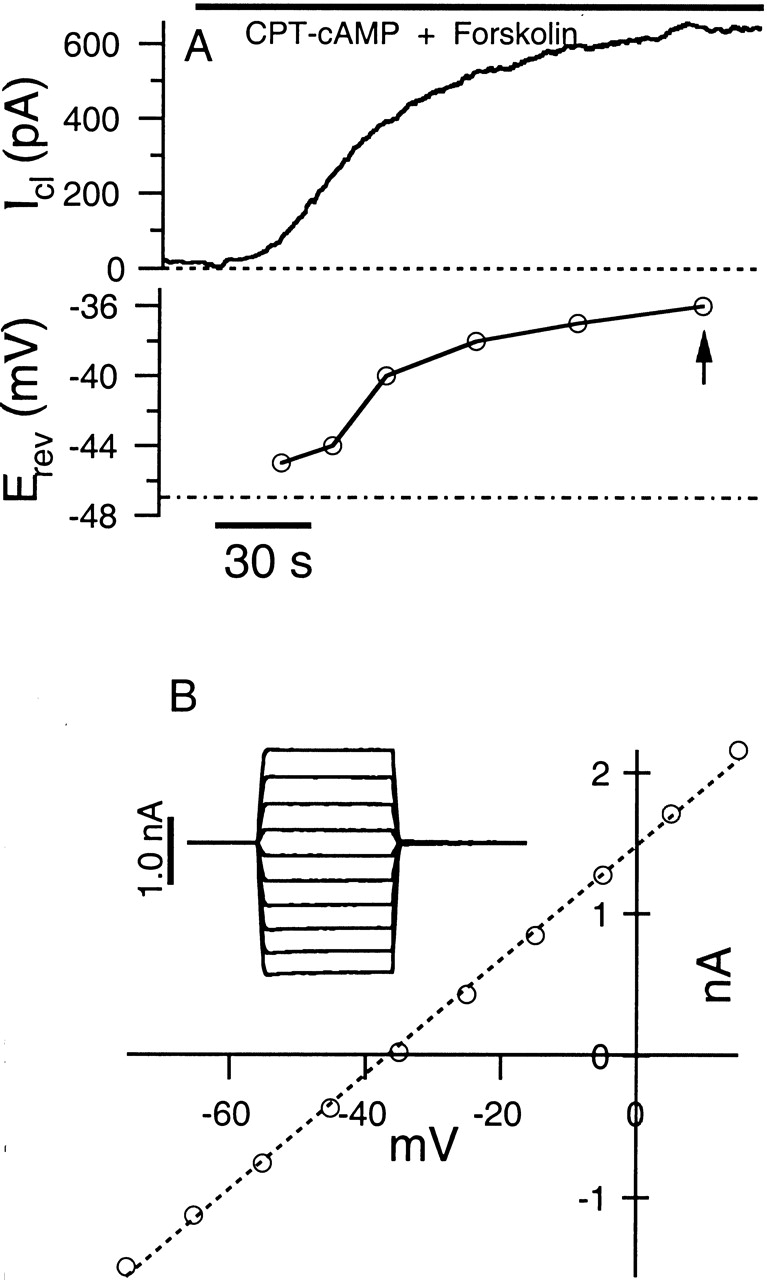
cAMP-stimulated current in Calu-3 cells. (A) 200 μM CPT-cAMP plus 10 μM forskolin (bar) evokes a large outward CFTR Cl− current (top trace) during whole-cell recording. The bottom trace illustrates that the current reversal potential (Erev) increases during the recording, presumably due to accumulation of Cl− at the inside surface of the membrane. The recording conditions are [Cl]i = 24 mM, [Cl]o = 156 mM, and −18-mV holding potential. The Nernst potential under these conditions is −47 mV (dot-dashed line in bottom trace). (B) Circles indicate the I-V relationship of the cAMP-stimulated current measured at the time indicated by the arrow in A. The dashed line indicates a linear fit of the I-V relationship. Inset gives sample responses to voltage pulses ranging from −73 to +17 mV. The current measured before application of cAMP plus forskolin was subtracted from the records.
The average reversal potential of the current, measured during development of the current, is −36.5 ± 5.3 mV (seven cells) under the condition of [Cl]i = 24 mM and [Cl]o = 156 mM. The calculated Nernst potential for Cl− under this ionic condition is −47 mV. Interestingly, the measured reversal potential (Erev) is often not stable under conditions where significant flux of Cl− occurs. Fig. 1 A (bottom trace) depicts the time course of Erev for this cell. The increasing value of the reversal potential is presumably because the large outward current leads to an elevation of [Cl−] at the inside surface of the membrane. This unstable value of the reversal potential can affect the measurement of membrane capacitance as described below.
After Carefully Correcting for Membrane Conductance Changes, Capacitance Measurements Reveal No Correlation between CFTR Current Activation and Exocytosis
We performed experiments under different ionic conditions and in the presence of CFTR current activators and blockers to look for any correlations between CFTR current activation and changes in membrane surface area assayed using membrane capacitance measurements. Fig. 2 A depicts a sample experiment, representative of 12 cells, where membrane capacitance is measured during activation of CFTR current under the ionic condition of [Cl]i = 24 mM and [Cl]o = 156 mM. We originally used the popular sine + dc technique to estimate Cm, which relies on the assumption that the current has a constant reversal potential of −36.5 mV (materials and methods). With this method, we consistently observe an increase in Cm in parallel with the activation of the CFTR current (Fig. 2 A, dashed line). In 12 recordings, the sine + dc method reports apparent increases in Cm upon activation of CFTR current ranging from 0.2 to 6.5 pF. However, several observations led us to doubt this apparent correlation. For example, the apparent Cm value changes dramatically when the extracellular concentration of Cl− is reduced to 10 mM through substitution of isethionic acid for Cl− (Fig. 2 A). This observation is troubling because it seems unlikely that membrane surface area actually changes on a moment-to-moment basis in response to changes in extracellular [Cl−]. Therefore, we consider the possibility that our sine + dc Cm measurements are contaminated by changes in membrane conductance.
Figure 2.
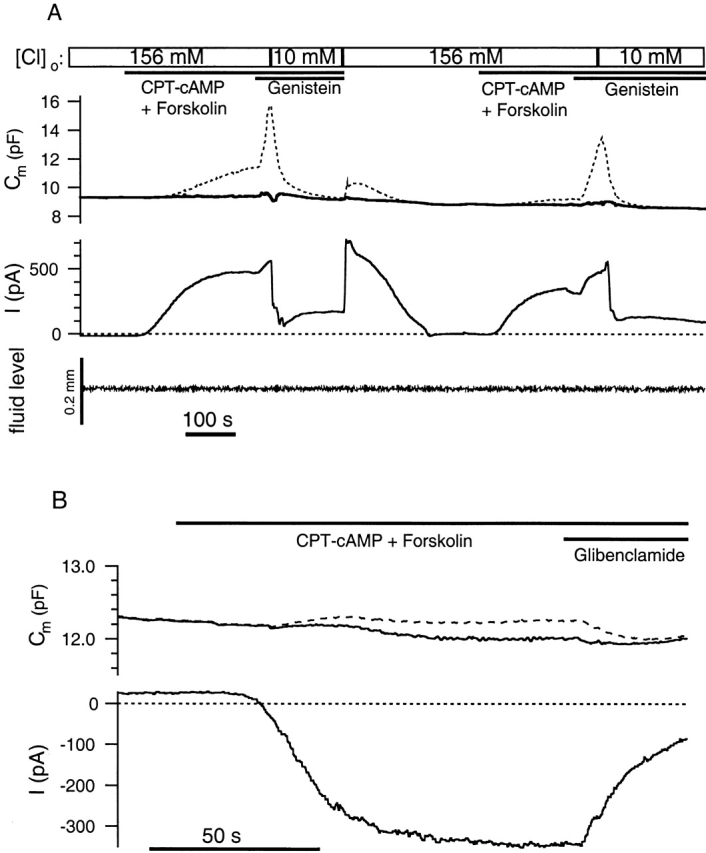
Corrected capacitance measurements reveal no correlation between Cl− current activation and exocytosis in Calu-3 cells. (A) cAMP-stimulated outward current under the recording condition of [Cl−]i = 24 mM, [Cl−]o = 156 mM, and −18-mV holding potential. The dashed line indicates Cm estimates generated using the sine + dc method assuming a reversal potential of −36.5 mV for the current. The solid Cm trace uses the more reliable sine + square technique described in materials and methods. Bars at top indicate changes in the composition of the bath solution. The substrate concentrations are as follows: 200 μM CPT-cAMP, 10 μM forskolin, and 50 μM genistein. Genistein is an isoflavone that increases the open probability of CFTR channels (Hwang et al. 1997). The bottom trace indicates changes in the fluid level measured with an infrared sensor. (B) cAMP-stimulated inward current under the recording condition of [Cl−]i = 125 mM, [Cl−]o = 30 mM, and +15-mV holding potential. The current was blocked by addition of 50 μM glibenclamide. The solid Cm trace was obtained using the sine + square method, whereas the dashed line indicates Cm estimates generated using the sine + dc method assuming a reversal potential of +36.3 mV.
To generate Cm estimates that are less prone to contamination by changes in membrane conductance, we interrupted our sine wave stimulus with occasional steps in voltage to allow the direct measurement of the dc conductance independent of any assumption about the reversal potential of the current (materials and methods; Okada et al. 1992). When we reanalyze the data from Fig. 2 A using this sine + square method, the apparent increase in Cm upon activation of CFTR current is absent (Fig. 2 A, solid line). We believe that the reason that the sine + dc method produces errors in Cm is because the increasing reversal potential of the Cl− current leads to errors in the estimation of the membrane conductance (materials and methods). For example, the peak value of Gt after the first addition of genistein in Fig. 2 A is 112 nS measured with the square wave, whereas the dc current indicates a value of only 39 nS if a reversal potential of −36.5 mV is assumed. The actual value of the extrapolated reversal potential at this point in time is −24.4 mV.
Another possible source of artifacts in Cm measurements are changes in fluid level that can occur during bath perfusion. Changes in bath fluid level change the pipette capacitance and can be misinterpreted as changes in membrane capacitance. We monitored the fluid level in all experiments with a sensitive infrared sensor. Fig. 2 A depicts a sample trace demonstrating that the fluid level changes less than ±0.01 mm during the course of this recording.
We also performed experiments with a reversed Cl− gradient ([Cl]i = 125 mM, [Cl]o = 30 mM) to look for any correlation between membrane surface area and activation of CFTR current. A sample recording, representative of nine cells, is depicted in Fig. 2 B. The cAMP-stimulating cocktail yields a robust inward current but no change in Cm measured using the sine + square technique. The sine + dc method (Fig. 2 B, dashed line) is less prone to errors in Cm in this configuration because Erev is more stable. (Erev is more stable when [Cl]i is high because Cl− flux leads to a smaller percent change in [Cl]i than when [Cl]i is low.) Glibenclamide, a CFTR channel blocker (Schultz et al. 1996; Sheppard and Robinson 1997), attenuates the CFTR current but has no effect on Cm, again demonstrating that we can generate Cm estimates that are insensitive to large changes in membrane conductance.
We also performed experiments using NIH3T3 cells stably expressing CFTR channels. Fig. 3 presents one of four recordings, all of which fail to show any correlation between CFTR activation and changes in membrane surface area. Fig. 4 summarizes recordings from 13 Calu-3 cells (open circles) and 4 NIH3T3 cells (closed triangles). Each point represents an individual experiment where the change in Cm is plotted against the maximal change in Gm resulting from activation of the CFTR current. Cells with increases in Gm <15 nS are excluded. The average Gm and Cm changes in Calu-3 cells are 43.9 nS (±27.0 nS, SD) and 23.0 fF (±52.0 fF, SEM), respectively (Fig. 4, closed circle). Fitting a line to the Calu-3 data gives a slight negative correlation between ΔCm and ΔGm that is unlikely to be significant (r = −0.11). For NIH3T3 cells, the average Gm and Cm changes are 46.2 nS (±24.1 nS, SD) and −7.5 fF (±123.0 fF, SEM), respectively. Again, no correlation between ΔCm and ΔGm is apparent.
Figure 3.

NIH3T3 cells stably expressing CFTR also did not show any correlation between CFTR activation and membrane surface area. [Cl] i = 24 mM, [Cl]o = 156 mM, and −18-mV holding potential.
Figure 4.

Lack of correlation between the cAMP-activated increase in membrane conductance (ΔGm) and the change in membrane capacitance (ΔCm) measured over the same time interval. Each data point plots the ΔCm against the maximal ΔGm elicited by cAMP for an individual cell. Cells that have an increase in Gm of <15 nS are excluded. The data include 13 Calu-3 cells (open circles) and 4 NIH3T3 cells (closed triangles). The closed circle indicates the mean ΔCm and ΔGm value for Calu-3 cells. The error bar represents the SEM of ΔCm. The line indicates the least-squares fit of the Calu-3 data (r = −0.11).
Rapid Activation of the CFTR Current with Flash Photolysis of Caged cAMP Also Fails to Produce an Increase in Membrane Capacitance
Since membrane capacitance often slowly drifts slightly during the course of an experiment, small changes in capacitance can be more accurately resolved in response to a rapid perturbation. Therefore, we used flash photolysis of caged cAMP to fully activate the CFTR current within seconds. Fig. 5 A depicts a sample response of a Calu-3 cell to photorelease of 100 μM NPE-cAMP and Fig. 5 B presents the average response from 15 cells that have activated currents of 100 pA or greater. The average peak current response of these cells is −521 pA (±80 pA, SEM) and the time constant of the exponential fitted to the average response is 6.2 s (Fig. 5 B, dotted line), which is consistent with a previous report (Nakashima and Ono 1994). To measure Cm accurately with higher time resolution than the sine + square technique, we used a technique where a stimulus containing two frequencies is applied (Rohlicek and Schmid 1994). Note that there is no apparent increase in Cm for either the sample or averaged traces despite a robust activation of the CFTR current. We performed a parallel set of experiments in NIH3T3 cells stably transfected with CFTR. In four cells, the average maximal current evoked by photorelease of caged cAMP was −581 pA (±157 pA, SEM), yet there was no increase in Cm (data not shown).
Figure 5.
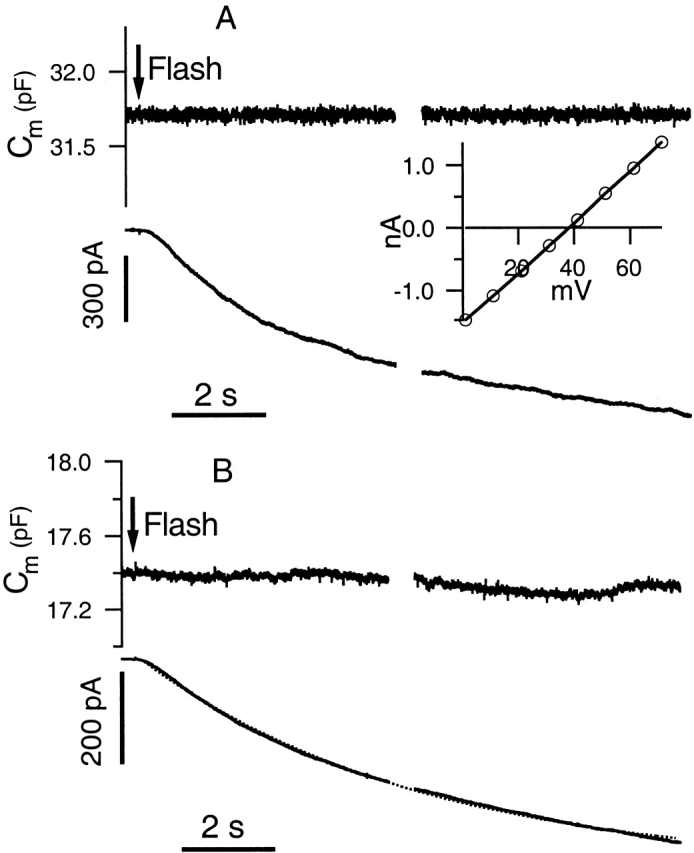
Flash photolysis of caged cAMP rapidly activates CFTR current but results in no change in Cm. All experiments included 100 μM NPE-cAMP in the [Cl−]i = 125 mM pipette solution. The [Cl−]o = 30 mM bath solution was used, and the holding potential was +15 mV. (A) Sample response to flash with Cm depicted in the top trace and current given in the bottom trace. The I-V response at peak current activation is shown in the inset. (B) Averaged response of 15 cells. The dotted line indicates the exponential fit to the averaged response, which had a time constant of 6.2 s.
FM1–43 Fluorescence Measurements Indicate No Change in Membrane Turnover Accompanies Activation of CFTR Current
Capacitance measurements indicate the surface area of the cell and, thus, only report the net difference between the rates of exocytosis and endocytosis. It is conceivable that no change in Cm occurs upon activation of CFTR current because exocytosis of vesicles containing CFTR channels is exactly balanced by endocytosis of membrane without channels. To test for this possibility, we used the fluorescent styrl dye FM1–43 as an indicator of membrane turnover (Betz and Bewick 1992; Smith and Betz 1996; Murthy and Stevens 1998). Including FM1–43 in the bath solution results in a fluorescent signal that is proportional to the area of the surface membrane plus any membrane that is internalized via endocytosis during the time that the dye is present in the bath (Smith and Betz 1996). FM1–43 selectively labels membrane that has been exposed to the bath solution because the dye partitions into, but cannot pass through, cell membranes and the fluorescence of the dye in free solution is negligible (Smith and Betz 1996; but also see Rouze and Schwartz 1998).
We activated CFTR current and recorded FM1–43 fluorescence under conditions that resulted in either influx of Cl− ([Cl]i = 24 mM, [Cl]o = 156 mM; Fig. 6 A) or efflux of Cl− ([Cl]i = 125 mM, [Cl]o = 30 mM; Fig. 6 B). None of the 15 cells we recorded with robust ICl (>200 pA) show any correlation between CFTR activation and FM1–43 fluorescence signal change. The vertical black bars in Fig. 6 indicate the expected change in FM1–43 fluorescence for the insertion of membrane equivalent to 1 pF of capacitance (materials and methods).
Approximately 60% of the cells show a continuous increase in FM1–43 fluorescence during the time of the recording (Fig. 6, compare A with B). Possible reasons for this increase are constitutive membrane turnover, slow “leak” of the dye into the cell (Rouze and Schwartz 1998) or slow partitioning of the dye into the relatively inaccessible membrane surface that is adhered to the glass coverslip. However, the increase in fluorescence always precedes the activation of the CFTR current, and there is never an increase in the slope of the fluorescent increase upon activation of the current (Fig. 6 A). Therefore, we conclude that activation of the CFTR current does not lead to any apparent increase in the rate of membrane turnover.
Exocytosis Triggered by Photorelease of Caged Ca2+ Does Not Increase CFTR Current
The experiments summarized in Fig. 2 Fig. 3 Fig. 4 Fig. 5 Fig. 6 suggest that the elevation of cAMP does not lead to a significant amount of exocytosis of vesicles containing CFTR channels. We wanted to see if elevation of [Ca2+]i, a potent trigger of exocytosis in excitable and nonexcitable cells, would lead to CFTR channel insertion. We loaded cells with caged Ca2+ (7 mM NP-EGTA loaded with 6 mM Ca2+) through the patch pipette and photoreleased Ca2+ with an ∼2-ms flash of UV light. We measured the resulting increase in [Ca2+]i using the fluorescent Ca2+ indicator dye fura2-FF, which was also included in the pipette solution. Elevation of [Ca2+]i to a level of ∼15 μM elicits a large and rapid increase in Cm and FM1–43 fluorescence in 14 out of 15 Calu-3 cells. A sample experiment is depicted in Fig. 7. 8 s after the UV flash, the average increase in Cm is 3.1 pF (minimum = 0.8 pF, maximum = 10.37 pF, SD = 2.75 pF). A clear increase in FM1–43 fluorescence is also noted (34 ± 30%), which serves as a positive control for the sensitivity of this assay.
In this set of experiments, photorelease of caged Ca2+ is induced after the CFTR current is fully activated with forskolin plus CPT-cAMP. A sample experiment, typical of six cells with an activated current >160 pA, is depicted in Fig. 7. Here, forskolin plus CPT-cAMP was added 17 s before the beginning of the trace. Note that during current activation, there is no change in Cm or FM1–43 fluorescence. 8 s after elevation of [Ca2+]i to 17.7 μM, Cm has increased by 4.32 pF, yet the current is actually decreasing in magnitude.
The Cm and current response during the first 8 s after photorelease of Ca2+ are displayed on an expanded time scale in Fig. 7 B. The rise in the Cm trace can be fitted by a single exponential function with a time constant of 1.72 s. Interestingly, the current initially increases in magnitude before undergoing a slow decrease that continues for tens of seconds. It is possible that the transient increase in current magnitude reflects channel insertion, but we feel it is not very significant because it is variable, small in magnitude, and can occur even in the absence of forskolin and cAMP when CFTR channels are silent (data not shown).
It is interesting that high [Ca]i leads to a slow inhibition of the CFTR current. The inhibition 60 s after the flash is 71.5 ± 19.5% (n = 6). We do not believe that the effect is due to an activation of an outward Ca2+-activated current, because the total membrane conductance (Gm) decreases in parallel with the decrease in the magnitude of the current (Fig. 7 A). In addition, no outward current is elicited by Ca2+ in the absence of forskolin and cAMP (data not shown).
DISCUSSION
The major finding of the present study is that cAMP activation of CFTR Cl− current in human airway serous epithelial (Calu-3) cells occurs without any detectable changes in the rate of exocytosis or endocytosis. Is it possible that we failed to detect channel insertion because only a tiny amount of membrane with a high density of CFTR channels is transported to the plasma membrane? If a significant fraction of the activated current is due to channel insertion, then we can calculate a lower limit on the channel density in the inserted membrane. In the experiments summarized in Fig. 4, the mean increase in Gm is 43.9 nS, corresponding to 4,300–5,500 CFTR channels with a single-channel conductance of 8–10 pS. The mean increase in Cm in Fig. 4 is 23 fF, corresponding to a total membrane area of ∼2.3 μm2 (1 μF/cm2). If 50% of the Gm increase results from channel insertion then the density of channels in the inserted membrane would have to be 935–1,200 channels/μm2. This would be a channel density >400-fold higher than the average density of CFTR on the cell surface and would approach the highest density of ion channels reported in the literature. For example, estimates of the density of Na+ channels at the node of Ranvier range from ∼400–1,900 channels/μm2 (Hille 1992). In addition, we saw no apparent correlation between changes in Cm and the magnitude of the activated Gm (Fig. 4) and our caged cAMP experiments failed to show any increase in Cm with activation of CFTR (Fig. 5). It is important to note that our experiments only examine the first 5–10 min after activation of the CFTR current, therefore, it is possible that trafficking of CFTR channels to the membrane may be an important process over a longer time scale.
Our finding is in agreement with the report by Loffing et al. 1998 in which a novel immunofluorescence and confocal microscopy technique is used, however, our results conflict with those of Hug et al. 1999 in the same cell type. This group reports an average ΔGm quite similar to our value (46.4 nS), yet they observe an average ΔCm of 0.97 pF. The reason for the discrepancy is not clear, however, different techniques for estimating Cm are used.
The same controversy exists in other cell types, e.g., T84 cells (a colonic epithelial cell line; Tousson et al. 1996; Prince et al. 1993) and CFTR-expressing Xenopus oocytes. A study by Takahashi et al. 1996 suggests that cAMP stimulates both chloride conductance and membrane traffic in oocytes using a capacitance measurement technique. In contrast, Liu et al. 1999 found no evidence of this linkage using covalent labeling of a cysteine-substituted mutant of CFTR.
The mechanism by which cAMP stimulates CFTR-mediated Cl− flux is possibly cell-type specific. Using similar techniques, Hug et al. 1997 observe no regulation of membrane recycling by cAMP in Chinese hamster ovary cells, but their previous study of HT29 cells (Greger et al. 1993) suggests a role for cAMP in membrane trafficking. It has been suggested that the membrane-trafficking pathway for activation of Cl− current is necessary in cell types in which very large and rapid changes in Cl− flux commonly occur, e.g., epithelial cells in shark rectal gland (Guggino 1998; Lehrich et al. 1998).
Whereas the hypothesis that cAMP leads to insertion of CFTR channels into the plasma membrane by exocytosis is controversial, it is well established that cAMP increases the open probability of CFTR channels already resident in the membrane. For example, Al-Nakkash and Hwang 1999 demonstrate that increasing the concentration of exogenously applied cAMP increases the open probability, but not the number, of CFTR channels present in cell-attached patches.
Our results also suggest that exocytosis triggered by rapid elevation of [Ca2+]i results in little, if any, insertion of active CFTR channels. Our results add Calu-3 cells to the list of nonexcitable cells that can undergo massive exocytosis upon photorelease of caged Ca2+ (Coorssen et al. 1996; Ninomiya et al. 1996). High intracellular Ca2+ not only triggers exocytosis in Calu-3 cells, but also appears to inhibit the CFTR current over a time course of tens of seconds. The mechanism of this inhibition is not known. One possibility is that Ca2+-activated phosphatases dephosphorylate the channels (Fischer et al. 1998), however, this issue needs further study.
A final conclusion from our results is that membrane capacitance measurements can be very sensitive to changes in membrane conductance. A host of techniques have been used for membrane capacitance measurements and some are better than others for separating changes in Gm from changes in Cm. For example, we found that even careful application of the sine + dc algorithm results in an artifactual correlation between Cm and Gm. Piecewise-linear capacitance techniques such as “phase-tracking” will also be subject to Cm artifacts of similar or greater magnitude (Debus et al. 1995). The sine + square and dual frequency methods we used were able to produce Cm estimates uncontaminated by changes in Gm, illustrating that each technique used for membrane capacitance measurements needs independent validation under relevant experimental conditions.
Acknowledgments
We would like to thank Shenghui Hu and Min Li for their help with Calu-3 cells and Graham Ellis-Davies for a gift of nitrophenyl EGTA.
This work was supported by a Whitaker Research grant to K.D. Gillis and a National Institutes of Health grant (No. R01 DK55835) to T.C. Hwang.
References
- Al-Nakkash L., Hwang T.C. Activation of wild-type and deltaF508-CFTR by phosphodiesterase inhibitors through cAMP-dependent and -independent mechanisms. Pflügers Arch. 1999;437:553–561. doi: 10.1007/s004240050817. [DOI] [PubMed] [Google Scholar]
- Bear C.E., Li C.H., Kartner N., Bridges R.J., Jensen T.J., Ramjeesingh M., Riordan J.R. Purification and functional reconstitution of the cystic fibrosis transmembrane conductance regulator (CFTR) Cell. 1992;68:809–818. doi: 10.1016/0092-8674(92)90155-6. [DOI] [PubMed] [Google Scholar]
- Betz W.J., Bewick G.S. Optical analysis of synaptic vesicle recycling at the frog neuromuscular junction. Science. 1992;255:200–203. doi: 10.1126/science.1553547. [DOI] [PubMed] [Google Scholar]
- Bradbury N.A. Intracellular CFTRlocalization and function. Physiol. Rev. 1999;79:S175–S191. doi: 10.1152/physrev.1999.79.1.S175. [DOI] [PubMed] [Google Scholar]
- Bradbury N.A., Jilling T., Kirk K.L., Bridges R.J. Regulated endocytosis in a chloride secretory epithelial cell line. Am. J. Physiol. 1992;262:C752–C759. doi: 10.1152/ajpcell.1992.262.3.C752. [DOI] [PubMed] [Google Scholar]
- Coorssen J.R., Schmitt H., Almers W. Ca triggers massive exocytosis in Chinese hamster ovary cells. EMBO J. 1996;15:3789–3791. [PMC free article] [PubMed] [Google Scholar]
- Debus K., Hartmann J., Kilac G., Lindau M. Influence of conductance changes on patch clamp capacitance measurements using a lock-in amplifier and limitations of the phase tracking techniques. Biophys. J. 1995;69:2808–2822. doi: 10.1016/S0006-3495(95)80154-2. [DOI] [PMC free article] [PubMed] [Google Scholar]
- Ellis-Davies G.C., Kaplan J.H. Nitrophenyl-EGTA, a photolabile chelator that selectively binds Ca2+ with high affinity and releases it rapidly upon photolysis. Proc. Natl. Acad. Sci. USA. 1994;91:187–191. doi: 10.1073/pnas.91.1.187. [DOI] [PMC free article] [PubMed] [Google Scholar]
- Fischer H., Illek B., Machen T.E. Regulation of CFTR by protein phosphatase 2B and protein kinase C. Pflügers Arch. 1998;436:175–181. doi: 10.1007/s004240050620. [DOI] [PubMed] [Google Scholar]
- Fuller C.M., Benos D.J. CFTR! Am. J. Physiol. 1992;267:C267–C287. doi: 10.1152/ajpcell.1992.263.2.C267. [DOI] [PubMed] [Google Scholar]
- Gadsby, D.C., G. Nagel, and T.C. Hwang. 1995. The CFTR chloride channel of mammalian heart. Annu. Rev. Physiol. 387–416. [DOI] [PubMed]
- Gillis K.D. Techniques for membrane capacitance measurements. In: Sakmann B., Neher E., editors. Single-Channel Recording. Plenum Press; New York: 1995. pp. 155–197. [Google Scholar]
- Gillis K.D. Admittance-based measurement of membrane capacitance using EPC-9 patch clamp amplifier. Pflügers Arch. 2000;439:655–664. doi: 10.1007/s004249900173. [DOI] [PubMed] [Google Scholar]
- Gillis K.D., Möβner R., Neher E. Protein kinase C enhances exocytosis from chromaffin cells by increasing the size of the readily releasable pool of secretory granules. Neuron. 1996;16:1209–1220. doi: 10.1016/s0896-6273(00)80147-6. [DOI] [PubMed] [Google Scholar]
- Greger R., Aller N., Frobe U., Normann C. Increase in cytosolic Ca2+ regulates exocytosis and Cl− conductance in HT29 cells. Pflügers Arch. 1993;424:329–334. doi: 10.1007/BF00384360. [DOI] [PubMed] [Google Scholar]
- Guggino W.B. Focus on “exocytosis is not involved in activation of Cl− secretion via CFTR in Calu-3 airway epithelial cells”. Am. J. Physiol. 1998;275:C911–C912. doi: 10.1152/ajpcell.1998.275.4.C911. [DOI] [PubMed] [Google Scholar]
- Heinemann C., Chow R.H., Neher E., Zucker R.S. Kinetics of the secretory response in bovine chromaffin cells following flash photolysis of caged Ca2+ Biophys. J. 1994;67:2546–2557. doi: 10.1016/S0006-3495(94)80744-1. [DOI] [PMC free article] [PubMed] [Google Scholar]
- Hille B. Ionic Channels in Excitable Membranes 2nd ed 1992. Sinauer Associates, Inc; Sunderland, MA: pp. 607 pp [Google Scholar]
- Howard M., Jiang X., Stolz D.B., Hill W.G., Johnson J.A., Watkins S.C., Frizzell R.A., Bruton C.M., Robbins P.D., Weisz O.A. Forskolin-induced apical membrane insertion of virally expressed, epitope-tagged CFTR in polarized MDCK cells. Am. J. Physiol. Cell Physiol. 2000;279:C375–C382. doi: 10.1152/ajpcell.2000.279.2.C375. [DOI] [PubMed] [Google Scholar]
- Hug M.J., Thiele I.E., Greger R. The role of exocytosis in the activation of the chloride conductance in Chinese hamster ovary cells (CHO) stably expressing CFTR. Pflügers Arch. 1997;434:779–784. doi: 10.1007/s004240050465. [DOI] [PubMed] [Google Scholar]
- Hug M.J., Sun F., Frizzell R.A. cAMP increases membrane conductance and membrane capacitance in airway submucosal gland cells J. Gen. Physiol. 114 1999. 20a(Abstr.) [Google Scholar]
- Hwang T.C., Wang F., Yang I.C., Reenstra W.W. Genistein potentiates wild-type and delta F508-CFTR channel activity. Am. J. Physiol. 1997;273:C988–C998. doi: 10.1152/ajpcell.1997.273.3.C988. [DOI] [PubMed] [Google Scholar]
- Lehrich R.W., Aller S.G., Webster P., Marino C.R., Forrest J.N.J. Vasoactive intestinal peptide, forskolin, and genistein increase apical CFTR trafficking in the rectal gland of the spiny dogfish, Squalus acanthias. Acute regulation of CFTR trafficking in an intact epithelium. J. Clin. Invest. 1998;101:737–745. doi: 10.1172/JCI803. [DOI] [PMC free article] [PubMed] [Google Scholar]
- Lindau, M., and E. Neher. 1988. Patch-clamp techniques for time-resolved capacitance measurements in single cells. Pflügers Arch. 137–146. [DOI] [PubMed]
- Liu X., Smith S.S., Sun F., Dawson D.C. CFTRcovalent modification of cysteine-substituted channels expressed in Xenopus oocytes shows that activation is due to the opening of channels resident in the plasma membrane Ped. Pulmon. Suppl. 19 1999. A45(Abstr.) [DOI] [PMC free article] [PubMed] [Google Scholar]
- Loffing J., Moyer B.D., McCoy D., Stanton B.A. Exocytosis is not involved in activation of Cl− secretion via CFTR in Calu-3 airway epithelial cells. Am. J. Physiol. 1998;275:C913–C920. doi: 10.1152/ajpcell.1998.275.4.C913. [DOI] [PubMed] [Google Scholar]
- Moyer B.D., Loffing J., Schwiebert E.M., Loffing-Cueni D., Halpin P.A., Karlson K.H., Ismailov I.I., Guggino W.B., Langford G.M., Stanton B.A. Membrane trafficking of the cystic fibrosis gene product, cystic fibrosis transmembrane conductance regulator, tagged with green fluorescent protein in Madin-Darby canine kidney cells. J. Biol. Chem. 1998;273:21759–21768. doi: 10.1074/jbc.273.34.21759. [DOI] [PubMed] [Google Scholar]
- Murthy V.N., Stevens C.F. Synaptic vesicles retain their identity through the endocytic cycle. Nature. 1998;392:497–501. doi: 10.1038/33152. [DOI] [PubMed] [Google Scholar]
- Nakashima Y., Ono K. Rate-limiting steps in activation of cardiac Cl− current revealed by photolytic application of cAMP. Am. J. Physiol. 1994;267:H1514–H1522. doi: 10.1152/ajpheart.1994.267.4.H1514. [DOI] [PubMed] [Google Scholar]
- Ninomiya Y., Kishimoto T., Miyashita Y., Kasai H. Ca2+-dependent exocytotic pathways in Chinese hamster ovary fibroblasts revealed by a caged-Ca2+ compound. J. Biol. Chem. 1996;271:17751–17754. doi: 10.1074/jbc.271.30.17751. [DOI] [PubMed] [Google Scholar]
- Okada Y., Hazama A., Hashimoto A., Maruyama Y., Kubo M. Exocytosis upon osmotic swelling in human epithelial cells. Biochim. Biophys. Acta. 1992;1107:201–205. doi: 10.1016/0005-2736(92)90348-p. [DOI] [PubMed] [Google Scholar]
- Peters K.W., Qi J., Watkins S.C., Frizzell R.A. Syntaxin 1A inhibits regulated CFTR trafficking in Xenopus oocytes. Am. J. Physiol. 1999;277:C174–C180. doi: 10.1152/ajpcell.1999.277.1.C174. [DOI] [PubMed] [Google Scholar]
- Prince L.S., Tousson A., Marchase R.B. Cell surface labeling of CFTR in T84 cells. Am. J. Physiol. 1993;264:C491–C498. doi: 10.1152/ajpcell.1993.264.2.C491. [DOI] [PubMed] [Google Scholar]
- Quinton P.M. Physiological basis of cystic fibrosisa historical perspective. Physiol. Rev. 1999;79:S3–S22. doi: 10.1152/physrev.1999.79.1.S3. [DOI] [PubMed] [Google Scholar]
- Rohlicek V., Schmid A. Dual-frequency method for synchronous measurement of cell capacitance, membrane conductance and access resistance on single cells. Pflügers Arch. 1994;428:30–38. doi: 10.1007/BF00374749. [DOI] [PubMed] [Google Scholar]
- Rouze N.C., Schwartz E.A. Continuous and transient vesicle cycling at a ribbon synapse. J. Neurosci. 1998;18:8614–8624. doi: 10.1523/JNEUROSCI.18-21-08614.1998. [DOI] [PMC free article] [PubMed] [Google Scholar]
- Santos G.F., Reenstra W.W. Activation of the cystic fibrosis transmembrane regulator by cyclic AMP is not correlated with inhibition of endocytosis. Biochim. Biophys. Acta. 1994;1195:96–102. doi: 10.1016/0005-2736(94)90014-0. [DOI] [PubMed] [Google Scholar]
- Schultz B., DeRoos A., Venglarik C., Singh A., Frizzell R., Bridges R. Glibenclamide blockade of CFTR chloride channels. Am. J. Physiol. 1996;271:L192–L200. doi: 10.1152/ajplung.1996.271.2.L192. [DOI] [PubMed] [Google Scholar]
- Schwiebert E.M., Gesek F., Ercolani L., Wjasow C., Gruenert D.C., Karlson K., Stanton B.A. Heterotrimeric G proteins, vesicle trafficking, and CFTR Cl− channels. Am. J. Physiol. 1994;267:C272–C281. doi: 10.1152/ajpcell.1994.267.1.C272. [DOI] [PubMed] [Google Scholar]
- Shen B.Q., Finkbeiner W.E., Wine J.J., Mrsny R.J., Widdicombe J.H. Calu-3a human airway epithelial cell line that shows cAMP-dependent Cl− secretion. Am. J. Physiol. 1994;266:L493–L501. doi: 10.1152/ajplung.1994.266.5.L493. [DOI] [PubMed] [Google Scholar]
- Sheppard D., Robinson K. Mechanism of glibenclamide inhibition of cystic fibrosis transmembrane conductance regulator Cl− channels expressed in a murine cell line. J. Physiol. 1997;503:333–346. doi: 10.1111/j.1469-7793.1997.333bh.x. [DOI] [PMC free article] [PubMed] [Google Scholar]
- Smith C., Betz W. Simultaneous independent measurement of endocytosis and exocytosis. Nature. 1996;380:531–534. doi: 10.1038/380531a0. [DOI] [PubMed] [Google Scholar]
- Tabcharani J.A., Chang X.B., Riordan J.R., Hanrahan J.W. Phosphorylation-regulated Cl− channel in CHO cells stably expressing the cystic fibrosis gene. Nature. 1991;352:628–631. doi: 10.1038/352628a0. [DOI] [PubMed] [Google Scholar]
- Takahashi A., Watkins S.C., Howard M., Frizzell R.A. CFTR-dependent membrane insertion is linked to stimulation of the CFTR chloride conductance. Am. J. Physiol. 1996;271:C1887–C1894. doi: 10.1152/ajpcell.1996.271.6.C1887. [DOI] [PubMed] [Google Scholar]
- Tousson A., Fuller C.M., Benos D.J. Apical recruitment of CFTR in T-84 cells is dependent on cAMP and microtubules but not Ca2+ or microfilaments. J. Cell Sci. 1996;109:1325–1334. doi: 10.1242/jcs.109.6.1325. [DOI] [PubMed] [Google Scholar]