

Abstract
Two hypotheses have been proposed recently that offer different views on the role of airway surface liquid (ASL) in lung defense. The “compositional” hypothesis predicts that ASL [NaCl] is kept low (<50 mM) by passive forces to permit antimicrobial factors to act as a chemical defense. The “volume” hypothesis predicts that ASL volume (height) is regulated isotonically by active ion transport to maintain efficient mechanical mucus clearance as the primary form of lung defense. To compare these hypotheses, we searched for roles for: (1) passive forces (surface tension, ciliary tip capillarity, Donnan, and nonionic osmolytes) in the regulation of ASL composition; and (2) active ion transport in ASL volume regulation. In primary human tracheobronchial cultures, we found no evidence that a low [NaCl] ASL could be produced by passive forces, or that nonionic osmolytes contributed substantially to ASL osmolality. Instead, we found that active ion transport regulated ASL volume (height), and that feedback existed between the ASL and airway epithelia to govern the rate of ion transport and volume absorption. The mucus layer acted as a “reservoir” to buffer periciliary liquid layer height (7 μm) at a level optimal for mucus transport by donating or accepting liquid to or from the periciliary liquid layer, respectively. These data favor the active ion transport/volume model hypothesis to describe ASL physiology.
Keywords: cystic fibrosis, mucus, ion transport, chloride, epithelia
INTRODUCTION
Airway surface liquid (ASL) is a major constituent of the lung's innate defense mechanisms, yet both its composition and regulation are poorly understood. This lack of understanding reflects, in part, difficulties in sampling in vivo and in vitro this shallow layer (10–100 μm in height; Rahmoune and Shephard 1995; Sims and Horne 1997). The absence of accurate measurements has also given rise to controversy over how abnormal ASL may be linked to cystic fibrosis (CF) airway epithelial dysfunction (Boucher 1999; Guggino 1999; Wine 1999). A “compositional” hypothesis (Quinton 1994; Smith et al. 1996; Goldman et al. 1997; Zabner et al. 1998) places the emphasis on regulation of the salt concentration [NaCl] rather than the volume of ASL. This hypothesis predicts that the [NaCl] in normal ASL is low relative to plasma (<50 mM), which allows defensins to act as an antimicrobial shield (Goldman et al. 1997). In CF airway epithelia, the lack of functional CFTR is predicted to abolish transcellular NaCl absorption, as in CF sweat ducts. Failure of transcellular NaCl absorption increases ASL [NaCl], which inactivates defensins when [NaCl] exceeds 100 mM, and sets the stage for chronic bacterial infection (Goldman et al. 1997). The mechanism whereby ASL [NaCl] is “lowered” into the range permissive for defensin activation (i.e., <50 mM) in normals has been postulated to involve “surface forces” (Zabner et al. 1998) and/or a role for unidentified osmolytes in ASL (Zabner et al. 1998).
Conversely, the isotonic “volume” hypothesis focuses on the role of mechanical clearance of airways by mucus transport in lung defense. In this hypothesis, airway epithelia regulate the volume of liquid in the periciliary and mucus layers of ASL by isotonic transport to mediate efficient mucociliary clearance (Matsui et al. 1998a, Matsui et al. 2000; Boucher 1999). Epithelia that perform isotonic volume transport are “leaky,” and are only capable of maintaining small osmotic (salt) gradients (Ussing et al. 1993). Consequently, the salt composition of both normal and CF ASL is predicted to be similar to each other and close in concentration to plasma, whereas the rates of isotonic volume transport are predicted to vary. In CF, absence of CFTR's tonic inhibition of epithelial Na+ absorption results in increased isotonic hyperabsorption of ASL (Kunzelmann et al. 1995; Stutts et al. 1995), which decreases ASL volume, slows/abolishes mucus transport, and causes mucus accumulation on airway surfaces. Inhaled bacteria adhere to retained mucus, and chronic bacterial infection of these immobile mucus masses occurs.
We have developed a cell culture model that exhibits many of the features of airway epithelia in vivo, including similar density of ciliated cells and degree of ciliation (cilia/cell) (Carson et al. 1981; and see below), an isotonic ASL [NaCl] (∼120–140 mM; Knowles et al. 1997; Hull et al. 1998; Matsui et al. 1998a), and mucus transport rates that mimic these reported in vivo (Matsui et al. 1998b). We have used this cell culture model to investigate mechanisms hypothesized to regulate ASL volume and/or composition of normal airway epithelia. Specifically, the compositional hypothesis predicts that low [NaCl] in normal ASL is maintained by either passive hydrostatic forces to balance reduced ASL osmolarity or unrecognized osmotically active substances. Consequently, we have investigated the potential roles of passive forces (surface tension, ciliary tip capillarity, and Donnan) on ASL volume/composition and searched for a role for nonionic osmolytes in ASL. In contrast, the isotonic volume hypothesis predicts that ASL volume is kept at an optimal level to maintain mucus transport. Hence, we have tested the hypothesis that active ion transport determines ASL volume and that feedback exists between the ASL volume and the rate of epithelial ion transport. Investigation of these parameters will aid in distinguishing between the two hypotheses and elucidate the normal physiologic mechanisms involved in maintenance of normal ASL.
METHODS AND MATERIALS
Human Airway Epithelial Isolation and Culture
Cells were obtained from freshly excised bronchial specimens from normal subjects by protease digestion (Matsui et al. 1998a), seeded directly as primary cultures on 12-mm Transwell Col membranes (T-Col; Costar) in modified BEGM media under air–liquid interface conditions, and studied when fully differentiated (2–5 wk). For microsampling experiments, cultures were grown on 24-mm T-Cols since the larger surface area was associated with a proportionally greater volume of ASL. Cultures with transepithelial resistances (Rt) >300 Ω cm2 were studied (average = 457 ± 31). All cultures were populated by ciliated cells (∼80%) that expressed cilia at a similar density to in vivo airway epithelia (ciliary interaxonemal spacing in vitro was 0.38 ± 0.12 μm [n = 3] compared with 0.41 ± 0.05 μm observed in freshly excised ciliated cells; Carson et al. 1981). Most cultures were washed three times per week to prevent excessive accumulation of secreted mucus. Approximately one in three cultures exhibited rotational transport of secreted mucins. The reason for this frequency is unclear since no difference could be detected in culture morphology or bioelectric properties. Cultures were prescreened and selected for specific experiments on the basis of whether they exhibited rotational mucus transport, which was typically assessed within 72 h after washing the mucosal surface. All cultures were kept in a highly humidified incubator between readings (Matsui et al. 1998a).
Surface Tension Measurements
In vitro surface tension measurements were performed following the methodology of Im Hof et al. 1997. In brief, a 4:1 mix of dimethylphthalate/octanol (DMP/O) to which 4 mg/ml crystal violet had been added to aid visualization was placed into a Hamilton syringe and held in a micromanipulator over a culture. This system was then viewed under a dissecting microscope (model SMZ-U; Nikon) to which a camera (model FX-35; Nikon) was attached. The syringe plunger was depressed until an ∼1-mm-diam DMP/O droplet formed at the tip of the syringe. Once a photograph was taken of the droplet to record its diameter (dsyringe), the syringe was tapped gently to deposit the droplet onto the cultures, and a second picture was taken of the spread droplet to record its new diameter (dculture). The ratio dculture/dsyringe was then compared with the calibration curves for the spreading behavior of DMP/O obtained in a Wilhelmy-Langmuir balance under thin film conditions (10 μm; Im Hof et al. 1997) that are appropriate for our experimental conditions. To test the validity of this approach, we added test droplets of DMP/O to a solution of known T (FC-72). The ratios of DMP/O droplet diameters (dculture/dsyringe: 1.0 ± 0; n = 3) were in agreement with calibration curves published by Im Hof et al. 1997.
Morphologic Studies
We used a nonaqueous fixative that preserves the topology of the ASL in situ (Matsui et al. 1998a). Cultures were fixed using 1% osmium tetraoxide in perfluorocarbon (OsO4/PFC; FC-72). After fixation, samples were directly immersed in 100% ethanol, processed for epon/araldite resin embedding using conventional procedures, and sections were prepared for electron microscopy.
Confocal Microscopy Measurement of “Thin Films” of ASL
To label ASL, PBS containing 2 mg/ml Texas red–dextran (10 kD; Molecular Probes) was added to cultures. Mucus was labeled with a 1% (vol/vol) fluorescent microsphere suspension (carboxylate-modified, 0.1 μm diam, green fluorescence; Molecular Probes). In some cases, the native ASL was aspirated to mimic volume-depleted airways (final ASL thickness <10 μm). For all studies, perfluorocarbon (PFC) was added mucosally to prevent evaporation of the ASL, and the culture was placed on the stage of the confocal microscope over a serosal reservoir (80 μl TES-buffered Ringer). To determine the average height of the ASL, five predetermined points on the culture were scanned.
Microsampling of ASL and Mucus and Mucus Wet/Dry Ratios
To sample ASL, constant bore microcapillary pipettes were lowered onto the surface of the preparation through a small hole drilled into the top of the T-Col lid with a micromanipulator (Matsui et al. 1998a). Samples from microcapillaries were deposited on filter paper discs, and the osmolarity was measured with a vapor pressure osmometer (Vapro 5520; Wescor). For measurements of Cl−, Na+, or K+ concentrations, the sample volume was measured from the length of the liquid column in the capillary tube, the contents diluted into ultrapure 0.1 N nitric acid, and measurements of Na+ or K+ made by flame emission spectroscopy and Cl− by amperometric titration, as described previously (Matsui et al. 1998a).
Mucus samples were removed with forceps and weighed at timed intervals to back-extrapolate initial wet weights (Knowles et al. 1997). Some mucus samples were ultracentrifuged at 3.5 × 10⁵ g, the supernatant was sampled with microcapillaries, and the remainder was probed with Cl−-selective microelectrodes. Other mucus samples were left for >2 h at 100°C, and then reweighed to obtain dry weights for wet/dry ratios and percent solids.
Measurement of ASL/Mucus Cl− Concentration
Double-barreled Cl−-selective microelectrodes were constructed as described previously (Willumsen et al. 1989). The electrodes were calibrated before each experiment, using standard solutions (15–150 mM Cl−) and checked for stability (±1 mV drift/h). To obtain measurements of ASL or mucus [Cl−], the microelectrodes were positioned with a micromanipulator and stable measurements (>5 min) recorded before commencement of the experiment. For recording of ASL (mucus layer/PCL) [Cl−], the microelectrode was advanced through the mucus layer (“hurricane”) up to the point where the epithelium was impaled. This event was characterized by a sudden drop in [Cl−], as intracellular [Cl−] is much lower than ASL/mucus [Cl−] and an increase in PD measured through the reference electrode, which reflected a change from measuring Vt to measuring Va and Vb in series. PFC was added to the mucosal surface during the period of recording to avoid ASL evaporation.
Measurement of Mucus Transport Rates
Cultures were pretreated by the addition of PBS (20–50 μl) containing a 0.02% (vol/vol) fluorescent microsphere suspension (carboxylate-modified, 1 μm diam, blue or green fluorescence) to the apical surface. Rotational mucus transport rates over the surface of the cultures were measured from images (5-s exposures) acquired with an inverted epifluorescence microscope (model DMIRB; Leica) and a CCD camera (model C5985; Hamamatsu). The linear velocity of bead transport was normalized to a 1-mm distance from the center of rotation by linear regression analysis (Matsui et al. 1998a).
Measurement of Transepithelial PD and ASL PO2
Single O2-sensitive microelectrodes were purchased from Diamond Corp. The electrodes were calibrated before each experiment using standard solutions (0% and 21% PO2) and checked for stability (±1 mV drift/10 min). To locate the ASL, a macroelectrode (polyethylene tubing with 3 M KCl/4% agar) was placed in the serosal bath and the reference microelectrode (glass, 3 M KCl− filled) was positioned by micromanipulator into the ASL so that stable transepithelial PD measurements could be recorded. To obtain measurements of ASL PO2, the O2 microelectrode was then advanced by a second micromanipulator to the point where the ASL was impaled. This event was characterized by an abrupt reading on the O2 electrometer when the reference and O2 microelectrodes were in electrical contact in the ASL. Initial (t = 0) measurements were made between 10 min and 1 h after the addition of the mucosal solution (20 μl PBS). PFC was added to the mucosal surface during the period of recording to avoid ASL evaporation. PFC is freely O2-permeable, and its addition had no effect on ASL PO2 (n = 4).
Solutions and Chemicals
During thin film experiments, cultures were bathed serosally in a TES-buffered, modified Ringer solution and PBS was used for washing the apical surface and as a volume load. Amiloride, crystal violet, DTT, isoproterenol, octanol, raffinose, and all salts were obtained from Sigma-Aldrich. Dimethylphthalate was obtained from Fisher. All fluorescent compounds were obtained from Molecular Probes. PFCs (FC-72 and FC-77) were obtained from 3 M. PFC alone had no effect on ASL height, rotational mucus transport rate, ASL [Cl−], or Vt over 10 min (each n = 3; Tarran et al. 2001).
To avoid a change in the ASL volume while adding amiloride, this compound was added as a dry powder suspended in PFC (FC-72) and sonicated in PFC for 10 min to ensure even distribution before its addition to the ASL. The final concentration of amiloride was calculated based on an assumed ASL volume for each culture after the final rinse as 10 μl and a supramaximal dose was chosen to ensure a consistent response: 0.001 mg of compound was added per culture, yielding a final concentration in ASL of ≅375 μM for amiloride (Tarran et al. 2001). Bumetanide was dissolved as a concentrated stock solution in DMSO and diluted 1,000-fold in the serosal bath to give the final concentration (100 μM).
Statistics
Parametric statistics (ANOVA followed by the Tukey test to determine significant differences among groups) were used where the variances were homogeneously distributed. In the case of nonhomogeneity of variance, significance of difference between means was determined by either ANOVA followed by Dunn's multiple comparison test, the Mann-Whitney U test, or the Wilcoxon signed rank test as appropriate. All values are expressed as mean ± SEM, where n represents the number of cultures (a minimum of three donors provided tissues per experiment).
RESULTS
Contribution of ASL Surface Tension and Outstretched Cilia to ASL Volume/Composition
The lung possesses an air–liquid interface that, as a function of the surface tension at the interface, will generate a negative (referenced to the submucosa) hydrostatic pressure in the ASL. According to LaPlace's law, this hydrostatic pressure (P) in a cylinder (modeling an airway lumen) is directly proportional to twice the surface tension (T) and inversely proportional to the radius of curvature (r). However, a key consideration is the application of this mathematical relationship to the topography of ASL in vivo. It is possible to consider the cilia as “telegraph poles” and the ASL as the “wire” strung between them, or more accurately, since airway surfaces are 3-D, the ASL could be considered as the roof of a “circus tent.” Both of these depictions are difficult to model mathematically. Hence, Widdicombe 1997 simplified the model for predicting surface tension by comparing the contact surfaces (i.e., perimeters) at different ASL heights. In this model, once the ASL is reduced to the height of outstretched cilia, an enormous new contact surface (perimeter) is generated, shifting from the perimeter of the airway lumen (or the culture dish in vitro) when ASL height is greater than ciliary height to that between ASL and the circumference of each cilium (now P ≅ 2πrTx, where x = the number of cilia) when ASL height equals the ciliary height. The prediction from this model is that volume absorption from the epithelium will slow (or even stop) when ASL height reaches that of the outstretched cilia, and others have suggested that the P developed under this condition could balance the osmotic pressure that would be generated by a “low salt” (50 mM NaCl) ASL, as compared with interstitial (plasma) salt concentrations (∼150 mM NaCl), and hence maintain a “normal” volume of low salt ASL on airway surfaces (Zabner et al. 1998). However, we (Boucher 1999) and Widdicombe 1997 have pointed out that if mucus covers the surface of airways, or if ASL height is ≥7 μm, then this model describing a role for outstretched cilia in regulating ASL volume and composition is not relevant. Because we made no a priori decision on the appropriateness of models, we measured surface tension (T) in our cultures and directly explored the concept that outstretched cilia could develop high T/large perimeter interfaces that control ASL height.
ASL Surface Tension
We adapted the method of Schurch et al. 1978; Im Hof et al. 1997 to measure T on human airway cultures under conditions that may best mimic those in vivo, i.e., basal conditions in cultures with secreted mucins allowed to become organized into a mucus layer (48 h after washing the mucosal surface; Matsui et al. 1998b). With this technique, the spread of oil droplets deposited on the surface of air–liquid interface cultures is measured, which is directly proportional to surface tension at the air–liquid interface (Schurch et al. 1978; Im Hof et al. 1997). Fig. 1 ai shows an ∼1-mm-diam droplet of DMP/O (materials and methods) suspended from a needle directly above a culture, and Fig. 1aii shows the same drop deposited on the culture surface. The ratio of DMP/O droplet diameters (dculture/dneedle) was 2.1 ± 0.11 (n = 5), which, when calibrated using the curve constructed by Im Hof et al. 1997, yields a value of 33.9 ± 0.6 mN/m (n = 5). Addition of 20 μl PBS to mucus-containing cultures caused the mucus layer to swell (see below). Interestingly, the measured T did not significantly change after PBS addition (n = 4), suggesting that the added PBS did not dilute the surface active materials at the air–ASL interface. (Note that the cultures are maintained in cylindrical culture dishes; therefore, swelling is not associated with any changes in the diameter of the air–ASL interface.) In contrast, after vigorous washing with DTT-containing PBS, followed by addition of 20 μl PBS alone, the oil droplet no longer remained as a cohesive droplet on the surface of the culture and, instead, spread over the entire surface (n = 3). It is likely that the surface tension after prolonged washing was close to that of saline (70 mN/m), since oil droplets behaved in the same fashion when deposited on blank, saline-filled T-cols (n = 4).
Figure 1.

In vitro measurement of surface tension. (ai) Photomicrograph of a dimethylphthalate/octanol oil droplet suspended from a syringe above a culture. (aii) The same droplet deposited onto a culture. (bi and bii) Persistence of an electron-dense line at the air–liquid interface of OsO4/PFC-fixed cultures examined by TEM before and after washing with detergent (DTT). Bars: (a) 1 mm; (b) 0.6 μm.
An electron-dense line previously has been observed under TEM after OsO4/PFC fixation, which has been speculated to be a surfactant-like layer (Sims and Horne 1997). This electron-dense line persisted after DTT treatment and washing to remove mucus. Because this treatment increased T to levels typical of saline, this line may not represent a surface tension–reducing layer (Fig. 1 bii).
Investigation of Putative ASL Surface Forces Generated by Outstretched Cilia
As noted above, it has been suggested by Widdicombe 1997 that ASL interacts with outstretched cilia to affect ASL volume/composition. In the simplest terms, the prediction of the compositional hypothesis is that sufficient P (∼3,800 cm H2O) will be developed in the ASL by contact with the circumference of outstretched cilia to maintain liquid (volume) on airway surfaces against large [NaCl] gradients from the ASL (50 mM NaCl) to the interstitium (150 mM NaCl). We set up our system to test this hypothesis with two different strategies to measure the relationship between outstretched cilia and ASL height/volume.
The first strategy was to remove by aspiration sufficient ASL to deplete the periciliary liquid (<3 μm) so that cilia were no longer upright. The volume (height) of the 3-μm ASL was “instantly” increased by addition of isotonic solutions (PBS) or H2O designed to raise ASL height above that of outstretched cilia (∼7 μm). The resultant heights of ASL were measured serially by XZ-confocal microscopy or, after OsO4/PFC fixation, by TEM. If ASL height were determined by the length of outstretched cilia (∼7 μm), both volume additions should result in a final ASL height ≥7 μm. Conversely, if the epithelium were water permeable and ASL isotonic, ASL height would be determined by the mass of salt on the epithelial surface rather than by ciliary height. Thus, water added alone (i.e., without NaCl) would rapidly be absorbed and ASL height would return to preaddition values (∼3 μm), whereas addition of isotonic solution (salt and water) would lead to prolonged increases in ASL height that would be independent of ciliary height (i.e., >7 μm).
Fig. 2 a shows confocal images obtained either 10 s or 10 min after addition of either isotonic solution (PBS; 150 mM NaCl) or H2O to the mucosal surface of ASL-depleted cultures. The ASL [Cl−], measured with double-barreled Cl−-selective microelectrodes, became isotonic within 10 min after addition of both test liquids (isotonic addition, 124.2 ± 6.6, n = 5; H2O addition, 128.0 ± 3.7 mM, n = 6), indicating that a steady state had been reached. The mean confocal data show that the ASL height was >7 μm after isotonic liquid addition. In contrast, ASL height rapidly, without any discontinuity at 7-μm height, returned to a value close to 3 μm after H2O addition (Fig. 2 c). The data in Fig. 2 c were best fit with biexponential functions (r2 = 0.99 and 1.00 for isotonic and H2O additions, respectively), which reflects the initial distribution of the bolus of liquid over the mucosal surfaces as well as the transepithelial movement of water. The TEM micrographs (Fig. 2 b) indicated that cilia were upright under isotonic conditions and bent over (as in baseline) after application of H2O. Collectively, these data suggest that any force generated by cilia–ASL contact is small and not a major determinant of ASL height, but rather, ASL height is largely determined by the mass of NaCl (i.e., volume of isotonic solution) on the airway surface.
Figure 2.


Is ASL volume/composition determined by interactions between ASL/cilia or by the ASL salt mass? (a) Representative confocal images of ASL (red) after addition of 30 μl of either isotonic (300 mOsm) PBS or H2O. (b) Electron micrographs of airway epithelia fixed with OsO4/PFC 10 min after mucosal application of isotonic (300 mOsm) liquid or H2O, respectively. (c) Plots of average ASL height over time taken from a. Isotonic (circles); H2O (triangles), n = 5 and 6, respectively. (d) Plot of ASL height at steady state (10 min) after increases in serosal liquid tonicity from 300 to 1,500 mOsm (and after a return to 300 mOsm at the end of the experiment). (Squares, experimental data; n = 4; circles, predicted data from law of mass conservation.) Data shown as mean ± SEM. (*) Height significantly different from t = 0 (P < 0.05). (#) Height significantly different between groups (P < 0.05).
It is possible that the addition of volume to the mucosal surface could have disturbed the ASL in such a way as to negate possible surface forces or that H2O “paralyzed” cilia. Hence, as a second strategy to investigate the role of ciliary height in controlling ASL volume, we removed liquid from the ASL by forces generated in the serosal compartment. Consequently, we varied the serosal osmolarity of cultures that had an ASL that was undisturbed for 24 h. Based on the average measured ASL starting height of 16.9 μm, we added an osmolyte (raffinose) to the serosal bath and predicted the new ASL height using the law of mass conservation (C1 × H1 = C2 × H2, where C1 and H1 are the starting ASL [NaCl] and height, respectively, and C2 and H2 are the steady-state ASL [NaCl] and height, respectively; Fig. 2 d, dotted line). The measured decrease in ASL height in response to serosal osmolality within each experiment was monitored. The mean responses for each osmotic, serosal bath exchange fitted closely to the predicted values (Fig. 2 d, solid line), suggesting that surface forces did not contribute to maintaining ASL volume/composition. Importantly, after increasing the serosal osmolarity above 600 mOsm, the ASL height was reduced to a value below that of outstretched cilia, arguing again that ciliary height does not influence ASL height/volume.
Contribution of Mucus to ASL Volume/Composition
Mucus is present on airway epithelial surfaces in vivo (Sims and Horne 1997), and it is important to test its contribution to ASL composition. It has been proposed that the negatively charged residues on mucin macromolecules may contribute to the formation of a Donnan equilibrium between the mucus layer and the nonmucin-containing PCL (Zabner et al. 1998), which could serve to lower the PCL [Cl−] (see discussion).
To test this hypothesis, we compared ion compositions in mucus and PCL from cultures after addition of 200 μl of PBS to the mucosal surface of airway epithelia grown on 24-mm T-Cols (Fig. 3 a). We took advantage of time-dependent “differentiation” of ASL, where mucus accumulates in the center of the cultures, to measure separately the composition of the liquid in the PCL and mucus layers. We made these measurements at both an early time point where mucus/PCL had “recently” differentiated (12 h) and a later time point (36 h) to confirm that any putative Donnan equilibria were not disturbed by the initial PBS addition. The mucus layer was harvested from the central portion of the culture with forceps, and the PCL was sampled from the meniscus at the culture–T-Col interface. (Note that if there was mucus in this region, it could not be collected in the micropipette.) As a part of these studies, we included tests of the accuracy of our measurements of mucus layer ionic composition. Thus, to evaluate whether harvesting mucus with forceps and ultracentrifugation perturbed our estimates of mucus layer [Cl−], we compared (1) [Cl−] measured with microelectrodes in the mucus layer in situ; (2) chemical analyses of the mucus layer harvested with forceps; and (3) with chemical analyses of ultracentrifuge-generated supernatant obtained from mucus harvested by forceps. The [Cl−] was not significantly different (P > 0.5) for (1) the mucus layer measured in situ (145.0 ± 6.6 mM, for 12 h; 150.0 ± 4.9 mM, for 36 h; n = 9 and 7); (2) intact mucus harvested with forceps (133.1 ± 5.0 mM, for 12 h; 127.8 ± 8.0 mM, for 36 h; both n = 5); or (3) the supernatant samples (144.8 ± 10.5 mM, for 12 h; 140.3 ± 7.9 mM, for 36 h; both n = 5). Finally, the Cl− concentrations measured by both microelectrode and chemical analyses of the supernatant ultracentrifuged from mucus were isotonic (∼130 mM) and not different from one another.
Figure 3.
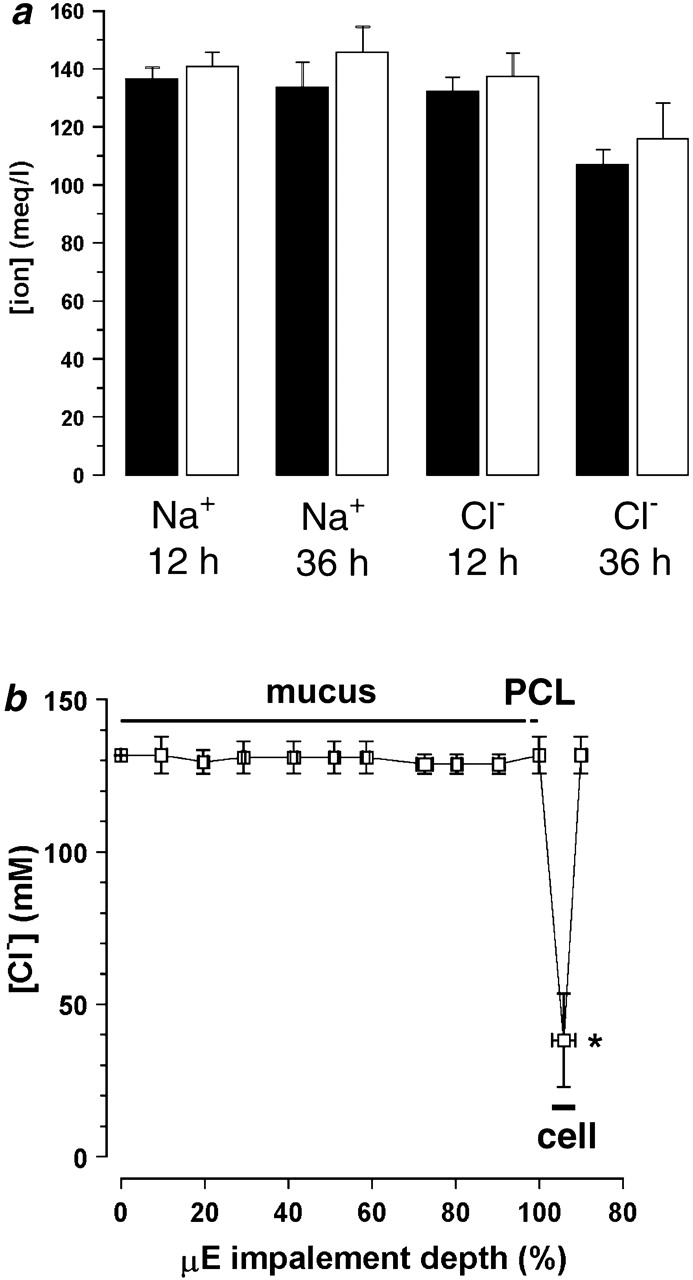
Ionic composition of mucus layer and PCL: search for Donnan effects. (a) Electrolyte composition obtained by chemical analysis after microsampling of PCL and mucus supernatant (PCL, 12 h, n = 10; PCL, 36 h, n = 9; mucus layer, 12 h, n = 9; mucus layer, 36 h, n = 6). Black bars, PCL; white bars, mucus layer. (b) Impalement of ASL with double-barreled Cl−-selective microelectrodes. The average height of the mucus was 120 ± 12 μm (n = 3). Epithelial impalement is shown as a sudden reduction in [Cl−] that is followed by an increase in [Cl−] once the microelectrode is returned to the ASL. (*) Data significantly different (P < 0.05) from ASL [Cl−].
Having tested the accuracy of the sampling techniques, we compared the ionic composition of the mucus layer (after ultracentrifugation) and the PCL. No significant differences in either [Na+] or [Cl−] were detected between PCL and mucus layer supernatant, as measured by chemical methods (Fig. 3 a), which is consistent with an absence of significant Donnan forces affecting either cation or anion concentrations in PCL.
As a second approach to search for possible mucin-Donnan effects on ASL composition, we mapped the [Cl−] in the mucus layer and PCL on culture surfaces in situ with Cl−-selective microelectrodes. The microelectrode was advanced through the ASL in cultures with rotational mucus transport, which reflected the functional presence of both a mucus layer and 7 μm PCL. We found that the [Cl−] was constant throughout the mucus layer (∼130 mM), was not different in PCL (∼130 mM), and only changed after the epithelium was impaled, at which point, the [Cl−] decreased to 37 mM, close to values previously reported for intracellular Cl− (Fig. 3 b; Willumsen et al. 1989). Thus, this technique also detected no significant Donnan effect on ASL [Cl−].
Are Significant Concentrations of Nonionic Osmoles Present in ASL?
Mucus is composed of large mucin glycoproteins, whose molecular weights are estimated at several hundred to several thousand kilodaltons or greater (Bansil et al. 1995). This feature makes them too large to be osmotically active at their concentration (2%) in ASL. Therefore, we searched for other “unidentified” (i.e., nonionic) osmoles by directly measuring ASL osmolality and ion composition in mucus samples that were ultracentrifuged and aliquoted for measurements of osmolality and ionic composition. Osmolarity (305 ± 4.4 and 320 ± 11.0 mOsm/liter at 12 and 36 h, respectively; Fig. 4) was found to be similar to the serosal media (307.2 ± 1.8 mOsm) and was not significantly different at either time point. The estimated total [ion] was ∼25 mOsm/liter lower than the osmolarity (range, from 274.7 ± 8.3 to 298 ± 18.9 mM; Fig. 4), suggesting that additional osmoles (i.e., glucose or amino acids) are present, but their concentrations are almost an order of magnitude below that required (∼200 mOsm/liter) to contribute to the maintenance of a low salt (<50 mM NaCl) ASL suitable for activation of defensins.
Figure 4.

Analysis of osmolytes in ASL: comparison of the sum of 2([Na+] × [K+]) and osmolarity (PCL, 12 h, n = 10; PCL, 36 h, n = 9; mucus layer, 12 h, n = 9; mucus layer, 36 h, n = 8). Black bars, 2 [Na+ + K+]; white bars, osmolarity. At 12 h, [Na+] was (in mM) 136.3 ± 4.1 and 140.6 ± 5.1 in mucus and PCL, respectively; and [K+] was (in mM) 1.1 ± 0.2 and 2.1 ± 0.4 in mucus and PCL, respectively. At 36 h, [Na+] was (in mM) 133.4 ± 8.9 and 145.5 ± 8.9 in mucus and PCL, respectively; and [K+] was 1.8 ± 0.4 and 4.0 ± 0.6 (in mM) in mucus and PCL, respectively. Data shown as mean ± SEM.
Active Ion Transport as a Regulator of ASL Volume
Since we found no role for passive surface forces in the regulation of ASL composition, we investigated the possibility that active ion transport modulates ASL volume by regulating the mass of salt on airway surfaces. Transcellular Na+ absorption is the dominant active ion transport process in proximal airway epithelia (with Cl− moving paracellularly as the counter ion; Boucher 1999), and we have shown previously that our cultures actively absorb both Na+ and ASL over time (Matsui et al. 1998a). For the present studies, basal bioelectric properties and responses to inhibitors were measured, after which the cultures were washed, residual liquid aspirated, and a small volume (20 μl PBS) was added to produce a thin film (∼20 μm) of ASL on the culture surface (Fig. 5). These experiments were initially performed in cultures that did not exhibit rotational mucus transport. We followed ASL volume with time by confocal microscopy and measured the transepithelial electric potential difference (Vt) as a bioelectric correlate of active ion transport. Strikingly, we found a rapid phase of ASL absorption (0 → 12 h) followed by slowed/absent absorption at about the height of the PCL over the next 36 h (Fig. 5, a and b).
Figure 5.

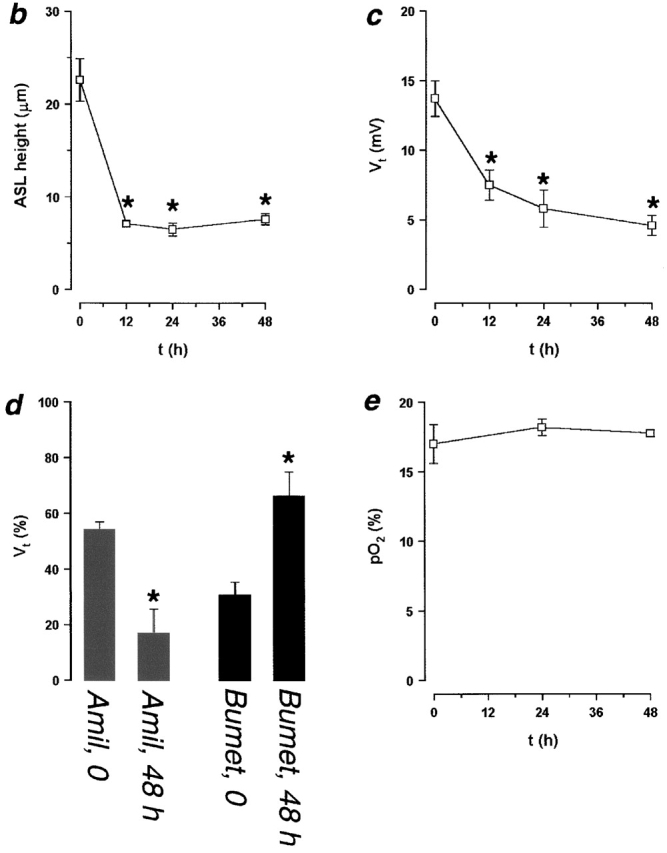
ASL absorption (height) and epithelial bioelectric properties with time. (a) Representative confocal images of ASL (red) 0, 12, and 48 h after mucosal addition of 20 μl PBS. (b and c) Plots of ASL height and transepithelial electric potential difference (Vt), respectively, over 48 h (n = 8). (d) Bar graph depicting percent changes in amiloride- and bumetanide-sensitive Vt immediately before PBS volume addition and 48 h afterwards. (e) Plot of ASL PO2 over 48 h (n = 4). (*) Data significantly different (P < 0.05) from t = 0. Data shown as mean ± SEM.
To investigate the mechanism(s) by which volume absorption was regulated, we measured basal Vt and its amiloride- and bumetanide-sensitive components as indices of transepithelial Na+ and Cl− transport, respectively, at 0 and 48 h. Vt exhibited an initial value of −13.7 mV, similar to in vivo (Knowles et al. 1981), that fell over time to −4.6 mV (Fig. 5 c; P < 0.05). This decline primarily reflected a reduction in the amiloride-sensitive Vt, which decreased by ∼7 mV (P < 0.05). The bumetanide-sensitive Vt also exhibited a small decline (∼1 mV; P < 0.05). Proportionally, at t = 0, the amiloride-sensitive Vt accounted for 54% of the total Vt, and this percent significantly decreased to 17% of the total Vt at 48 h (Fig. 5 d). Conversely, the bumetanide-sensitive Vt accounted for only 31% of total Vt at t = 0 and significantly increased to 66% of total Vt at t = 48 h. These data suggest that Na+ absorption was downregulated, whereas Cl− secretion became predominant with time (Fig. 5 d).
The mechanism by which normal epithelia regulate volume absorption via inhibition of Na+ transport is not yet clear. O2 diffusion through liquids covering epithelia has been shown to regulate ion transport, but this variable might be predicted to be in the opposite direction to our findings, i.e., shallower depths would be predicted to be associated with higher ASL PO2s (Johnson et al. 1993). However, to directly assess this variable, PO2 was measured at 0, 24, and 48 h using O2–selective microelectrodes and was not significantly different between these times (19.3 ± 1.0%, 18.7 ± 0.4%, 18.1 ± 0.3%, respectively; Fig. 5 e; n = 4; P = 0.62), suggesting that ΔPO2 is not related to the observed changes in Vt.
Relationship between Mucus and Active Ion Transport
We have extended the studies of ASL volume regulation by ion transport to cultures that contained a mucus layer and exhibited rotational mucus transport. Cultures were studied relatively soon after accumulation of mucus on the center of the cultures (∼3 d after last wash). Under these conditions, mucus (labeled with beads) was transported rotationally, and in the center of the culture (∼25% of the total surface area), exhibited a height similar to mucus in vivo (Rahmoune and Shephard 1995; Sims and Horne 1997). We added a larger volume (50 μl PBS) at t = 0 to ensure full hydration of the mucus layer. Fig. 6 a shows representative images of ASL (red) and mucus (green) at t = 12 and 48 h. Unlike the experiments detailed in Fig. 5, which were performed under relatively mucus-free conditions, mucus can clearly be seen above the PCL (as indicated by the binding of beads). ASL height in the presence of a mucus layer was significantly higher after 50 μl PBS than ASL height after the same volume of added PBS under relatively mucus-free conditions (ASL height was 31.4 ± 5.1 μm under mucus-free conditions, n = 6; see Fig. 6 b, P < 0.05), suggesting that the mucus layer swelled in response to volume addition.
Figure 6.

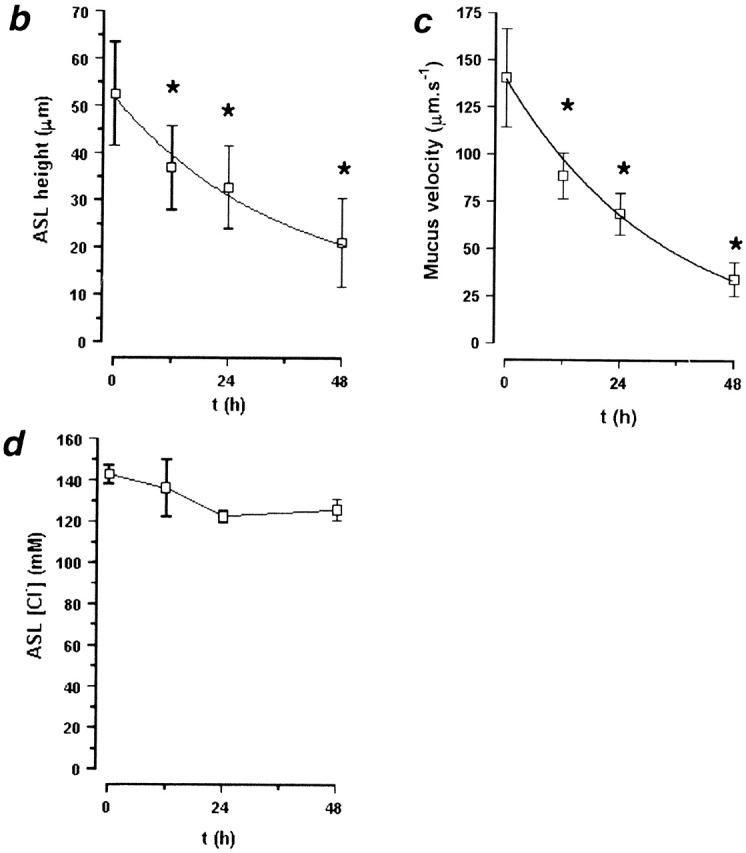
Active ion transport can modify ASL height over time in the presence of a mucus layer. (a) Representative confocal images of ASL (red) and mucus (green beads) 12 and 48 h after addition of 50 μl PBS. (b–d) Plots of ASL height, ASL [Cl−], and mucus velocity, respectively, over time (n = 6). (*) Data significantly different (P < 0.05) from t = 0. Data shown as mean ± SEM.
Fig. 6 b plots ASL height over time. As compared with mucus-free cultures (Fig. 5 b), there is a more gradual decline in ASL height over this period. However, it is clear that as ASL height diminishes, volume absorption is downregulated. The ASL [Cl−] was measured over this time, and remained constant throughout (∼130 mM; Fig. 6 d), suggesting that ASL volume absorption was isotonic. Interestingly, confocal images indicated that the PCL was preserved over time (measured as the microsphere–free zone under the mucus “hurricane”; for 0 h, 7.9 ± 2.4 μm; for 48 h, 9.5 ± 2.0 μm), suggesting that the decrease in ASL height occurred in the mucus layer and that this layer “donated” liquid to maintain PCL height (see next section). Rotational mucus transport did slow during this period (Fig. 6 c), suggesting that the properties of the PCL (e.g., viscoelasticity) could be changing with time.
Contribution of Mucus to ASL Volume Homeostasis
The data described above suggest that mucus does not regulate ASL ionic composition (Fig. 3), but indicate that it may act as a reservoir for liquid, in series with ion transport regulation of ASL volume. For example, in the experiments detailed in the previous section, isotonic volume addition to the ASL caused the mucus gel to swell, while maintaining a constant PCL height and rotational mucus transport. In contrast, absorption of ASL by active ion transport concentrated the mucus gel while still preserving PCL height (Fig. 6). To investigate the interrelationships between mucus layer volume (height), PCL height, and mucus transport over acute time intervals, we perturbed ASL volume by varying serosal tonicities (osmolalities). Changes in height of the mucus layer were recorded by measuring mucus layer height at a preselected central site and PCL height was measured at four predetermined circumferential sites with XZ-confocal scanning microscopy.
Fig. 7 ai shows confocal images of mucus and PCL regions under isotonic, hypertonic, and hypotonic serosal conditions. It can clearly be seen that the mucus layer in this region shrank or swelled in response to the anistonic serosal challenge (Fig. 7 ai). Interestingly, the mucus free-zone (i.e., PCL) did not respond to changes in serosal tonicity (Fig. 7 aii). Average data from these experiments describing the heights of the mucus layer and PCL are shown in Fig. 7 c. In a parallel set of experiments, we measured rotational mucus transport velocity (from the movement of 1-μm beads) as a function of serosal bath osmolality (Fig. 7b and Fig. d). There was a correlation between mucus height and mucus rotational velocity, with rotational velocity increasing as a function of height (Fig. 7c and Fig. d).
Figure 7.


Mucus as a liquid reservoir. (a) Representative confocal images of ASL (red) and green fluorescent beads (which discontinually associate with mucus) after anisotonic media changes in the basolateral bath. (ai) Central, mucus-containing regions. (aii) Peripheral regions without mucus (bead-free). Basolateral bath conditions: isotonic (300 mOsm); hypertonic (600 mOsm); hypotonic (200 mOsm). (b) Photographs of rotational mucus transport after basolateral media changes, as indicated by 5-s exposure streaks of fluorescent microsphere movements. (c) Mean data from protocols shown in a (n = 5). White bars, mucus-containing regions; black bars, regions without mucus. (d) Mean data from b of mucus velocities obtained 1 mm from the center of rotation after serosal media changes. iso (white bars); hyper (gray bars); hypo (black bars); all n = 5. (e) Percent solids obtained from wet/dry ratios of mucus samples from airway cultures after serosal media changes. iso, n = 5 (white bars); hyper, n = 8 (gray bars); hypo, n = 8 (black bars). (*) Data significantly different (P < 0.05) from isotonic values. Data shown as mean ± SEM.
Finally, we removed the mucus with forceps from cultures following similar anisotonic serosal media changes and measured the wet/dry ratios to obtain the percent solids, as an index of the concentration of mucins in the mucus layer (Fig. 7 e). The percent solids increased or decreased in the presence of hypertonic or hypotonic serosal solutions, respectively, confirming that the liquid content of the mucus paralleled changes in mucus height and velocity. These findings suggest that liquid is being donated from the mucus layer to the PCL and vice versa in a spongelike fashion, i.e., the mucus layer acts as a liquid reservoir for the PCL.
DISCUSSION
The ASL consists of two compartments: (1) the periciliary liquid layer, and (2) the mucus layer. The PCL consists principally of salt and water, whereas the mucus layer is predominantly water (∼97%) and salt (0.9%) contained in high molecular weight mucin glycoconjugate–based gel (∼2%). A third, surface tension reducing layer may also be present at the most exterior portion of the ASL at the air–liquid interface (Sims and Horne 1997). Using cultures that mimic the morphology of proximal airways and exhibit ASL [NaCl] (∼130 mM) similar to data from in vivo sampling (Hull et al. 1998; Knowles et al. 1997), we have measured physical properties of these layers by a series of complementary techniques to test the opposing hypotheses that ASL is regulated either by passive surface forces or by active ion transport, and to further understand the relationship between ASL and airway epithelial function.
Absence of a Role of Surface Tension and Extended Cilia in Regulating ASL Height
With respect to a role for “surface forces” in maintenance of ASL composition, normal airway epithelia have been postulated to maintain a low salt ASL across a water-permeable epithelia by virtue of the hydrostatic pressure (P) generated by the large contact surface between ASL surrounding outstretched cilia (Widdicombe and Widdicombe 1995; Zabner et al. 1998). To calculate P, the increased contact surface was calculated based on the radius of a cilium being 680 nm and a ciliary density of 108 cm−2. Other assumptions included a model with upright cilia, a 90° contact angle between cilia and ASL, and surface tension (T) ∼25 mN/m (Widdicombe 1997). It is not obvious that this model fits living airway epithelia. For example, cilia spend the majority of their beat cycle (∼80%) in a bent-over position, with the dynamic power stroke (upright position) occupying the smaller portion (20%) of the cycle (Sanderson and Sleigh 1981), so mathematically the assumption of the upright position is likely to describe ciliary behavior poorly. Also contrary to this theory is the observation that, in living epithelia, mucus frequently covers ciliary tips (Sims and Horne 1997; Matsui et al. 1998a,Matsui et al. 1998b). However, because of the importance of this issue, we measured T and the effects of outstretched cilia on ASL volume.
To measure T, we observed the spreading behavior of oil droplets deposited on culture surfaces. Deposited test droplets spread in a fashion consistent with the T on our culture surfaces being ∼34 mN/m, a value similar to that reported for the proximal airways of the nonanesthetized horse in vivo (32 mN/m; Im Hof et al. 1997). The T of saline is 70 mN/m, suggesting that a surface tension–reducing film has been generated at the air–liquid interface of our cultures, which would reduce the magnitude of the P generated at the air–liquid interface.
We are currently unaware of the molecular identity of the surface-active molecules present on airway surfaces. We (Fig. 1 b) and others (Sims and Horne 1997) have noted the presence of an electron-dense line at the air-liquid interface of electromicrographs, which has been proposed to be a surfactant-like lipid layer (Sims and Horne 1997). However, we found that washing mucus from the cultures with the aid of a reducing agent (DTT), which should not remove surfactant, increased surface tension but did not remove this electron-dense line. Therefore, it is unlikely that this electron-dense line is a surface tension–reducing layer. Phospholipids, which are the primary constituents of surfactant (Wright 1997), have been found bound to mucus from sputum samples (Zahm et al. 1998), raising the possibility that the mucus layer itself contributes to the reduced surface tension.
If ciliary height can influence ASL height then the ASL height/absorption relationship will be discontinuous, with a second rate (which could be zero) occurring when the ratio of ASL and ciliary height approaches unity. We tested this relationship experimentally both directly (by adding volumes with different salt concentrations to the airway surfaces) and indirectly (by varying the serosal osmolality) and assessing whether ciliary height, or the mass of salt on airway surfaces, determined ASL height/volume. The confocal microscopy data revealed that ASL height (volume)/absorption relationship was continuous from the initial heights (>20 μm) through the 7-μm height of outstretched cilia to the initial 3-μm height for the H2O group (Fig. 2). In contrast, the height remained well above that of cilia when isotonic solutions were added. These confocal data were confirmed at the TEM level, using the OsO4/PFC fixation technique to visualize ASL (Fig. 2). These data clearly demonstrate that ciliary height does not determine ASL height/volume. Note that the minimum ASL height we recorded was ∼3 μm. It is possible that the “bent-over” cilia generated sufficient T to prevent their desiccation, as has been suggested previously (Widdicombe 1997). Alternatively, the 3-μm discontinuity may be due to “densely packed” cilia filling all the space available, as indicated by Fig. 2 b.
In sum, there is no evidence that outstretched cilia are effective in generating the ∼3,800-cm H2O P required to offset the osmotic gradient between a putative 50-mM [NaCl] ASL and the 150-mM [NaCl] of the interstitium to maintain ASL height/volume. Rather, it is the mass of salt on culture surfaces that determines ASL height/volume. Further, although T is in the range proposed by Widdicombe 1997, it is unlikely that it contributes significantly to P generation, as the relevant “r” in the model is likely that of the airway lumen rather than ciliary radius. Indeed, we speculate, as others have before us (Macklem et al. 1970), that the lower T is important for maintaining airway stability in bronchioles with small lumens (r).
Role of Mucus Layer in Regulating PCL Ion Composition
The possibility has been raised that mucus may act to reduce PCL [Cl−] by exerting a Donnan effect between mucus and PCL (Zabner et al. 1998). However, the quantity of fixed negative charge present in mucus is probably inadequate to set up a significant Donnan equilibrium. Davril et al. 1999 calculated that the quantity of fixed negative charges on mucins from normal subjects (sialic acid and sulfate) was 7% of the total weight of the mucus. From our data, the mucus layer under isotonic conditions consisted of 2–4% mucin macromolecules (estimated from solids content), so the concentration of negatively charged residues was 8–16 mM. Assuming that [Cl−]mucus was ∼125 mM and that [Na+]mucus was 140 mM (Fig. 3 and Fig. 4), it would be predicted that since the concentration of mobile ions (charge) exceeds that of fixed charge, Donnan effects are saturated and predicted to be irrelevant. Combining a number of techniques, including microsampling, ultracentrifugation, Cl−-selective microelectrodes, and chemical measurements, we were experimentally unable to detect significant differences in [Cl−] (or [Na+]) between mucus and PCL harvested from these cultures, which bears out these predictions (Fig. 3 a). Similarly, using Cl−-selective microelectrodes to measure [Cl−] in intact mucus/PCL covering cultures, we found no significant Cl− gradient through the mucus and also found no difference in Cl− activity between mucus and PCL, suggesting that airway epithelial mucus does not play a role in modifying PCL [Cl−] (Fig. 3 b).
Contribution of Measured Ions to Measured Osmolality
Cl−-selective microelectrodes have been previously used to probe ASL Cl− activity and have revealed that [Cl−] was approximately one half of measured osmolarity (Johnson et al. 1993). Na+-selective microelectrodes also have been used with similar results (John-son et al., 1993; Rahmoune and Shephard 1995). Matsui et al. 1998a, using different culture and microsampling techniques, also suggested that monovalent ions contributed the majority of measured osmoles in ASL. This result was not surprising, because the other main constituent (by weight) of ASL, mucin macromolecules, are of high molecular weight, and their contribution to ASL molarity is very low (< 0.1 mOsm/liter). However, because of the importance of this issue, we directly compared the ionic and osmolar concentrations in both the mucus layer and the PCL. We also found that the osmolarities of both mucus and PCL were isotonic with respect to plasma, and that twice [Na+ + K+] approximated the measured osmolarity, suggesting that there were insufficient unidentified osmotic materials to permit ASL [NaCl] to be normally 50 mM or less. Similar data have been reported from in vivo studies (Knowles et al. 1997; Hull et al. 1998).
Role of Active Transepithelial Ion Transport in ASL Volume Regulation
In contrast to passive forces, we found that active transepithelial ion transport did regulate ASL volume by regulating the mass of salt (and water) on airway surfaces. Evidence for regulation of ASL volume was provided when we measured the ASL height and Vt over time (Fig. 5). In experiments starting with relatively thin film conditions (20 μm) and removing mucus for simplicity, ASL height rapidly declined over the first 12-h period to approximate the PCL height, and then it remained relatively constant over the remaining 36 h. Vt also decreased markedly within the first 12 h, and then more slowly through the remainder of the experiment. The decline in Vt reflected predominantly a reduction of the amiloride-sensitive PD component, indicating a reduction in the rate of Na+ absorption.
In contrast, the bumetanide-sensitive component of Vt became predominant with time. Cl− secretion by human airway epithelia is not large under basal conditions since Cl− is close to its electrochemical gradient across the apical membrane (Willumsen et al. 1989). In vitro, Cl− secretion has been generated either by providing a low Cl− mucosal solution or by hyperpolarizing the apical membrane with amiloride to inhibit the apical Na+ conductance (Willumsen et al. 1989). The relative increase in bumetanide sensitivity of Vt in our experiments, as compared with the larger decrease amiloride-sensitive Vt, likely reflects the endogenous inhibition of the apical Na+ channel in response to ASL volume depletion. Thus, normal airway epithelia may maintain ASL volume by two electrically interconnected mechanisms: Na+ absorption is slowed by decreasing the apical Na+ permeability and this response also generates a favorable electrical gradient to initiate Cl− secretion.
Active Ion Transport Regulation of ASL Volume in Mucus-transporting Cultures
We then examined volume absorption over 48 h in cultures that exhibited rotational mucus transport. Unlike the previous experiment where little mucus was present, these cultures exhibited visible amounts of mucus and rotational mucus transport. Indeed, the decrease in ASL height over time was more gradual than in the mucus-free cultures, suggesting that although the rate of volume absorption was again downregulated, the rate was affected by the presence of a mucus layer. The total height (volume) of liquid absorbed (∼25 μm) exceeded the height of the PCL (7 μm), suggesting that, with absorption, liquid is being donated from the mucus layer to the PCL. This notion was confirmed by the capacity to identify a discrete PCL by confocal microscopy throughout the 48-h observation period. We did note that mucus transport rates slowed during volume absorption, implying an increase in PCL viscosity/change in ciliary beating that will need to be studied in the future. However, these data strongly suggest that even in the absence of replenishment of liquid on culture surfaces that reflects the cephalad movement of ASL (both mucus and PCL layers) in vivo, the combination of regulation of volume absorption by the epithelium and the capability of the mucus layer to donate liquid to the PCL can maintain mucus transport in normal cultures for long periods relative to CF cultures in vitro (Matsui et al. 1998a).
The Mucus Layer as a Liquid Reservoir for the PCL
Kilburn 1968 postulated that mucus may act as a liquid reservoir. By changing the serosal osmolarity, we were able to expand or contract ASL on the apical surface. We observed that the mucus layer shrank and swelled in response to changes in the total ASL volume but always maintained contact with the tips of the cilia (Fig. 7). Similarly, addition of 50 μl of PBS caused the mucus gel to swell but remain in contact with the cilia (Fig. 6). These data indicate that the mucus layer acts as a reservoir to accept or donate liquid from the PCL. This reservoir effect could reflect a “low-energy” compensatory mechanism that supplements PCL regulation by epithelial ion transport under normal physiological conditions.
Interestingly, shrinking or swelling of the mucus layer affected the rate at which mucus was transported (Fig. 7). These observations may have relevance to the pathophysiology of two conditions. Pseudohypoaldosterone patients, who exhibit loss-of-function mutations in ENaC, have an excess of ASL due to reduced Na+ absorption (Kerem et al. 1999). Despite an excess of ASL, mucus transport in this group of patients is not only preserved, but dramatically increased, which is consistent with the acceleration of mucus transport with added ASL volume we observed in vitro (Fig. 7 c). Conversely, in CF, excessive ASL absorption results in impaction of mucus onto airway surfaces, which drastically impairs mucus clearance. We have recently reported that the percent solids in CF mucus increases with time (Tarran et al. 2001). Based on these data, and our current observations on the reservoir effect of mucus, it is probable that the mucus layer in CF becomes depleted of volume first, and after yielding the maximum liquid, depletion of the PCL follows.
Conclusions
In conclusion, our study finds no evidence that passive surface forces, nor additional, nonionic osmoles generate or maintain a normal volume of ASL of low salt (<50 mM) composition on airway surfaces. Instead, we find evidence that isotonic, active ion transport regulates the volume of an isotonic ASL. We present evidence that feedback exists between the ASL volume and epithelial ion transport rates, and we demonstrate that mucus may act as a reservoir that can accept or donate liquid from the PCL. Identification of the mechanism that signals the epithelium to adjust ASL volume is the next step in elucidating the complex interplay that exists among mucus, PCL, and epithelial function to maintain the mucus transport vital for maintenance of airways defense.
Acknowledgments
We thank Dr. W.G. Matthews for critical reading of this manuscript and gratefully acknowledge the technical assistance of T. Bartolotta, K. Burns, J. Chadburn, D. Gillie, N. Matkins, and D. Walstad.
This study was supported by the National Institutes of Health HL42384 and HL34322 (both to R.C. Boucher), and by CFF R026 (to R.C. Boucher and R. Tarran).
Footnotes
Abbreviations used in this paper: ASL, airway surface liquid; CF, cystic fibrosis; PCL, periciliary liquid layer; PFC, perfluorocarbon.
References
- Bansil R., Stanley E., LaMont J.T. Mucin biophysics. Annu. Rev. Physiol. 1995;57:635–657. doi: 10.1146/annurev.ph.57.030195.003223. [DOI] [PubMed] [Google Scholar]
- Boucher R.C. Molecular insights into the physiology of the ‘thin film’ of airway surface liquid. J. Physiol. 1999;516:631–638. doi: 10.1111/j.1469-7793.1999.0631u.x. [DOI] [PMC free article] [PubMed] [Google Scholar]
- Carson J.L., Collier A.M., Knowles M.R., Boucher R.C., Rose J.G. Morphometric aspects of ciliary distribution and ciliogenesis in human nasal epithelium. Proc. Natl. Acad. Sci. USA. 1981;78:6996–6999. doi: 10.1073/pnas.78.11.6996. [DOI] [PMC free article] [PubMed] [Google Scholar]
- Davril M., Degroote S., Humbert P., Galabert C., Dumur V., Lafitte J.J., Lamblin G., Roussel P. The sialylation of bronchial mucins secreted by patients suffering from cystic fibrosis or from chronic bronchitis is related to the severity of airway infection. Glycobiology. 1999;9:311–321. doi: 10.1093/glycob/9.3.311. [DOI] [PubMed] [Google Scholar]
- Goldman M.J., Anderson G.M., Stolzenberg E.D., Kari U.P., Zasloff M., Wilson J.M. Human beta-defensin-1 is a salt-sensitive antibiotic that is inactivated in cystic fibrosis. Cell. 1997;88:553–560. doi: 10.1016/s0092-8674(00)81895-4. [DOI] [PubMed] [Google Scholar]
- Guggino W.B. Cystic fibrosis and the salt controversy. Cell. 1999;96:607–610. doi: 10.1016/s0092-8674(00)80570-x. [DOI] [PubMed] [Google Scholar]
- Hull J., Skinner W., Robertson C., Phelan P. Elemental content of airway surface liquid from infants with cystic fibrosis. Am. J. Respir. Crit. Care Med. 1998;157:10–14. doi: 10.1164/ajrccm.157.1.9703045. [DOI] [PubMed] [Google Scholar]
- Im Hof V., Gehr P., Gerber V., Lee M.M., Schurch S. In vivo determination of surface tension in the horse trachea and in vitro model studies. Respir. Physiol. 1997;109:81–93. doi: 10.1016/s0034-5687(97)84032-7. [DOI] [PubMed] [Google Scholar]
- Johnson L.G., Dickman K.G., Moore K.L., Mandel L.J., Boucher R.C. Enhanced Na+ transport in air-liquid interface culture system. Am. J. Physiol. 1993;264:L560–L565. doi: 10.1152/ajplung.1993.264.6.L560. [DOI] [PubMed] [Google Scholar]
- Kerem E., Bistritzer T., Hanukoglu A., Hofmann T., Zhou Z., Bennett W., MacLaughlin E., Barker P., Nash M., Quittell L. Pulmonary epithelial sodium channel dysfunction and excess airway liquid in pseudohypoaldosteronism. N. Engl. J. Med. 1999;341:156–162. doi: 10.1056/NEJM199907153410304. [DOI] [PubMed] [Google Scholar]
- Kilburn K.H. A hypothesis for pulmonary clearance and its implications. Am. Rev. Respir. Dis. 1968;98:449–463. doi: 10.1164/arrd.1968.98.3.449. [DOI] [PubMed] [Google Scholar]
- Knowles M.R., Carson J.L., Collier A.M., Gatzy J.T., Boucher R.C. Measurements of nasal transepithelial electric potential differences in normal human subjects in vivo. Am. Rev. Respir. Dis. 1981;124:484–490. doi: 10.1164/arrd.1981.124.4.484. [DOI] [PubMed] [Google Scholar]
- Knowles M.R., Robinson J.M., Wood R.E., Pue C.A., Mentz W.M., Wager G.C., Gatzy J.T., Boucher R.C. Ion composition of airway surface liquid of patients with cystic fibrosis as compared to normal and disease-control subjects. J. Clin. Invest. 1997;100:2588–2595. doi: 10.1172/JCI119802. [DOI] [PMC free article] [PubMed] [Google Scholar]
- Kunzelmann K., Kathofer S., Greger R. Na+ and Cl− conductances in airway epithelial cellsincreased Na+ conductance in cystic fibrosis. Pflügers Arch. 1995;431:1–9. doi: 10.1007/BF00374371. [DOI] [PubMed] [Google Scholar]
- Macklem P.T., Proctor D.F., Hogg J.C. The stability of peripheral airways. Respir. Physiol. 1970;8:191–203. doi: 10.1016/0034-5687(70)90015-0. [DOI] [PubMed] [Google Scholar]
- Matsui H., Grubb B.R., Tarran R., Randell S.H., Gatzy J.T., Davis C.W., Boucher R.C. Evidence for periciliary liquid layer depletion, not abnormal ion composition, in the pathogenesis of cystic fibrosis airways disease Cell. 95 1998. 1005 1015a [DOI] [PubMed] [Google Scholar]
- Matsui H., Randell S.H., Peretti S.W., Davis C.W., Boucher R.C. Coordinated clearance of periciliary liquid and mucus from airway surfaces J. Clin. Invest. 102 1998. 1125 1131b [DOI] [PMC free article] [PubMed] [Google Scholar]
- Matsui H., Davis C.W., Tarran R., Boucher R.C. Osmotic water permeabilities of cultured, well-differentiated normal and cystic fibrosis airway epithelia. J. Clin. Invest. 2000;105:1419–1427. doi: 10.1172/JCI4546. [DOI] [PMC free article] [PubMed] [Google Scholar]
- Quinton P.M. Viscosity versus composition in airway pathology. Am. J. Respir. Crit. Care Med. 1994;149:6–7. doi: 10.1164/ajrccm.149.1.8111599. [DOI] [PubMed] [Google Scholar]
- Rahmoune H., Shephard K.L. State of airway surface liquid on guinea pig trachea. J. Appl. Physiol. 1995;78:2020–2024. doi: 10.1152/jappl.1995.78.6.2020. [DOI] [PubMed] [Google Scholar]
- Sanderson M.J., Sleigh M.A. Ciliary activity of cultured rabbit tracheal epitheliumbeat pattern and metachrony. J. Cell Sci. 1981;47:331–347. doi: 10.1242/jcs.47.1.331. [DOI] [PubMed] [Google Scholar]
- Schurch S., Goerke J., Clements J.A. Direct determination of volume- and time-dependence of alveolar surface tension in excised lungs. Proc. Natl. Acad. Sci. USA. 1978;75:3417–3421. doi: 10.1073/pnas.75.7.3417. [DOI] [PMC free article] [PubMed] [Google Scholar]
- Sims D.E., Horne M.M. Heterogeneity of the composition and thickness of tracheal mucus in rats. Am. J. Physiol. 1997;273:L1036–L1041. doi: 10.1152/ajplung.1997.273.5.L1036. [DOI] [PubMed] [Google Scholar]
- Smith J.J., Travis S.M., Greenberg E.P., Welsh M.J. Cystic fibrosis airway epithelia fail to kill bacteria because of abnormal airway surface fluid. Cell. 1996;85:229–236. doi: 10.1016/s0092-8674(00)81099-5. [DOI] [PubMed] [Google Scholar]
- Stutts M.J., Canessa C.M., Olsen J.C., Hamrick M., Cohn J.A., Rossier B.C., Boucher R.C. CFTR as a cAMP-dependent regulator of sodium channels. Science. 1995;269:847–850. doi: 10.1126/science.7543698. [DOI] [PubMed] [Google Scholar]
- Tarran R., Grubb B.R., Parsons D., Picher M., Hirsch A.J., Davis C.W., Boucher R.C. The CF salt controversyin vivo observations and therapeutic approaches. Mol. Cell. 2001;8:149–158. doi: 10.1016/s1097-2765(01)00286-6. [DOI] [PubMed] [Google Scholar]
- Ussing H.H., Fischbarg J., Sten-Knudsen O., Larsen E.H., Willumsen N.J. Isotonic Transport in Leaky Epithelia 1993. Munksgaard; Copenhagen: pp. 533 [Google Scholar]
- Widdicombe J.G. Airway surface liquidconcepts and measurements. In: Rogers D.F., Lethem M.I., editors. Airway MucusBasic Mechanisms and Clinical Perspectives. Birkhauser; Basel: 1997. pp. 1–17. [Google Scholar]
- Widdicombe J.H., Widdicombe J.G. Regulation of human airway surface liquid. Respir. Physiol. 1995;99:3–12. doi: 10.1016/0034-5687(94)00095-h. [DOI] [PubMed] [Google Scholar]
- Willumsen N.J., Davis C.W., Boucher R.C. Intracellular Cl− activity and cellular Cl− pathways in cultured human airway epithelium. Am. J. Physiol. 1989;256:C1033–C1044. doi: 10.1152/ajpcell.1989.256.5.C1033. [DOI] [PubMed] [Google Scholar]
- Wine J.J. The genesis of cystic fibrosis lung disease. J. Clin. Invest. 1999;103:309–312. doi: 10.1172/JCI6222. [DOI] [PMC free article] [PubMed] [Google Scholar]
- Wright J.R. Immunomodulatory functions of surfactant. Physiol. Rev. 1997;77:931–962. doi: 10.1152/physrev.1997.77.4.931. [DOI] [PubMed] [Google Scholar]
- Zabner J., Smith J.J., Karp P.H., Widdicombe J.H., Welsh M.J. Loss of CFTR chloride channels alters salt absorption by cystic fibrosis airway epithelia in vitro. Mol. Cell. 1998;2:397–403. doi: 10.1016/s1097-2765(00)80284-1. [DOI] [PubMed] [Google Scholar]
- Zahm J.M., Galabert C., Chaffin A., Chazalette J.P., Grosskopf C., Puchelle E. Improvement of cystic fibrosis airway mucus transportability by recombinant human DNase is related to changes in phospholipid profile. Am. J. Respir. Crit Care Med. 1998;157:1779–1784. doi: 10.1164/ajrccm.157.6.9706036. [DOI] [PubMed] [Google Scholar]