

Abstract
Cooperativity among the four subunits helps give rise to the remarkable voltage sensitivity of Shaker potassium channels, whose open probability changes tenfold for a 5-mV change in membrane potential. The cooperativity in these channels is thought to arise from a concerted structural transition as the final step in opening the channel. Recordings of single-channel ionic currents from certain other channel types, as well as our previous recordings from T442S mutant Shaker channels, however, display intermediate conductance levels in addition to the fully open and closed states. These sublevels might represent stepwise, rather than concerted, transitions in the final steps of channel activation. Here, we report a similar fine structure in the closing transitions of Shaker channels lacking the mutation. Describing the deactivation time course with hidden Markov models, we find that two subconductance levels are rapidly traversed during most closing transitions of chimeric, high conductance Shaker channels. The lifetimes of these levels are voltage-dependent, with maximal values of 52 and 22 μs at −100 mV, and the voltage dependences of transitions among these states suggest that they arise from equivalent conformational changes occurring in individual subunits. At least one subconductance level is found to be traversed in normal conductance Shaker channels. We speculate that voltage-dependent conformational changes in the subunits give rise to changes in a “pore gate” associated with the selectivity filter region of the channel, producing the subconductance states. As a control for the hidden Markov analysis, we applied the same procedures to recordings of the recovery from N-type inactivation in Shaker channels. These transitions are found to be instantaneous in comparison.
Keywords: likelihood, patch clamp, subconductance, cooperativity, HMM
INTRODUCTION
Shaker potassium channels are formed by four identical subunits surrounding a central ion-conducting pore (MacKinnon 1991; Sokolova et al. 2001). The “outer pore” formed by the pore helices and the ion selectivity filter (together called the H5 or P region) is the main structure that determines the high rate of ion permeation and the ion selectivity of these channels. Although it is easy to imagine the outer pore as a rigid structure, many observations have suggested that this region also participates in voltage-gated activation. Mutations in this region have been shown to affect greatly the rates of channel opening and closing (Yool and Schwarz 1991; Yellen et al. 1991; Heginbotham et al. 1992; Kirsch et al. 1992; De Biasi et al. 1993; Zheng and Sigworth 1997, Zheng and Sigworth 1998). In several cases, the gating effects are associated with permeation effects such as changes in conductance or ion selectivity (Yool and Schwarz 1991, Yool and Schwarz 1995; Heginbotham et al. 1992; Zheng and Sigworth 1997). Supporting the idea that this region participates in gating, an electron paramagnetic resonance study of the Streptomyces lividans potassium channel KcsA has suggested that the outer pore changes conformation between closed and open states (Perozo et al. 1999).
Work on Kv2.1 channels (Chapman et al. 1997) and our previous studies of Shaker T442S mutant channels (Zheng and Sigworth 1997, Zheng and Sigworth 1998) have shown activation-coupled subconductance levels (sublevels). The observation that sublevels exhibit differing ion selectivities suggests that the sublevels arise from small structural changes in the outer-pore region (Zheng and Sigworth 1997). Analysis of the kinetics of sublevels could provide insight into how gating occurs in this multisubunit protein. Detailed information on the voltage dependence of the transitions among the various conductance levels would also help us better understand how subunits interact in response to changes in transmembrane voltage. Since the previously reported sublevels in Shaker channels were recorded from channels with mutations of the residue T442 in the P region, it is necessary to extend the study to channels without pore mutations.
Our previous study of channels having various numbers of mutant subunits (Zheng and Sigworth 1998) implied the existence of activation-coupled sublevels in wild-type channels. The mean lifetimes of the sublevels, however, were expected to be in the microsecond range, too short to be quantified by traditional single-channel analysis techniques. To overcome this problem, we have combined two approaches in the present study. First, low-noise single-channel recordings were made from both Shaker channels and a high conductance Shaker-Kv3.1 chimeric channel (Lopez et al. 1994) whose gating characteristics are very similar to the wild-type Shaker channel. Second, to characterize the sublevels, we used a hidden Markov model (HMM) approach that allows the study of brief events buried in noise (Venkataramanan et al. 2000). We make use of the N-type inactivation process as an internal control to verify the results of the HMM analysis.
Here, we report that sublevels are clearly identified to occur during deactivation of the “intact-pore” channels. Although their dwell times are ∼200-fold shorter, these sublevels have similar properties to those observed in the T442S “mutant-pore” channels: most deactivation transitions traverse the sublevels, and the mean lifetime of each sublevel has similar voltage dependence. These results, together with our previous studies of T442S mutant channel sublevels, are consistent with the hypothesis that the final gating steps of Shaker channels involve movements in the ion-selectivity filter region as well as movements of the “main gate” that is formed by the S6 helices.
MATERIALS AND METHODS
cDNA Constructs and Oocyte Expression
Three constructs were used in this study. The channel denoted SNΔ is a Shaker B chimera (provided by Dr. L.Y. Jan, University of California at San Francisco, San Francisco, CA) in which the S6 sequence was substituted with the corresponding sequence from the mKv3.1 (also known as NGK2) channel, and in which the NH2-terminal inactivation sequence was removed (Lopez et al. 1994; see Fig. 2 C for sequence comparison in the S6 region between Shaker and SNΔ). N-type inactivation was reinstalled in SNΔ by subcloning the core sequence of SNΔ (between the T1 domain and the end of the COOH terminus) into Shaker 29-4 using the restriction sites SnaBI and BsgI. This “full-length” construct was denoted SN. The usual Shaker construct, denoted ShΔ, is Shaker H4 having the Δ6-46 NH2-terminal deletion to remove inactivation. The amino acid sequence of Shaker H4 (Kamb et al. 1988) is identical to that of Shaker B (Schwarz et al. 1988) except for four amino acids in the COOH-terminal region. The cDNAs were linearized with EcoO109I, and the capped, T3 run-off transcripts were stored at −70°C.
Figure 2.

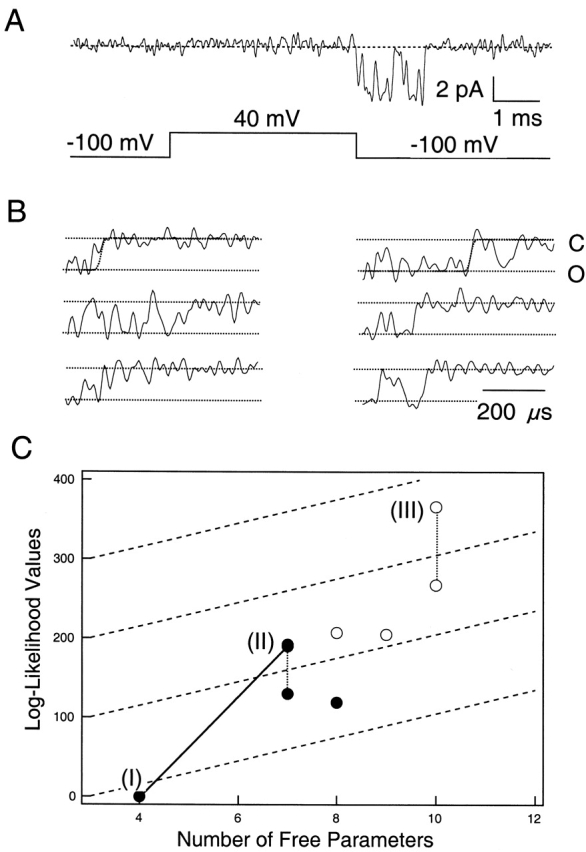
Single SNΔ channel deactivation. (A) Single-channel current recorded from a SNΔ channel with symmetrical 140 mM potassium solution, shown at 5-kHz bandwidth. Pulse protocol is shown below the current trace. The vicinity of the last closing transition, marked by a box and shown in B at expanded time scale, is subjected to HMM analysis. (B) Examples of the closing transitions shown at 15 kHz bandwidth. A simulated current step after Gaussian filtering to 15 kHz is overlaid on top of the current traces in the top two panels. (C) Sequence comparison between ShΔ and SNΔ. The proposed S6 transmembrane domain is marked. Dashes represent identical residues.
Oocytes were obtained from Xenopus laevis following the protocol previously described (Zheng and Sigworth 1997), and stored in ND96 solution at 20°C before and after RNA injection. ND96 contained 96 mM NaCl, 2 mM KCl, 1.8 mM CaCl2, 1 mM MgCl2, 50 U/ml penicillin, 50 ng/ml streptomycin, and 5 mM HEPES, and was adjusted to pH 7.4 with NaOH. Volumes of 50-100 nl of cRNA were injected using a microinjector (Drummond Scientific Co.). Concentrations of injected cRNA were varied to control the level of expression.
Low Noise Single-channel Recording
Single-channel recordings were made in inside-out patches at room temperature. Patch pipettes were pulled from 7052 glass (Garner Glass) or from quartz capillaries (Sutter Instrument Company) using a laser-based pipette puller (model P2000; Sutter Instrument Co.); the pipette tip diameters were 0.5–1.5 μm. Pipettes were heavily coated with Sylgard (Dow Corning Co.). In our hands, quartz pipettes (Levis and Rae 1993) normally yielded less noise throughout the recording bandwidth (up to 30 kHz); the noise density measured near 1 kHz from quartz and 7052 glass were ∼ 5 × 10⁻³⁰ and 10−29 A2/Hz, respectively. The pipette solution contained 140 mM potassium aspartate, 1.8 mM CaCl2, 10 mM HEPES, and the bath solution contained 130 mM potassium aspartate, 10 mM KCl, 1 mM EGTA, 10 mM HEPES; each was adjusted to pH 7.3 with KOH. The liquid junction potential at the interface of these two solutions was estimated to be 0.8 mV; no correction was applied.
Recordings were made using an Axopatch 200B amplifier (Axon Instruments). To avoid magnetic interference, an LCD monitor was used as the computer display. The Pulse software (HEKA Electronic) was used for data collection. Voltage pulses were applied from a holding potential of −100 mV. Current signals were filtered at 30 kHz with a Bessel filter and sampled at 200 kHz. For each pulse protocol, 3,000 sweeps were collected at a rate of ∼3 sweeps/s; of these sweeps >20% were blank and were later used for leak and capacitive current subtraction. Open probability was routinely checked to ensure that the channel retained normal gating properties during the long recording time.
Step Response and Inverse Filter
The step response of the recording system was measured by providing a triangular waveform voltage through a metal wire that was placed close to the pipette holder (Sigworth 1995). The resulting square-wave current response was sampled at 200 kHz and averaged over many cycles. An inverse filter was then constructed by Fourier techniques to convert the impulse response of the recording to the impulse response h(n) of a sharp-cutoff, discrete time filter (Venkataramanan et al. 2000)
 |
with the corner frequency f
x = 0.4 times the sampling frequency and the steepness parameter  . The relatively short rise time of this type of filter results in more efficient HMM calculations, even though the filter shows an overshoot ∼10% in amplitude. In our use, the final effective filter bandwidth was 80 kHz. The effect of applying the inverse filter to a recorded trace is shown in Fig. 1 A; the power spectrum of the background noise after inverse filtering is shown in Fig. 1 B.
Figure 1.

Filtering, noise and HMM convergence. (A) Portion of a leak-subtracted recording centered on the transition (arrow) between the +60 mV activating pulse and the −120 mV deactivating pulse. Due to amplifier saturation the current recording in the vicinity of the voltage jump is zero. The thick trace shows the original 30-kHz bandwidth; the thin trace is the result of inverse-filtering to 80 kHz. (B) Power spectrum (points) computed from 37-ms quiescent portions selected from 100 sweeps, and plotted on a linear frequency scale. Above 60 kHz, the spectral density falls due to the sharp-cutoff filter, which had a half-amplitude (1/4 power) frequency of 80 kHz. Small spectral peaks due to interference from the computer (65 kHz) and the patch-clamp amplifier's power supply (95 kHz) are visible. Superimposed on the data are the spectral densities computed from the AR noise model parameters of the HMM fit of this data set. It is seen that the shape of the spectrum is described better as the number of AR coefficients is increased from three to four and five. (C) Convergence of a hidden Markov model. The log likelihood and the value of the S2→S1 rate constant are plotted as a function of iteration number for the fitting of Model III (see Fig. 3) to the same data set obtained at −120 mV. The inset shows the rapid increase in log-likelihood value during the first 15 iterations.
HMM analysis is sensitive to baseline drifts during experiments. To subtract any baseline shift as well as the transient currents caused by voltage steps in the pulse protocols, >100 nearby blank sweeps were averaged and used to subtract each sweep. The subtracted data were then inverse-filtered to produce the data set for HMM analysis.
HMM Analysis
In this study, we focused on the vicinity of the last closing transition, which was identified in each recorded sweep as follows. A digital Gaussian filter was used to filter the data to 10 kHz bandwidth. Two thresholds, 90% and 10% of the full single-channel amplitude, were used to locate the time points when a channel makes its last transition leaving the open level and when it arrives at the closed level, respectively. 5–20 additional sample points (25–100 μs) were added at each end of the selected segments to include enough data points that represent the open and closed current levels.
The HMM analysis took three inputs: (1) inverse-filtered raw data; (2) a kinetic model containing information of the number of states and their current levels, the connectivity of those states, transition rates, as well as the auto-regressive coefficients that describe the background noise; and (3) an events list that contains pointers to the data selections, obtained as described above. The HMM model was refined iteratively using the Baum-Welch algorithm (Venkataramanan et al. 2000). Fig. 1 C demonstrates the HMM convergence in the case of a five-state model. A monotonic increase in likelihood value is associated with the eventual convergence of parameter values.
The HMM analysis code has been integrated into the TAC single-channel analysis software (Bruxton Corp.); it was run on two Macintosh G3 computers with 233–300 MHz clock speed and 256 MB of memory. We used the modified version TAC X4.0.5 run with the “continuous-time” option, which invokes the H-noise algorithm (Venkataramanan et al. 2000). This algorithm takes into account the distortion of current transitions (including smoothing and overshoot) by the antialiasing filter. It also accounts for the random timing of state transitions relative to data sampling by the inclusion of a fictitious “H-noise” in the hidden Markov model. The background noise itself is described by an auto-regressive (AR) model; the behavior of this model is demonstrated in Fig. 1 B, where the AR description is compared with the background power spectrum computed directly from blank portions of recordings. Models incorporating three to five AR coefficients were tested for modeling the background noise; four coefficients were generally used in the study because increasing the number to five made little change in the results but increased the computation time severalfold. Because the H-noise algorithm does not converge when it is included (Venkataramanan et al. 2000), excess noise associated with the conducting states could not be modeled. Excess noise is visible at the main conductance level and in sublevels (in mutant channels where the sublevels are clearly observed). From our experience with simulations, we do not expect errors in the determination of rate constants from this omission, however.
The starting value of the current in the fully open level was assigned as that measured from an all-points histogram; those of the sublevels were assigned using the relative conductances of the sublevels in the T442S mutant channels. The initial probability of the open state was assigned to be unity. Usually 300 iterations were conducted for each fitting process. The speed of the fitting process was tested with a data set containing 600 data segments with an average length of 120 points. Using a model with three states and four free parameters as well as four AR coefficients, it took a G3 computer 21 s to perform each iteration. With the actual data sets, a few hours were required to run 300 iterations for a simple model and overnight to run a complex model.
Likelihood Interval Estimation
Errors associated with the estimation of the transition rates were evaluated as likelihood intervals. This was done by mapping the likelihood surface curvature near the apex in each dimension represented by a free parameter (Colquhoun and Sigworth 1995). To do so, maximum-likelihood fitting was conducted while fixing the parameter in question at selected values in the neighborhood of its optimal value and allowing the other parameters to vary freely. (Because the Baum-Welch optimization reestimates each parameter independently, fixing a parameter was simply a matter of not updating its value at each iteration.) The change in log likelihood was plotted against the percent change of the tested parameter and fitted by a parabolic function to yield s, the one-standard deviation confidence limit on the estimated parameter.
RESULTS
Deactivation of SNΔ Channels Is Not Instantaneous
Activation-associated sublevels have been observed previously in Shaker channels with the pore mutation T442S (Zheng and Sigworth 1997, Zheng and Sigworth 1998). To answer the question whether channels without the mutation also gate through similar sublevels, we chose to study a noninactivating, high conductance Shaker chimera (Lopez et al. 1994) that we call SNΔ. Fig. 2 A shows a single-channel trace recorded from a SNΔ channel expressed in Xenopus oocytes. At a low bandwidth (Fig. 2 A, 5 kHz), the deactivation appears to be instantaneous; however, at a higher bandwidth, the time course of the deactivation transitions sometimes appears to progress through intermediate steps. Examples of the last closing transition (as marked by a box in Fig. 2 A), are shown in Fig. 2 B at 15 kHz bandwidth.
Due to the effect of filtering, an instantaneous step transition will appear to have a finite transition time. At 15 kHz, the rise time (10–90% amplitude) of a direct transition from the open level to the closed level is expected to be 0.34/f c = 23 μs, in which f c is the filtering frequency (Colquhoun and Sigworth 1995). In the two top panels of Fig. 2 B, such a current step is overlaid on top of the SNΔ current trace. The apparently slower closing rate of SNΔ channels observed in most traces is consistent with the possibility that deactivation transitions of SNΔ traverse intermediate conductance levels. The lifetimes of these sublevels are expected to be brief, in the range of tens to hundreds of microseconds (Zheng and Sigworth 1998). The brief lifetimes make it difficult to study these sublevels with conventional methods.
HMM Analysis Reveals Multiple Sublevels in SNΔ Channels
In this study, we wanted to determine the number of sublevels during deactivation and the mean lifetime of each sublevel at various voltages. The HMM method turned out to be a natural choice for this task. Unlike threshold analysis that relies on detection of current crossing of a certain level to determine current transitions, HMM analysis finds the model parameters that maximize the probability of observing the entire data set given the model (Qin et al. 2000). It is less limited by noise and can better handle the missed events problem that is inherent in the threshold analysis.
The first question we tried to answer using HMM was whether SNΔ channels traverse sublevels during deactivation. We started with linear models with increasing numbers of conducting states (Fig. 3, Models I–IV). The existence of an additional state would be implied by a large increase in the likelihood value, relative to the increase in number of free parameters, when a new state is added. An increase of about two log-likelihood units is expected on theoretical grounds (Akaike 1974) from the addition of one free parameter alone. However, from simulations our experience is that an increase of at least 10–20 units per free parameter is required to identify a significant improvement in the model. A data set of 622 deactivation transitions at −120 mV was analyzed, and the results are listed in Table . The model having one sublevel and one open level (Model II) has three additional free parameters but gives rise to a likelihood value that is 673 log units higher than that of the model having only one conducting state (Model I). An additional sublevel (Model III) further increased the likelihood value by 395 log units. The lifetimes of the two sublevels in Model III were estimated at −120 mV to be 17 and 36 μs.
Figure 3.

Examples of the models tested. Each model has one open state (O), one to four substates (S and T), and two to three closed states (C), in which the leftmost closed state (C0) is an absorbing state. Deactivation always starts at the open state. Conductances and transition rates for each model are listed in Table .
Table 1.
HMM Analysis Results for SNΔ Channels
| Model no. | I | II | III | III′ | IV | V | VI | VII | VIII | IX | X | XI |
|---|---|---|---|---|---|---|---|---|---|---|---|---|
| Transition rates (s−1) | ||||||||||||
| O→S2 | — | — | 35,200 | 1,017 | 68,978 | — | 36,408 (33,154) | 18,440 (38,511) | 29,051 (20428) | 25,773 | 26,555 | 26,505 |
| O→S1 | 29,932 | 21,349 | 12,085 | |||||||||
| O→T | — | — | — | — | — | — | — | — | 3,036 | 4,775 | 5,007 | 7,508 |
| O→C | 18,132 | — | — | — | — | 8,705 | — | 6,674 (0) | — | — | — | — |
| S3→S2 | — | — | — | — | 43,959 | — | — | — | — | — | — | — |
| S2→S3 | — | — | — | — | 0 | — | — | — | — | — | — | — |
| S2→S1 | — | — | 32,248 | — | 33,950 | — | 3,583 (20547) | 4577 (15,977) | — | 37,427 | 26,549 | 26,068 |
| S1→S2 | — | — | 30,817 | — | 32,734 | — | 799 (27,024) | 922 (22,309) | — | 41,468 | 35,592 | 35,985 |
| T2→T1 | — | — | — | — | — | — | — | — | — | — | — | 12,584 |
| T1→T2 | — | — | — | — | — | — | — | — | — | — | — | 1,857 |
| S2→O | — | — | 0 | 5,170 | 0 | — | 30,634 (0) | 20,366 (0) | 34,570 (12,279) | 3,191 | 3,098 | 3,080 |
| S1→O | — | 26,274 | — | 23,342 | — | 15,011 | — | — | — | — | — | — |
| T→O | — | — | — | — | — | — | — | — | 715 (2,029) | 249 | 260 | 1,231 |
| S2→C | — | — | — | — | — | — | 15,797 | 7,347 | — | — | 6,978 | — |
| S1→C | — | 19,916 | 20,313 | 24,029 | 20,475 | 9,311 | 1,142 | 845 | 15,765 | 18,787 | 10,301 | 23,397 |
| T→C | — | — | — | — | — | — | — | — | 2,782 (6,328) | 2,415 | 2,451 | 2,519 |
| C→O | 13,428 | — | — | — | — | 1,003 | — | 1,473 | — | — | — | — |
| C→S1 | 2,574 | 2,103 | 2,305 | 2,041 | 1,304 | 0 (1,213) | 0 (1,046) | 2,769 (66,546) | 216 | 878 | 1,820 | |
| C→T | 3,204 (6,131) | 3,100 | 2.968 | 3,870 | ||||||||
| C→S2 | 2,790 (586) | 1,140 (823) | — | — | 1,101 | — | ||||||
| C2→C0 | — | — | — | — | — | — | — | — | 4 (0) | 0 | 0 | 0 |
| C1→C0 | 7,235 | 528 | 210 | 115 | 196 | 1,109 | 520 (382) | 1,235 (645) | 580 (16,360) | 176 | 343 | 149 |
| Current (pA) | ||||||||||||
| O | −9.0 | −10.0 | −10.4 | −9.7 | −9.6 | −9.7 | −10.5 (−10.3) | −10.3 (−10.5) | −10.4 (−10.5) | −10.5 | −10.5 | −10.8 |
| S3 | — | — | — | — | −10.7 | — | — | — | — | — | — | — |
| S2 | −4.0 | −9.4 | −6.0 | −9.3 | −4.7 | −4.3 (−9.3) | −4.9 (−9.2) | −4.0 (−9.0) | −9.4 | −9.4 | −9.4 | |
| S1 | — | — | −2.6 | −2.1 | −2.3 | — | −1.2 | −1.1 | — | −2.2 | −3.2 | −1.2 |
| T2 | −5.5 | |||||||||||
| T1 | −1.4 (−2.1) | −1.4 | −1.4 | −1.3 | ||||||||
| Free parameters | 4 | 7 | 10 | 10 | 13 | 9 | 12 | 14 | 13 | 18 | 16 | 19 |
| Relative log likelihood | 0 | 673 | 1,068 | 828 | 1,198 | 723 | 1,079 (913) | 1,057 (949) | 1,007 (921) | 1,235 | 1,233 | 1,402 |
Transition rates and current levels are given at −120 mV. Numbers in parentheses are those given by an alternative fit using different starting parameter values. In identifying states, no subscript is used wherever there is no ambiguity.
These lifetime estimates are briefer than the dwell-time estimates of 70 and 280 μs that we previously obtained using an amplitude histogram approach on the deactivation time course of SNΔ channels (Zheng and Sigworth 1998). However, the histograms evaluate the total time spent in each sublevel, which is analogous to a burst duration, during deactivation. This difference, along with the sensitivity of the histogram method to transition points and to heterogeneous states (e.g., the T states of Models VIII–XI described below), probably account for the larger estimates obtained previously.
Are there more than two sublevels in SNΔ channels? As shown in Table , the model having a third sublevel (Model IV) indeed further increased the likelihood value by 43 log units per free parameter over Model III. However, it is noticed that the current level of the additional state S3 in Model IV is larger than that of the open state (though only by 10%) and the transitions into and out of this state are unidirectional and very rapid. Thus the model describes a brief increase in channel current just preceding the closing transitions. The single-channel recordings of SNΔ channels, similar to those of wild-type Shaker channels, contained many brief closures (flickers). One explanation for the increased likelihood from Model IV is that some of the deactivation transitions we selected may start from a flickering state and then proceed through the open state. However, because the rate constants and current levels of the other states in Model IV are indistinguishable from the values for Model III, we take Model III to be a good approximate description of the channel behavior, having two main sublevels.
The next question we asked was whether the two sublevels, denoted S2 and S1, are always traversed during channel deactivation. A model having S2 outside of the deactivation pathway (Model III′) clearly did not work, as indicated by its much lower likelihood value compared with Model III. We also constructed models in which direct transitions to closed states were allowed from the open state and from the higher conductance sublevel S2 (Models V–VII). In models containing loops, no constraint for detailed balance was applied. Nevertheless, with these models, we found at most only moderate increases in the likelihood value. As shown in Table , a direct O→C transition gave Model V an increase in likelihood by 25 log units per free parameter over Model II; similar direct transitions from O and S2 to C reduced the likelihood value of Model VII by ∼11 log units per free parameter compared with Model III (the reduction probably reflects a convergence error; see below). In both cases, the O→C rate was smaller than the corresponding O→S rate, suggesting that the O→C transition rarely occurs. The S2→C transition also moderately increased the likelihood value of Model VI over Model III, by only 6 log units per free parameter. We conclude that these direct-closing pathways are not ruled out, but their inclusion results in little increase in the likelihood values. The simplest description of our data is that most or all closing transitions occur through both sublevels.
To test whether there are other sublevels that are not in the S2-S1 pathway, models were considered with a branching path containing another set of sublevels, denoted T2 and T1 (Models VIII–XI). A branching path clearly increased the likelihood values. For example, the likelihood of Model VIII was 54 log units per free parameter higher than that of Model II. Compared with the S states, the T states (especially T1) had much longer mean lifetimes. On the other hand, fewer than 10% of the deactivation transitions took the T pathway, so that the states T2 and T1 are rarely visited. Evidence for an alternative sublevel state like T1 has been presented previously in the study of heteromultimeric channels containing pore mutant subunits (Zheng and Sigworth 1998).
The above results are summarized in Fig. 4, in which the log-likelihood value is plotted against the number of free parameters in each model. It is clearly seen that the inclusion of one and two sublevels (going from Model I to Models II and III) gave the most dramatic increases in likelihood. Adding T2 and T1 gave further increases, but their contributions were much smaller (Models IX and XI). In theory, a model with more free parameters should always give a higher likelihood value (Horn 1987). Our results generally followed this prediction, but in some cases we observed decreases in the likelihood with more complex models. It is likely that the data set we used did not contain enough information to distinguish among those complex models and local maxima of the likelihood function were being found. Accordingly in the subsequent studies, we chose to focus on Model III to learn more about the gating behavior of the dominant S2/S1 sublevels. Although it entirely lacks the slower pathway through T2 and T1, this simple model does give values very similar to those of models X–XI for the rate constants in the S2/S1 pathway (Table ).
Figure 4.

Comparison of the relative log-likelihood values generated by models with increasing complexity. Model numbers in parentheses are the same as in Fig. 3. Those not labeled are models having the same states as Model XI but with more transition pathways linking those states, including pathways between the S states and the T states. Dotted lines link results from the same model; open symbols represent fits starting from different initial values that ended at a different maxima. Dashed lines are drawn at slopes of 15 log-likelihood units per free parameter.
SNΔ Channel Sublevels Show Voltage-dependent Lifetimes
Deactivation transitions in the voltage range from −80 to −140 mV were analyzed with Model III. At each voltage, S2 and S1 were seen to have distinct current levels with linear I-V relationships like that of the open state (Fig. 5 A). The relative conductances of S2 and S1 are estimated to be 81 and 13% of the open level, respectively. It was found that the mean lifetime of each sublevel was voltage-dependent (Fig. 5 B), following similar bell-shaped curves. The longest lifetimes for S2 and S1 were found to occur near −100 mV, with the estimated values to be 52 and 22 μs, respectively. The estimated transition rates at −120 mV and the partial charges, estimated by exponential fitting of the transition rates as functions of voltage (Fig. 5 C), are given in Fig. 5 D. At −120 mV, SNΔ channels deactivate quickly; accordingly, the backward transitions showed higher rates than the forward transitions. All the transition rates were voltage-dependent. The amount of charge movement in the S2→S1 and S1→C transitions, 1.0 e0 and 1.2 e0, respectively, is smaller than, but comparable to, our earlier estimates from the T442S mutant channel sublevels, which were 1.6 e0 and 1.7 e0, respectively (Zheng and Sigworth 1997).
Figure 5.

Sublevels in the SNΔ channel have voltage-dependent lifetimes. (A) From the HMM analysis, estimates of the single-channel current are plotted as a function of membrane potential for the fully-open level and two sublevels. (B) Voltage dependence of the mean lifetime of each sublevel. Open symbols are results from a series of recordings from the same SNΔ channel; closed symbols at −120 mV are results from 765 closing events in a recording from an N-type–inactivating SN channel. The number of sweeps analyzed at each voltage are as follows: −80 mV, 1,700; −100 mV, 1,286; −120 mV, 622 (SNΔ), 765 (SN); and −140 mV, 1,588. The superimposed dotted curves are the state lifetimes predicted by the model shown in D. (C) Voltage dependences of three rate constants and fits to an exponential function, from which partial charges are obtained. (D) Model III is shown with values for the rate constants (units of s−1) given for V = −120 mV. The estimated errors are two-unit likelihood intervals as determined in Fig. 6. The partial valence associated with each rate constant is given in parentheses. The percentage of transitions taking the O→S2 path was obtained by adding an extra closing path from the open state and comparing the rate constants leading to S2 versus this other path. In most cases, this percent was higher than 90%. The absolute value of the rate of this transition could not be obtained because the dwell in O state was truncated by our data selection procedure. (E) Simulated single-channel data at −120 mV using the model shown in D and assuming a value of 1,500 s−1 for the O→S2 rate constant.
It is interesting to compare the size of these estimated charge movements with those of the elementary charge movements of the Shaker channel voltage sensors. Zagotta et al. 1994 estimated the partial charges associated with the later conformational change in each subunit to be 0.32 e0 and 1.1 e0 for the forward and backward transition, respectively, giving a total of 1.4 e0. Schoppa and Sigworth 1998a estimated those partial charges to be 0.08 e0 and 0.52 e0, yielding a total charge movement of 0.6 e0.
The estimated forward transition rate S1→S2 is much higher than the other two forward rates and is comparable to the backward transition S2→S1. The result would predict fast flickering between the two sublevels. Simulations using the model shown in Fig. 5 D indeed generated flickerings between S1 and S2 (Fig. 5 E). Such flickering behavior was not obvious in the T442S mutant channels (Zheng and Sigworth 1997).
Errors associated with the estimation of each Model III transition rate were evaluated by fitting the same data while fixing the rate in question to a certain percent away from its optimal value (Fig. 6). From this analysis, we obtained the two-unit likelihood interval for each rate, which is given in Fig. 5 D. (Two likelihood units are comparable to two standard deviations, with the two measures of error being identical in the case of the normal distribution; Colquhoun and Sigworth 1995.) In our case, all of the two-unit likelihood intervals were estimated to be smaller than 20%, with the only exception to be the C1→C0 transition, which had the very slow rate of 210 s−1 (representing a rare transition) and a 130% confidence interval. It should be noted that the data set at −120 mV was our smallest, containing only 622 deactivation time courses. The data sets at other voltages contained 1,286–1,700 deactivation time courses. It is expected that the errors associated with the estimates at those voltages should be smaller.
Figure 6.
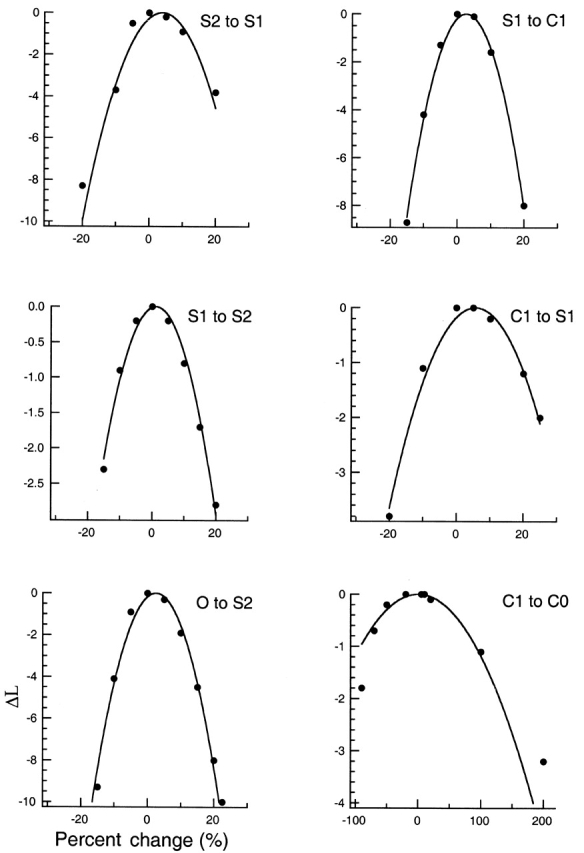
Likelihood intervals for rate constant estimates of Model III obtained from one of the data sets of deactivations at −120 mV. Solid curves are fit of the function ΔL = −(x − x 0)2/s2, in which ΔL is the difference in the log likelihood from its maximum value, x is the value of the given rate constant, x 0 is the optimal value for that rate, and s is the fitted one-unit likelihood interval for the estimated rate constant. The confidence intervals given in Fig. 5 B represent ±2s.
Does Deactivation of “Wild-type” Shaker Channels Also Traverse Sublevels?
The SNΔ channel is a Shaker B chimera having the S6 segment sequence from mKv3.1 (Lopez et al. 1994). Eight amino acids are changed by the transplant (Fig. 2 C). Despite the fourfold increase in single-channel conductance, the overall gating behavior of the SNΔ channels is very similar to “wild-type” ShΔ channels (Lopez et al. 1994; Zheng and Sigworth 1997). Based on the observation that T442S channels without the S6 transplant also showed sublevels (Zheng and Sigworth 1998), it was considered unlikely that the deactivation-associated sublevels we observed here were caused by the S6 mutations. To confirm this, we conducted HMM analysis on ShΔ channels.
A set of 716 deactivation transitions recorded from a ShΔ channel at −100 mV was analyzed with the HMM method. Examples of ShΔ channel deactivations are shown in Fig. 7 (A and B). When Model II (Fig. 3) was used, the sublevel was assigned an amplitude of −2.4 pA and a mean lifetime of 56 μs. Compared with Model I having no sublevel, the likelihood of Model II was 192 log units greater (Fig. 7 C). The transition rates are listed in Table . The relative amplitude of the detected sublevel was similar to that of the S2 sublevel in SNΔ channels.
Figure 7.
Wild-type ShΔ channels close through sublevels. (A) Single-channel current recorded from a ShΔ channel with symmetrical potassium solution, shown at 5 kHz bandwidth. Pulse protocol is shown below the current trace. (B) Examples of the closing transitions shown at 15 kHz bandwidth. (C) Comparison of the relative log-likelihood values for ShΔ channels. Model numbers in parentheses indicate the same models as in Fig. 3; unlabeled symbols represent extensions of Model II having additional transitions. Dotted lines link results obtained from the same model with different initial parameter values. Open symbols represent fitting results that contain rate estimates exceeding 100,000 s−1. Dashed lines are drawn with slopes of 15 log-likelihood units per free parameter.
Table 2.
HMM Analysis Results for ShΔ Channels
| Model no. | I | II | III |
|---|---|---|---|
| Transition rates (s−1) | |||
| O→S | 33,100 | 134,103 | |
| S→O | — | 0 | 0 |
| O→C | 15,400 | — | — |
| C→O | 2,090 | — | — |
| S2→S1 | — | — | 40,249 |
| S1→S2 | — | — | 0 |
| S1→C | — | 17,800 | 20,607 |
| C→S1 | — | 3,700 | 6,910 |
| C1→C0 | 11,800 | 4,890 | 4,567 |
| Current (pA) | |||
| O | −2.77 | −3.38 | −0.61 |
| S2 | — | −2.42 | −4.27 |
| S1 | — | — | −2.52 |
| Free parameters | 4 | 7 | 10 |
| Relative log likelihood | 0 | 192 | 366 |
Transition rates and current levels are given at −100 mV. In identifying states, no subscript is used wherever there is no ambiguity.
The possibility that ShΔ channels also have a second sublevel was tested using Model III. However, although this and other more complex models yielded higher log-likelihood values than Model II (Fig. 7 C), in each case one or more of the estimated rates exceeded 100,000 s−1. We take rate constant values of this magnitude, greater than half the sampling rate, to be artifactual; in our experience with simulations, they typically arise from attempts of the HMM algorithm to fit features of the noise. Therefore, we take the only reliable result of this analysis to be the conclusion that Model II is much superior to Model I, and that the ShΔ channel passes through at least one sublevel during deactivation. The lifetime of the detected subconductance state is ∼50 μs at −100 mV, and its relative conductance is ∼60% of the full channel conductance level. These characteristics are essentially the same as the main sublevel S2 of the SNΔ channel.
The poor performance of Model III means only that we cannot tell whether there is more than one sublevel in ShΔ channels. It is quite possible that a second sublevel corresponding to S1, having a smaller conductance and a shorter lifetime, does in fact exist. That such a sublevel is not detected may probably result from the lower signal-to-noise ratio of the ShΔ current recordings.
An Internal Control: N-type Inactivation Transitions
Several possible control experiments can be envisioned that would allow the reliability and sensitivity of the HMM method to be tested. One test would be to conduct a parallel analysis on simulated data to see if HMM analysis would come up with the same parameters that have been used to generate the data. This was the major test used by Venkataramanan et al. 1998a, Venkataramanan et al. 1998b, Venkataramanan et al. 2000 during the development of the HMM method used here. Sunderman and Zagotta 1999a,Sunderman and Zagotta 1999b used a single-channel current generator to synthesize an analogue signal that was recorded by the same setup used in the experiment. This test had the advantage in that it better simulated the experimental situation. The test we chose to do was to reinstall N-type inactivation in SNΔ channels, yielding the SN channel type, and to analyze N-type inactivation recovery transitions in the same way as we did with deactivation transitions. This approach has several advantages. First, the two kinds of transitions are recorded from the same channel under identical conditions. This avoids any variation in experimental conditions and data processing. Second, N-type inactivation is a well understood process in voltage-dependent potassium channels, achieved by an NH2-terminal domain that physically blocks ion permeation (Hoshi et al. 1990; Zagotta et al. 1990; Zhou et al. 2001). It is expected that the current transitions representing N-type inactivation and the subsequent recovery from inactivation should both be single-step transitions (Fig. 8 A). Third, based on the mechanism of N-type inactivation, we expect that it should not interfere with the activation gating of the channels. With the SN channel, we found that indeed its macroscopic activation and deactivation processes were very similar to SNΔ channels.
Figure 8.
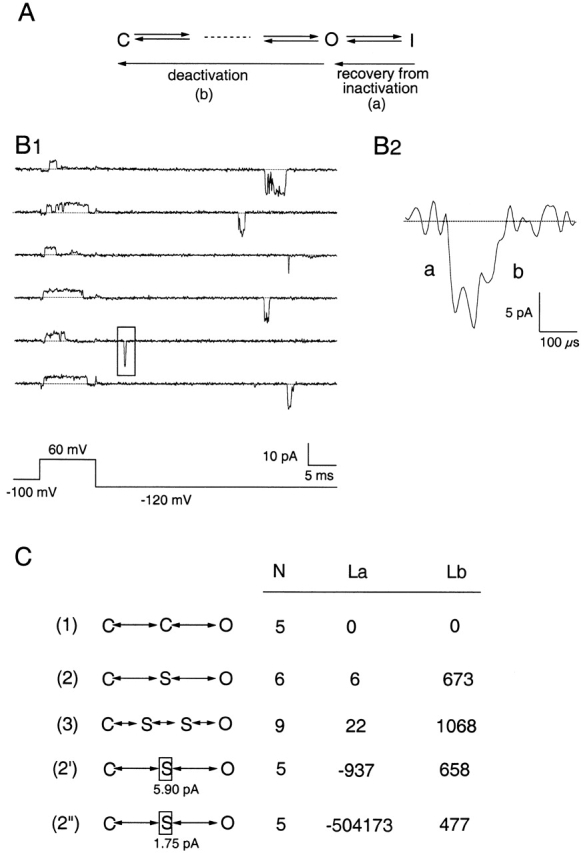
Recovery from inactivation to the fully-open level does not traverse sublevels. (A) Partial gating scheme illustrating multistep activation and a single-step inactivation process. (B1) Representative current sweeps of a SN channel that has N-type inactivation intact, shown at 5-kHz bandwidth. The channel activates and subsequently inactivates upon depolarization to +60 mV. An event representing recovery from inactivation at −120 mV is marked by a box and shown in detail in B2, where it is shown at 15 kHz with enlarged scales. Data segments for recovery from inactivation (a) and deactivation (b) were analyzed separately. (C) Comparison of HMM analysis of the recovery from inactivation (La) and deactivation (Lb) from 765 sweeps. A state enclosed by a box has a fixed current amplitude whose value is shown. N, number of free parameters in each model; La and Lb, relative log-likelihood values for a and b, respectively. Results were obtained with four AR coefficients.
Single-channel currents were recorded from SN channels (Fig. 8, B1 and B2). A total of 765 channel events during tail currents at −120 mV were selected, based on the criteria that the current recovered to the fully open level and stayed at that level for a time long enough to allow reliable estimation of the current amplitude. Segments of the current rising phase and decaying phase were selected and analyzed independently using HMMs. It was found that models with one or two sublevels provided dramatically improved fits to the deactivation transitions over Model 1 that had only open and closed states. The log-likelihood values increased by 673 and 395 units in going from Model 1 to 2 and 3 (Fig. 8 C). The two sublevels detected by Model 3 had conductance values and mean lifetimes similar to those found in SNΔ channel deactivations (the mean lifetimes are plotted in Fig. 5 for comparison), confirming that the deactivation process was not affected by restoring the N-type inactivation.
On the other hand, having additional sublevels did not fit the inactivation-recovery transition any better than Model 1. The small increases in log-likelihood values, 6 and 22 for Models 2 and 3, respectively, are well within the range expected from the addition of one or four free parameters. In the case of Model 2, the estimated lifetime of the sublevel was 12 μs and its estimated amplitude was 2% of the open current, making it essentially indistinguishable from the closed level. Increasing the number of AR coefficients in the noise model from four to five and six further reduced the estimated lifetime and conductance of this state, suggesting that this state reflects only an imperfection in modeling the noise. As a further test, we fixed the conductance of the sublevel to values close to those of the ones found in the deactivation transitions of the same channels (Fig. 8 C, Models 2′ and 2′′). This dramatically reduced the likelihood value generated from fitting the inactivation-recovery transitions but had little effect on those generated from fitting the deactivation transitions. We thus conclude that the inactivation-recovery transition is direct while the deactivation transition clearly passes through sublevels.
DISCUSSION
The present paper is the third in a series of studies of the activation-coupled sublevels in Shaker potassium channels (Zheng and Sigworth 1997, Zheng and Sigworth 1998). Using a recently developed “continuous-time” HMM analysis method we analyzed high resolution recordings from Shaker channels and from high conductance chimeric channels. By comparing the likelihood ranking of various kinetic schemes, we conclude that Shaker channels traverse at least one or two sublevels during deactivation. Transitions through sublevels are voltage-dependent, and the mean lifetimes of the sublevel states are in the microsecond range, too short to be analyzed by conventional methods.
HMM Analysis of Single-channel Currents
The behavior of many ion channels can be well described by finite-state Markov models, suggesting that the gating transitions occur between well-defined states (Horn 1987). Single-channel events can be analyzed by first idealizing the recording into closed and open dwells, and then fitting histograms of dwell times with mixtures of exponential functions (Colquhoun and Sigworth 1995) that reflect the dwells in various collections of states. The main problem with this approach is that the unavoidable background noise in practical recordings prevents the unambiguous detection of brief channel events, and sublevel events are particularly difficult to characterize.
The theory of hidden Markov models, which has been very successfully applied in speech recognition, was first introduced to single-channel analysis ∼10 yr ago (Chung et al. 1990). In the HMM approach, the observed current is modeled to be the sum of Gaussian noise and the noiseless signal coming from a finite state, first-order hidden Markov process that represents the channel's activity. The model parameters can be iteratively estimated using the maximum likelihood method (Baum et al. 1970). Because no idealization is involved, the method can be used with data at lower signal-to-noise ratio (or equivalently, at wider bandwidth) than conventional analysis, and the HMM method is particularly useful in identifying subconductance levels.
In early applications of HMM analysis, the background noise in successive data samples was assumed to be uncorrelated (the white noise case). The high resolution measurement of current with the patch clamp, however, inevitably yields colored noise, due to noise currents induced in the capacitance at the preamplifier input as well as noise from relaxation processes (Benndorf 1995). In their pioneering applications of HMM analysis, Chung et al. 1990, Chung et al. 1991 exploited the fact that through aliasing the noise is approximately white when the single-channel data are sampled below the Nyquist rate; however, this limits the time resolution of the analysis. Subsequent work by Fredkin and Rice 1992, Venkataramanan et al. 1998a,Venkataramanan et al. 1998b, Michalek et al. 2000 and Qin et al. 2000 have incorporated models of colored noise into HMM algorithms. Venkataramanan et al. 2000 have extended this approach to account for the fact that the data do not arise from a discrete-time process but instead from a sampled, continuous-time process. The resulting “H-noise algorithm” was used by Sunderman and Zagotta 1999a,Sunderman and Zagotta 1999b to analyze the behavior of CNG channels, and it is the algorithm that we have used here. This algorithm assumes that, at most, one transition occurs within a sampling interval, although good results are obtained when this assumption does not strictly hold. From simulations, we have found that rate values are well estimated up to at least half of the sampling rate, which was 200 kHz in our experiments.
Our application of the continuous-time HMM analysis has allowed us to deduce the properties of sublevels with mean lifetimes in the range of tens of microseconds. The existence of such sublevels has been suggested by our previous experiments on channels with mutant subunits that dramatically prolong the sublevel durations (Zheng and Sigworth 1998). In that study, we obtained indirect dwell-time estimates from amplitude histograms, but this method did not evaluate the transition rates. In the present study, we were able to estimate the transition rates, and obtain these over a voltage range to allow characterization of their voltage dependence.
Sublevels Are Associated with Subunit Gating Transitions
It has been found that gating transitions of Shaker channels are coupled to charge movements totaling ∼13 e0 (Bezanilla 2000). From analysis of the voltage dependence of channel activity (Bezanilla et al. 1994; Zagotta et al. 1994; Schoppa and Sigworth 1998b) and from gating-current fluctuations (Bezanilla 2000), it has been deduced that this large charge movement occurs in small steps, 1–2 e0 in size. In the present work, the transitions among the states C, S1, and S2 are seen to be voltage-dependent, with each transition having a predicted charge movement of ∼1.0 e0. A comparable voltage dependence (1.6 e0) was seen in channels containing the T442S mutation (Zheng and Sigworth 1997). The voltage dependence causes the lifetimes of the sublevels to diminish at more depolarized voltages, making sublevels undetectable under physiological conditions. It is interesting that the charges associated with the transition between S2 and S1 and the one between S1 and C are essentially equal. We take this as evidence that the transitions among conducting states may represent equivalent conformational changes occurring in each subunit.
Activation-coupled subconductance levels have been observed in various members of the voltage-gated potassium channel superfamily. The large conductance Ca2+-activated potassium channel appears to close through a brief sublevel 5–10% in amplitude (Ferguson et al. 1993). The Kv2.1 channel and mutants have four sublevels that are more prominent at small depolarizations (Chapman et al. 1997). Activation of a Shaker pore mutant (T442S) traverses two sublevels whose mean lifetimes are in the millisecond range (Zheng and Sigworth 1997). We now add to the list the wild-type Shaker channels. Interestingly, activation-coupled sublevels also have been observed in other multisubunit ion channels (for review see Fox 1987). These include glutamate receptor channels (Rosenmund et al. 1998; Schneggenburger and Ascher 1997), inward rectifier potassium channels (Lu et al. 2001), and CNG channels (Zimmerman and Baylor 1986; Taylor and Baylor 1995; Ruiz and Karpen 1997). In one study of mutant NMDA receptor channels, the conductance levels are seen to have differing ion selectivities (Schneggenburger and Ascher 1997). In other cases (Ruiz and Karpen 1997; Rosenmund et al. 1998), the occupancy of the various sublevels has been shown to be controlled by the number of ligands bound to the channels. Since each subunit carries a binding site, the sublevels can be pictured as arising from the asymmetrical activation of channel subunits.
Fine Structure in the Final Concerted Step of Channel Opening
Detailed studies of Shaker channel activation (Bezanilla et al. 1994; Zagotta et al. 1994; Schoppa and Sigworth 1998a, Schoppa and Sigworth 1998b) have described the early steps in the activation process to be transitions in each of the four subunits that occur independently; however, the final one or two steps before channel opening are modeled to be forwardly directed, concerted transitions that produce a steep voltage dependence of overall channel activation.
In the T442S mutant of the SNΔ channel (Zheng and Sigworth 1997), both activation and deactivation are seen to proceed in a stairstep fashion through two subconductance levels. Evidence has been presented from channels containing fewer than four T442S subunits (Zheng and Sigworth 1998) and from channels entirely lacking this mutation (the present study) that it is not the mutation that gives rise to the sublevels, instead, the mutation merely lengthens their duration. A comparison of the lifetimes of the S1 and S2 sublevels in SNΔ and the T442S variant (see Fig. 9B and Fig. C) shows that the voltage dependences are similar, but the mean lifetimes differ by a factor of ∼200. SNΔ and wild-type Shaker channels pass through these sublevels very quickly; if our estimates for the rate constants of SNΔ are extrapolated to −45 mV (the approximate half-activation voltage) Model III becomes
Figure 9.

A mutation at the ion selectivity filter dramatically affects sublevels. (A) Molecular model of the KcsA potassium channel highlighting the position of T75, which is equivalent to T442 in Shaker B. (B) A representative single-channel current trace recorded from a T442S mutant channel, SNSΔ, with the pulse protocol shown underneath. Arrows point to dwells at sublevels during deactivation. (C) Lifetimes in sublevels of the SNSΔ channel, measured by threshold analysis (open symbols), are compared with those of SNΔ channels. (D) A cartoon showing three possible gates in the Shaker channel: (1) the S6 gate; (2) the pore gate; and (3) the N-type inactivation gate.
where rates are given in seconds−1 at −45 mV and question marks denote rate constants that were not determined in the present study. The strongly forward-biased transition S1→S2 can explain much of the forwardly directed equilibrium that has been ascribed previously to the final concerted steps in channel opening. However, the S1→S2 transition is only one of three transitions that we now see to occur in rapid succession before channel opening; all of these occur on a much shorter time scale than the macroscopic activation time constant of ∼8 ms at this potential.
We conclude that the concerted transitions postulated in previous kinetic studies of Shaker channels actually contain a fine structure, in which voltage-dependent transitions in individual subunits give rise to a stairstep increase in channel conductance. However, these transitions are highly cooperative, such that they occur in very rapid succession toward the fully-open channel configuration.
Gating Role of the Outer Pore
The residue T442 corresponds to T75 at the interior end of the pore helix of the KcsA channel (Doyle et al. 1998; Fig. 9 A). In KcsA, T75 participates in binding of two potassium ions: its carbonyl and hydroxyl oxygens help form an ion binding site, and its main chain atoms contribute significantly to the stabilization of the ion in the water-filled cavity. In the present work, we conclude that the T442S mutation also has a large “gating” effect, stabilizing the various conducting states of the channel (Fig. 9B and Fig. C). This stabilization corresponds to a change in free energy of about −5 kcal/mol. It is interesting to see that a very small structural change at this position—the Thr-to-Ser mutation removes a methyl group--produces rather large gating effects.
The main activation gate of the Shaker channel has been mapped to residues at the intracellular end of the S6 transmembrane domain (Yellen 1998). Evidence for an intracellular gate dates from Armstrong's study of the interaction of intracellular blockers with the gating process (Armstrong 1971) and more detailed structural information has come from the trapping of blockers (Holmgren et al. 1997), accessibility analysis (Liu et al. 1997), and a Cd2+ cross-linking study (Holmgren et al. 1998). Most convincingly, the accessibility of intracellular Ag+ ions to an S6 cysteine is seen to increase dramatically when the channel opens (Del Camino et al. 2001). However, it seems unlikely that this main gate could also produce the subconductance levels observed in the channels, especially in view of the differing ion selectivities of the sublevels (Zheng and Sigworth 1997). An attractive hypothesis is that the transitions through sublevels involve gating transitions in a “pore gate” associated with the outer-pore region of the channel (Zheng and Sigworth 1998; Fig. 9 D). It appears that such a pore gate is the operational gate in CNG-gated channels (Sun et al. 1996; Becchetti et al. 1999; Liu and Siegelbaum 2000; Flynn and Zagotta 2001).
What is the relationship between the pore gate and the main S6 gate in a Shaker channel? During the deactivation process, the channel rapidly moves from the open state through one or more sublevels; we take these transitions to be the action of the pore gate, with each step representing a conformational change in the outer pore region reflecting a deactivation transition in an individual subunit. The channel then becomes closed (i.e., its current becomes unmeasurably small) either from further closing of the pore gate or from the eventual closing of the main gate. There are many kinetically distinguishable closed states of the channel; judging from the effects of intracellular blockers and the inactivation particle on channel-gating behavior, we expect that most of the closed states will correspond to the main gate being closed. It is quite possible that some closed states—mainly ones closest to open states—may represent states in which the main gate is open but the pore gate, although not being maximally closed, provides a sufficient barrier to ion passage that the ionic current is too small to observe.
Our speculative picture is one in which the main gate is typically the first to open during activation and the last to close during deactivation. In the T442S mutant channels (Zheng and Sigworth 1997), the final activation approach to the fully open state occurs through one or two sublevels as the pore gate responds to the final motions of voltage sensors in individual subunits. As we have shown in the present paper, the deactivation process in mutant and wild-type Shaker channels starts with brief dwells in sublevels that we take to be “partially closed” conformations of the pore gate. Coupled to the pore gate and to motions of the subunit voltage sensors, the main gate closes a short time later. This behavior is the result of a system that, at low time resolution, appears to have a single concerted transition that governs channel opening; this concerted transition results in a high voltage sensitivity for channel opening. At high resolution, this “concerted” transition is now resolved into several steps in which sublevels are traversed in very rapid succession.
Scheme S1.

Acknowledgments
We are grateful to Dr. Lily Y. Jan for the Shaker-NGK2 chimera construct, Dan Brown and Lin Ci Brown (Bruxton Corp., Seattle, WA) for their help with the application of the TAC program; and Dr. Richard Ayer and the Sutter Instrument Co. for the loan of a laser-based pipette puller. We also thank Yangyang Yan for technical assistance and Youshan Yang, Leon Islas, Qiuxing Jiang, and Kathryn Klemic (all from Yale University) for helpful discussions. J. Zheng is grateful to William N. Zagotta (University of Washington, Seattle, WA) for insights and support during the later phase of this study.
This work was supported by National Institutes of Health grant NS-21501.
Footnotes
J. Zheng's current address is Department of Physiology and Biophysics, Howard Hughes Medical Institute, University of Washington, Seattle, WA 98195-7290
Address correspondence to F.J. Sigworth, Yale University School of Medicine, Department of Cellular and Molecular Physiology, 333 Cedar Street, New Haven, CT 06520. Fax: (203) 785-4951; E-mail: fred.sigworth@yale.edu
Abbreviations used in this paper: AR, auto-regressive; HMM, hidden Markov model.
References
- Akaike H. A new look at the statistical model identification. IEEE Trans. Automatic Control. 1974;19:716–723. [Google Scholar]
- Armstrong C.M. Interaction of tetraethylammonium ion derivatives with the potassium channels of giant axons. J. Gen. Physiol. 1971;58:413–437. doi: 10.1085/jgp.58.4.413. [DOI] [PMC free article] [PubMed] [Google Scholar]
- Baum L.E., Petrie T., Soules G., Weiss N. A maximization technique occurring in the statistical analysis of probabilistic functions of Markov chanins. Ann. Math. Statist. 1970;41:164–171. [Google Scholar]
- Becchetti A., Gamel K., Torre V. Cyclic nucleotide–gated channels. Pore topology studied through the accessibility of reporter cysteines. J. Gen. Physiol. 1999;114:377–392. doi: 10.1085/jgp.114.3.377. [DOI] [PMC free article] [PubMed] [Google Scholar]
- Benndorf K. Low-noise recording. In: Sakmann B., Neher E., editors. Single-channel Recording. Plenum Press; New York: 1995. pp. 129–145. [Google Scholar]
- Bezanilla F. The voltage sensor in voltage-dependent ion channels. Physiol. Rev. 2000;80:555–592. doi: 10.1152/physrev.2000.80.2.555. [DOI] [PubMed] [Google Scholar]
- Bezanilla F., Perozo E., Stefani E. Gating of Shaker K+ channelsII. The components of gating currents and a model of channel activation. Biophys. J. 1994;66:1011–1021. doi: 10.1016/S0006-3495(94)80882-3. [DOI] [PMC free article] [PubMed] [Google Scholar]
- Chapman M.L., VanDonGen H.M., VanDonGen A.M. Activation-dependent subconductance levels in the drk1 K channel suggest a subunit basis for ion permeation and gating. Biophys. J. 1997;72:708–719. doi: 10.1016/s0006-3495(97)78707-1. [DOI] [PMC free article] [PubMed] [Google Scholar]
- Chung S.H., Moore J.B., Xia L.G., Premkumar L.S., Gage P.W. Characterization of single channel currents using digital signal processing techniques based on hidden Markov models. Philos. Trans. R. Soc. Lond. B Biol. Sci. 1990;329:265–285. doi: 10.1098/rstb.1990.0170. [DOI] [PubMed] [Google Scholar]
- Chung S.H., Krishnamurthy V., Moore J.B. Adaptive processing techniques based on hidden Markov models for characterizing very small channel currents buried in noise and deterministic interferences. Philos. Trans. R. Soc. Lond. B Biol. Sci. 1991;334:357–384. doi: 10.1098/rstb.1991.0122. [DOI] [PubMed] [Google Scholar]
- Colquhoun D., Sigworth F.J. Fitting and statistical analysis of single-channel records. In: Sakmann B., Neher E., editors. Single-channel Recording. Plenum Press; New York: 1995. pp. 95–127. [Google Scholar]
- Del Camino D., Webster S.M., Yellen G. An intracellular gate for metal cations in Shaker K+ channels Biophys. J 80 2001. 16A(Abstr [Google Scholar]
- De Biasi M., Drewe J.A., Kirsch G.E., Brown A.M. Histidine substitution identifies a surface position and confers Cs+ selectivity on a K+ pore. Biophys. J. 1993;65:1235–1242. doi: 10.1016/S0006-3495(93)81154-8. [DOI] [PMC free article] [PubMed] [Google Scholar]
- Doyle D.A., Morais Cabral J., Pfuetzner R.A., Kuo A., Gulbis J.M., Cohen S.L., Chait B.T., MacKinnon R. The structure of the potassium channelmolecular basis of K+ conduction and selectivity. Science. 1998;280:69–77. doi: 10.1126/science.280.5360.69. [DOI] [PubMed] [Google Scholar]
- Ferguson W.B., McManus O.B., Magleby K.L. Opening and closing transitions for BK channels often occur in two steps via sojourns through a brief lifetime subconductance state. Biophys. J. 1993;65:702–714. doi: 10.1016/S0006-3495(93)81097-X. [DOI] [PMC free article] [PubMed] [Google Scholar]
- Flynn G.E., Zagotta W.N. Conformational changes in S6 coupled to the opening of cyclic nucleotide-gated channels. Neuron. 2001;30:689–698. doi: 10.1016/s0896-6273(01)00324-5. [DOI] [PubMed] [Google Scholar]
- Fox J.A. Ion channel subconductance states. J. Membr Biol. 1987;97:1–8. doi: 10.1007/BF01869609. [DOI] [PubMed] [Google Scholar]
- Fredkin D.R., Rice J.A. Maximum likelihood estimation and identification directly from single-channel recordings. Proc. R. Soc. Lond. B Biol. Sci. 1992;249:125–132. doi: 10.1098/rspb.1992.0094. [DOI] [PubMed] [Google Scholar]
- Heginbotham L., Abramson T., MacKinnon R. A functional connection between the pores of distantly related ion channels as revealed by mutant K+ channels. Science. 1992;258:1152–1155. doi: 10.1126/science.1279807. [DOI] [PubMed] [Google Scholar]
- Holmgren M., Smith P.L., Yellen G. Trapping of organic blockers by closing of voltage-dependent K+ channelsevidence for a trap door mechanism of activation gating. J. Gen. Physiol. 1997;109:527–535. doi: 10.1085/jgp.109.5.527. [DOI] [PMC free article] [PubMed] [Google Scholar]
- Holmgren M., Shin K.S., Yellen G. The activation gate of a voltage-gated K+ channel can be trapped in the open state by an intersubunit metal bridge. Neuron. 1998;21:617–621. doi: 10.1016/s0896-6273(00)80571-1. [DOI] [PubMed] [Google Scholar]
- Horn R. Statistical methods for model discrimination. Applications to gating kinetics and permeation of the acetylcholine receptor channel. Biophys. J. 1987;51:255–263. doi: 10.1016/S0006-3495(87)83331-3. [DOI] [PMC free article] [PubMed] [Google Scholar]
- Hoshi T., Zagotta W.N., Aldrich R.W. Biophysical and molecular mechanisms of Shaker potassium channel inactivation. Science. 1990;250:533–538. doi: 10.1126/science.2122519. [DOI] [PubMed] [Google Scholar]
- Kamb A., Tseng-Crank J., Tanouye M.A. Multiple products of the Drosophila Shaker gene may contribute to potassium channel diversity. Neuron. 1988;1:421–430. doi: 10.1016/0896-6273(88)90192-4. [DOI] [PubMed] [Google Scholar]
- Kirsch G.E., Drewe J.A., Hartmann H.A., Taglialatela M., de Biasi M., Brown A.M., Joho R.H. Differences between the deep pores of K+ channels determined by an interacting pair of nonpolar amino acids. Neuron. 1992;8:499–505. doi: 10.1016/0896-6273(92)90278-l. [DOI] [PubMed] [Google Scholar]
- Levis R.A., Rae J.L. The use of quartz patch pipettes for low noise single channel recording. Biophys. J. 1993;65:1666–1677. doi: 10.1016/S0006-3495(93)81224-4. [DOI] [PMC free article] [PubMed] [Google Scholar]
- Liu J., Siegelbaum S.A. Change of pore helix conformational state upon opening of cyclic nucleotide-gated channels. Neuron. 2000;28:899–909. doi: 10.1016/s0896-6273(00)00162-8. [DOI] [PubMed] [Google Scholar]
- Liu Y., Holmgren M., Jurman M.E., Yellen G. Gated access to the pore of a voltage-dependent K+ channel. Neuron. 1997;19:175–184. doi: 10.1016/s0896-6273(00)80357-8. [DOI] [PubMed] [Google Scholar]
- Lopez G.A., Jan Y.N., Jan L.Y. Evidence that the S6 segment of the Shaker voltage-gated K+ channel comprises part of the pore. Nature. 1994;367:179–182. doi: 10.1038/367179a0. [DOI] [PubMed] [Google Scholar]
- Lu T., Ting A.Y., Mainland J., Jan L.Y., Schultz P.G., Yang J. Probing ion permeation and gating in a K+ channel with backbone mutations in the selectivity filter. Nat. Neurosci. 2001;4:239–246. doi: 10.1038/85080. [DOI] [PubMed] [Google Scholar]
- MacKinnon R. Determination of the subunit stoichiometry of a voltage-activated potassium channel. Nature. 1991;350:232–235. doi: 10.1038/350232a0. [DOI] [PubMed] [Google Scholar]
- Michalek S., Wagner M., Timmer J. A new approximate likelihood estimator for ARMA-filtered hidden Markov models. IEEE Trans. Sig. Proc. 2000;48:1537–1547. [Google Scholar]
- Perozo E., Cortes D.M., Cuello L.G. Structural rearrangements underlying K+ channel activation gating. Science. 1999;285:73–78. doi: 10.1126/science.285.5424.73. [DOI] [PubMed] [Google Scholar]
- Qin F., Auerbach A., Sachs F. Hidden Markov modeling for single channel kinetics with filtering and correlated noise. Biophys. J. 2000;79:1928–1944. doi: 10.1016/S0006-3495(00)76442-3. [DOI] [PMC free article] [PubMed] [Google Scholar]
- Rosenmund C., Stern-Bach Y., Stevens C.F. The tetrameric structure of a glutamate receptor channel. Science. 1998;280:1596–1599. doi: 10.1126/science.280.5369.1596. [DOI] [PubMed] [Google Scholar]
- Ruiz M.L., Karpen J.W. Single cyclic nucleotide-gated channels locked in different ligand- bound states. Nature. 1997;389:389–392. doi: 10.1038/38744. [DOI] [PubMed] [Google Scholar]
- Schneggenburger R., Ascher P. Coupling of permeation and gating in an NMDA-channel pore mutant. Neuron. 1997;18:167–177. doi: 10.1016/s0896-6273(01)80055-6. [DOI] [PubMed] [Google Scholar]
- Schoppa N.E., Sigworth F.J. Activation of Shaker potassium channels. I. Characterization of voltage-dependent transitions J. Gen. Physiol 111 1998. 271 294a [DOI] [PMC free article] [PubMed] [Google Scholar]
- Schoppa N.E., Sigworth F.J. Activation of Shaker potassium channels. III. An activation gating model for wild-type and V2 mutant channels J. Gen. Physiol 111 1998. 313 342b [DOI] [PMC free article] [PubMed] [Google Scholar]
- Schwarz T.L., Tempel B.L., Papazian D.M., Jan Y.N., Jan L.Y. Multiple potassium-channel components are produced by alternative splicing at the Shaker locus in Drosophila . Nature. 1988;331:137–142. doi: 10.1038/331137a0. [DOI] [PubMed] [Google Scholar]
- Sigworth F.J. Electronic design of the patch clamp. In: Sakmann B., Neher E., editors. Single-channel Recording. Plenum Press; New York: 1995. pp. 95–127. [Google Scholar]
- Sokolova O., Kolmakova-Partensky L., Grigorieff N. Three-dimensional structure of a voltage-gated potassium channel at 2.5 nm resolution. Structure. 2001;9:215–220. doi: 10.1016/s0969-2126(01)00578-0. [DOI] [PubMed] [Google Scholar]
- Sun Z.P., Akabas M.H., Goulding E.H., Karlin A., Siegelbaum S.A. Exposure of residues in the cyclic nucleotide-gated channel poreP region structure and function in gating. Neuron. 1996;16:141–149. doi: 10.1016/s0896-6273(00)80031-8. [DOI] [PubMed] [Google Scholar]
- Sunderman E.R., Zagotta W.N. Mechanism of allosteric modulation of rod cyclic nucleotide-gated channels J. Gen. Physiol 113 1999. 601 620a [DOI] [PMC free article] [PubMed] [Google Scholar]
- Sunderman E.R., Zagotta W.N. Sequence of events underlying the allosteric transition of rod cyclic nucleotide-gated channels J. Gen. Physiol 113 1999. 621 640b [DOI] [PMC free article] [PubMed] [Google Scholar]
- Taylor W.R., Baylor D.A. Conductance and kinetics of single cGMP-activated channels in salamander rod outer segments. J. Physiol. 1995;483:567–582. doi: 10.1113/jphysiol.1995.sp020607. [DOI] [PMC free article] [PubMed] [Google Scholar]
- Venkataramanan L., Kuc R., Sigworth F.J. Identification of hidden Markov models for ion channel currents--part IIstate-dependent excess moise IEEE Trans. Sig. Proc. 46 1998. 1916 1929a [Google Scholar]
- Venkataramanan L., Walsh J.L., Kuc R., Sigworth F.J. Identification of hidden Markov models for ion channel currents–part Icolored background noise IEEE Trans. Sig. Proc. 46 1998. 1901 1915b [Google Scholar]
- Venkataramanan L., Kuc R., Sigworth F.J. Identification of hidden Markov models for ion channel currents–part IIIbandlimited, sampled data. IEEE Trans. Sig. Proc. 2000;48:376–385. [Google Scholar]
- Yellen G. The moving parts of voltage-gated ion channels. Q. Rev. Biophys. 1998;31:239–295. doi: 10.1017/s0033583598003448. [DOI] [PubMed] [Google Scholar]
- Yellen G., Jurman M.E., Abramson T., MacKinnon R. Mutations affecting internal TEA blockade identify the probable pore- forming region of a K+ channel. Science. 1991;251:939–942. doi: 10.1126/science.2000494. [DOI] [PubMed] [Google Scholar]
- Yool A.J., Schwarz T.L. Alteration of ionic selectivity of a K+ channel by mutation of the H5 region. Nature. 1991;349:700–704. doi: 10.1038/349700a0. [DOI] [PubMed] [Google Scholar]
- Yool A.J., Schwarz T.L. Interactions of the H5 pore region and hydroxylamine with N-type inactivation in the Shaker K+ channel. Biophys. J. 1995;68:448–458. doi: 10.1016/S0006-3495(95)80206-7. [DOI] [PMC free article] [PubMed] [Google Scholar]
- Zagotta W.N., Hoshi T., Aldrich R.W. Restoration of inactivation in mutants of Shaker potassium channels by a peptide derived from ShB. Science. 1990;250:568–571. doi: 10.1126/science.2122520. [DOI] [PubMed] [Google Scholar]
- Zagotta W.N., Hoshi T., Aldrich R.W. Shaker potassium channel gating. IIIEvaluation of kinetic models for activation. J. Gen. Physiol. 1994;103:321–362. doi: 10.1085/jgp.103.2.321. [DOI] [PMC free article] [PubMed] [Google Scholar]
- Zheng J., Sigworth F.J. Selectivity changes during activation of mutant Shaker potassium channels. J. Gen. Physiol. 1997;110:101–117. doi: 10.1085/jgp.110.2.101. [DOI] [PMC free article] [PubMed] [Google Scholar]
- Zheng J., Sigworth F.J. Intermediate conductances during deactivation of heteromultimeric Shaker potassium channels. J. Gen. Physiol. 1998;112:457–474. doi: 10.1085/jgp.112.4.457. [DOI] [PMC free article] [PubMed] [Google Scholar]
- Zhou M, Morais-Cabral J.H., Mann S., MacKinnon R. Potassium channel receptor site for the inactivation gate and quaternary amine inhibitors. Nature. 2001;411:657–661. doi: 10.1038/35079500. [DOI] [PubMed] [Google Scholar]
- Zimmerman A.L., Baylor D.A. Cyclic GMP-sensitive conductance of retinal rods consists of aqueous pores. Nature. 1986;321:70–72. doi: 10.1038/321070a0. [DOI] [PubMed] [Google Scholar]