

Abstract
The ability of membrane voltage to activate high conductance, calcium-activated (BK-type) K+ channels is enhanced by cytosolic calcium (Ca2+). Activation is sensitive to a range of [Ca2+] that spans over four orders of magnitude. Here, we examine the activation of BK channels resulting from expression of cloned mouse Slo1 α subunits at [Ca2+] and [Mg2+] up to 100 mM. The half-activation voltage (V0.5) is steeply dependent on [Ca2+] in the micromolar range, but shows a tendency towards saturation over the range of 60–300 μM Ca2+. As [Ca2+] is increased to millimolar levels, the V0.5 is strongly shifted again to more negative potentials. When channels are activated by 300 μM Ca2+, further addition of either mM Ca2+ or mM Mg2+ produces similar negative shifts in steady-state activation. Millimolar Mg2+ also produces shifts of similar magnitude in the complete absence of Ca2+. The ability of millimolar concentrations of divalent cations to shift activation is primarily correlated with a slowing of BK current deactivation. At voltages where millimolar elevations in [Ca2+] increase activation rates, addition of 10 mM Mg2+ to 0 Ca2+ produces little effect on activation time course, while markedly slowing deactivation. This suggests that Mg2+ does not participate in Ca2+-dependent steps that influence current activation rate. We conclude that millimolar Mg2+ and Ca2+ concentrations interact with low affinity, relatively nonselective divalent cation binding sites that are distinct from higher affinity, Ca2+-selective binding sites that increase current activation rates. A symmetrical model with four independent higher affinity Ca2+ binding steps, four voltage sensors, and four independent lower affinity Ca2+/Mg2+ binding steps describes well the behavior of G-V curves over a range of Ca2+ and Mg2+. The ability of a broad range of [Ca2+] to produce shifts in activation of Slo1 conductance can, therefore, be accounted for by multiple types of divalent cation binding sites.
Keywords: K1 channels, Ca21- and voltage-gated K1 channels, Slo1 channels, stochastic models, channel kinetics
INTRODUCTION
Most ion channels open in response to a change in a single, primary physiological parameter. In contrast, activation of Ca2+- and voltage-dependent large conductance Ca2+-activated K+ (BK) channels is complicated by the fact that two parameters govern channel opening. Membrane depolarization and binding of Ca2+ ions interact in some way to bring about an increase in channel open probability. The dependence on Ca2+ is particularly remarkable in that the ability of voltage to open BK channels can be shifted by over four log orders of [Ca2+] (Moczydlowski and Latorre 1983; Meera et al. 1996; Cox et al. 1997a; Cui et al. 1997). Although the voltage dependence of BK channel gating is thought to arise from a mechanism involving voltage-sensing residues in the S4 segment (Diaz et al. 1998; Horrigan et al. 1999; Horrigan and Aldrich 1999; Cui and Aldrich 2000), which is similar to the voltage-dependent K+ channel family, the precise mechanism by which Ca2+ exerts its effects remain unknown. Some of the effects of Ca2+ may be mediated by interaction of Ca2+ with a patch of negatively charged residues, termed the “Ca2+ bowl,” located just before the S10 hydrophobic segment near the COOH terminus of the Slo α subunit (Schreiber and Salkoff 1997; Schreiber et al. 1999). Residues just upstream of the Ca2+ bowl may also participate in defining the Ca2+-regulatory domain (Braun and Sy 2001). However, how this Ca2+-sensing domain may mediate its effects remains unknown. Moreover, there are several studies that indicate that Ca2+ and/or other divalent cations may also allosterically modulate BK gating (Golowasch et al. 1986; Oberhauser et al. 1988; Solaro et al. 1995; Shi and Cui 2001a).
The relationship between V0.5 and cytosolic Ca2+ has provided a convenient descriptive tool to evaluate the Ca2+ dependence of activation of BK current, an approach first employed by Moczydlowski and Latorre 1983. In this landmark paper (Moczydlowski and Latorre 1983), the probability of being open of single skeletal muscle BK channels as a function of Ca2+ and voltage was examined in bilayers. Over [Ca2+] from near 1 μM to almost 10 mM, the V0.5 varied as an essentially linear function of pCa, leading them to propose that Ca2+ binding, per se, is the voltage-dependent step in BK channel activation. More recently, a number of labs have investigated the Ca2+ dependence of activation of cloned α subunits encoding BK-type channels using primarily macroscopic current measurements (Wei et al. 1994; Meera et al. 1996; Cox et al. 1997a) and found that the relationship between V0.5 and pCa may not be quite so simple. Most notably, over a range of [Ca2+] from near 0.5 nM to ∼50 nM, currents resulting from expression of cloned subunits appear to be fully activated with sufficiently high voltage, but in a Ca2+-independent fashion (Cui et al. 1997; Horrigan et al. 1999). Furthermore, the G-V curve for activation and the time constant of current activation remains relatively insensitive to Ca2+ over the range of 5 to ∼50 nM Ca2+ (Cui et al. 1997). However, over the range of Ca2+ from ∼0.5 to ∼100 μM, V0.5 shifts to more negative potentials, before beginning to exhibit some saturation from ∼100 μM to 1 mM (Wei et al. 1994; Cox et al. 1997a; Cui et al. 1997). The extent of this saturation appears to exhibit some variability among work from different labs or even within the same lab (Wei et al. 1994; Meera et al. 1996; Cox et al. 1997a; Cui et al. 1997; Wallner et al. 1999), although the reasons for this remain unclear. To account for the Ca2+ dependence of the shift in G-V curves, activation models involving separate and independent Ca2+ binding and voltage-dependent steps have proven useful (Cox et al. 1997a; Horrigan et al. 1999; Rothberg and Magleby 1999; Cox and Aldrich 2000; Cui and Aldrich 2000). However, an additional feature of activation of cloned BK channels (Wei et al. 1994; Solaro et al. 1995; Meera et al. 1996) and native BK channels (Moczydlowski and Latorre 1983) is that, as Ca2+ is raised above 1 mM, there appears to be an additional shift in the V0.5, which is inconsistent with most current models of Ca2+ dependence of BK activation. As yet, these effects of mM concentrations of Ca2+ are not understood.
In addition to its ability to shift gating over such a broad concentration range, one of the remarkable characteristics of the ability of Ca2+ to promote activation of BK channels is its high selectivity over other divalent cations. In particular, although both Sr2+ and Mn2+ can activate BK channels in the absence of Ca2+, they are relatively ineffective compared with Ca2+ (Oberhauser et al. 1988). Other divalent cations such as Mg2+, Ni2+, and Pb2+ are ineffective at opening BK channels effects (Oberhauser et al. 1988), although Mg2+ and Ni2+, but not Pb2+, enhance activation of channels already activated by Ca2+ (Golowasch et al. 1986; Oberhauser et al. 1988). The enhancement of activation involves an increase in the apparent Hill coefficient for activation by Ca2+ (Golowasch et al. 1986; Oberhauser et al. 1988). Together, these earlier results raise the possibility that multiple kinds of divalent cation binding sites may regulate BK channel gating, thereby perhaps accounting, in part, for the ability of Ca2+ to modulate BK gating over such a wide range of [Ca2+].
To address these issues, we have examined effects of millimolar [Ca2+] on the gating of currents resulting from expression of the mSlo1 α subunit and compared this with the ability of Mg2+ to alter currents resulting from activation by various concentrations of Ca2+. We show that the enhancement in BK current activation by [Ca2+] of 1 mM and greater or by millimolar Mg2+ added to Ca2+-containing solutions can be accounted for by a low affinity, divalent cation binding site that affects channel activation in a way quite distinct from the effects of μM Ca2+. The enhancement by Mg2+ occurs in the complete absence of Ca2+, which indicates that Mg2+ does not modify Ca2+ binding steps. Furthermore, Mg2+ does not substitute for Ca2+ at the high affinity Ca2+ binding sites. The shifts in gating produced by millimolar Mg2+ do not involve increases in current activation rates, but do involve a slowing of the return to closed states. Thus, qualitatively, millimolar concentrations of divalents appear to enhance BK activation by affecting the closed-to-open channel equilibrium without direct effects on Ca2+ affinities. A similar conclusion has also been drawn in the companion paper by Shi and Cui 2001b. To account for these observations, we propose a simple extension of a specific two-tiered 50-state activation model proposed by Cox and Aldrich 2000. We postulate that, in addition to the regulation of Slo1 gating by four independent high affinity Ca2+ binding steps and independent movement of four voltage sensors, binding of Mg2+ also allosterically regulates Slo1 opening independent of Ca2+ binding and voltage-sensor movement. Such a model accurately reproduces the behavior of G-V curves for Ca2+ from 0 to 100 mM, with Mg2+ from 1 to 100 mM. The analysis suggests that, although Mg2+ and Ca2+ appear to have similar effects at millimolar concentrations, the affinities of Ca2+ to the low affinity sites on open and closed channels are about seven- to eightfold greater than the affinities of Mg2+, which indicates that under physiological conditions, the low affinity sites may participate in the regulation of BK channel gating. The success of this model is improved by taking into account the proposal that millimolar Mg2+ acts not only to promote activation through the low affinity site, but also to inhibit Ca2+ binding at the high affinity Ca2+ binding site (see Shi and Cui 2001b, in this issue).
MATERIALS AND METHODS
Oocyte Removal and Culture
Mature stage IV Xenopus laevis oocytes were prepared for injection as described in previous work (Wei et al. 1994; Xia et al. 1999; Lingle et al. 2001; Zeng et al. 2001).
Constructs
The mSlo1 (Butler et al. 1993) construct used in initial experiments was provided by L. Salkoff (Washington University) and is identical to that used in earlier work (Wei et al. 1994). In more recent experiments, mSlo1 was placed in an alternative vector (Xia et al. 1999). No differences in physiological properties have been observed between the two constructs.
Recording Pipettes
Patch-clamp recording pipettes were made by pulling borosilicate capillary tubes (Drummond Microcaps; 100 μl) to a tip diameter of ∼1 μM. Pipette resistances (Rp) measured in recording salines ranged from 1.5 to 10 MΩ for single-channel recordings and from 1.5 to 3 MΩ for macroscopic currents. Because of the large currents obtained with Slo1 expression, the series resistance (Rs) associated with the pipette may result in nominal voltage values that are different from the true applied voltage. In most experiments, we only used patches in which the maximal current at +100 mV was ∼5 nA or less. Although larger currents were typically associated with pipettes of smaller Rp, in the worst cases currents may still result in a voltage errors of 5–15 mV. However, close examination of the G-V curves from individual patches used to generate the averaged G-V curves of Fig. 2 B does not reveal any systematic correlation of V0.5 with current density at any [Ca2+]. All voltage values reported here have been uncorrected for possible series resistance errors.
Figure 2.
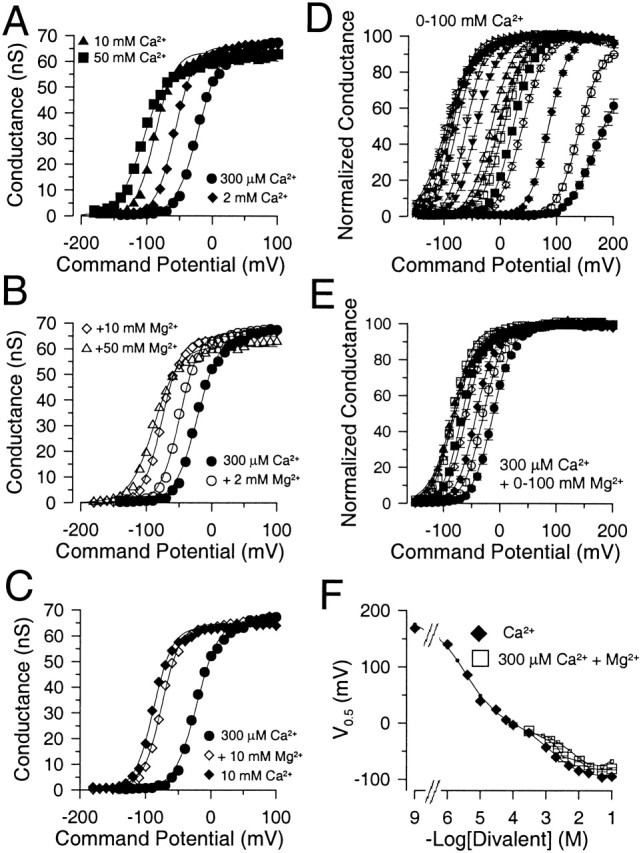
High concentrations of Ca2+ and Mg2+ are similarly effective at shifting current activation. In A, G-V curves were generated from tail currents obtained with 300 μM, 2 mM, 10 mM and 50 mM Ca2+ (patch in Fig. 1). Solid lines are fits of , with values for V0.5 of −21.5 ± 1.0 mV (k = 17.1 mV), −57.1 ± 0.7 mV (k = 14.6 mV), −87.5 ± 0.7 mV (k = 14.4 mV) and −104.5 ± 1.1 mV (k = 19.0 mV), for 300 μM–50 mM Ca2+, respectively. In B, G-V curves from the same patch as in A are shown for currents obtained with 300 μM Ca2+, and 300 μM Ca2+ with either 2, 10, or 50 mM added Mg2+. Values for V0.5 for 2, 10, and 50 mM Mg2+ containing solutions were as follows:−48.7 ± 1.0 mV (k = 14.8 mV), −75.5 ± 0.8 mV (k = 14.5 mV), and −87.4 ± 1.1 mV (k = 18.7 mV), respectively. In C, G-V curves are shown for 300 μM Ca2+, 20 mM Ca2+, and 300 μM Ca2+ + 20 mM Mg2+. In D, the mean conductance measured as a function of voltage is displayed for a set of patches over a range of Ca2+ concentrations from 0 to 100 mM. Solid lines are fits of . For 0 Ca2+ (•), V0.5 = 168.5 ± 2.2 mV, k = 22.4 ± 1.0 mV; for 1 μM Ca2+ (○), V0.5 = 136.89 ± 0.9 mV, k = 18.8 ± 0.7 mV; for 4 μM (♦), V0.5 = 85.2 ± 0.6 mV, k = 16.9 ± 0.5 mV; for 10 μM (⋄), V0.5 = 39.0 ± 0.5 mV, k = 19.1 ± 0.5 mV; for 30 μM (▪), V0.5 = 22.4 ± 0.5 mV, k = 17.9 ± 0.4 mV; for 60 μM (□), V0.5 = 5.8 ± 0.8 mV, k = 19.3 ± 0.5 mV; for 100 μM (▴), V0.5 = −2.4 ± 0.7 mV, k = 21.2 ± 0.5 mV; for 300 μM (▵), V0.5 = −15.9 ± 0.6 mV, k = 18.9 ± 0.5 mV; for 1 mM (▾), V0.5 = −42.4 ± 0.6, k = 18.4 ± 0.5 mV; for 2 mM (▿), V0.5 = −60.5 ± 0.6 mV, k = 15.6 ± 0.5 mV; for 5 mM (▸), V0.5 = −77.6 ± 0.8 mV, k = 16.9 ± 0.7 mV; for 10 mM (▹), V0.5 = −85.2 ± 0.8 mV, k = 16.5 ± 0.7 mV; for 20 mM (◂), V0.5 = −89.3 ± 0.8 mV, k = 19.0 ± 0.7 mV; for 50 mM (◃), V0.5 = −97.9 + 1.1 mV, k = 22.2 ± 0.9 mV; and for 100 mM (★), V0.5 = −93.5 ± 0.9 mV, k = 22.5 ± 0.8 mV. Each point represents the mean with SD of from 4 to 12 patches. In E, G-V curves were generated from a set of patches (mean and SD for 4–19 patches) with 300 μM Ca2+ with various Mg2+ concentrations. Solid lines are fits of . For 300 μM (•), V0.5 = −11.6 ± 0.5 and k = 17.8 ± 0.5 mV; with 1 mM Mg2+ (○), V0.5 = −28.5 ± 0.7 mV, k = 17.4 ± 0.6 mV; with 2 mM Mg2+ (♦), V0.5 = −41.4 ± 0.6 mV, k = 17.1 ± 0.5 mV; with 5 mM Mg2+ (⋄), V0.5 = −58.4 ± 0.6 mV, k = 16.9 ± 0.6 mV; with 10 mM Mg2+ (▪), V0.5 = −67.1 ± 0.7 mV, k = 16.5 ± 0.6 mV; with 20 mM Mg2+ (□), V0.5 = −82.6 ± 0.8 mV, k = 16.8 ± 0.7 mV; with 50 mM Mg2+ (▴), V0.5 = −82.8 ± 1.4 mV, k = 21.6 ± 1.3 mV; and 100 mM Mg2+ (▵), V0.5 = −79.6 ± 1.3 mV, k = 21.3 ± 1.1 mV. In F, V0.5 values measured in D and E are plotted as a function of the indicated divalent cation concentration for either solutions with Ca2+ alone (♦) or for 300 μM Ca2+ with added Mg2+ (□). The 5 mM EGTA, 0 Ca2+ solution was plotted as 10−9 M. Solid lines with small filled circles (Ca2+ alone) and small open squares (300 μM Ca2+ plus Δ[Mg2+]) represents expectations derived from a fit of Fig. 1 (values from Table , column D) to the G-V curves in Fig. 2 D.
Pipette tips and shanks were coated with a silicone elastomer (Sylgard 184; Dow Chemical Corp.) and firepolished. A pipette was then filled with an appropriate recording saline and placed over a chloridized silver wire attached to the recording headstage. For some experiments, the reference electrode was a silver chloride pellet immersed in 3M KCl which, in turn, was connected to the recording dish by a KCl-agar bridge (4% agar in 3M KCl). In other experiments, a silver chloride pellet alone was used.
Electrophysiology
Calcium- and voltage-activated potassium channel currents were recorded in the inside-out configuration according to standard procedures (Hamill et al. 1981) using an Axopatch 1C amplifier (Axon Instruments, Inc.) with a 50-GΩ feedback resistor and the Clampex program from the pClamp software package (Axon Instruments, Inc.). Currents were recorded in patches pulled from oocytes 1–9 d after injection with cRNAs. Patches used to construct conductance/voltage relationships typically contained large numbers (>50) of Slo1 channels. The room temperature for these experiments was ∼23°C.
Gigaohm seals were formed on oocytes bathed in normal frog Ringer's solution ([in mM] 115 NaCl, 2.5 KCl, 1.8 CaCl2, and 10 HEPES, pH 7.4) and, after excision, were transferred to test solutions containing calcium. Pipette/extracellular solution was (in mM) 140 potassium methanesulfonate, 20 KOH, 10 HEPES, and 2 MgCl2, pH 7.0. Test solutions bathing the cytoplasmic face of the patch membrane contained (in mM): 140 potassium methanesulfonate, 20 KOH, and 10 HEPES, pH 7.0 and one of the following: 5 EGTA, for nominally 0 Ca2+ and for 1 μM Ca2+ solutions; 5 HEDTA for 4 and 10 μM Ca2+; or no added Ca2+ buffer for solutions of 30 μM Ca2+ and higher. In earlier experiments (Solaro et al. 1995), solutions were calibrated (93-20 Ca2+ sensor; Orion) against chloride-based solutions in which free Ca2+ was determined using the EGTAETC computer program (E. McCleskey, Vollum Institute). Solutions for more recent experiments were calibrated with commercial Ca2+ calibration solutions (WPI). Comparison of our chloride-based solutions with the commercial standards yielded similar estimates of Ca2+ concentrations.
Mixed Ca2+/Mg2+ solutions were prepared as follows. A 2-M MgCl2 stock solution (crystalline MgCl2; Puratronic, 99.999%; Alfa-Aesar; <0.001% Ca2+ contamination) was prepared with Chelex (Sigma-Aldrich)-treated distilled H2O. Based on the manufacturer's estimate of the Ca2+ contamination in the original MgCl2 material, the 2- M MgCl2 stock should have contained <20 μM Ca2+, which would contribute negligible amounts of Ca2+ at the dilutions we have used. The concentration of Ca2+ in Chelex-treated KCl-based solutions was below the limits of Ca2+ electrode resolution, but yielded G-V curves from Slo1 channels similar to those obtained with solutions with 0 Ca2+, 5 mM EGTA. For K+-MES–based solutions, we were unable to reduce background Ca2+ with Chelex below 1 μM. Without Chelex treatment, electrode readings indicated that K+-MES solutions with no added Ca2+ typically contained 10–15 μM free Ca2+. For unbuffered Ca2+ solutions (K+-MES) of 30 μM Ca2+ and higher, Mg2+ was simply added to make the appropriate concentration from the 2-M MgCl2 stock solution. For additions of Mg2+ to solutions containing 0 μM Ca2+, 5 mM EGTA, we simply added MgCl2 directly to result in the nominal concentrations of Mg2+ indicated in the results.
Based on published stability constants for EGTA, Mg2+, Ca2+, and H+, we estimated the consequences of this addition using EQCALWIN (Biosoft). If we assume a worst case maximal contaminant [Ca2+] from all sources of 30 μM (K+-MES stock, MgCl2 stock, deionized water), with 5 mM EGTA and 100 mM MgCl2, the calculated free Ca2+ and free Mg2+ is 9.6 nM and 97 mM, respectively. At 10 mM nominal MgCl2, the calculated free Ca2+ and free Mg2+ is 2.71 nM and 8.8 mM, respectively. With no added MgCl2, the calculated free Ca2+ is 2.0 nM. Slo1 currents have been shown to be unaffected by changes in free Ca2+ over the range of 0.5–50 nM (Cui et al. 1997). Thus, the effects observed with 0 Mg2+ are unlikely to result from contamination by Ca2+. In reporting the results, we have used the nominal values for free [Mg2+], corresponding to a maximum error of ∼15% in the actual [Mg2+] at the lower concentrations of Mg2+ (1 mM). These errors do not apply to the unbuffered solutions.
In one set of experiments, unbuffered 0-, 4-, and 10-μM Ca2+ solutions were prepared using KCl (rather then K-MES). For preparation of these solutions, a 1-M KCl stock solution was stirred with Chelex for 2–3 h. Finally, after calibration of the Ca2+-sensitive electrode, aliquots of a 10-mM CaCl2 solution were added until the desired electrode reading was achieved. MgCl2 was subsequently added by dilution from the 2-M Mg2+ stock solution. The properties of a 0-Ca2+ solution prepared in this way and compared with the 0-Ca2+, 5-mM EGTA solutions (as described in Electrophysiology) indicated that the background Ca2+ was in the low nanomolar range. Despite the fact after addition of MgCl2 such a 10-mM Mg2+ solution should contain <1 μM contaminant Ca2+, we were still concerned that the effects of addition of Mg2+ to solutions with low [Ca2+] might result from addition of contaminant Ca2+. However, results indicate that some aspects of the kinetic alterations resulting from addition of Mg2+ are inconsistent with the possibility that the effects are being produced by additional Ca2+. In patches, in which 0-, 4-, and 10-μM unbuffered Ca2+ solutions were examined, control solutions with buffered 0, 4 and 10 μM Ca2+ were also examined to ensure that solutions with similar concentrations yielded similar results. The similarity of the G-V curves obtained with both buffered and unbuffered Ca2+ suggests that intrinsic Ca2+ buffering associated with components of the excised patch are minimal. EQCALWIN also was used to calculate expected free Mg2+ and free Ca2+ in ATP-containing solutions using published stability constants (Martell and Smith 1975).
For these experiments, we frequently used divalent cation concentrations up to 100 mM Mg2+ or Ca2+. This resulted in solutions with elevated osmolarity compared with the usual solutions containing 1 mM or lower Ca2+. Such solutions also contain elevated Cl−. We were concerned that these factors might, therefore, influence the conductance-voltage curves, which is independent of the divalent cation concentrations. Several control experiments were done. First, the effect of adding Mg2+ as either MgCl2 or MgSO4 was compared and found to be identical. Second, we prepared 300-μM Ca2+ solutions with added 150 mM N-methylglucamine (NMG) and found that for a set of four patches, G-V curves were identical for 300 μM Ca2+ either with (V0.5 = −23.1 ± 3.2 mV) or without (V0.5 = −20.5 ± 5.6 mV) NMG. Thus, the increase in osmolarity and ionic strength resulting from the addition of NMG does not have a substantial effect on G-V curves activated by 300 μM Ca2+. Similarly, current activation time constants were identical in the two cases. However, with 150 mM NMG, there was a weak voltage-dependent reduction in outward current, perhaps reflecting a weak, rapid blocking effect of NMG on the channel.
Solution Exchange
Solution exchange and drug applications were accomplished with a multibarrel solution delivery system as used previously described (Wei et al. 1994; Herrington et al. 1995; Zeng et al. 2001). In this system, six to seven polyethylene 10 (PE10) tubes were packed into the end of a glass tube that was tapered at one end to an ∼ 50-μm open tip. Solution flowed through one line at all times, and complete solution exchange at the patch membrane required ∼100 ms.
Data Analysis
Analysis of current recordings was done either with Clampfit (Axon Instruments, Inc.) or with programs written in this laboratory. For analysis of patches with one or two channels, leakage subtraction was accomplished by subtracting from the experimental records either an average of records in which no channels opened (either by chance or during perfusion with zero Ca2+ saline) or by subtracting an idealized sweep (using a sweep obtained in 0 Ca2+ as a template) generated to match the experimental leak current. Ensemble averages of BK channel probability of being open (Po) were generated from idealized single-channel current records using a 50% threshold detection algorithm. The single-channel open level was given a value of one and the single-channel closing level was given a value of zero. When the number of channels in the patch (N) is known, average Po can be calculated directly by averaging the idealized records and dividing the average by N. Currents or extracted data were fit using a Levenberg-Marquardt search algorithm to obtain nonlinear least-squares estimates of function parameters.
G-V curves were constructed primarily from tail currents measured 100–200 μs after repolarization and, in some cases, from the peak current measured at a given voltage. Typically, the absolute value of maximal conductance was similar at Ca2+ concentrations between 4 and 300 μM, whereas at lower or higher Ca2+, the observed value for maximal conductance was smaller. In such cases, conductance estimates were normalized to the maximal value observed over the range of 10–300 μM Ca2+. Individual G-V curves were typically fit with a standard Boltzmann function of the following form:
 |
1 |
where Gmax is the fitted value for maximal conductance, V0.5 is the voltage of half maximal activation of conductance, and k is the term for the voltage dependence of activation in units of mV.
Fitting of G-V curves to equations defined by particular kinetic models was done with our own software in which a Levenberg-Marquardt optimization routine was used to perform a nonlinear least-squares minimization. To confirm the validity of the implementation of the fitting routine, for any given set of parameter values defined by a given function (e.g., see ), the curves defined by the function were also checked with an implementation of the function in Mathcad (Mathsoft).
RESULTS
Millimolar Concentrations of Mg2+ and Ca2+ Produce Similar Shifts in the Voltage of Half Activation (V0.5).
Fig. 1 shows currents from an excised inside-out patch expressing mSlo1 α subunits. On the left, currents were activated with 300 μM, 2 mM, 10 mM, and 50 mM Ca2+. On the right, currents were activated with 300 μM Ca2+ with 2, 10, and 50 mM Mg2+. Qualitatively, it can be seen that the effect produced by increases in [Ca2+] above 300 μM appear to be mimicked by comparable increases in [Mg2+].
Figure 1.
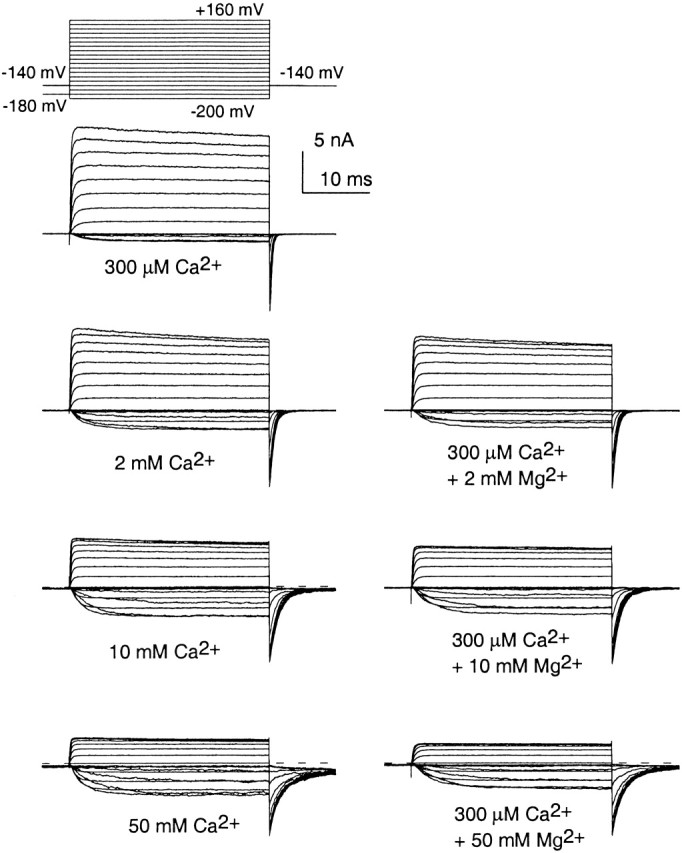
Similar enhancement of Slo1 current activation by high concentrations of either Ca2+ and Mg2+. Each family of traces shows currents from the same inside-out patch from a Xenopus oocyte, expressing mSlo1 α subunits. Currents were activated by the voltage protocol shown on the top left with the indicated divalent cation concentrations applied to the cytosolic face of the patch. On the left, traces were obtained with 300 μM Ca2+, 2 mM Ca2+, 10 mM Ca2+ and 50 mM Ca2+ from top to bottom. On the right, each family of traces was obtained with 300 μM Ca2+ but with added 2, 10, and 50 mM Mg2+ from top to bottom. Tail currents were recorded at −140 mV. For solutions containing 10 and 50 mM divalent, the potential before the activation steps (−200 to +160 mV) was −180 mV, and −140 in other cases. Note the strong slowing of deactivation with either Ca2+ and Mg2+, the similar activation of current with additions of mM Ca2+ or Mg2+, and the strong block of current at positive activation potential at higher divalent concentrations.
Fig. 2 A shows corresponding conductance-voltage relationships (G-Vs) determined from measurements of tail current for the four Ca2+ concentrations illustrated in Fig. 1, whereas Fig. 2 B shows the effects of additions of Mg2+ to current activated by 300 μM Ca2+. In Fig. 2 C, G-V curves resulting from 300 μM Ca2+, 10 mM Ca2+ and 300 μM Ca2+ plus 10 mM Mg2+ are directly compared. It can be seen that once current is activated by 300 μM Ca2+, additions of either Ca2+ or Mg2+ are relatively comparable in their ability to shift G-V curves.
High concentrations of Ca2+ also block Slo1 currents. This block is indicated by the voltage-dependent reduction of current at the most positive activation voltages in the presence of 10 and 50 mM Ca2+ (Fig. 1). Mg2+ also produces a similar voltage-dependent reduction of peak current. This reduction in peak macroscopic conductance is almost entirely mediated by fast channel block (Vergara and Latorre 1983; Ferguson 1991), which can be seen in the reduction of single-channel current amplitude with high [Ca2+] (data not shown for Ca2+ [unpublished data], but see results in Fig. 3 with Mg2+ below).
Figure 3.

Millimolar Mg2+ and Ca2+ produce similar shifts to more negative potentials in the relationship between open probability and voltage. In A, traces show currents from an inside-out patch containing two BK channels. Patches were held at −40 mV with repeated voltage steps to either +60 mV (A1 and A3), or −60 mV (A2 and A4). On the left (A1 and A2), channels were activated with 300 μM Ca2+, whereas on the right (A3 and A4) channels were activated with 300 μM Ca2+ plus 10 mM Mg2+. In each panel, the ensemble average expressed in units of probability of being open (Po) is plotted at the bottom. At +60 mV, the addition of Mg2+ has little effect on Po, but reduces the single-channel current amplitude. At −60 mV, Mg2+ produces a substantial increase in Po, with only a mild reduction in the single-channel amplitude. In B, Po estimates obtained from the ensemble averages are plotted as a function of command potential for the patch shown in A. Solid lines are fits of . At 300 μM Ca2+, fitted values with 90% confidence limits were gmax = 0.89 ± 0.02, V0.5 = −30.7 ± 5.1 mV, and k = 19.2 ± 4.4 mV; for 300 μM Ca2+ plus 10 mM Mg2+, gmax = 0.91 ± 0.01, V0.5 = −81.0 ± 1.0 mV, and k = 17.9 ± 1.0 mV. In C, Po versus voltage is plotted for a different patch showing that activation by 10 mM Ca2+ is similar to that produced by 10 mM Ca2+ plus 10 mM Mg2+. Fitted values were as follows: for 100 μM Ca2+, gmax = 0.83 ± 0.02, V0.5 = −16.5 ± 4.9 mV, and k = 19.4 ± 2.7 mV; for 100 μM Ca2+ plus 10 mM Mg2+, gmax = 0.94 ± 0.11, V0.5 = −66.2 ± 8.9 mV, and k = 21.3 ± 8.5 mV; for 10 mM Ca2+, gmax = 0.91 ± 0.06, V0.5 = −89.2 ± 5.4 mV, and k = 25 ± 6.9 mV; and for 10 mM Ca2+ plus 10 mM Mg2+, gmax = 0.92 ± 0.04, V0.5 = −87.7 ± 3.2 mV, and k = 22.6 ± 3.8 mV.
For a set of patches, the relationship between conductance and activation voltage was determined over Ca2+ concentrations from 1 μM to 100 mM (Fig. 2 D). Similarly, in parallel experiments, the effect of Mg2+ from 1 mM to 100 mM on currents activated by 300 μM Ca2+ was determined (Fig. 2 E). G-V curves were fit with a single Boltzmann () and the relationship between V0.5 and pCa for a large number of patches is plotted in Fig. 2 F. There are two key features. As [Ca2+] is raised to 300 μM, the rate of change in the voltage of half activation appears to slow similar to previous observations (Wei et al. 1994; Cox et al. 1997b; Cui et al. 1997). However, at 10 mM Ca2+, activation is shifted dramatically to more negative potentials by an additional ∼40–50 mV.
Activation of Slo1 by Ca2+ Is Potentiated by Internal Mg2+
The additional leftward shift of activation caused by mM concentrations of Ca2+ coupled with the inflection observed in the V0.5 versus pCa plot raise the possibility that Ca2+ is shifting activation of Slo1 channels through a process distinct from the Ca2+-dependent activation steps that occur at lower [Ca2+]. The fact that, in the presence of 300 μM Ca2+, millimolar Mg2+ and Ca2+ are similarly effective at shifting the V0.5 also supports the idea that effects of mM divalents may involve a different site and mechanism than the gating effects produced by micromolar Ca2+.
It has been shown previously that, in the presence of micromolar Ca2+, millimolar concentrations of internal Mg2+ can potentiate activation of BK channels recorded from rat skeletal muscle transverse tubule membranes (Golowasch et al. 1986; Oberhauser et al. 1988). Because Mg2+ produces minimal channel activation in the absence of Ca2+, it has been proposed that Mg2+ is a positive allosteric modulator of BK channel activity. 400 μM nickel in the presence of 1 μM Ca2+ is also able to shift the V0.5 of this channel by ∼44 mV negative to that measured with 1 μM Ca2+ alone (Oberhauser et al. 1988). Like Mg2+, Ni2+ alone is relatively ineffective at activating BK channels. This suggests that some divalent cations may influence BK gating at a secondary allosteric site. The leftward shift of V0.5 measured for Slo1 with 10 mM Ca2+, then, could be caused by an association of Ca2+ itself with this relatively nonselective site. The experiments presented below address this hypothesis.
Mg2+-induced Shifts in the Single-channel Probability of Being Open Are Similar to Shifts in Macroscopic Currents
Fig. 3 shows that a leftward shift of activation by 10 mM Mg2+ is also evident at the single-channel level. For these experiments, inside-out patches containing one or two channels were stepped repeatedly to particular test potentials. Fig. 3 A shows sample records from a patch containing two channels in which activation is compared at both +60 and −60 mV in the presence of either 300 μM Ca2+ or 300 μM Ca2+ + 10 mM Mg2+. For a given condition, the probability of channels being open (Po) was measured for each sweep and an average Po was generated for a set of sweeps. Fig. 3 B summarizes the average Po determined over a range of voltages from the experiment in Fig. 3 A. Superimposed solid lines are fitted single Boltzmann relations. The plot shows that 10 mM Mg2+ is able to shift activation, as measured by Po, leftward by ∼50 mV. This is similar to the magnitude of the shift measured for macroscopic currents. Both with and without Mg2+, the saturating Po is similar and approaches ∼90%.
Fig. 3 C plots Po estimates as a function of test potential for an experiment similar to that of Fig. 3 A in which channels were activated by either 100 μM Ca2+, 100 μM Ca2+ plus 10 mM MgCl2, 10 mM Ca2+ or 10 mM Ca2+ plus 10 mM Mg2+. The Po-V relationships for the latter three solutions are all quite similar. This indicates that, in the presence of 100 μM Ca2+, addition of Mg2+ is about as effective as an increase in Ca2+ at producing leftward shifts in the activation curves. In contrast, the further addition of 10 mM Mg2+ to 10 mM Ca2+ is ineffective at producing an additional shift. The V0.5 estimates measured at the single-channel level in the presence and absence of 10 mM Mg2+ are similar to those measured for macroscopic currents.
The Magnitude of the Shift in V0.5 Produced by Mg2+ Is Not Ca2+-dependent
We next examined the ability of Mg2+ to shift G-V curves at lower [Ca2+]. Fig. 4 A gives an example of the effect of 10 mM Mg2+ on Slo1 currents activated in the absence of Ca2+. G-V curves (Fig. 4 B) were generated for a set of patches with 0-μM Ca2+ solutions, 0 Ca2+/10 mM Mg2+, and 0 Ca2+/50 mM Mg2+. When 10 mM Mg2+ is added to 0-Ca2+ solutions, conductance begins to be activated ∼50 mV negative to that observed absence of Mg2+, a shift similar to that observed when 10 mM Mg2+ is added to a solution with 300 μM Ca2+. It might be argued that this shift results from the addition of contaminant Ca2+ in the Mg2+ solution. However, as described in the materials and methods, in the solutions with 0 μM Ca2+/10 mM Mg2+/5 mM EGTA, the free [Ca2+] is unlikely to exceed even 10 nM, a concentration that does not activate BK current. Furthermore, the effects of the addition of Mg2+ on current activation time course appear inconsistent with the expected effects of an addition of Ca2+. Although the effects of Ca2+ on activation time course are complex at activation potentials above the voltage of half activation of current, 10 mM Mg2+ produces little effect on the current activation time course (Fig. 9 E), whereas small increases in [Ca2+] typically increase current activation rates. Thus, the effect of Mg2+ appears to differ from what would be expected from the addition of Ca2+. This slowing in activation rate also suggests that the mechanism of Mg2+ action is clearly distinct from the changes in gating that occur with lower concentrations of Ca2+.
Figure 4.
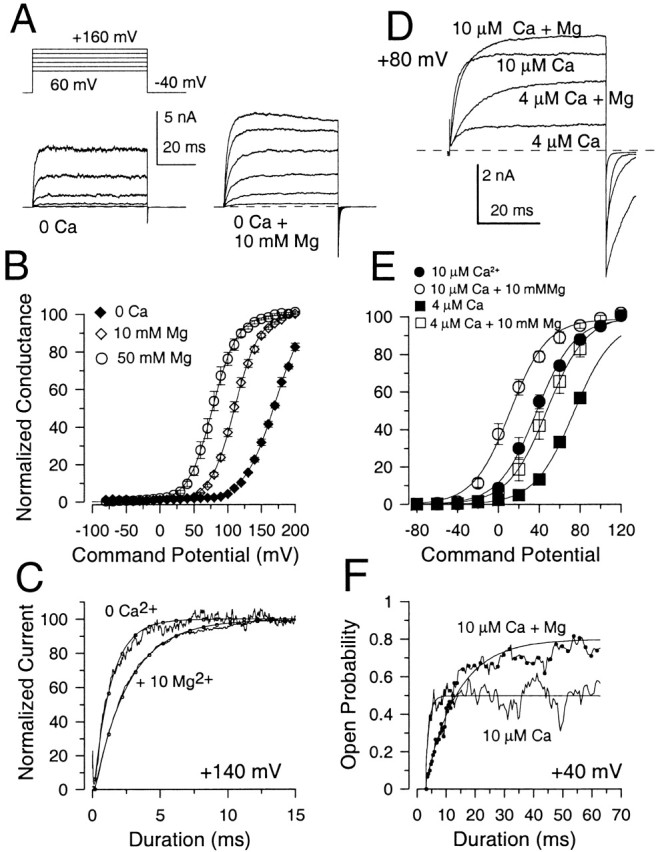
Mg2+ also shifts current activation in lower Ca2+ or 0 Ca2+. In A, currents on the left were activated by the indicated protocol with a solution containing trace Ca2+ with 10 mM EGTA. On the right, currents were activated from the same patch with a solution containing 0 Ca2+, 5 mM EGTA but with 10 mM Mg2+. In 0 Ca2+, time constants of activation (τa) were 1.85, 1.50, 1.12 ms for +120, +140, and +160 mV, respectively. With 10 mM Mg2+, τa was 4.0, 2.72, and 2.22 ms at +120, +140, and +160 mV, respectively. In B, the normalized conductance is plotted as a function of command potential for 0 Ca2+ (eight patches), 10 mM Mg2+ (eight patches) and 50 mM Mg2+ (seven patches). Conductance values were normalized in each patch to the maximum value obtained with 50 mM Mg2+. Fits of (solid lines) yielded values for V0.5 of 170.7 ± 2.6 mV (k = 23.6 mV) for 0 μM Ca2+, 110.5 ± 0.6 mV (k = 18.3 mV) for 10 mM Mg2+, and 78.0 ± 0.5 mV (k = 18.3 mV) for 50 mM Mg2+. In C, currents activated at +140 mV were normalized to peak steady-state amplitude of a single exponential fit to the rising phase of currents activated either with 0 Ca2+ or with 0 Ca2+ + 10 mM Mg2+. The time constant of activation with 0 Ca2+ was 1.50 ms, whereas with 10 mM Mg2+ was 2.72 ms. The slowing of activation with Mg2+ was consistently observed at all activation voltages and argues that the additional activation by Mg2+ is not the result of an increase in trace Ca2+. In D, currents were activated by a voltage step to +80 mV with either 4 or 10 μM Ca2+ without or with the addition of 10 mM Mg2+. Unbuffered divalent cation solutions were prepared as described in the materials and methods. Note the increased current amplitude and slower activation of current in the presence of Mg2+. In E, G-V curves were constructed from measurement of tail currents from a set of 4 patches studied as in D. Error bars represent the SEM of four patches. The V0.5 for each curve is 37.6 ± 1.8 mV (10 μM Ca2+), 11.6 ± 2.5 (10 μM Ca2+ + 10 mM Mg2+), 73.8 ± 1.1 mV (4 μM Ca2+), and 47.8 ± 1.1 mV (4 μM Ca2+ plus 10 mM Mg2+). Buffered Ca2+ solutions prepared at the same time and tested on the same patches yielded V0.5 values of 36.2 ± 1.6 mV for 10 μM Ca2+ and 71.2 ± 1.2 mV for 4 μM Ca2+. In F, ensemble averaged currents were generated from channels activated with the indicated solutions for a voltage-step to +40 mV from a patch containing two channels. The addition of Mg2+ increases the open probability towards maximal values but slows down the time constant of current activation. With 10 μM Ca2+, the activation time constant was 1.4 ± 0.3 ms, whereas with 10 μM Ca2+ plus 10 mM Mg2+ the time constant was 11.1 ± 0.5 ms.
Figure 9.
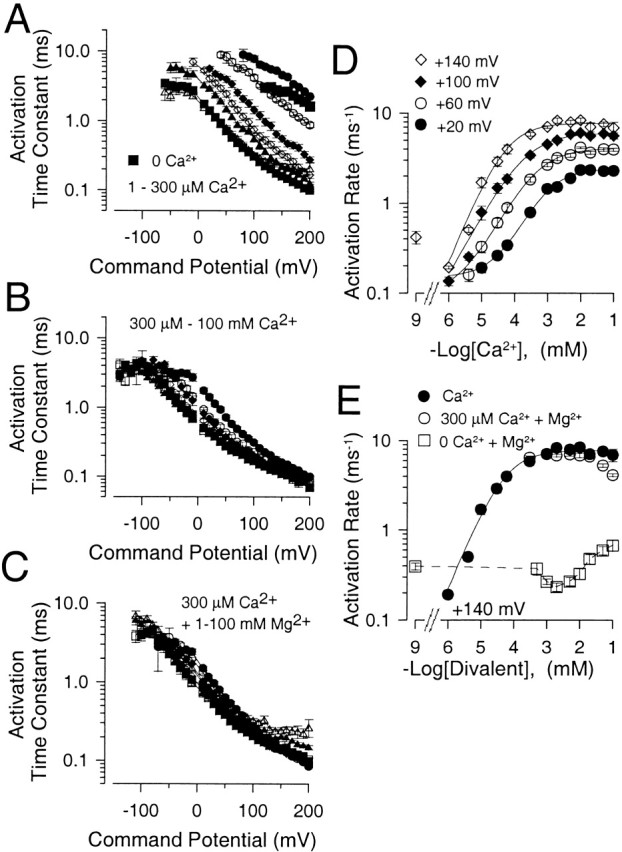
Millimolar concentrations of either Ca2+ or Mg2+ are similar in their effects on current activation rates. In A, the time constant of activation (τa) is plotted as a function of command potential for Ca2+ concentrations of 1 μM (•), 4 μM (○), 10 μM (♦), 30 μM (⋄), 60 μM (▴), 100 μM (▵), and 300 μM (▪). Error bars in A and B are SEM for 4-13 patches. In B, τa is plotted as a function of command potential for Ca2+ concentrations of 300 μM (•), 1 mM (○), 2 mM (♦), 5 mM (⋄), 10 mM (▪), 20 mM (□), 50 mM (▴), and 100 mM (▵). In C, τa is plotted as a function of command potential for solutions containing 300 μM with added Mg2+ of 0 mM (•), 1 mM (○), 2 mM (♦), 5 mM (⋄), 10 mM (▪), 20 mM (□), 50 mM (▴), and 100 mM (▵). Each point shows the mean and SEM of 4-11 patches. In D, the mean rate of current activation for Slo1 currents is plotted as a function of Ca2+ for command potentials of +20 (•), +60 (○), +100 (♦), and +140 (⋄) mV. Error bars are SEM. Solid lines are fits of . At +20 mV, kmax was 2.4, K d = 0.87 ± 0.30 μM, and n = 0.88 ± 0.28. At +60 mV, kmax was 4.1, K d = 398 ± 160 μM, and n = 0.77 ± 0.20; at +100 mV, kmax = 6.0, K d = 181 ± 59 μM, and n = 0.72 ± 0.14; at +140 mV, kmax = 7.7, K d = 59 ± 25 μM, and n = 0.92 ± 0.32. Note the anomalous slowing of current activation rate at 1 μM Ca2+ relative to 0 μM at +140 mV. This point was not included in the fit. In E, current activation rate is plotted as a function of total divalent in the solution at +140 mV for solutions with no added Mg2+ (•) and solutions with Mg2+ added to 300 μM Ca2+ (○), showing that Mg2+ has little effect on the limiting rate of current activation, although additional depolarization will produce an increase in current activation rate. Note the inhibition of activation rate at the highest [Mg2+]. Current activation with 0 Ca2+ and various [Mg2+] is also plotted (□), showing the relative lack of effect of Mg2+ in comparison to Ca2+.
The ability of Mg2+ to shift activation was also examined with solutions containing either 4 or 10 μM free Ca2+. (Fig. 4, D–F). The shift resulting from 10 mM Mg2+ in this set of four patches was ∼25 mV, less than observed either at 0 or 300 μM Ca2+. An even smaller shift was produced by 10 mM Mg2+ with 10 μM Ca2+ in the experiments of Shi and Cui 2001b. Given that 10 mM Mg2+ appears to produce similar shifts in V0.5 at both 0 Ca2+ and more elevated Ca2+, the smaller effect at intermediate [Ca2+] seems at first glance unusual. Shi and Cui interpreted this smaller shift as the result of an inhibitory effect of Mg2+ on the Ca2+ binding site (see Shi and Cui 2001b, in this issue). Perhaps consistent with this possibility, when Mg2+ was added to solutions with either 4 or 10 μM Ca2+, there was a slowing in the current activation time course (Fig. 4D and Fig. F). Such a slowing might result simply from inhibition by Mg2+ of Ca2+ binding.
The slowing of the activation time course might also be explained by the possibility that Mg2+ was shifting channel activation from a condition of very low open probability to approximately half-maximal open probability. For example, in the simple case of a two-state system,
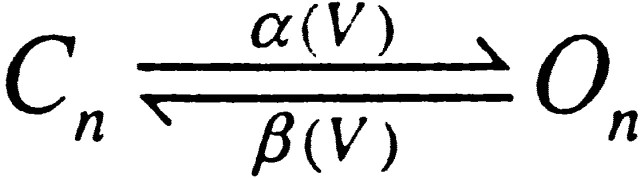
where τ(V) = 1/(α(V) + β(V)), the slowest τ(V) is achieved when α(V) = β(V). For the effect of Mg2+ on Slo1 currents shown in Fig. 4 D, this possibility seemed unlikely since at 10 μM [Ca2+] and +80 mV, currents should be at least half maximally activated. To verify this directly, the ability of Mg2+ to enhance current activation at a given potential was examined in one or two channel patches in which it was possible to directly define the effect of Mg2+ on single-channel open probability. Such an experiment shown in Fig. 4 F confirms that the slowing of the activation time course even occurs as the open probability goes from about half maximal to near maximal. If Mg2+ produced a shift in V0.5 by simply shifting the effective activation voltage by ∼30–50 mV, an increase in activation rate would have been expected. This is clearly not observed. This leaves us with the possibility that the slowing of activation time course reflects inhibition by Mg2+ of Ca2+ binding, when [Mg2+] sufficiently exceeds [Ca2+].
A Low Affinity, Relatively Nonselective Divalent Cation Binding Site May Account for the Effects of Mg2+ and Ca2+
Fig. 5 A summarizes the ability of Mg2+ to shift V0.5 for currents activated by 300 μM Ca2+ for two separate sets of patches. For both sets of patches, the shift in V0.5 at 100 mM Mg2+ is less than at 50 mM Mg2+. The reduction in shift with 100 mM Mg2+ is the result expected, if Mg2+ inhibits the ability of 300 μM Ca2+ to shift gating. Because of this possible inhibitory action of Mg2+, it is more difficult to ascertain whether the shift in V0.5 produced by Mg2+ exhibits saturation. However, because of the saturation in the shift of V0.5 observed over the range of 20–100 mM Ca2+, it seems likely that the effects of Mg2+ also exhibit a similar saturation. However, it should be noted that both in our experiments and the experiments of Shi and Chi (2001b) additions of Mg2+ over the range of 10–100 mM to 0-Ca2+ solutions do not result in full saturation of the shift in V0.5.
Figure 5.

The ability of mM concentrations of Ca2+ and Mg2+ to shift G-V curves is similar. In A, the V0.5 for activation is plotted as a function of Mg2+ for G-V curves obtained in two separate sets of patches each activated by 300 μM Ca2+ plus the indicated Mg2+. The predictions for the shift in V0.5 as a function of Mg2+ based on two sets of fitted values for Fig. 1 (Table , columns A [♦] and D [▪]) are also displayed. In B, the ability of Mg2+ to shift V0.5 at different Ca2+ is displayed. Triangles show V0.5 values from macroscopic currents without (▴) or with (▵) 10 mM Mg2+. Circles ([•] no Mg2+; [○]: + 10 mM Mg2+) are means and SD for V0.5 determined from Po measurements from four patches with either one or two channels as in Fig. 3. Diamonds ([♦] no Mg2+;[⋄] +10 mM Mg2+) are values obtained with unbuffered Ca2+ solutions. Predictions from the fitted values for Fig. 1 (Table , column D) are also shown for Ca2+ alone (▪) and with 10 mM Mg2+ (□). In C, the change in V0.5 (ΔV0.5) produced by 10 mM Mg2+ at different [Ca2+] is displayed for macroscopic current measurements (○) and single-channel estimates (▪). Estimates of predicted ΔV0.5 based on a fit of Fig. 1 to G-V curves with or without Mg2+ are also shown for two cases: first, Mg2+ inhibition of the high affinity site is allowed (•; Table , column D) and no inhibition by Mg2+ occurs (♦; Table II; column F). In D, values of V0.5 obtained as a function of Ca2+ (□) are replotted along with estimates of the V0.5 corrected at Ca2+ of 1 mM and above by the additional shift produced by Mg2+ shown in A obtained with 300 μM Ca2+. These values (○) provide an indication of the ability of the higher affinity, Ca2+ selective site to shift activation of BK channels, in the absence of the low affinity effect, assuming that the high and low affinity effects are independent and additive. Predicted values for V0.5 based on a fit of Fig. 1 are also shown for the case of both low and high affinity Ca2+ binding sites (▪; Table II; column D), and also for Ca2+ action alone in the absence of a high affinity site (♦). The latter values were also corrected for the approximately −17-mV shift that 300 μM Ca2+ should produce by acting at the low affinity sites (•). The discrepancy between the Mg2+ corrected data and the prediction from Fig. 1 arises from the fact that the Mg2+ correction was obtained with solutions with 300 μM Ca2+ such that the effect of 300 μM Ca2+ on the low affinity site is not taken into account.
Another interesting aspect of the action of Mg2+ is the magnitude of the shift in V0.5 produced by 10 mM Mg2+ at various [Ca2+] up through 10 mM (Fig. 5 B). The results in Fig. 5 B include data from a variety of experimental conditions (Solaro et al. 1995), including estimates of single-channel open probability from one and two channel patches and macroscopic current estimates. Over the range of ∼30 μM–1 mM Ca2+, 10 mM Mg2+ seems to produce a rather constant shift of about −40 to −60 mV. Similarly, the shift at 0 Ca2+ is also about −50 mV. However, when 10 mM Mg2+ is added to 10-mM Ca2+ solutions, the resulting shift is substantially reduced. This latter effect is consistent with the idea that Mg2+ and Ca2+ are competing for a saturable, low affinity binding site. The magnitude of the shift caused by 10 mM Mg2+ over all Ca2+ is summarized in Fig. 5 C. Fig. 5 (B and C) also includes data obtained with unbuffered 4- and 10-μM Ca2+ solutions in which the shifts produced by 10 mM Mg2+ were only about −25 mV, similar to the results of Shi and Cui 2001b. In general, the ability of Mg2+ to shift gating over all [Ca2+] qualitatively supports the idea that, even under conditions where the higher affinity site is only partially occupied by Ca2+, Mg2+ still produced substantial shifts in gating and does so without substituting for Ca2+ at the higher affinity sites.
Because of the possibility that the effect described here may reflect an important regulatory role of free cytosolic Mg2+, we also examined the ability of Mg2+ to shift activation, when Mg is added as MgATP. When Mg2+ is added as 2 mM Mg-ATP, solutions with nominal 100 μM Ca2+ are much less effective at activating current. ATP will bind both Mg2+ and Ca2+. Based on published stability constants (Martell and Smith, 1974), the solution used here (100 μM added Ca2+, 2 mM added MgATP) is calculated to have 33 μM free Ca2+ and 407 μM free Mg2+. The V0.5 observed for the solution containing 2 mM added MgATP (−6.3 ± 1.3 mV) is similar to that which would be expected for a 30-μM Ca2+ solution (about +8 mV) with an additional negative shift of ∼10 mV resulting from 400 μM Mg2+. Thus, the experiment is consistent with the idea that the shift produced by high Mg2+ depends on the free Mg2+ concentration, and that ATP reduces both free Ca2+ and free Mg2+.
The shift caused by increasing [Mg2+] from 1 to 10 mM is ∼45–50 mV, whereas the shift caused by increases in [Ca2+] from 1 to 10 mM is also ∼50 mV. Thus, high concentrations of Ca2+ and Mg2+ may be acting at the same site(s) on the channel protein to modulate BK channel gating, independent of the action of Ca2+ at the higher affinity, Ca2+-specific sites. This implies that there are at least two types of Ca2+ binding sites that are important for channel function. First, there are high affinity, relatively Ca2+-specific sites that, along with depolarization, produce channel opening. Second, there are low affinity sites that can bind either Ca2+ or Mg2+ to potentiate activation of channels, no matter whether channels are activated in the presence or absence of Ca2+.
If we assume that high concentrations of Ca2+ and Mg2+ bind to the same or similar sites and are able to promote activation of Slo1 currents in a similar fashion, then the results in Fig. 5 A can be used to “subtract” the effect of Ca2+ at the putative low affinity site from the V0.5-pCa relationship shown in Fig. 2 E. This manipulation would then reveal the effect of Ca2+ acting only at the putative high affinity sites. This makes the assumption that the effects of high and low affinity sites on V0.5 are independent, an issue which is addressed below. The consequences of this assumption are presented in Fig. 5 D. The open squares are V0.5 values resulting from the action of [Ca2+] reproduced from Fig. 2 E. The additional shift in V0.5 resulting from higher [Ca2+] were then assumed to be equivalent to the additional shift in V0.5 resulting from high [Mg2+]. Therefore, the closed squares were obtained by subtracting the magnitude of the shift of V0.5 caused by a given [Mg2+] in the presence of 300 μM Ca2+ (Fig. 5 A) from the V0.5 measured in the presence of the identical [Ca2+], but without Mg2+. For example, the V0.5 measured at 2 mM Ca2+ was shifted positive by the amount of shift caused by 2 mM Mg2+. Thus, assuming Ca2+ and Mg2+ act equivalently at the same (or similar) binding site(s), the closed squares reflect the action of Ca2+ at the higher affinity sites alone. Once a correction is made for the effect of Ca2+ on low affinity binding sites, it is evident that for [Ca2+] greater than ∼300 μM, the corrected V0.5 's are no longer shifted negative by additional Ca2+, even though activation remains voltage-dependent. This is consistent with the idea that high affinity, Ca2+-dependent steps leading to activation are separate from voltage-dependent steps (Wei et al. 1994; Cox et al. 1997a; Horrigan and Aldrich 1999; Horrigan et al. 1999). Another way of thinking about this is that the relationship between V0.5 and Ca2+ in the presence of 10 mM Mg2+ is essentially constant from 100 μM to 100 mM (Fig. 5 B). Thus, the channel is essentially unaffected by changes in [Ca2+] over two orders of magnitude, although gating continues to be controlled by voltage.
Concentrations of Ca2+ and Mg2+ of 1 mM and above Have Minor Effects on Current Activation Rates at Potentials from +40 mV and More Positive
The above results argue that, at Ca2+ or Mg2+ concentrations of 1 mM and above, leftward shifts in the open probability of BK channels result primarily from the action of divalent cations at a relatively nonselective site distinct from higher affinity sites that specifically mediate Ca2+-dependent gating of the channel. If [Ca2+] or [Mg2+] at ≥1 mM potentiates activation by acting at a site distinct from the Ca2+ binding site that regulates activation at lower [Ca2+], effects of higher [Ca2+] or [Mg2+] concentrations on channel gating kinetics might be distinct from those of more modest [Ca2+]. The activation and deactivation behavior of Slo1 currents at [Ca2+] up to ∼1 mM has previously been examined in some detail (Cox et al. 1997a; Cui et al. 1997). Here, we have examined the effects of [Ca2+] at up to 10 mM, and also examine current activation and deactivation in the presence of Mg2+.
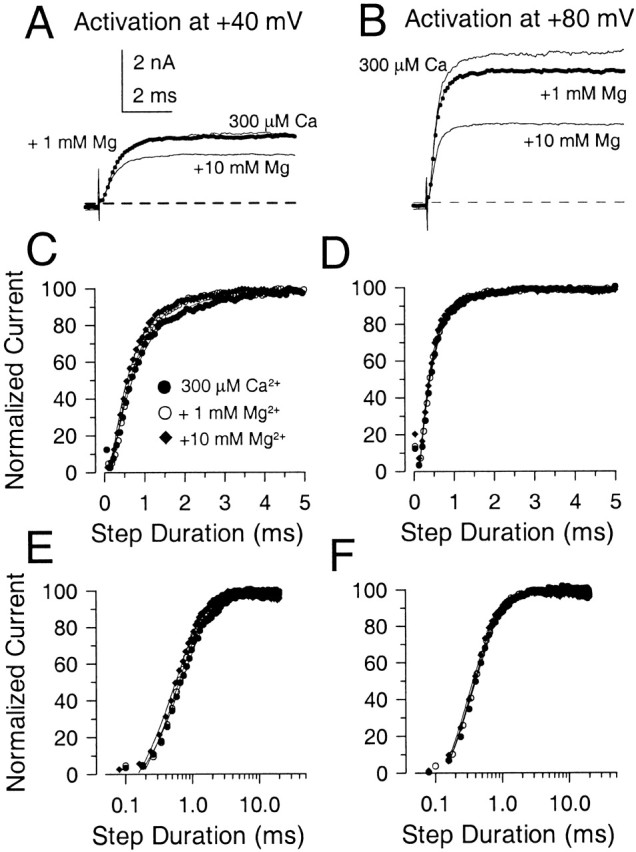
The rate of Slo1 current activation was examined in inside-out patches as a function of both [Ca2+] and voltage with sampling rates and command steps of sufficient duration to allow determination of activation time course. Over a wide range of [Ca2+] and voltage, the activation time course was approximately exponential in nature (Fig. 6), although some initial delay in activation was observed. Representative currents activated at either +40 or +80 mV with [Ca2+] of 1–100 μM are shown in Fig. 6 (A and B). In Fig. 6C and Fig. D, the currents were normalized to their maximal steady-state amplitude and each fit to a single exponential. To facilitate comparison of changes in activation rate, the normalized current activation time course for currents activated over approximately two orders of magnitude of [Ca2+] is plotted on a logarithmic time base in Fig. 6E and Fig. F. At both +40 and +80 mV, 10-fold changes in concentration produce an approximately three to fivefold change in activation rate over this range of [Ca2+]. In Fig. 7A and Fig. B, currents activated by 300 μM, 1 mM, and 10 mM Ca2+ are plotted for both +40 and +80 mV. The normalized currents are plotted on both a linear scale (Fig. 7C and Fig. D) and logarithmic time base (Fig. 7E and Fig. F) showing that the increase in [Ca2+] from 300 μM to 10 mM results in only a small additional increase in activation rate, compared with the large changes seen in Fig. 6.
Figure 6.
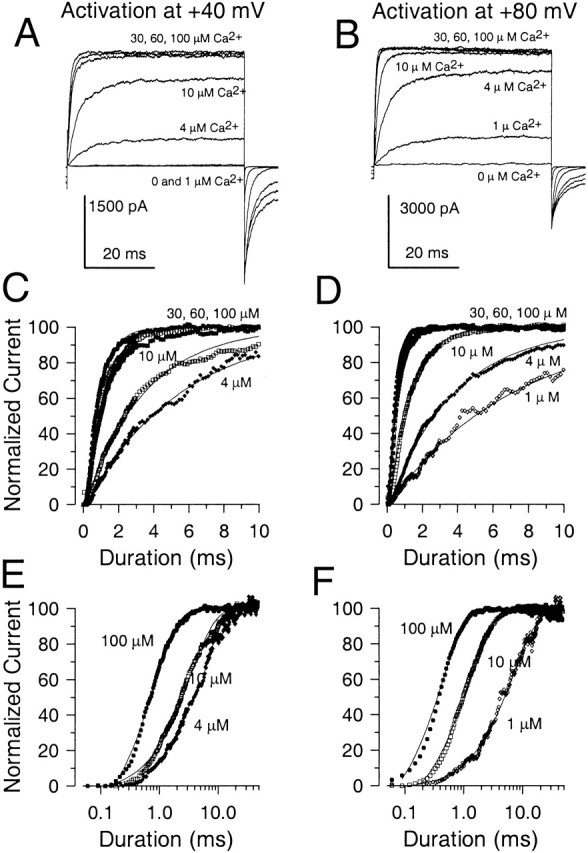
The current activation rate increases substantially as Ca2+ is raised from 1 μM to 100 μM. In A, currents were activated by a voltage step to +40 mV with Ca2+ concentrations of 0, 1, 4, 10, 30, 60, and 100 μM as indicated. In B, currents were activated in the same patch by a voltage-step to +80 mV with the same Ca2+ concentrations. In C, currents activated by the step to +40 mV were normalized to their maximal amplitude and fit with single exponentials. The activation time constants (τa) were 5.45, 3.38, 1.21, 1.05, and 0.80 ms, for 4, 10, 30, 60, and 100 μM, respectively. In D, the normalized current activation time course for the voltage-steps to +80 mV are shown. τa's were 7.08, 3.77, 1.23, 0.53, 0.46, and 0.39, for 1, 4, 10, 30, 60, and 100 μM Ca2+, respectively. In E and F, the same normalized traces shown in C and D are plotted on a logarithmic time base to show the shift in activation time course with Ca2+. An increase in Ca2+ from 1 to 10 μM produces a similar three to fourfold change in activation rate as the increase from 10 to 100 μM. At +40 mV, the trace in response to 4 μM Ca2+ is plotted since at 1 μM there is almost no detectable current activation.
Figure 7.
Increases of Ca2+ from 300 μM to 10 mM produce smaller increases in current activation time rate. In A and B, currents were activated by 300 μM, 1 mM, and 10 mM Ca2+ at either +40 mV (panel A) or +80 mV (panel B). In C and D, each trace in A and B was normalized to the maximal current amplitude to compare the activation time course. Points show every fourth digitized current value. Solid lines are the best fit of a single exponential function to the activation time course. At +40 mV, the activation time constant (τa) was 0.73, 0.52, and 0.33 ms for 300 μM, 1 mM, and 10 mM Ca2+, respectively. At +80 mV, τa was 0.38, 0.28, and 0.19 ms for 300 μM, 1 mM, and 10 mM Ca2+, respectively. In E and F, the normalized current activation time course is plotted on a logarithmic time base to allow better comparison of the relatively small concentration dependence of the activation rate for this 30-fold change in concentration compared with that shown in Fig. 6.
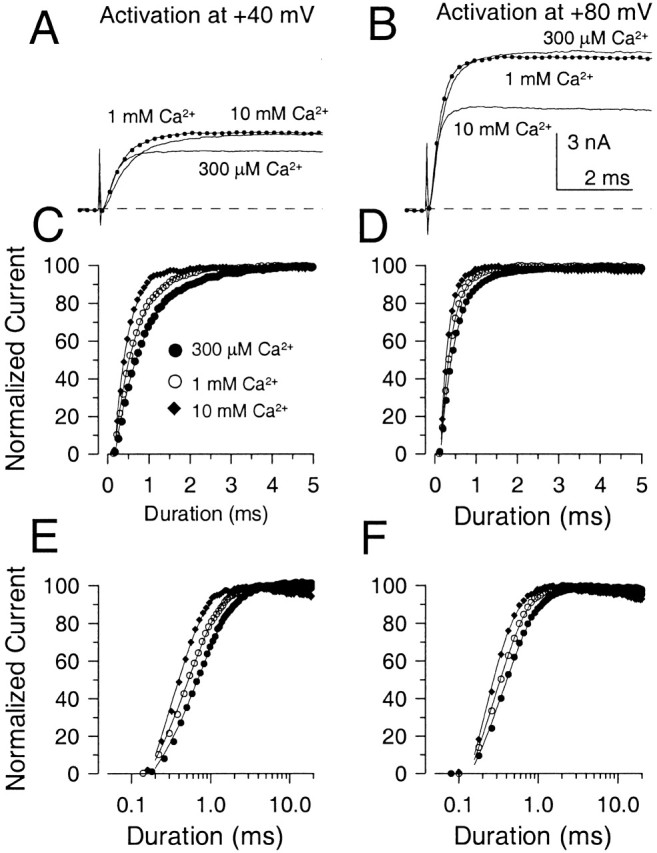
The effect of mM Mg2+ on τa was examined as above. The effects of 1 and 10 mM Mg2+ on currents activated with 300 μM Ca2+ are displayed in Fig. 8 (A and B). At 10 mM Mg2+, there is a substantial shift in the G-V curve and substantial open channel block, but the activation course is similar to that in the absence of Mg2+. Comparison of the activation time course of the normalized currents either on a linear (Fig. 8C and Fig. D) or logarithmic (Fig. 8E and Fig. F) time base further emphasizes the lack of effect of Mg2+ on τa in the presence of 300 μM Ca2+. Thus, at potentials where additional depolarization would enhance current activation rate, concentrations of Ca2+ and Mg2+ above 1 mM have little effect on current activation rates. Thus, the lack of effect of Mg2+ on τa indicates that, whatever the mechanism of action of Mg2+ (and mM Ca2+), it does not affect the voltage-dependent rate limiting activation steps.
Figure 8.
Addition of Mg2+ concentrations which markedly shift G-V curves does not increase the limiting rate of Slo1 current activation. In A and B, traces were elicited in each panel with 300 μM Ca2+ alone, and with 300 μM Ca2+ with either 1 mM or 10 mM Mg2+. Traces on the left were activated by a voltage step to +40 mV and, on the right, to +80 mV. In C and D, the normalized current activation time course is plotted on a linear time base (every fourth digitized value is plotted), while, in E and F, the same traces are shown on a logarithmic time base. Solid lines are fits of a single exponential function to the activation time course. At +40 mV, τa was 0.75, 0.64, and 0.59 ms for 300 μM Ca2+, 300 μM Ca2+ + 1 mM Mg2+, and 300 μM Ca2+ + 10 mM Mg2+, respectively. At +80 mV, τa was 0.38, 0.36, and 0.33 ms for each solution. Raising Mg2+ up to 10 mM results in little effect on the time course of current activated in the presence of 300 μM Ca2+.
The dependence of τa on voltage is plotted for 0–300 μM Ca2+ in Fig. 9 A and for 300 μM–100 mM Ca2+ in Fig. 9 B. Again at Ca2+ above 300 μM, the change in τa is much smaller than at lower [Ca2+]. Furthermore, at each [Ca2+], the dependence of τa on voltage is similar. There appears to be an anomalous aspect of the effect of Ca2+ on activation in comparing the results at 0 and 1 μM Ca2+. Specifically, there is a slowing of activation at potentials of +100 mV and more positive as [Ca2+] is elevated to 1 μM, whereas activation is again faster at 4 μM. We have not examined other concentrations over the range of 0 to 4 μM. This result is consistently observed in different sets of patches both in our own experiments and those of others (Cui, J., personal communication). For comparison to the effects of Ca2+, the effect of 1 to 100 mM Mg2+ on current activation elicited with 300 μM Ca2+ is shown in Fig. 9 C. Over the range of −60 through +190 mV, Mg2+ is essentially without effect on current activation rates, with only some slowing of activation at 50 and 100 mM Mg2+.
Time constants were converted to activation rates and the mean rate of activation is plotted as a function of [Ca2+]i from 1 μM to 50 mM in Fig. 9 D for potentials of +20, +60, +100, and +140 mV. The rate of activation at a given voltage increases markedly with increases in [Ca2+] up to ∼1 mM before exhibiting saturation over millimolar concentrations that still produce additional shifts in GV curves. The dependence of activation rate on [Ca2+] (ignoring the rate at 0 Ca2+) was fit with the following function:
 |
2 |
where k(Ca) is the rate of activation at a given [Ca2+], kmin is the minimal activation rate, kmax is the limiting rate at saturating [Ca2+], K D is the concentration of half-maximal Ca2+ effect, and n is a Hill coefficient. The limiting activation rate increases with depolarization at and above 1 μM [Ca2+], while the apparent K d is also shifted to lower concentrations with depolarization. The Hill coefficient shows little variation with voltage.
The saturation in Slo1 current activation rate is consistent with the idea that a key Ca2+-dependent step no longer influences current activation rates at [Ca2+] above 1 mM. However, despite the fact that additional elevations in [Ca2+] do not increase the activation rate, additional depolarization can result in faster current activation. Thus, the saturation in the Ca2+ dependence of activation rate is unrelated to any limit on the channel activation process itself. Rather, the limiting activation rate at saturating [Ca2+]i does vary with voltage, consistent with the idea that solely voltage-dependent transitions determine the limiting rate of activation at [Ca2+] of 1 mM and above.
The effect of Mg2+ on current activation is summarized in Fig. 9 E. When currents were activated with 300 μM Ca2+, additions of [Mg2+] from 1 through 100 mM resulted in no additional increase in current activation rate. In fact, at [Mg2+] above 10 mM, a slowing in the activation rate was observed, consistent with the idea that Mg2+ may inhibit Ca2+ binding at the low affinity activation site (Shi and Cui 2001b). We also examined the effect of Mg2+ on activation of current with 0 Ca2+/5 mM EGTA. It was shown earlier that Mg2+ slows current activation with 10 μM Ca2+ (Fig. 5), an effect probably resulting from an inhibitory effect of Mg2+ on the high affinity Ca2+ binding site. However, with 0 Ca2+, there was essentially no effect of 10 mM Mg2+ on activation time constant at potentials positive to +160 mV, whereas at more negative potentials and less than maximal open probabilities, activation and deactivation were slowed, both effects probably resulting from the effects of Mg2+ on transitions involved in deactivation described below. Thus, Mg2+ does not appear to directly influence rate limiting, voltage-dependent activation steps in the absence of Ca2+. However, it should be noted that, with 0 Ca2+ and [Mg2+] above 10 mM, we also observed an increase in current activation rate (Fig. 9 E) that cannot be easily accounted for by the mechanisms presented below.
Deactivation Is Slowed by Either Increases in Ca2+ or Mg2+
Deactivation tails resulting from closure of Slo1 channels after repolarization were examined over a range of potentials with [Ca2+] from 0 μM to 100 mM. Deactivation, under most conditions, could be described by a single exponential. The deactivation time constant (τd) is plotted as a function of voltage in Fig. 10 A over Ca2+ concentrations spanning six orders of magnitude. Similarly, τd is plotted as a function of voltage in Fig. 10 B for solutions containing 300 μM Ca2+ with or without either 1, 10, or 100 mM Mg2+. The dependence of τd on Ca2+ and Mg2+ appears similar but differs from the dependence of τa on Ca2+ and Mg2+. Namely, increases in [Ca2+] above 100 μM continue to result in additional slowing of current deactivation, implying that there may be Ca2+-dependent effects at higher [Ca2+] that influence rates of exit from open states or closed states near open states, but which have no affect on the limiting rates of channel activation. Similarly, although Mg2+ is without effect in substituting for Ca2+-dependent activation steps, Mg2+ does slow deactivation in a fashion qualitatively similar to the effect of mM Ca2+. For both Mg2+ and Ca2+, the slowing of deactivation is substantial over the range of 1–10 mM of either cation, concentrations at which activation rates are unaffected. However, above 10 mM of either cation, there is an indication that the effect on deactivation exhibits saturation, which is consistent with the saturation in the shift of G-V curves at high divalent cation concentrations. The change in τd as a function of [Mg2+] is plotted in Fig. 10 C and compared with the effect of a similar total concentration of divalent with Ca2+ alone. Millimolar concentrations of Mg2+ and Ca2+ appear similar in their effects on deactivation.
Figure 10.
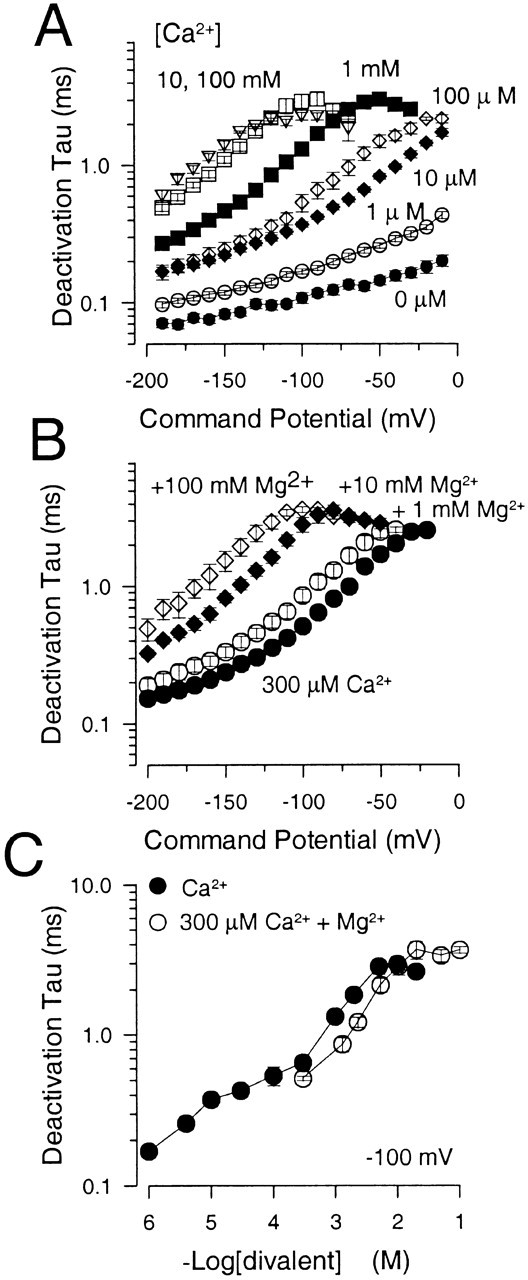
Millimolar concentrations of Mg2+ and Ca2+ have similar effects on current deactivation. In A, the deactivation time constants are plotted as a function of command potential for [Ca2+] spanning over six orders of magnitude, 1 μM–100 mM. Points and error bars are means and SEM of 5–15 patches. In B, the deactivation time constants are plotted as a function of command potential for tail currents obtained with 300 μM Ca2+ and 300 μM Ca2+ plus 1, 10, and 100 mM added Mg2+. Points show means and SEM for 4–8 patches. In C, the deactivation time constant measured at −100 mV is plotted as a function of total [divalent] for solutions with only Ca2+ (•) and for solutions with 300 μM Ca2+ with added Mg2+ (○). The slowing of deactivation with either elevated Ca2+ or Mg2+ exhibits saturation, although at somewhat different concentrations.
To summarize the similarities and differences in the effects of Ca2+ and Mg2+ on kinetic aspects of Slo1 currents, effects of various [Ca2+] and [Mg2+] were compared in the same sets of patches. At any given [Ca2+] and [Mg2+], the relaxation time constant (deactivation and activation) exhibits an approximately bell-shaped dependence on voltage. In Fig. 11 A, 10 μM Ca2+ is shown to shift both activation and deactivation times constants to a somewhat similar extent compared with 0 Ca2+, whereas with 300 μM Ca2+, the effects on τd begin to diminish while effects on activation remain pronounced. In Fig. 11 B, 4 μM Ca2+ produces a leftward shift qualitatively similar to that with 10 μM, although smaller. 1 μM Ca2+ results in the unusual slowing of activation described above, producing a slowing of the principle time constant at all voltages. In Fig. 11C and Fig. D, Fig. 10 and 50 mM Ca2+ are compared with 10 and 50 mM Mg2+. 10 and 50 mM Ca2+ produce a similar leftward shift in the relaxation time constant. In contrast, with 10 mM Mg2+, there is no apparent effect on current activation, but deactivation is slowed. 50 mM Mg2+ produces some slight additional slowing in deactivation, but also results in some increase in current activation rate. In Fig. 11 E, 10 and 50 mM Ca2+ are shown to produce a substantial additional slowing of deactivation relative to 300 μM Ca2+, with only weaker effects on current activation at positive potentials. The effects of 10 and 50 mM Mg2+ when added to 300 μM Ca2+ are quite similar (Fig. 11 F), producing a substantial slowing of current deactivation, with little effect on current activation, except for a clear slowing of activation at 50 mM. Thus, these kinetic effects remain generally consistent with the effects of Ca2+ and Mg2+ on GV curves. There is a higher affinity effect of Ca2+ that influences both current activation rates and deactivation rates. There is little evidence that Mg2+ acts at this site except for a slowing of activation, when [Mg2+] is perhaps at least three orders of magnitude greater than [Ca2+]. In contrast, both Mg2+ and Ca2+ share an ability to slow deactivation at mM concentrations, while having minimal effects on limiting rates of current activation at these concentrations.
Figure 11.
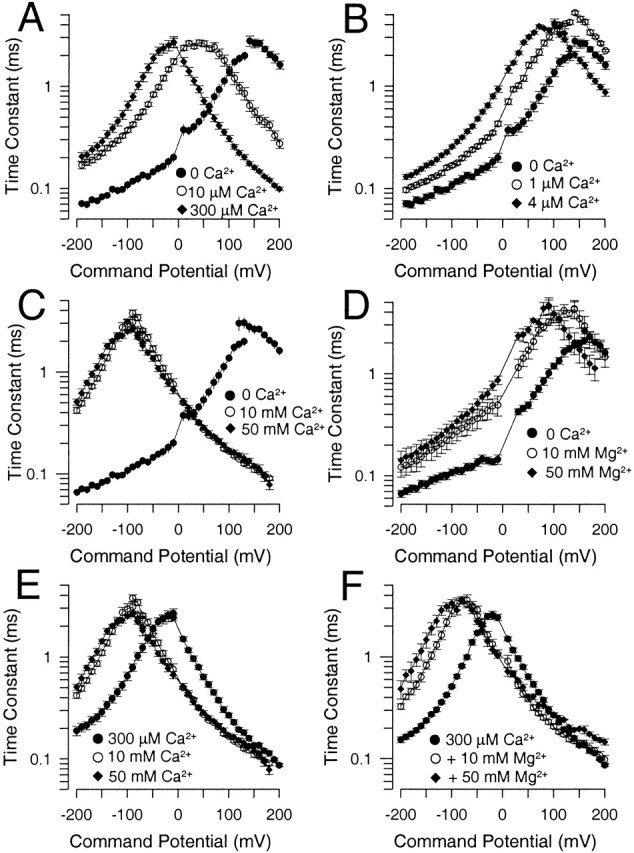
Comparison of effects of Ca2+ and Mg2+ on primary time constant of Slo1 current relaxations. In A, activation and deactivation time constants obtained at 0, 10, and 300 μM Ca2+ are plotted as a function of potential. In B, the shift in relaxation time constant with 1 and 4 μM are compared with 0 μM Ca2+. Note the unusual slowing of activation with 1 μM Ca2+. In C, the effects of 10 and 50 mM Ca2+ are compared with 0 Ca2+, whereas, in D, the effects of 10 and 50 mM Mg2+ are compared with 0 Ca2+. In E, the effects of 10 and 50 mM Ca2+ are compared with 300 μM Ca2+, whereas, in F, the effects of 10 and 50 mM Mg2+ plus 300 μM Ca2+ are compared with 300 μM Ca2+.
Mg2+ Increases the Hill Coefficient for Activation of Slo1 Current by Ca2+ by Shifting the Relationship between Hill Coefficient and Membrane Potential
One interesting aspect of the effect of Mg2+ reported in earlier studies was that Mg2+ increases the Hill coefficient for activation by Ca2+ of BK channels in bilayers (Golowasch et al. 1986) and that other divalent cations act similarly (Oberhauser et al. 1988). For gating by Ca2+, the Hill coefficient is generally used as an indicator of the minimal number of Ca2+ ions that are required for channel activation. Where this has been examined for Slo1 current, the Hill coefficient is typically around two with some tendency to increase with depolarization (Cui et al. 1997; Bian et al. 2001). Here, we addressed this issue in two ways. First, we examined the behavior of the Hill coefficient over a wider range of [Ca2+] than previously studied to assess how the proposed two binding sites might impact on Hill plots. Second, we determined whether effects of Mg2+ on the Hill coefficient would be reproduced here. To address the first issue, normalized conductance values from Fig. 2 C were replotted to display the relationship between conductance and [Ca2+] over a range of voltages (Fig. 12 A). Curves obtained at each command potential were fit with a Hill equation G/Gmax = B + A/[1 + (K d/[Ca])n, where n is the Hill coefficient and K d is the apparent Ca2+ dissociation constant. B is a term included to account for the Ca2+-independent activation of current at the most positive activation potentials. At some voltages, this function did not describe the shape of the relationship between conductance and [Ca2+| very well. However, terms for the K d (Fig. 12 C) and Hill coefficient (Fig. 12 D) were determined for voltages from −120 to +140 mV. The apparent affinity increases markedly with depolarization while appearing to reach a limiting value at the most negative activation potentials. The apparent Hill coefficient exhibits a surprisingly erratic appearance. However, consistent with other results (Cui et al. 1997), the Hill coefficient increases from ∼1 to ∼2.5 over the range of −20 to +80 mV. The error bars indicate the 90% confidence limits on the fitted parameter and indicate that the fitting function in some cases did not describe the shape of the curves very adequately. This sort of experiment suggests that two other factors are also likely to impact on estimates of Hill coefficient in various studies. First, large variation in estimates of Hill coefficient might be expected to result from the fact that, in some studies, the number of Ca2+ concentrations over which the change in conductance is determined can be rather minimal. Second, at positive potentials where activation of current occurs in the absence of Ca2+, if this activation is not taken into account, Hill coefficients will be estimated incorrectly. In sum, these results suggest that a typical Hill function may not be a mechanistically meaningful way of evaluating the Ca2+ dependence of Slo1 current activation and that the apparent Hill coefficient may exhibit some unusual dependence on voltage. Possible reasons for this behavior are addressed below.
Figure 12.

The behavior of K d and Hill coefficient over all [Ca2+]. In A, conductances given in Fig. 2 D were replotted to show the Ca2+ dependence of conductance at a given voltage. Each point is the mean and SEM for the estimate. Solid lines are fits of the modified Hill equation given in the text. Symbols correspond to potentials of −200 (•), −180 (○), −160 (♦), −140 (⋄), −120 (▪), −100 (□), −80 (▴), −60 (▵), −40 (▾), −20 (▿), 0 (▸), +20 (▹), +40 (◂), +60 (◃), +80 (★), +100 (⋆), +120 (closed six-pointed star), and +140 (open six-pointed star) mV. In B, conductance values predicted from Fig. 1 (see Fig. 14) based on values given in Table (column D) were plotted as a function of [Ca2+] and fit with the modified Hill equation (solid lines). Symbols are as in A. In C, estimated values for the K d for apparent Ca2+ affinity (•) obtained from fitting the data in Fig. 12 A are plotted as a function of command potential. The solid line with small filled circles corresponds to values for K d predicted from Fig. 1 as shown in Fig. 12B. The line with small open circles corresponds to K d values assuming no Mg2+ inhibition of the high affinity site. In D, the Hill coefficients determined from Fig. 12 A (•) are plotted as a function of voltage. Error bars represent the 90% confidence limit on the estimate of the Hill coefficient. The dotted lines show the predictions from Fig. 1 as determined from values in Table , column D (Fig. 12 B, small closed circles) or from Table , column F (small open circles, no Mg2+ inhibition).
We next examined the effects of [Mg2+] on the behavior of Hill plots. This analysis used a different set of patches than those used in Fig. 2 and used a more limited set of Ca2+ concentrations, but typical of those used in other investigations. Hill plots obtained for this data set in the absence of Mg2+ are shown for several voltages in Fig. 13 A, whereas similar plots in the presence of 10 mM Mg2+ are shown in Fig. 13 B. As above, the Hill equation was used to make estimates of K d and the Hill coefficient. Given the more limited number of Ca2+ concentrations used in this set of patches, the estimate of Hill coefficient in particular exhibited large confidence limits. Both with and without Mg2+, the K d varied exponentially with command potential with a zero-voltage K d of ∼25 μM in the absence of Mg2+ and ∼10 μM in the presence of Ca2+ (Fig. 13 C). Both with and without Mg2+, there was a trend for the Hill coefficient to became larger at more positive potentials (Fig. 13 D), which is consistent with the observations in Fig. 12 D and other work (Cui et al. 1997). This increase in the Hill coefficient is, in part, the simple expectation of the fact that, for each increment in Ca2+, G-V curves are shifted more at lower than at higher [Ca2+], such that over the range of 100 μM–1 mM Ca2+, little additional shift is observed (Wei et al. 1994; Cox et al. 1997b). As a consequence, at more negative potentials, relatively large increments in [Ca2+] produce relatively small increases in conductance, resulting in a less steep Ca2+ dependence of activation. Since, as shown above, 10 mM Mg2+ produces an essentially 50-mV leftward shift of the G-V curve obtained at each [Ca2+], this would be expected to cause an apparent increase in Hill coefficient at any command potential. Another way of viewing the results is that the relationship between Hill coefficient and command potential (Fig. 13 D) is simply shifted leftward ∼50 mV in the presence of Mg2+. Thus, the present results suggest that Mg2+ does cause an increase in the apparent Hill coefficient for Ca2+ at a given voltage, but that this effect reflects a shift of the relationship between Hill coefficient and voltage along the voltage axis.
Figure 13.
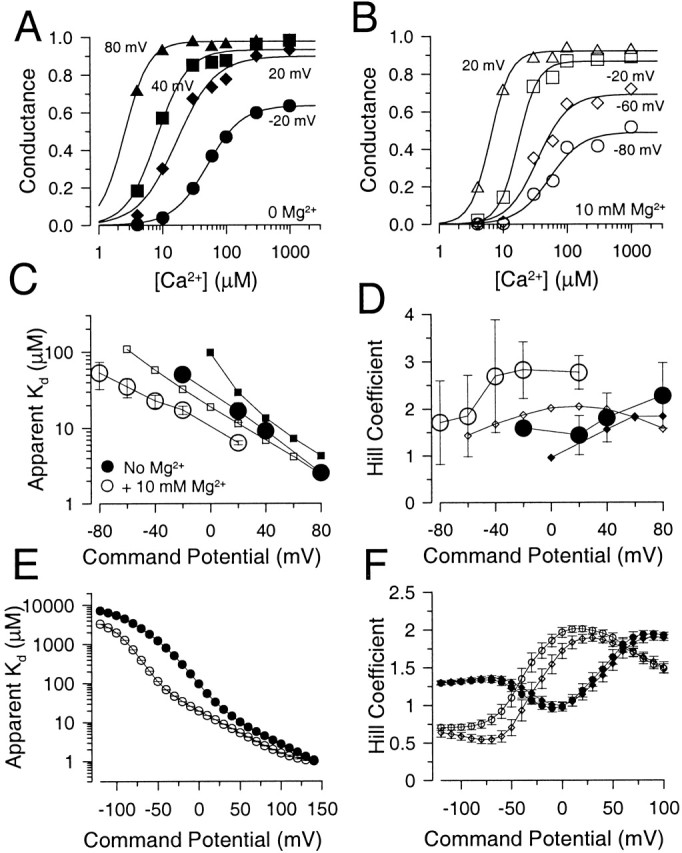
The apparent Hill coefficient for activation of conductance by Ca2+ is increased by Mg2+. In A, each point is the estimate of conductance activated at a given Ca2+ and voltage obtained from normalized G-V curves. Solid lines are fits of the modified Hill equation given in the text. Fitted values for apparent K d and Hill coefficient are plotted in C and D, respectively. Values used in this figure were from a different set of patches than shown in Fig. 2 or Fig. 12. In B, conductance estimates obtained in the presence of 10 mM Mg2+ are plotted as a function of Ca2+ for a range of voltages. At comparable voltages, the Hill coefficient for activation is higher in the presence of Mg2+. In C, the apparent K d (in μM) for activation of conductance by Ca2+ either in the absence (•) or presence (○) of 10 mM Mg2+ is plotted as a function of activation potential. The apparent Ca2+ affinity is increased at a given potential in the presence of Mg2+. The error bars are 90% confidence limits from the estimates of K0.5 obtained in A and B. Predictions from Fig. 1 (Table , column D) for solutions without Mg2+ (▪) or with Mg2+ (□) are also shown. In D, the Hill coefficient and confidence limits for the activation of conductance by Ca2+ either in the absence (•) or presence (○) of Mg2+ are plotted as a function of command potential, along with estimates (no Mg2+ [♦], +10 mM Mg2+ [⋄]) from Fig. 1 based on estimates of Mg2+ affinities from column B of Table . Both for experimental data and the theoretical predictions, there is a trend for increased Hill coefficient at more positive potentials and, at any given potential, Mg2+ increases the apparent Hill coefficient. In E, the K d for Ca2+ effect predicted from Fig. 1 is plotted over a wider range of potentials. Both with (○) and without (•) 10 mM Mg2+, at the most negative potentials a limit in the K d is observed, while affinity increases dramatically with depolarization. In F, the behavior of Hill coefficient as a function of command potential predicted by Fig. 1 is displayed over a wider range of potentials. Predictions from Fig. 1 assuming Mg2+ inhibition of the high affinity site (Table , column D) are shown both without (•) and with (○) 10 mM Mg2+. Predictions from Fig. 1 with no Mg2+ inhibition (Table , column F) are also shown without (♦) and with (⋄) 10 mM Mg2+.
Mg2+ Produces Shifts of G-V Curves Resulting from α + β1 Subunit Coexpression
The ability of Mg2+ to shift G-V curves at a given Ca2+ is somewhat reminiscent of the effect of the β1 and β2 auxiliary subunits of BK channels (McManus et al. 1995; Meera et al. 1996; Wallner et al. 1999; Xia et al. 1999). If Mg2+ were acting to mimic the effects of an associated β subunit, Mg2+ might be ineffective on channels resulting from α + β subunit coexpression. To test this possibility, the effects of different concentrations of Mg2+ on α + β1 currents elicited with 100 μM Ca2+ were examined. Normalized G-V curves were generated for a set of four patches. The V0.5 for current activation with 100 μM Ca2+ was −110.9 ± 1.5 mV, whereas, for 1, 2, 10, and 20 mM Mg2+, values for V0.5 were −123 ± 2.4 mV, −129.7 ± 1.6 mV, −140.0 ± 1.3, and −148.9 ± 1.3 mV, respectively. In this set of patches, the net effect of 10 mM Mg2+ is to shift the V0.5 about −30 mV, which is less than observed in the absence of the β1 subunit. However, it is clear that Mg2+ is able to exert much of its effect, irrespective of the presence or absence of the β1 subunit.
Effects of Mg2+ Do Not Result from Changes in Ca2+ Binding Affinity
The primary effects of Mg2+ that require explanation are as follows. First, 10 mM Mg2+ appears to produce a similar shift in V0.5 at both 0 and 300 μM Ca2+ with somewhat smaller shifts at 4 and 10 μM. Second, Mg2+ does not substitute for Ca2+ in the high affinity Ca2+-dependent steps that participate in increases in current activation rate. Third, mM Mg2+ shares with mM Ca2+ the ability to slow deactivation, an effect which does not exhibit saturation until over 10 mM divalent. Finally, Mg2+ produces a slowing of current activation with 4 and 10 μM Ca2+ under conditions of near maximal current activation. Can these effects be accounted for by a single mechanism of action?
To guide our thinking, we first consider the particular 50-state model presented by Cox and Aldrich 2000 to account for the dependence of steady-state conductance on voltage and Ca2+. The steady-state predictions of their formulation are summarized in the following equation:
 |
3 |
where B = [(1 + Ca/Kc)/(1 + Ca/Ko)]4 with Kc is the Ca2+ binding equilibrium for the closed channel, Ko is the Ca2+ binding equilibrium for the open channel, L(0) is the open-to-closed equilibrium constant when no voltage sensors are active and no Ca2+ binding sites are occupied, Q, the gating charge associated with this closed to open equilibrium, Vhc, is the voltage at which a single voltage sensor is active half the time when the channel is closed, and Vho, is the voltage at which a single voltage sensor is active half the time when the channel is open, and Z is the equivalent gating charge associated with each voltage-sensor's movement. This formulation assumes that voltage-dependent transitions and Ca2+ binding transitions in each subunit are independent and that Ca2+ binding affinity is not influenced by movement of voltage sensors.
Might alteration by Mg2+ of any parameters in the above equation provide suggestions concerning how Mg2+ may produce relatively similar shifts in G-V curves at both 0 and 300 μM Ca2+? To test this possibility, we empirically adjusted various parameters in to ascertain whether any would reproduce the key features of the G-V curves, i.e., the relatively constant shift at all [Ca2+] and the increase in slope at 0 Ca2+. Of all the possible parameters, only adjustment of two parameters were qualitatively able to mimic the effects of Mg2+. First, adjustment of Vho, the term for the voltage at which a single voltage sensor is half the time active when the channel is open, could produce a relatively similar shift at all Ca2+ and increase the slope at 0 Ca2+. Similarly, the magnitude of L(0) shifts the family of G-Vs in a somewhat parallel fashion along the voltage axis as shown previously (Cox and Aldrich 2000). Thus, in accordance with the assumptions of this model, this would argue that the effects of Mg2+ might result from an increase in the stability of the open states perhaps either by stabilizing the voltage sensors in the active configuration or by simply affecting the equilibrium between the closed and open conformations. In contrast, the effects of Mg2+ are entirely inconsistent with any model in which Mg2+ might somehow change the affinity of Ca2+, i.e., Kc or Ko.
A 250-state Allosteric Model Describes the Effects of Mg2+
We next considered whether a particular stochastic model incorporating binding of Mg2+ might allow an explicit analytical evaluation of the effects of Mg2+. We begin with the specific 50-state model proposed by Cox and Aldrich described above in which Ca2+ binding and voltage-sensor movement are not coupled. Based on the tetrameric nature of the channel (Shen et al. 1994), we postulate a Mg2+ binding site on each subunit. The result of the addition of four independent Mg2+ binding steps to the basic 50-state model is shown for one case in Fig. 1. Basically, for each of the two tiers characteristic of the 50-state model, there are now four additional sets of the two tiers corresponding to binding of one, two, three, or four Mg2+ cations. Each pair of tiers corresponding to a different extent of ligation by Mg2+ is designated by I-V. Any state in I is connected to the corresponding state in II by a Mg2+ binding step. Similarly, any state in II is connected to the corresponding states in either I or III by Mg2+ dissociation and association, respectively. This is indicated in Fig. 1 by the pathways connecting the lower and leftmost state in each tier to the lower and leftmost states in adjacent tiers with constants determined by K(l)o and K(l)c, the binding constants of a divalent cation to the low affinity site on either open or closed channels, respectively. This results in a total of 250 states, which results naturally from the fact that gating is regulated by three parameters, voltage, Ca2+, and Mg2+ (or other divalent).
Scheme S1.
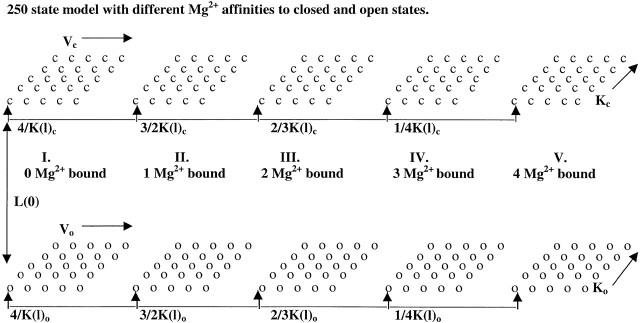
Analytic evaluation of a 250-state model depends on specific assumptions about the relationship between Mg2+ binding steps and other transitions. Because the effects of Mg2+ are apparent in 0 Ca2+, we exclude from consideration the case where binding of Mg2+ is assumed to influence either Ko or Kc, the affinities of Ca2+ to open or closed channels, respectively. Here, we first consider the case (given in Fig. 1) in which we propose that binding of Mg2+ (or mM Ca2+) to open and closed channels may occur with different affinities. This low affinity binding would have no effect on voltage-sensor equilibria or Ca2+ binding affinities. The shift in V0.5 would be driven by the higher affinity with which Mg2+ binds to open states. This would be analogous to the binding of Ca2+ to its high affinity site, although independent of that effect. In essence, binding of Mg2+ would be coupled to changes in L(0) between adjacent pairs of tiers given in Fig. 1.
For solution of steady-state equations for the 250-state model for Fig. 1, in addition to the seven parameters required to describe the 50-state model in , the system is also defined by two additional parameters, K(l)o and K(l)c, the affinity of Mg2+ (and or Ca2+) to the low affinity divalent cation binding site when the channel is either open or closed, respectively. Fractional conductance for Fig. 1 as a function of [Ca2+], voltage, and divalent cation concentration ([D]) is given by:
 |
4 |
where
 |
[D] corresponds to the concentration of divalent cation acting at the low affinity sites, and other parameters are as defined above. Despite the marked increase in number of states compared with the 50-state model, the form of the equation is similar to with only two additional free parameters. For cases in which there are two species of divalent cations that may act at the low affinity sites, but with somewhat differing affinities, this expression is obviously not sufficient.
To examine the effects of Mg2+ and high Ca2+ in terms of Fig. 1, we used four different data sets, each a set of patches obtained under a particular range of divalent cation concentrations. Set 1 entailed [Ca2+] from 0 to 100 mM, set 2 used 0 Ca2+ with [Mg2+] from 0 to 100 mM, set 3 used 300 μM Ca2+ with [Mg2+] from 0 to 100 mM, and set 4 used both 0 and 300 μM with [Mg2+] from 0 to 100 mM. In Fig. 14 A, it can be seen that the G-V curves from data set 1 can be quite well-described by . The displayed fit in Fig. 14 A is based on the values in Table (column A). When L(0) was left unconstrained, the value converged within the range of 500,000–700,000 with very large confidence limits. Varying this value did not result in any improvement in the fit, which indicates that L(0) cannot be well-defined by this procedure. Of the parameters in , those pertaining to the Ca2+ binding steps are the most well constrained, whereas the parameters relating to movement of voltage sensors do not appear to be precisely described. The large confidence limits for Vhc, Vho, and L(0) reflect the fact that these parameters tend to be correlated and relatively large changes in one parameter can be compensated for by changes in another parameter. However, for a variety of assumptions about the values of L(0), Vhc and Vho, the estimates of affinity for Ca2+ of the low affinity site was consistently near 2.3 mM when the channel is closed and ∼0.66 mM when the channel is open. The difference in affinities for the low affinity site is quite a bit smaller than that observed for the high affinity Ca2+ sites, defined by Kc and Ko. However, these values for K(l)o and K(l)c suggest that the low affinity site, should this model be correct, may contribute substantially to the position of the G-V curve over the range of Ca2+ from 100 μM to 1 mM.
Figure 14.
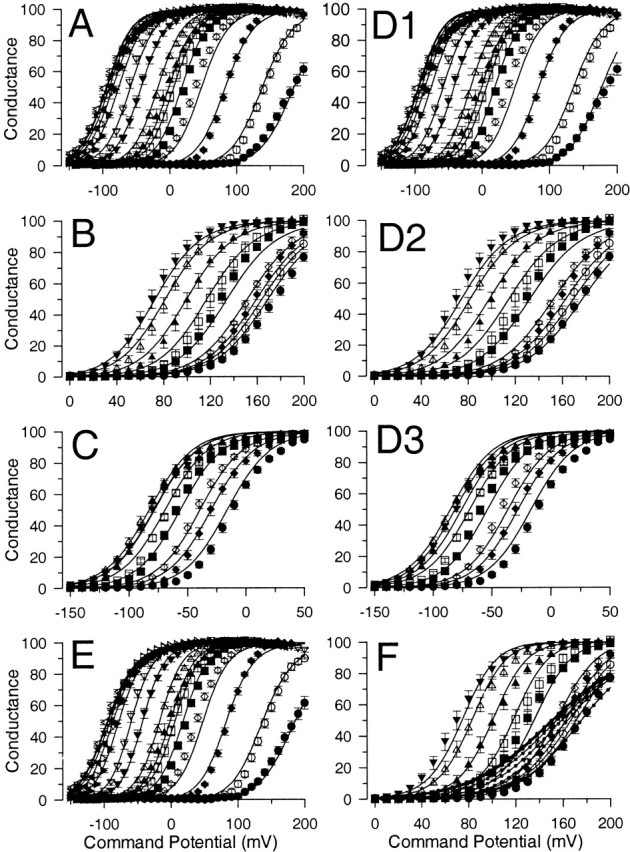
The dependence of Slo1 conductance on Ca2+, Mg2+ and voltage can be described by a 250 state allosteric model involving the independent action of Ca2+, Mg2+ and voltage-sensor movement. In A, G-V curves obtained at different [Ca2+] given in Fig. 2 D (data set 1) were fit with with the solid lines resulting from the values given in column A, Table . L(0) was constrained to 500000. In B, G-V curves obtained with 0 Ca2+ (•) plus 0.5 (○), 1 (♦), 2 (⋄), 5 (▪), 10 (□), 20 (▴), 50 (▵), and 100 (5) mM Mg2+ (data set 2) were also fit with , with parameters given in Table , column B. In C, G-V curves obtained with 300 μM Ca2+ with [Mg2+] from 0 to 100 mM (data set 3; symbols are as in B, but with no 0.5-μM points) were fit with . The solid lines correspond to the fit resulting from the values given in column C, Table . Comparison of the values in columns A, B, and C indicate that quite similar values yield a good general description of G-V curves over all [Ca2+], all [Mg2+], and all voltages, except that the multiple Mg2+ binding affinities defined by are not well-described in the fit to data set 3. In D1–D3, G-V curves shown in A-C were simultaneously fit with , yielding the values given in Table (column D). Again, the general features of the shift in curves as a function of Ca2+ and Mg2+ is reasonably well-described. In E, G-V curves obtained over all [Ca2+] were fit with , which assumes that Mg2+ influences the voltage-sensor equilibrium. Fitted curves correspond to values given in Table (column A). In F, G-V curves at 0 Ca2+ were also fit with . When values obtained from fitting G-V curves at higher Ca2+ were used, it was not possible to obtain estimates for Km and E that resulted in adequate descriptions of the data. The curves with open circles were generated from values in column C, Table . L(0) was set to a value in which currents in 0 Ca2+ were well-described. However, the G-V curves at 10 and 50 mM Mg2+ could not be captured. However, when more parameters were left unconstrained, could yield a fit that captured the G-V curves in 0 Ca2+ (smaller closed circles), but these values (column D, Table ) totally failed to describe the behavior of G-V curves at higher Ca2+.
Table 1.
Parameter Estimates from Fitting Fig. 1 to GV Curves Generated under Various Conditions
| (A) ΔCa2+ | (B) ΔMg2+ alone | (C) 300 μM Ca2+ + ΔMg2+ | (D) 0, 300 μM Ca2+ + ΔMg2+ | (E) 0, 300 μM Ca2+ + ΔMg2+ | ||
|---|---|---|---|---|---|---|
| K(h,mg)c = K(h,mg)o | K(h,mg)c! = K(h,mg)o | |||||
| Units | Data set 1 | Data set 2 | Data set 3 | Data set 4 | Data set 4 | |
| K(h,ca)c | μM | 11.2 ± 0.48 | 11.2 | 11.2 | 11.2 | 11.2 |
| K(h,ca)o | μM | 1.28 ± 0.05 | 1.3 | 1.3 | 1.3 | 1.28 |
| Vhc | mV | 41.8 ± 21.3 | 41.8 | 41.8 | 41.8 | 41.8 |
| Vho | mV | −125 ± 12.4 | −125 | −125 | −125 | −125 |
| z | 0.28e | 0.28 | 0.28 | 0.28 | 0.28 | |
| Q | 0. 86 ± 0.04e | 0.96 ± 0.07 | 0.89 ± 0.01 | 0.93 ± 0.01 | 0.97 ± 0.01 | |
| L(0) | 500,000 | 500,000 | 500,000 | 500,000 | 500,000 | |
| K(l,mg)c | mM | — | 22.13 ± 1.28 | 8.46 ± 1.60 | 14.1 ± 1.04 | 19.59 ± 1.35 |
| K(l,mg)o | mM | — | 5.96 ± 0.27 | 2.05 ± 0.20 | 3.46 ± 0.19 | 3.24 ± 0.15 |
| K(l,ca)c | mM | 2.33 ± 0.12 | — | 2.329 | 2.321 | 2.321 |
| K(l,ca)o | mM | 0.66 ± 0.035 | — | 6.62 | 0.661 | 0.661 |
| K(h,mg)c | mM | — | — | 9.31 ± 30.46 | 8.24 ± 1.17 | 3.26 ± 0.41 |
| K(h,mg)o | mM | — | — | 5.90 ± 23.60 | — | 4.73 ± 0.40 |
| SSQ/pt | 6.34 | 5.88 | 6.82 | 20.5 | 17.87 |
Data set 1: [Ca2+] from 0, 1, 4, 10, 30, 60, 100, 300 mM and 1, 2, 5, 10, 20, 50 and 100 mM. Data set 2: 0 Ca2+ plus 0, 0.5, 1, 2, 5, 10, 20, 50, and 100 mM Mg2+. Data set 3: 300 mM Ca2+ plus 0, 1, 2, 5, 10, 20, 50, and 100 mM Mg2+. Data set 4: 0 and 300 mM Ca2+ plus 0, 1, 5, 10, 50, and 100 mM Mg2+. K(h)c and K(h)o correspond to high affinity binding constants for closed and open states, respectively, with ca and mg reflecting the affinities for Ca2+ and Mg2+, respectively. K(l)c and K(l)o correspond to low affinity binding constants for closed and open states, respectively, with ca and mg reflecting the affinities for Ca2+ and Mg2+, respectively.
We next examined the ability of to describe the G-V curves obtained with 0 Ca2+ with varying Mg2+ (data set 2). The resulting fit is shown graphically in Fig. 14 B with values listed in Table (column B). For fitting the 0 Ca2+ plus Δ[Mg2+] G-V curves, values for Ko and Kc were constrained to those obtained when fitting the data over all [Ca2+], since in the absence of Ca2+, these parameters are not defined. Furthermore, we constrained the value of L(0) to that used in column A. This gave an adequate fit to the data, with K(l)o of ∼6.0 mM and K(l)c of 22.1 mM. When the 0 Ca2+ plus various [Mg2+] curves from data set 4 were similarly fit, the resulting estimates of K(l)o and K(l)c were 5.7 ± 0.3 and 24.4 ± 1.5 mM, respectively. Thus, binding of Mg2+ to the low affinity site appears to be about seven to eight times weaker than binding of Ca2+.
Guided by the analysis of Shi and Cui 2001b, we have extended to include terms for both the differential affinities of Ca2+ and Mg2+ for the low affinity site and for the inhibitory action of Mg2+ on the high affinity site. From of Shi and Cui 2001b and our , an equation defining the fractional conductance as a function of voltage, [Ca2+], and [Mg2+], reflecting the differential affinities of both divalent cations to each binding site is obtained:
 |
5 |
where
 |
6 |
and
 |
7 |
This system is defined by four separate binding affinities for both Ca2+ and Mg2+, reflecting binding of each divalent cation to either the open or closed states (subscripts o and c) or to the low or high affinity sites (K(l), K(h)). Term, Bh, and is equivalent to that used by Shi and Cui 2001b to describe competition between Mg2+ and Ca2+ for the higher affinity site, whereas Bl arises from the same considerations applied to the lower affinity site. The relative ability of a cation to act as an activator or inhibitor depends on the ratio of the relative affinities of a particular cation for the closed state compared with the open state. As proposed by Shi and Cui 2001b, at the high affinity site K(h,mg)c = K(h,mg)o so that occupancy of the high affinity site by Mg2+ simply inhibits the ability of Ca2+ to activate the channel.
Therefore provides a tool to evaluate the adequacy of Fig. 1 in the presence of potentially competing species of divalent cations. Therefore, we used to fit G-V curves obtained with 300 μM Ca2+ and varying [Mg2+]. Using values defined above for the high affinity Ca2+ binding, the result of fitting to the G-V curves with 300 μM Ca2+ is shown in Fig. 14 C. Again, values for can be found that fit the G-V curves reasonably well (Table , column D) even when most parameters are constrained to values obtained for the Ca2+ data set. However, estimates for K(l,mg)c and K(l,mg)o differ from those in Table (column B), possibly because of the limited data set being used to define four different Mg2+ affinities. Therefore, we also fit data set 4 in which mM Mg2+ was added to either 0- or 300-μM Ca2+ solutions in the same set of patches. This yielded the values in Table , column E, for the assumption that K(h,mg)c = K(h,mg)o and column F for the assumption that K(h,mg)c! = K(h,mg)o. Although the latter assumption improves the fit, these data sets are probably not robust enough to define such parameters well.
We next used to fit all G-V values in data sets 1–3 or data sets 1 and 4 simultaneously. In this case, we left the binding affinities for both low and high affinity sites unconstrained during the fitting procedure. The result of a simultaneous fit of data sets 1–3 is shown in Fig. 14 D with values given in Table , column B. Although individual curves are not as well-described as in Fig. 14 (A–C), the general features of the dependence of the G-V curves on Mg2+ and Ca2+ are retained. Similar values were also obtained from a simultaneous fit to data sets 1 and 4 (Table , column D). Table also lists the fits to the various data sets with differing assumptions about affinity of Mg2+ to the high affinity sites, including the absence of Mg2+ binding to those sites. Although adequate fits can be obtained when it is assumed that Mg2+ does not bind to the high affinity sites, it is clear that such an assumption fails to describe the rightward shift of G-V curves that occurs at 100 mM Mg2+ in the presence of 300 μM Ca2+.
Table 2.
Parameter Estimates from Simultaneous Fitting of Data Sets Generated under Different Conditions
| Fitting assumption | (A) K(h,mg)c! = K(h,mg)o | (B) K(h,mg)c = K(h,mg)o | (C) No Mg2+ high affinity binding | (D) K(h,mg)c! = K(h,mg)o | (E) K(h,mg)c = K(h,mg)o | (F) No Mg2+ high affinity binding | |
|---|---|---|---|---|---|---|---|
| Units | Data set 1–3 | Data set 1–3 | Data set 1–3 | Data set 1,4 | Data set 1,4 | Data set 1,4 | |
| K(h,ca)c | μM | 12.45 ± 0.49 | 14.15 ± 0.57 | 13.37 ± 0.53 | 12.49 ± 0.64 | 12.83 ± 0.64 | 11.02 ± 0.61 |
| K(h,ca)o | μM | 1.42 ± 0.04 | 1.46 ± 0.043 | 1.42 ± 0.043 | 1.42 ± 0.05 | 1.42 ± 0.05 | 1.34 ± 0.06 |
| Vhc | mV | 41.8 | 41.8 | 41.8 | 41.8 | 41.8 | 41.8 |
| Vho | mV | −125 | −125 | −125 | −125 | −125 | −125 |
| z | 0.28 | 0.28 | 0.28 | 0.28 | 0.28 | 0.28 | |
| Q | 0.91 ± 0.0048 | 0.89 ± 0.005 | 0.89 ± 0.005 | 0.92 ± 0.007 | 0.91 ± 0.01 | 0.92 ± 0.01 | |
| L(0) | 500,000 | 500,000 | 500000 | 500,000 | 500,000 | 500,000 | |
| K(l,mg)c | mM | 18.5 ± 0.76 | 11.14 ± 0.61 | 9.71 ± 0.50 | 16.85 ± 1.07 | 14.17 ± 0.91 | 10.39 ± 0.71 |
| K(l,mg)o | mM | 3.00 ± 0.101 | 3.19 ± 0.14 | 2.92 ± 0.13 | 3.28 ± 0.16 | 3.45 ± 0.170 | 2.88 ± 0.17 |
| K(l,ca)c | mM | 2.5 ± 0.14 | 3.05 ± 0.19 | 2.80 ± 0.17 | 2.50 ± 0.17 | 2.61 ± 0.18 | 2.100 ± 0.14 |
| K(l,ca)o | mM | 0.68 ± 0.04 | 0.919 ± 0.059 | 0.82 ± 0.048 | 0.67 ± 0.051 | 0.73 ± 0.053 | 0.535 ± 0.14 |
| K(h,mg)c | mM | 4.16 ± 0.32 | 22.14 ± 3.95 | — | 4.42 ± 0.601 | 7.35 ± 0.76 | — |
| K(h,mg)o | mM | 7.00 ± 0.40 | — | — | 5.43 ± 0.52 | — | — |
| SSQ | 8606/1032 pts 8.34 | 11078/1032 pts 10.37 | 11476/1032 pts 11.12 | 11536 /885 pts 13.04 | 12359/885 pts 13.96 | 14893/885 pts 16.83 | 8606/1032 pts 8.34 |
On balance, examination of the values in Table suggest that, despite some variation, the two sets of data (data sets 1–3, and data sets 1 and 4) yield quite comparable estimates for various binding affinities. The results indicate that Ca2+ affinity to the low affinity site is approximately seven- to eightfold greater than the Mg2+ affinity. The intrinsic allosteric effectiveness (Kc/Ko) of Mg2+ for the low affinity site may be somewhat greater than that of Ca2+. However, when data sets with either Ca2+ alone or Mg2+ alone are compared, the allosteric effectiveness of either Ca2+ or Mg2+ at the high affinity site appears similar. It is possible that other effects of the very high divalent cation concentrations used here may impact somewhat on the reliability of these estimates. Finally, Mg2+ appears to inhibit the high affinity site, with a K d of ∼7–20 mM. Thus, on balance, the particular formulation of the 250-state model given in and provides a quite good description of the effects of high concentrations of Ca2+ or Mg2+ on the steady-state G-V curves of Slo1 currents, with the binding of Ca2+ being approximately seven- to eightfold stronger than that of Mg2+.
The values in Table exhibit some deviations in some parameters from those estimated in earlier studies (Cox and Aldrich 2000; Zeng et al. 2001). Although some variation is expected simply because of variability in the positions of G-V curves along the voltage-axes among different sets of data, the values of Z and Q seem a bit surprising. We refit the G-Vs obtained with different Ca2+ solutions using only data obtained with [Ca2+] of 300 μM and lower using to determine to what extent the use of or might have impacted on the parameter estimates. These values are given in column E of Table . In this case, values for Q and Z fall much closer to those obtained by Cox and Aldrich 2000(given in column F), which were guided by estimates from Horrigan for voltage-dependent parameters obtained from activation of Slo1 currents at 0 Ca2+ (Horrigan and Aldrich 1999; Horrigan et al. 1999). Some of the variation in estimates of Z and Q among different studies most certainly results from the simple process of averaging G-V curves, such that variation among individual G-V curves among patches will result in averaged curves with lessened voltage dependence. In addition, to evaluate the significance of the rather large value for Q and smaller value for Z obtained through the use of and , we refit the G-V curves obtained over all Ca2+ (data set 1) while constraining the values for Q and Z to those used by Cox and Aldrich 2000. This resulted in estimates of K(l,ca)o and K(l,ca)c for Ca2+ similar to those already given, although values for L(0), Vhc, and Vho were altered. On balance, the overall quality of the fits were only somewhat poorer. This analysis would suggest that values for L(0), Vhc, Vho, Q and Z are not well-constrained by this procedure, presumably because of correlations between parameters. However, values for Ca2+ and Mg2+ affinities appear to be critical for obtaining acceptable fits.
Table 3.
Allosteric Regulation of Voltage-sensor Equilibria Is Unlikely to Account for the Dependence of Slo1 G-V Curves on Millimolar Ca2+ or Mg2+
| Units | (A) Ca2+ alone: unconstrained | (B) Δ[Mg2+]; 0 Ca2+ | (C) Δ[Mg2+]; 0 Ca2+ | (D)300 μM Ca2+ + Δ[Mg2+] | (E) for 0–300 μM Ca2+ | (F) Cox and Aldrich | |
|---|---|---|---|---|---|---|---|
| Kc | μM | 12.22 ± 0.77 | 12.22 | 12.22 | 12.22 | 1.42 ± 0.11 | 7.42 |
| Ko | μM | 1.35 ± 0.10 | 1.35 | 1.35 | 1.35 | 15.95 ± 1.05 | 0.80 |
| Vhc | mV | 87.1 ± 12.0 | 87.1 | 3363.3 | 87.1 | 156.6 ± 87.1 | 141.8 |
| Vho | mV | −29.9 ± 41.7 | −29.9 | 221.7 ± 663.4 | −29.9 | −97.4 ± 139.4 | −1.0 |
| Z | 0.38 ± 0.05e | 0.38e | 0.38e | 0.38 ± 0.01e | 0.35 ± 0.05e | 0.51e | |
| Q | 0.69 ± 0.05e | 0.69e | 0.69e | 0.69 ± 0.04e | 0.38 ± 1.17e | 0.40e | |
| L(0) | 9.8 × 10⁴ ± 2.4 × 10⁵ | 65,000 | 499.1 ± 8415 | 98,242 | 2.785 × 10⁶ | 2.91 × 10⁵ | |
| Km | mM | 7.3 ± 2.0 | 18.0 ± 19.6 | 24.6 ± 113 | 11.48 ± 0.530 | — | — |
| E | 2.15 ± 0.23 | 2.148 | 2.148 | 1.99 ± 0.01 | — | — |
(A) All values were unconstrained. (B) All values except those for Mg2+ action were constrained to those in Column A, except that L(0) was adjusted to allow the curve at 0 Ca2+ to be well described. No values could be found for Km and E that allowed to describe the effects of Mg2+ at low Ca2+. (C) A decent fit at low Ca2+ could be obtained, but values for L(0), Vhc and Vho differ drastically from those required to describe the effects of Ca2+ and Mg2+ in A, B, and D. (D) Effects of Mg2+ with 300 μM Ca2+ can be described by the results obtained with Ca2+ alone. (E) was used to fit G-V curves obtained from 0 Ca2+ to 300 μM Ca2+. (F) Values are from Cox and Aldrich 2000.
Fig. 1 Adequately Describes the Effects of Millimolar Ca2+ and Mg2+
We next examined the extent to which Fig. 1 and and might account for other aspects of the data. To accomplish this, families of G-V curves predicted by Fig. 1 with values given in Table , Column D were subjected to analysis similar to that employed on actual Slo1 currents. The predictions from Fig. 1 are overlaid over various experimentally measured values in Fig. 5. In Fig. 5 A, the predicted shift in V0.5 caused by different [Mg2+] is plotted over the actual data points for both data sets 3 and 4. The idealized curve was generated assuming Ca2+ of 300 μM with the indicated [Mg2+]. In Fig. 5 (B and C), the prediction for shifts produced by 10 mM Mg2+ at different [Ca2+] are compared with actual data. Fig. 1, when the inhibitory action of Mg2+ on the high affinity site is included, does an excellent job (Fig. 5 C) of explaining the reduction in shift in V0.5 seen at both 4 and 10 μM Ca2+, which is consistent with the observations of Shi and Cui 2001b. Fig. 5 C also shows the expectations for the shift in V0.5, when Mg2+ binding to the inhibitory site is not assumed. One of the compelling aspects of Fig. 5C is that G-V curves obtained with 4 and 10 μM Ca2+ with and without Mg2+ were not used in the fitting process we have employed. Yet, the inhibition by Mg2+ that is observed with 300 μM Ca2+ and more elevated Mg2+ does allow a reasonable prediction of the inhibitory effects of 10 mM Mg2+ observed at 4 and 10 μM Ca2+. Finally, in Fig. 5 D, the predictions for Fig. 1 for the relationship between V0.5 as a function of Ca2+ are compared with actual data. Similarly, the prediction for the behavior of V0.5 resulting from channels containing only the high affinity binding sites is compared with the data corrected for the low affinity affect of Mg2+. The correspondence is quite good, with the differences in the latter case arising from the simple fact the Mg2+ correction does not take into account an ∼17-mV shift caused by 300 μM Ca2+ acting at the low affinity site.
Given that Ca2+ is likely to be acting at both low and high affinity binding sites to regulate BK gating it is natural to ask how much effect will binding to the low affinity sites have at various Ca2+ concentrations. From examination of the expectations of Fig. 1 for V0.5 arising from the high affinity sites alone and for V0.5 arising from both sites, the amount of V0.5 shift resulting from action on the low affinity sites can be determined. For 10, 30, 60, 100, 300 μM and 1 mM, the expected negative shifts in V0.5 resulting from the high affinity site predicted by Fig. 1 (Table , column D) are 0.83, 2.4, 4.5, 7.3, 18.6, and 41.6 mV, respectively. Thus, in cases where local Ca2+ may rise towards 100 μM, the low affinity site will contribute appreciably to regulation of BK current.
Fig. 1 Can Account for Unusual Aspects of the Behavior of Hill Coefficients
Another unusual aspect of our observations with high [Ca2+] or with high [Mg2+] were the properties of Hill coefficients and apparent K d for Ca2+ action as a function of voltage. Therefore, from idealized G-V curves generated from the values of Table , column D, we generated plots of the activation of conductance as a function of Ca2+. From these, the values for Hill coefficient and K d were obtained, following the same procedure used for our experimental results. The Hill plots for the Fig. 1 predictions are given in Fig. 12 B, and the resulting values for K d and Hill coefficient are overlaid over the actual data in Fig. 12 (C and D, respectively), showing a strong correspondence. The behavior of the Hill coefficient predicted by Fig. 1 is particularly remarkable, exhibiting a complex voltage dependence that mirrors that determined from the actual data set. The deviations that are observed are probably inconsequential given that so many factors discussed earlier can contribute to unreliability in the Hill coefficient estimates.
We next turned to expectations of Fig. 1 for the effects of Mg2+ on the Hill coefficient using G-V curves generated from values in Table , column D. From Hill plots obtained for Fig. 1 predicted G-V curves, estimates of K d and Hill coefficient with and without Mg2+ are plotted in Fig. 13 (E and F, respectively), for both the assumption of Mg2+ inhibition of the high affinity site and lack of inhibition. As just shown, the apparent affinity is increased with depolarization, with Mg2+ producing an increase in apparent affinity at all voltages (Fig. 13 E). A segment of the Fig. 1 predictions are also overlaid over the data in Fig. 13 C showing the correspondence between data and model. In this case, we refit the simulated Hill plots using only values for 1 μM to 1 mM Ca2+, with and without addition of 10 mM Mg2+. As shown, Fig. 1 predicts that Mg2+ will increase the apparent Hill coefficient over the range of voltages (0-50 mV) that have typically been examined in previous studies (Golowasch et al. 1986; Oberhauser et al. 1988). However, above +50 mV the values in the presence and absence of Mg2+ converge, although this is a range that is difficult to study experimentally with added Mg2+. The essential point is that Fig. 1 does predict that Mg2+ should cause an increase in apparent Hill coefficient, although it should be kept in mind that this effect has nothing to with numbers of Ca2+ binding sites per se. Predictions for the Hill coefficients were also generated for Fig. 1, but for the case in which the Mg2+ inhibitory effect on the high affinity site does not occur. The expectations for the Hill coefficients are largely unchanged, indicating that Mg2+ block per se does not contribute to the Mg2+ dependence of the Hill plots, but rather that the Hill plots are a reflection of the existence of multiple divalent cation regulatory sites with differing affinities. Thus, for this channel, the activation of conductance is a complex function of multiple kinds of divalent cation binding sites with differing affinities, such that a Hill plot may not be mechanistically informative tool for analysis of this channel.
Coupling of Mg2+ Binding to Voltage-sensor Equilibria Is Unlikely to Account for the Results
Although Fig. 1 seems to provide a quite compelling description of the behavior of Slo1 currents over a variety of conditions, it should be kept in mind that alternative assumptions for a 250-state model can also be made. Therefore, we considered the possibility that the low affinity divalent cation site may somehow be coupled to the equilibria of the voltage-sensor movement (Vo or Vc), such that, dependent on the extent of ligation by Mg2+, the voltage-sensor equilibrium would now be defined by Vo(0)–Vo(4), and Vc(0)–Vc(4). This is given in Fig. 2.
Scheme S2.
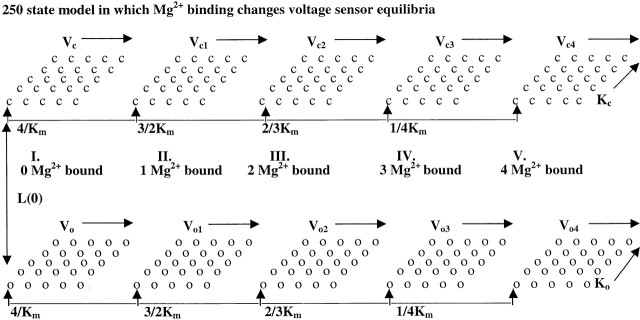
The resulting set of equations therefore contains terms for Km, the affinity of Mg2+ binding, and terms for voltage-sensor movement just given. We then assumed that the binding of each Mg2+ alters the voltage-sensor equilibria by an allosteric factor, E, such that Vc(1) = EVc(0), Vc(2) = E2Vc(0), and so on. This assumption which has parallels in the analysis of Horrigan regarding coupling of voltage-sensor movement and channel opening (Horrigan and Aldrich 1999) results in two additional free parameters, E and Km over the terms introduced in (Cox and Aldrich 2000). However, the resulting equation is considerably more complex than that given in . Specifically,
 |
8 |
where for i = 1–4
 |
and for i = 0–4,
 |
L, Kc, Ko, Vhc, and Vho, Z, and Q are identical to their meanings given above. As expected, when [D] is 0 or Km is exceedingly high, is reduced to . The fit of to the G-V curves obtained over all Ca2+ is given in Fig. 14 E with values given in Table (column A), whereas the fit to G-V curves obtained with 0 Ca2+ and various [Mg2+] is given in Fig. 14 F with values in Table (columns B and C). Although actually yielded a smaller sums of squares to the G-V curves obtained over all Ca2+ than , when the values obtained for fitting G-V curves over all Ca2+ were used to fit the results at 0 Ca2+, was not successful in yielding values that could adequately describe the effects of Mg2+ at 0 Ca2+. Thus, for the two different data sets, yielded entirely different parameter estimates, indicating that some assumption made in Fig. 2 and does not account for the behavior of Slo1 currents.
However, when the allosteric factor E in the above equations was altered so that its value was somewhat greater for open channels than for closed channels, it was possible to obtain values that could describe the behavior at low Ca2+. This adjustment in effect creates an extra free parameter beyond that used in . Furthermore, if the voltage-sensor equilibrium is affected differently by Mg2+ when the channel is open or closed, this implicitly requires that Mg2+ affinity be different in the two cases, analogous to the case we previously considered. Thus, a model in which binding of each Mg2+ alters the voltage-sensor equilibrium by a constant allosteric factor appears inadequate to account for the present results. It should be kept in mind that the present use of a Mg2+-dependent allosteric factor is only one way that Mg2+ binding might be related to the voltage sensor equilibrium. However, we have also considered the case that binding of each Mg2+ results in a fixed shift (ΔV) for either Vhc or Vho. Analysis of this case yielded results similar to that obtained assuming an allosteric factor, E.
Accounting for the Kinetic Effects of Mg2+
Although Fig. 1 provides a reasonable description of the effects of high concentration of Mg2+ and both low and high concentrations of Ca2+ on Slo1 G-V curves, Mg2+ and Ca2+ have distinct differences in their effects on channel kinetics. Specifically, Mg2+ does not increase current activation rates (except at very high concentrations) but slows current deactivation. In contrast, Ca2+ at μM concentrations increases current activation rates at strong activation voltages, while also slowing current deactivation over a broad range of concentrations. These effects were summarized in Fig. 11. Given the assumptions in Fig. 1, these differences might seem surprising. Both the high affinity binding site for Ca2+ and the lower affinity nonselective site are proposed to simply alter L(0), the equilibrium constant between closed and open channels at 0 mV imposed voltage. The low affinity site does not alter the high affinity binding constants and vice versa. Thus, one might expect that both Ca2+ acting on the high affinity site or Mg2+ acting on the low affinity site might result in similar effects. However, these differences can simply be explained if the high and low affinity sites differentially affect the rates of transition between closed and open states that determine L(0). Specifically, if the high affinity site primarily enhances the rate of channel opening, whereas the lower affinity site primarily regulates the rate of closing, both the steady-state G-V curves and the kinetic effects can be explained. To show this, we examined how binding of Mg2+ might alter activation and deactivation rates for a Slo1 channel gating in the absence of any Ca2+ assuming rate constants from Horrigan (Horrigan and Aldrich 1999) and Mg2+ binding constants given in Table . Binding of Mg2+ was assumed to alter the closed-open equilibrium without affecting the voltage-dependent transitions. If the coupling of Mg2+ to channel opening was entirely assigned to the channel closing rates, this resulted in a slowing of activation and deactivation time constants over all voltages, although at positive activation potentials time constants with and without Mg2+ converged. In contrast, if the coupling to the channel opening transitions is reflected in effects on both channel opening and channel closing rates, then both an increase in current activation rate and a slowing of deactivation can be observed, as seen with μM Ca2+ concentrations. This implies that the low and high affinity sites, although both allosterically coupled to the closed-open equilibrium, do so in quite distinct ways.
DISCUSSION
The dependence of activation of BK channels on cytosolic [Ca2+] is remarkable in that the dependence of BK channel open probability on voltage is shifted by a range of [Ca2+] that spans over four log orders (∼0.8 μM–20 mM). At a single voltage, the dependence of BK channel conductance on [Ca2+] is described by a typical binding isotherm involving a Hill coefficient of ∼2. To account for this enormous range of concentrations by which a single ligand can influence channel gating implicitly requires either that Ca2+ binding, per se, exhibit voltage dependence (Moczydlowski and Latorre 1983) or that there exist multiple kinds of Ca2+ binding regulatory sites each with somewhat overlapping affinities.
The present results show that at least two types of Ca2+ binding sites influence Slo1 activation. First, there are sites that bind Ca2+ quite specifically with affinities in the micromolar range. Occupation of these relatively high affinity sites typically increases the activation rate of BK channels at a given level of depolarization. Mg2+ appears to be a weak competitive inhibitor at these sites (Shi and Cui 2001b). Second, there are sites that bind Ca2+ with affinities in the millimolar range which are able to shift activation of open channels to more negative potentials. Mg2+ is able potentiate activation of the channel by binding to more strongly to these low affinity sites when the channel is open, than when it is closed. The data show that binding of divalent cations to the low affinity site has no influence on the rates of channel activation at limiting conditions, but appears to stabilize the channel in open states, thereby slowing current deactivation.
These results provide further support for the view that the voltage- and Ca2+-dependent transitions that lead to Slo1 activation are separate processes. In the presence of 10 mM Mg2+, Ca2+ concentrations above ∼100 μM do not result in any additional negative shift in the V0.5. Similarly, the rate of activation of Slo1 current at a particular voltage exhibits saturation above 100 μM Ca2+. Thus, Ca2+-dependent sites important for limiting channel activation appear to be fully occupied at [Ca2+] of 100 μM or so. In the presence of Mg2+, the V0.5 is essentially unchanged over a 100-fold increase in [Ca2+] (100 μM to 10 mM). Activation of currents under these conditions, however, remains voltage-dependent. Thus, activation of Slo1 current clearly results from separate voltage-dependent and Ca2+-dependent activation transitions as argued previously (Cox et al. 1997a; Cui et al. 1997). This conclusion implies that binding of Ca2+ to the high affinity sites is saturable. This is consistent with the apparent saturation in current activation rate observed with [Ca2+] ∼100 μM (Cui et al. 1997) and with the lack of change in single-channel kinetics at +30 mV over [Ca2+] from 132 to 1,024 μM (Rothberg and Magleby 1999).
The conclusion that Ca2+ and Mg2+ share a common low affinity binding site is justified by three results. First, the activation of Slo1 in the presence of 10 mM Ca2+ is remarkably similar to that measured in the presence of 300 μM Ca2+ plus 10 mM Mg2+. Second, the effects of very high concentrations of Ca2+ and Mg2+ on Slo1 activation do not appear to be additive. Third, the kinetic effects of similar high concentrations of Mg2+ and Ca2+ are comparable, in terms of their ability to similarly shift V0.5, slow deactivation, and have minimal affect on current activation. Together, the results show that the effects of [Ca2+] and [Mg2+] at ≥1 mM result from action at sites distinct from those affected by lower [Ca2+]. Once these low affinity sites are taken into account, the results reveal that the key Ca2+-dependent steps leading to channel activation are, in fact, saturable and voltage-independent. However, the present analysis suggests that, although these low affinity sites are relatively nonselective, they do exhibit an approximately seven- to eightfold greater affinity for Ca2+ over Mg2+.
What Is the Nature of the Low Affinity Divalent Binding Site
That high concentrations of both Ca2+ or Mg2+ produce a similar marked shift in BK current activation raises the possibility that the shift may result from the screening of negative surface charges on either the oocyte membrane or on the channel protein itself. The reduction of negative charge on or nearby ion channel proteins by divalent cations can explain negative shifts in activation of some currents (Green and Anderson 1991; Hille 1992) and the reduction of single-channel conductance in others (Imoto et al. 1988), including the BK channel (MacKinnon et al. 1989; MacKinnon and Miller 1989). However, several points argue against a surface-potential mechanism in the present case. First, the magnitude of V0.5 shifts caused by Mg2+ may be too large to be explained solely on the basis of surface charge screening. According to the Gouy-Chapman model for electrostatic potential due to fixed charges close to a membrane bilayer, divalent cations can change local potentials by a maximum of 29 mV per 10-fold increase in concentration (McLaughlin et al. 1971). Our data show that increasing [Mg2+] from 1 to 10 mM in the presence of 100 μM Ca2+ can shift activation by >45 mV. Second, the inability of Mg2+ to substantially reduce the single-channel conductance at negative potentials implies that any local field changes associated with high [Mg2+] are minimal. Third, the ability of divalent cations to screen surface charges is known to depend on the ionic strength of the surrounding solution (McLaughlin et al. 1971). The shifts described here were obtained under conditions of relatively high ionic strength, namely 160 mM K+, which would be expected to minimize any surface potential contributions. Finally, direct evidence for saturation in the effects of Mg2+ were presented, arguing that the effect involves a saturable divalent cation binding site. These observations argue against the possibility that simple screening of charges on the oocyte membrane or channel protein can account for the observed shifts in Slo1 V0.5.
Despite the likelihood that the effects of mM Ca2+ and Mg2+ cannot be accounted for by surface potential effects, the results are probably insufficient to completely exclude the possibility that some component of the shift produced by high [Ca2+] and [Mg2+] might result from other actions of these cations, perhaps involving surface charge screening. One aspect of both sets of data (data sets 3 and 4) obtained with 0 Ca2+ and [Mg2+] up through 100 mM was that clear saturation in the shifts in V0.5 was not observed (Fig. 14, D2). Our results in this regards appear similar to those of Shi and Cui 2001b, in that increases of [Mg2+] from 30 to 100 mM continues to shift V0.5. In contrast, shifts in V0.5 with elevations of [Ca2+] above 10 mM do appear to saturate. Although these differences may, in part, might simply reflect the weaker affinity of Mg2+ to the low affinity site, an additional effect of elevated divalents may also be involved. Similarly, the anomalous increase in current activation rate observed at 50 and 100 mM Mg2+ might reflect the consequence of a surface potential effect or other action of very elevated [Mg2+].
The Significance of the Hill Coefficient
The ability of Mg2+ and other divalent cations to potentiate BK channel activation by Ca2+ is associated with an increase in the Hill coefficient for activation by Ca2+ (Golowasch et al. 1986; Oberhauser et al. 1988). At +20 to +30 mV, the Hill coefficient for Ca2+-dependent activation rose from an average of 2.0 to ∼4.2 upon addition of 10 mM Mg2+ (Golowasch et al. 1986). In accordance with the significance of the Hill coefficient in studies of other ligand–effector interactions, such results, although rather perplexing, were interpreted as estimates of the minimum number of Ca2+ binding sites on the channel protein. Our results with Ca2+ alone, therefore, would appear in general agreement with this earlier work, with an increase in Hill coefficient from ∼2 to over 3 over the same voltage range with smaller increases at more negative potentials. However, even in the absence of Mg2+, Hill coefficients as high as 3–4 have been reported in some studies (Cui et al. 1997) at test potentials above +80 mV.
The present analysis suggests that some of the complexity of the behavior of the Hill coefficient for BK channels can be most simply explained by activation models involving the presence of multiple kinds of divalent cation binding sites, with differing affinities. In fact, the unusual aspect of the earlier Hill coefficient estimates may not be the higher estimates (2–3), but rather the lower estimates (0.5–1.0). The lower estimates appear to arise at voltages where the two separate binding affinities may both contribute to the Ca2+ dependence of conductance activation. In the presence of Mg2+, the contribution of Ca2+ mediated by the low affinity site is removed, such that the higher estimates largely reflect the action of Ca2+ at the high affinity sites alone. The complex shape of the behavior of the Hill coefficient predicted from Fig. 1 in the presence and absence of Mg2+ (Fig. 13 F) would seem to lend itself to additional experimentation. Unfortunately, many of the interesting voltages that could be tested are not readily amenable to reliable estimates of channel conductance as a function of [Ca2+].
Allosteric Modulation of Slo1 Current
Gating of BK channels is unusual in that two physiological stimuli, Ca2+ and voltage, act in concert to regulate activation of conductance. Even with the initial recording of single BK channels in bilayers (Moczydlowski and Latorre 1983; Vergara and Latorre 1983) and in patches from native cells (Pallotta et al. 1981; Barrett et al. 1982), it was apparent that multiple closed and open states were required to account for the behavior of single channels. With higher resolution recording and advances in analysis, the sophistication of these models increased (McManus and Magleby 1988, McManus and Magleby 1991). More recently, both from single-channel recording and macroscopic recordings of cloned Slo1 currents two-tiered 50-state activation models have provided a valuable conceptual way of relating the tetrameric nature of the channel proteins to their functional behavior (Rothberg and Magleby 1999; Cox and Aldrich 2000; Rothberg and Magleby 2000). Such 50-state, two-tiered models arise as the natural consequence of kinetic transitions corresponding to four separate Ca2+ binding steps (one to each subunit), to movement of four separate voltage-sensors, and to the channel closed to open conformational change. Dependent on postulated coupling among different kinetic transitions, a variety of 50-state models can be considered. However, Cox and Aldrich found that by making one particular assumption they were able to describe the behavior of Slo1 G-V curves over a wide range of Ca2+ concentrations (Cox and Aldrich 2000). Specifically, Ca2+ binding steps and movement of the voltage sensors were postulated to occur entirely independently. This conclusion has been nicely supported by mutations in the S4 voltage-sensing region, which support the idea that activation energy provided by voltage and Ca2+ binding are additive (Cui and Aldrich 2000). However, both in our earlier work (Wei et al. 1994; Solaro et al. 1995) and the work of others (Cox et al. 1997a), there have been indications that there may be effects of Ca2+ at higher concentrations which would not be accounted for by the 50-state models so far considered.
Here, following previous models that take into account the tetrameric nature of the channel protein, we have extended the general 50-state two-tiered model to now include four low affinity divalent cation sites. The consequence of the addition of these four additional sets of tiers is a 250-state model. However, although the number of states in such models may, at first glance, seem unmanageable, the allosteric nature of such schemes allows useful simplying analytic assumptions that in many ways are conceptually much simpler than many sequential schemes involving even an order of magnitude fewer kinetic states. With the addition of Mg2+ binding steps, three possible interpretations of the action of Mg2+ could be imagined. In one case, Mg2+ might in some way alter the affinity of Ca2+ for its binding sites. This possibility was excluded from consideration, since the effects of Mg2+ are apparent in the complete absence of Ca2+. Mg2+ might also alter the equilibrium of voltage-sensor movement. In the second case, we evaluated two different assumptions about how Mg2+ binding might be coupled to movement of voltage-sensor movement. In both cases, parameter estimates that described the results at higher Ca2+ concentrations failed to describe the effects of Mg2+ at 0 Ca2+. Thus, this category of model fails to describe the results, unless additional assumptions are made. Finally, we showed that a model in which Mg2+ binding is not coupled either to Ca2+ binding or to voltage-sensor movement does a quite adequate job of describing many facets of the behavior of Slo1 currents studied with Ca2+ and Mg2+.
The presence of both low affinity and high affinity Ca2+ binding sites provides a compelling explanation for how Ca2+, over such a wide range of concentrations, can continue to shift V0.5. At the highest concentrations, our results show that eventually a limit to the shift in V0.5 does occur but not until [Ca2+] in excess of 20 mM. Yet, the two binding sites postulated here allow a remarkably linear shift in V0.5 from ∼1 μM to 20 mM, a concentration range spanning over four orders of magnitude. As pointed out initially, there are differences among different studies in how V0.5 varies with Ca2+ over this range. Some studies have revealed quite linear relationships (Meera et al. 1996), while others exhibit marked saturation in the range of 100 μM–1 mM (Wei et al. 1994; Cui et al. 1997). Even in our own experience among different batches of oocytes, the extent to which saturation is observed varies. We consider it possible that there remain unknown factors, perhaps dependent on factors in oocytes, that may separately regulate the affinities of the high affinity sites, K(h)c and K(h)o, relative to the low affinity sites, K(l)c and K(l)o. This would easily account for subtle differences in the V0.5 versus pCa relationship.
Although the results presented here seem, on balance, remarkably congruent with the predictions of Fig. 1, there remain some aspects of the data that will require further investigation. First, we consider it possible that there may be surface potential effects that influence our estimates of the low affinity binding affinities. Second, the ability of Mg2+ to produce shifts in V0.5 in the presence of 300 μM Ca2+ appears to be somewhat less than what Fig. 1 predicts based on shifts produced with 0 Ca2+. This is true even for data set 4 in which effects of Mg2+ on currents activated with either 0 or 300 μM Ca2+ were examined in the same set of patches. Third, the apparent increase in current activation rate produced at 50 and 100 mM Mg2+ with 0 Ca2+ does not seem consistent with the lack of effect of Mg2+ on activation rates studied under other conditions.
Despite the uncertainties just mentioned, together, the results of Shi and Cui 2001b and those presented here provide what seems an essentially complete description of the ability of Mg2+ and Ca2+ to regulate gating of BK channels. Our estimates for binding affinities of Mg2+ to the low affinity site (K(l,mg)c ∼ 14–16 mM; K(l,mg)o ∼ 3–4 mM) are essentially identical to the values of 15.0 and 3.6 mM obtained by Shi and Cui 2001b, while estimates of the blocking effect of Mg2+ on the high affinity binding sites are also comparable. It remains possible that either the high affinity or low affinity effects actually involve mediation by multiple high or low affinity sites, although certainly nothing in the results requires that. Our results indicate that the relative affinities of Ca2+ and Mg2+ for the low affinity site differ by about a factor of sevenfold. Although among different sets of data, we feel that a two- to threefold difference might result from normal variability seen with Slo1 currents, we think that the difference in Ca2+ and Mg2+ affinities for the low affinity site reflects a true selectivity, although rather weak, for Ca2+ over Mg2+. Now that the path is clear to how the low affinity site can be studied in isolation, it will be interesting to determine its ionic selectivity more rigorously.
Physiological Regulation by Cytosolic Mg2+ or Ca2+ Mediated by the Low Affinity Site
The ability of cytosolic [Mg2+] on the order of 1 mM to regulate BK current raises the possibility that this low affinity site and the shift in gating it produces may define a physiologically important mechanism of BK current regulation. The understanding of the mechanisms of regulation and dynamics of cytosolic free Mg2+ levels remain limited (Romani and Scarpa 2000). Based on evidence from a variety of cell types, free Mg2+ is thought to be ∼0.5–1 mM. Most cytosolic Mg2+ will be associated with di- and triphosphate nucleotides, and circumstances that deplete cytosolic ATP are thought to result in transient increases in free [Mg2+] with associated extrusion of Mg2+ from cells (for review see Romani and Scarpa 2000). Thus, published resting free [Mg2+] are likely sufficient to begin to modulate BK channel activity via the low affinity divalent cation site. Dependent on the magnitude of any transient changes in [Mg2+], modulation of BK channel gating could be substantial.
In the case of Ca2+, the affinity of the low affinity binding site for Ca2+ is such that Ca2+ will begin to influence the behavior of the Slo1 currents through this site at concentrations ∼30 μM. Thus, for those BK channels that are tightly coupled to sites of Ca2+ influx, it is likely that occupancy of the low affinity site will occur following channel opening, thereby regulating BK channel function.
Conclusion
These results show that there are at least two types of Ca2+ binding sites important for activation of Slo1 BK channels. First, there are high affinity sites that bind Ca2+ relatively specifically which, along with membrane depolarization, influence channel opening rates and activation probability. These sites are likely to be important for activation of BK channels at physiological submembrane Ca2+ concentrations and influence the rate of current activation after a voltage-step. A second site (or sites) can bind either Ca2+ or Mg2+ with a relatively lower affinity, and is able to enhance channel open probability by stabilizing channels in open states, once they have been activated. This results in a shift in G-V curves to more negative voltages. Occupancy of this site does not influence microscopic transitions leading to channel opening, but does slow the rate at which channels leave open states. Thus, regulation of BK channel gating by divalent cations involves multiple types of binding sites with functionally distinct consequences.
Acknowledgments
We especially thank Jianmin Cui for discussions and J. Shi and J. Cui for sharing their manuscript. The final version of this paper has benefited greatly from their insights into the inhibitory effect of Mg2+ on the high affinity Ca2+ binding site. We thank Lynn Lavack for injection and care of oocytes and the Zorumski lab for providing oocytes. We also thank Carl Nelson for participation in many experiments during the initial stages of this work.
This work was supported by the National Institutes of Health grant DK46564 (to C. Lingle).
Footnotes
Abbreviations used in this paper: BK, large conductance Ca2+-activated K+ channel; NMG, N-methyl glucamine; Po, open probability.
References
- Barrett J.N., Magleby K.L., Pallotta B.S. Properties of single calcium-activated potassium channels in cultured rat muscle. J. Physiol. 1982;331:211–230. doi: 10.1113/jphysiol.1982.sp014370. [DOI] [PMC free article] [PubMed] [Google Scholar]
- Bian S., Favre I., Moczydlowski E. Ca2+-binding activity of a COOH-terminal fragment of the Drosophila BK channel involved in Ca2+-dependent activation. Proc. Natl. Acad. Sci. USA. 2001;98:4776–4781. doi: 10.1073/pnas.081072398. [DOI] [PMC free article] [PubMed] [Google Scholar]
- Braun A., Sy L. Contribution of potential EF hand motifs to the calcium-dependent gating of a mouse brain large conductance, calcium-sensitive K+ channel. J. Physiol. 2001;533:681–695. doi: 10.1111/j.1469-7793.2001.00681.x. [DOI] [PMC free article] [PubMed] [Google Scholar]
- Butler A., Tsunoda S., McCobb D.P., Wei A., Salkoff L. mSlo, a complex mouse gene encoding “maxi” calcium-activated potassium channels. Science. 1993;261:221–224. doi: 10.1126/science.7687074. [DOI] [PubMed] [Google Scholar]
- Cox D., Aldrich R. Role of the β1 subunit in large-conductance Ca2+-activated K+ channel gating energetics. Mechanisms of enhanced Ca2+ sensitivity. J. Gen. Physiol. 2000;116:411–432. doi: 10.1085/jgp.116.3.411. [DOI] [PMC free article] [PubMed] [Google Scholar]
- Cox D.H., Cui J., Aldrich R.W. Allosteric gating of a large conductance Ca-activated K+ channel J. Gen. Physiol. 110 1997. 257 281a [DOI] [PMC free article] [PubMed] [Google Scholar]
- Cox D.H., Cui J., Aldrich R.W. Separation of gating properties from permeation and block in mslo large conductance Ca-activated K+ channels J. Gen. Physiol. 109 1997. 633 646b [DOI] [PMC free article] [PubMed] [Google Scholar]
- Cui J., Aldrich R.W. Allosteric linkage between voltage and Ca2+-dependent activation of BK-type mslo1 K+ channels. Biochemistry. 2000;39:15612–15619. doi: 10.1021/bi001509+. [DOI] [PubMed] [Google Scholar]
- Cui J., Cox D.H., Aldrich R.W. Intrinsic voltage dependence and Ca2+ regulation of mslo large conductance Ca-activated K+ channels. J. Gen. Physiol. 1997;109:647–673. doi: 10.1085/jgp.109.5.647. [DOI] [PMC free article] [PubMed] [Google Scholar]
- Diaz L., Meera P., Amigo J., Stefani E., Alvarez O., Toro L., Latorre R. Role of the S4 segment in a voltage-dependent calcium-sensitive potassium (hSlo) channel. J Biol Chem. 1998;273:32430–32436. doi: 10.1074/jbc.273.49.32430. [DOI] [PubMed] [Google Scholar]
- Ferguson W.B. Competitive Mg2+ block of a large-conductance, Ca(2+)-activated K+ channel in rat skeletal muscle. Ca2+, Sr2+, and Ni2+ also block. J. Gen. Physiol. 1991;98:163–181. doi: 10.1085/jgp.98.1.163. [DOI] [PMC free article] [PubMed] [Google Scholar]
- Golowasch J., Kirkwood A., Miller C. Allosteric effects of Mg2+ on the gating of Ca2+-activated K+ channels from mammalian skeletal muscle. J. Exp. Biol. 1986;124:5–13. doi: 10.1242/jeb.124.1.5. [DOI] [PubMed] [Google Scholar]
- Green W., Anderson O. Surface charges and ion channel function. Annu. Rev. Physiol. 1991;53:341–359. doi: 10.1146/annurev.ph.53.030191.002013. [DOI] [PubMed] [Google Scholar]
- Hamill O.P., Marty A., Neher E., Sakmann B., Sigworth F.J. Improved patch-clamp techniques for high-resolution current recording from cells and cell-free membrane patches. Pflügers Arch. 1981;391:85–100. doi: 10.1007/BF00656997. [DOI] [PubMed] [Google Scholar]
- Herrington J., Solaro C.R., Neely A., Lingle C.J. The suppression of Ca2+- and voltage-dependent outward K+ current during mAChR activation in rat adrenal chromaffin cells. J. Physiol. 1995;485:297–318. doi: 10.1113/jphysiol.1995.sp020731. [DOI] [PMC free article] [PubMed] [Google Scholar]
- Hille B. Ionic Channels of Excitable Membrane 2nd ed 1992. Sinauer Associates, Inc; Sunderland, MA: pp. 607 pp [Google Scholar]
- Horrigan F.T., Aldrich R.W. Allosteric voltage gating of potassium channels II. Mslo channel gating charge movement in the absence of Ca2+ . J. Gen. Physiol. 1999;114:305–336. doi: 10.1085/jgp.114.2.305. [DOI] [PMC free article] [PubMed] [Google Scholar]
- Horrigan F.T., Cui J., Aldrich R.W. Allosteric voltage gating of potassium channels I. Mslo ionic currents in the absence of Ca2+ . J. Gen. Physiol. 1999;114:277–304. doi: 10.1085/jgp.114.2.277. [DOI] [PMC free article] [PubMed] [Google Scholar]
- Imoto K., Busch C., Sakmann B., Mishina M., Konno T., Nakai J., Bujo H., Mori Y., Fukuda K., Numa S. Rings of negatively charged amino acids determine the acetylcholine receptor channel conductance. Nature. 1988;335:645–648. doi: 10.1038/335645a0. [DOI] [PubMed] [Google Scholar]
- Lingle C., Zeng X.-H., Ding J.-P., Xia X.-M. Inactivation of BK channels mediated by the NH2 terminus of the β3b auxiliary subunit involves a two-step mechanismpossible separation of binding and blockade. J. Gen. Physiol. 2001;117:583–605. doi: 10.1085/jgp.117.6.583. [DOI] [PMC free article] [PubMed] [Google Scholar]
- MacKinnon R., Miller C. Functional modification of a Ca2+-activated K+ channel by trimethyloxonium. Biochemistry. 1989;28:8087–8092. doi: 10.1021/bi00446a019. [DOI] [PubMed] [Google Scholar]
- MacKinnon R., Latorre R., Miller C. Role of surface electrostatics in the operation of a high-conductance Ca2+-activated K+ channel. Biochemistry. 1989;28:8092–8099. doi: 10.1021/bi00446a020. [DOI] [PubMed] [Google Scholar]
- Martell A., Smith R. Critical Stability Constants Volume 2Amines 1975. Plenum Press, ; New York/London: pp. 415 pp [Google Scholar]
- McLaughlin S.G., Szabo G., Eisenman G. Divalent ions and the surface potential of charged phospholipid membranes. J. Gen. Physiol. 1971;58:667–687. doi: 10.1085/jgp.58.6.667. [DOI] [PMC free article] [PubMed] [Google Scholar]
- McManus O.B., Magleby K.L. Kinetic states and modes of single large-conductance calcium-activated potassium channels in cultured rat skeletal muscle. J. Physiol. 1988;402:79–120. doi: 10.1113/jphysiol.1988.sp017195. [DOI] [PMC free article] [PubMed] [Google Scholar]
- McManus O.B., Magleby K.L. Accounting for the Ca(2+)-dependent kinetics of single large-conductance Ca(2+)-activated K+ channels in rat skeletal muscle. J. Physiol. 1991;443:739–777. doi: 10.1113/jphysiol.1991.sp018861. [DOI] [PMC free article] [PubMed] [Google Scholar]
- McManus O.B., Helms L.M., Pallanck L., Ganetzky B., Swanson R., Leonard R.J. Functional role of the beta subunit of high conductance calcium-activated potassium channels. Neuron. 1995;14:645–650. doi: 10.1016/0896-6273(95)90321-6. [DOI] [PubMed] [Google Scholar]
- Meera P., Wallner M., Jiang Z., Toro L. A calcium switch for the functional coupling between alpha (hslo) and beta subunits (Kv,caβ) of maxi K channels. FEBS Lett. 1996;385:127–128. doi: 10.1016/0014-5793(96)83884-1. [DOI] [PubMed] [Google Scholar]
- Moczydlowski E., Latorre R. Gating kinetics of Ca2+-activated K+ channels from rat muscle incorporated into planar lipid bilayers. Evidence for two voltage- dependent Ca2+ binding reactions. J. Gen. Physiol. 1983;82:511–542. doi: 10.1085/jgp.82.4.511. [DOI] [PMC free article] [PubMed] [Google Scholar]
- Oberhauser A., Alvarez O., Latorre R. Activation by divalent cations of a Ca2+-activated K+ channel from skeletal muscle membrane. J. Gen. Physiol. 1988;92:67–86. doi: 10.1085/jgp.92.1.67. [DOI] [PMC free article] [PubMed] [Google Scholar]
- Pallotta B.S., Magleby K.L., Barrett J.N. Single channel recordings of Ca2+-activated K+ currents in rat muscle cell culture. Nature. 1981;293:471–474. doi: 10.1038/293471a0. [DOI] [PubMed] [Google Scholar]
- Romani A., Scarpa A. Regulation of cellular magnesium. Frontiers Biosci. 2000;5:d720–d734. doi: 10.2741/romani. [DOI] [PubMed] [Google Scholar]
- Rothberg B.S., Magleby K.L. Gating kinetics of single large-conductance Ca2+-activated K+ channels in high Ca2+ suggest a two-tiered allosteric gating mechanism. J. Gen. Physiol. 1999;114:93–124. doi: 10.1085/jgp.114.1.93. [DOI] [PMC free article] [PubMed] [Google Scholar]
- Rothberg B.S., Magleby K.L. Voltage and Ca2+ activation of single large-conductance Ca2+-activated K+ channels described by a two-tiered allosteric gating mechanism. J. Gen. Physiol. 2000;116:75–99. doi: 10.1085/jgp.116.1.75. [DOI] [PMC free article] [PubMed] [Google Scholar]
- Schreiber M., Salkoff L. A novel calcium-sensing domain in the BK channel. Biophys. J. 1997;73:1355–1363. doi: 10.1016/S0006-3495(97)78168-2. [DOI] [PMC free article] [PubMed] [Google Scholar]
- Schreiber M., Yuan A., Salkoff L. Transplantable sites confer calcium sensitivity to BK channels. Nat. Neurosci. 1999;2:416–421. doi: 10.1038/8077. [DOI] [PubMed] [Google Scholar]
- Shen K.Z., Lagrutta A., Davies N.W., Standen N.B., Adelman J.P., North R.A. Tetraethylammonium block of Slowpoke calcium-activated potassium channels expressed in Xenopus oocytesevidence for tetrameric channel formation. Pflügers Arch. 1994;426:440–445. doi: 10.1007/BF00388308. [DOI] [PubMed] [Google Scholar]
- Shi J., Cui J. Intracellular Mg2+ activated mSlo Ca2+-activated BK channels Biophys. J. 80 2001. 221Aa (Abstr [Google Scholar]
- Shi J., Cui J. Intracellular Mg2+ enhances the function of BK-type Ca2+ activated K+ channels J. Gen. Physiol. 589–605 2001. b [DOI] [PMC free article] [PubMed] [Google Scholar]
- Solaro C., Nelson C., Wei A., Salkoff L., Lingle C. Cytoplasmic Mg2+ modulates Ca2+-dependent activation of mSlo by binding to a low affinity site on the channel core. Biophys. J. 1995;68:A30. [Google Scholar]
- Vergara C., Latorre R. Kinetics of Ca2+-activated K+ channels from rabbit muscle incorporated into planar bilayers. Evidence for a Ca2+ and Ba2+ blockade. J. Gen. Physiol. 1983;82:543–568. doi: 10.1085/jgp.82.4.543. [DOI] [PMC free article] [PubMed] [Google Scholar]
- Wallner M., Meera P., Toro L. Molecular basis of fast inactivation in voltage and Ca2+-activated K+ channelsa transmembrane beta-subunit homolog. Proc. Natl. Acad. Sci. USA. 1999;96:4137–4142. doi: 10.1073/pnas.96.7.4137. [DOI] [PMC free article] [PubMed] [Google Scholar]
- Wei A., Solaro C., Lingle C., Salkoff L. Calcium sensitivity of BK-type KCa channels determined by a separable domain. Neuron. 1994;13:671–681. doi: 10.1016/0896-6273(94)90034-5. [DOI] [PubMed] [Google Scholar]
- Xia X.M., Ding J.P., Lingle C.J. Molecular basis for the inactivation of Ca2+- and voltage-dependent BK channels in adrenal chromaffin cells and rat insulinoma tumor cells. J. Neurosci. 1999;19:5255–5264. doi: 10.1523/JNEUROSCI.19-13-05255.1999. [DOI] [PMC free article] [PubMed] [Google Scholar]
- Zeng X.-H., Xia X.-M., Lingle C.J. Gating properties conferred on BK channels by the β3b auxiliary subunit in the absence of its N- and C-termini. J. Gen. Physiol. 2001;117:607–627. doi: 10.1085/jgp.117.6.607. [DOI] [PMC free article] [PubMed] [Google Scholar]