Abstract
Ca2+ and Mg2+ are important mediators and regulators of intracellular Ca2+ signaling in muscle. The effects of changes of cytosolic [Ca2+] or [Mg2+] on elementary Ca2+ release events were determined, as functions of concentration and time, in single fast-twitch permeabilized fibers of rat and frog. Ca2+ sparks were identified and their parameters measured in confocal images of fluo-4 fluorescence. Solutions with different [Ca2+] or [Mg2+] were rapidly exchanged while imaging. Faster and spatially homogeneous changes of [Ca2+] (reaching peaks >100 μM) were achieved by photolysing Ca NP-EGTA with laser flashes. In both species, incrementing cytosolic [Ca2+] caused a steady, nearly proportional increase in spark frequency, reversible upon [Ca2+] reduction. A greater change in spark frequency, usually transient, followed sudden increases in [Ca2+] after a lag of 100 ms or more. The nonlinearity, lag, and other features of this delayed effect suggest that it requires increase of [Ca2+] inside the SR. In the frog only, increases in cytosolic [Ca2+] often resulted, after a lag, in sparks that propagated transversally. An increase in [Mg2+] caused a fall of spark frequency, but with striking species differences. In the rat, but not the frog, sparks were observed at 4–40 mM [Mg2+]. Reducing [Mg2+] below 2 mM, which should enable the RyR channel's activation (CICR) site to bind Ca2+, caused progressive increase in spark frequency in the frog, but had no effect in the rat. Spark propagation and enhancement by sub-mM Mg2+ are hallmarks of CICR. Their absence in the rat suggests that CICR requires RyR3 para-junctional clusters, present only in the frog. The observed frequency of sparks corresponds to a channel open probability of 10−7 in the frog or 10−8 in the rat. Together with the failure of photorelease to induce activation directly, this indicates a basal inhibition of channels in situ. It is proposed that relief of this inhibition could be the mechanism by which increased SR load increases spark frequency.
Keywords: sarcoplasmic reticulum, excitation–contraction coupling, Ca channels, ryanodine receptors, calcium photorelease
INTRODUCTION
After the action potential depolarizes the transverse (T) tubular membrane in muscle, a sequence of events takes place that result in rapid activation of Ca2+ release from the SR, followed by fast and synchronous closing of the release channels and removal of released Ca2+. The speed of the resulting Ca2+ transient's onset and termination is crucial for a rapid contraction–relaxation cycle (Rome et al., 1996). Although a reasonably complete picture of the major aspects of excitation–contraction coupling has emerged, many aspects, especially those controlling the speed of activation and termination of Ca2+ release, remain to be understood. The presence of different RyR isoforms in variable proportions in mammals and amphibians suggests that mechanisms may be different in these two taxonomic classes. In both, channels of the “skeletal” isoform (RyR1 in mammals, α in amphibians) are located in two parallel rows facing the T tubular membrane. In this membrane, tetrads of dihydropyridine (DHP) receptors face and perhaps make contact with the large cytoplasmic domain of every other RyR, in a precise skipping pattern (Block et al., 1988). In the frog, in addition to junctional α RyRs, there are β isoforms, homologous to RyR3 of mammals (for review see Sutko and Airey, 1996; Ogawa et al. 1999). β receptors are located in a parajunctional region close to the triad. Although they are ordered, the geometric arrangement of their clusters is different from that of their junctional counterparts (Felder and Franzini-Armstrong, 2002). Most importantly, they seem to be too far from DHP receptors for any physical interaction with them.
Studies of cell-averaged Ca2+ transients have found differences in the waveform of Ca2+ release in response to pulse depolarization. In both mammals (rats) and amphibians (frogs), the response consists of an early peak, which is followed after 10–20 ms by a quasi-steady stage. The peak is much more prominent in the frog, and the ratio of amplitudes of these phases (peak/steady) is strongly voltage dependent in the frog, but not the rat (Shirokova et al., 1996).
Ca2+ release is entirely controlled by plasma membrane voltage, via DHPRs. But the extent to which this control relies on mediation by Ca2+ itself remains unclear, and appears to be different in these two taxonomic classes. As early as 1988, the peak of Ca2+ release was proposed to reflect CICR, activation of channels by Ca2+ (Ríos and Pizarro, 1988). While tests of this idea have been inconclusive (compare Jacquemond et al., 1991; Csernoch et al., 1993; Jong et al., 1993; Pape et al., 1993; Brum et al., 2003), it has the potential to rationalize the functional differences in terms of diversity of structure and isoform endowment. If indeed the frog's large peak of Ca2+ release (and the voltage dependence of the peak/steady ratio) were a manifestation of CICR, then it would follow that parajunctional β receptors are the effectors of CICR.
Additional relevant data come from the study of local release events. In amphibian skeletal muscle, Ca2+ sparks constitute the elementary form of Ca2+ release, and they are believed to require CICR (Klein et al., 1996). In adult rat fibers, spontaneous Ca2+ sparks can be observed but at a much lower rate and under special conditions, including most effectively the chemical or mechanical disruption of the plasmalemma (Kirsch et al., 2001; Zhou et al., 2003a). The latter study demonstrated significant differences in the morphology of sparks of rats and frogs, which were attributed to differences in the properties of the release sources. While in the rat sources seem to be elongated parallel to the triad, which suggests that large portions of the junctional channel arrays fire together, in the frog the sources remain largely below the spatial resolution of the microscope (Zhou et al., 2003a). Sources seem to be not just distinct in structure but respond differently to the voltage stimulus. Csernoch et al. (2004) recently reported that voltage clamp pulses, which in frog elicit Ca2+ release constituted by sparks, in the rat only elicited “embers,” caused by the opening of individual channels. Ward et al. (2001) studied sparks in myotubes of the dyspedic 1B5 cell line. While myotubes expressing RyR1 showed almost no spontaneous release events, those expressing the RyR3 isoform had frequent spontaneous sparks. The sum of the structural and functional information indicates that different activation mechanisms are operating in mammalians and amphibians.
Mg2+ operates as a crucial brake on Ca2+ release by multiple mechanisms, including competition at channel sites where Ca2+ binding causes activation, binding at inhibitory sites, and partial block of Ca2+ current within the permeation pathway (for review see Meissner, 1994). In fact, the inhibitory effects of Mg2+ were so prominent in subcellular preparations that M. Endo used the presence of Mg2+ in the cytosol as basis for his influential dismissal of CICR as a contributor to physiologic Ca2+ release (most forcefully presented in Endo, 1977). The interest in Mg2+ only increased upon the finding by Kirsch et al. (2001) that the frequency of spontaneous sparks in the mammal did not increase upon reduction of [Mg2+]cyto below 1 mM, in startling contrast with observations of Lacampagne et al. (1998) in frog muscle.
To further understand the control mechanisms, we compared the modulation of Ca2+ release by cytosolic Ca2+ and Mg2+ in these species. Although the effects of Ca2+ were qualitatively similar in rat and frog, a quantitative study revealed substantial differences. More strikingly, and in agreement with the result of Kirsch et al. (2001), the [Mg2+] dependence of Ca2+ release was found to differ greatly, which complements the emerging picture of functional diversity in these taxonomic classes. Additionally, aspects of the Ca2+ effects suggest that intra-SR Ca2+ may play a role in release modulation as robust as the one it serves in cardiac muscle (Györke, et al., 2002). The present results have been communicated preliminarily (Zhou et al., 2002; Brum et al., 2004).
MATERIALS AND METHODS
Experiments were performed in singly dissected fiber segments from the semitendinosus muscle of Rana pipiens or in fiber segments separated enzymatically from the extensor digitorum longus (EDL) muscle of the rat (Rattus norvegicus; Sprague-Dawley) as described in detail in González and Ríos (1993) and Zhou et al. (2003a). In brief, frogs were deeply anaesthetized and killed by decapitation followed by pithing, a procedure approved by the Institutional Animal Care and Use Committee of Rush University. Fibers were dissected in a relaxing solution (Kovacs et al., 1983), fixed to the glass bottom of a 100-μl Lucite chamber, and moderately stretched to sarcomere lengths of 2.5–3.2 μm. 3-mo-old male rats were killed by CO2 inhalation, and the EDL muscles of both legs were dissected and incubated for 1 h at 37°C in a modified Krebs solution with 2 mg/ml collagenase type I and 10% FBS, without added Ca2+ or Mg2+. Digested muscles were washed in Krebs solution plus FBS; after 30 min, fiber segments of ∼1 cm were removed gently and fixed slightly stretched (2.2–2.5 μm per sarcomere) to the glass bottom of the Lucite chamber. On the stage of the microscope, fibers were permeabilized by replacing the relaxing solution with a glutamate-based internal solution containing 0.002% saponin and 50 μM fluo-3; nominal [Mg2+] was 1 mM for frog or 2 mM for rat. After 1–2 min, membrane permeabilization was complete, as judged from the increase in fluorescence within the fiber observed with the confocal microscope (Launikonis and Stephenson, 1997). At this time, saponization was stopped by replacing the solution in the chamber with the corresponding saponin-free internal solution.
Solutions
The composition of the solutions used to dissect and mount the fibers is the same as described in González et al. (2000) and Zhou et al. (2003a). Internal solutions used were also as described therein but with varying Ca2+ and Mg2+ concentrations (Table I). The nominal cation concentration is indicated in every experiment described. The actual [Ca2+] of the internal solutions was measured with fura-2 as indicator in a spectrofluorimeter. The excitation spectrum of the solution between 320 and 420 nm was fitted to a linear combination of the saturated and Ca2+-free spectra of fura-2. The [Ca2+] values obtained from the fit were within 10% of the calculated ones. In frog experiments, glutamate-based internal solutions were used, except when noted. Rat experiments were performed in the sulfate-based solution described by Zhou et al. (2003a). Effective dissociation constants for the main anions (glutamate or sulfate) with Ca2+ were respectively 60.1 and 50.0 mM (values determined in calibrations performed by W.G. Kirsch in our laboratory). All internal solutions contained fluo-4 at 100 μM. All solutions were titrated to pH 7.0 and adjusted to 265 ± 5 mosmol/kg (frog) or 320 ± 5 mosmol/kg (rat). Experiments were performed at room temperature (19–22°C).
TABLE I.
Composition of Internal Solutions
| Cs Glutamatea or K2SO4 b | CaT | [Ca2+] | MgT | [Mg2+] | ||
|---|---|---|---|---|---|---|
| mM | mM | nM | mM | mM | ||
| Frog | Varied [Ca2+] | 100 | 0.177 | 100 | 4.51 | 0.3 |
| 100 | 0.304 | 200 | 4.51 | 0.3 | ||
| 100 | 0.474 | 400 | 4.51 | 0.3 | ||
| 100 | 0.659 | 800 | 4.51 | 0.3 | ||
| Varied [Mg2+] | 100 | 0.177 | 100 | 4.96 | 0.4 | |
| 100 | 0.176 | 100 | 5.34 | 0.5 | ||
| 100 | 0.174 | 100 | 6.24 | 0.8 | ||
| 100 | 0.172 | 100 | 7.84 | 1.45 | ||
| Rat | Varied [Ca2+] | 80 | 0.178 | 100 | 9.80 | 2.0 |
| 80 | 0.306 | 200 | 9.79 | 2.0 | ||
| 80 | 0.403 | 300 | 9.78 | 2.0 | ||
| 80 | 0.443 | 350 | 9.78 | 2.0 | ||
| 80 | 0.479 | 400 | 9.78 | 2.0 | ||
| Varied [Mg2+] | 80 | 0.189 | 100 | 3.99 | 0.2 | |
| 80 | 0.186 | 100 | 5.53 | 0.5 | ||
| 80 | 0.183 | 100 | 7.13 | 1.0 | ||
| 73 | 0.168 | 100 | 14.3 | 4.0 | ||
| 60 | 0.146 | 100 | 25.2 | 10.0 | ||
| 28 | 0.091 | 100 | 59.8 | 40.0 |
All internal solutions contained (in mM) HEPES or trismaleate (10), EGTA (1), phosphocreatine (5), ATP (5), glucose (10), dextran 8% and Fluo-4 (0.1). ATP was added as Mg salt up to 5 mM. When low Mg was required, the difference to 5 mM was replaced by the Na salt. pH was adjusted to 7 using CsOH, and osmolality to 265 mOsm/kg for frog or 320 mOsm/kg for rat, using cesium glutamate or potassium sulfate (for frog or rat) or water as needed.
Frog.
Rat.
Confocal Imaging
Line scan (xt) images were obtained from the preparation positioned on the stage of an inverted microscope (Axiovert 100TV; Carl Zeiss MicroImaging, Inc.) equipped with a 40×, 1.2 NA water immersion objective (Carl Zeiss MicroImaging, Inc.). The confocal scanning system (MRC-1000; Bio-Rad Laboratories) used for fluorescence excitation a 100-mW Ar laser attenuated to 3% of its power (Ríos et al., 1999).
Line scan images consist of 512 rows of 768 values of fluorescence intensity F(x,t) at pixel spacing of 0.1428 μm, rows acquired at 2-ms intervals along a line parallel to or perpendicular to the fiber axis. Bleaching was evaluated and corrected as described by Zhou et al. (2003a). The bleaching-corrected version of fluorescence was normalized to the baseline intensity (F0(x)), derived as an average of F(x,t) in the nonspark regions of the line scan image. To avoid photodamage, line scan images were not taken repeatedly at the same location.
Sparks were identified automatically by an objective detection program (Cheng et al., 1999, González et al., 2000), which also determined spark amplitude (maximum of F/F 0 − 1), full width at half magnitude (FWHM, or “half width,” defined as the spatial extent at the time of the peak where F/F 0 was >1 + 0.5 amplitude), and rise time (time lapse of rise between 10% and peak, measured on a 3-pixel central average). Every event detected was included in the statistics, provided that its amplitude was >0.3 and its half width >0.53 μm.
Solution Changes
In some experiments, Ca2+ and Mg2+ concentrations were changed by rapid perfusion in a specially designed chamber (Shirokova and Ríos, 1996), using inlet and suction valves electronically switched by a computer that also synchronized confocal image acquisition. The chamber, schematically depicted in the inset a of Fig. 6, had a total capacity of ∼100 μl. It was covered by a Lucite lid, leaving in and outflow passages at opposing ends. The solution exchange time, determined by the change in fluorescence in a line scan (Fig. 6, inset b), was <100 ms.
Figure 6.
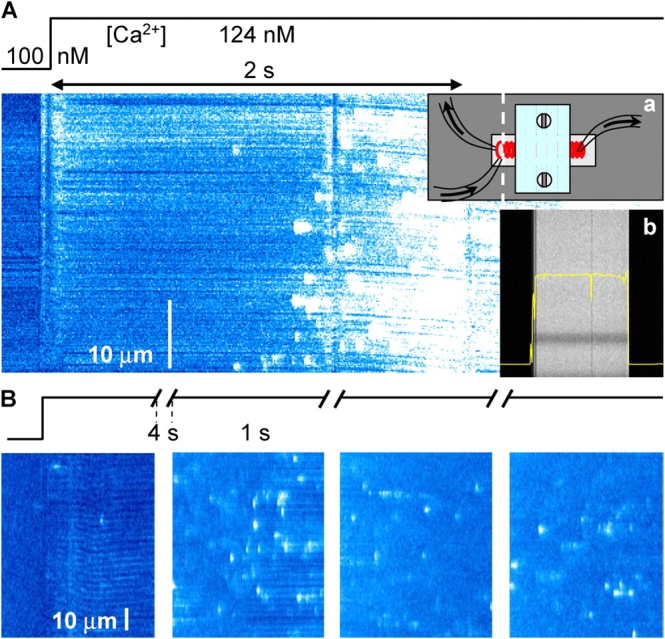
The delayed effects of rapid solution changes. (A) Raw fluorescence in a line scan (along dashed line in inset a), perpendicular to the axis of a frog fiber located in a rapid flow chamber (depicted in the inset). The fiber was initially immersed in solution with 100 nM nominal [Ca2+]. A 124 nM Ca2+ solution passed through the chamber during the 2-s interval marked by the double arrow. Solution flowing at this rate fully exchanged Ca2+ in 100 ms or less, as demonstrated by inset b, a line scan while a pulse of fluorescent solution, lasting 250 ms, was passed in a chamber with nonfluorescent solution. Image identifier 101701a5.1. (B) Raw fluorescence in successive line scan images upon a similar solution change in a rat fiber. Note different scales of time and space in A and B. Image identifier 111501A3.3-6.
Photorelease of Caged Calcium
In other experiments, cytosolic Ca2+ concentration was changed by flash photolysis of Ca-bound NP-EGTA. The internal solutions contained 1–5 mM NP-EGTA in frog experiments or 0.25–2 mM in rat experiments, with CaCl2 added for a nominal [Ca2+] of 100–150 nM, and no EGTA. [CaCl2] was calculated first using parameters of Ellis-Davies et al. (1996), and then adjusted to match the fluorescence of the NP-EGTA solution with the fluorescence of the corresponding EGTA-containing reference solution.
Photolysis was achieved by UV light pulses, “flashes,” of adjustable intensity, delivered via a tapered optic fiber (Fiberguide Industries,). The 355-nm light pulses generated by a pulsed, frequency-tripled Nd:Yag laser (Quanta-Ray II [Spectra-Physics], for experiments with identifiers MMDD01, or Surelite III [Continuum], for ID MMDD03) were synchronized with image acquisition.
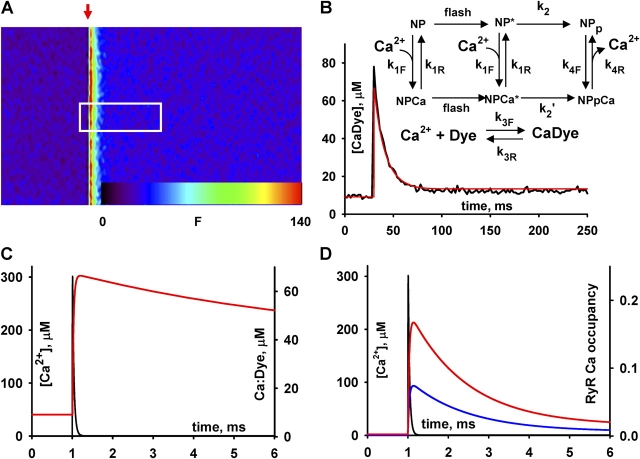
Fig. 1 illustrates calibrations of the technique in solution. Shown is a line scan image, acquired at 2 ms per line and 0.1428 μm per pixel, of an internal solution containing 50 μM fluo-3 and 5 mM NP-EGTA with 150 nM nominal [Ca2+]. While scanning was in progress, one pulse of 355-nm laser light was delivered through a 200-μm diameter optic fiber. The increase in fluorescence was sudden and brief, corresponding to a Ca2+ “spike” that is spatially homogeneous within a cylindric region ∼150 μm in diameter in front of the optic fiber. Fig. 1 B is the profile of fluorescence, averaged over the box in the homogeneous region of the image, and its fit (a scaled [CaDye](t)) using the model of photolysis is diagrammed in the inset (Ellis-Davies et al., 1996) with parameter values listed in the figure legend. Fig. 1 C is the evolution of free [Ca2+], derived from the fit, together with the time course of [Ca dye]. It can be seen that the concentration briefly reaches 300 μM. Additional simulations included the buffers ATP at 5 mM, 1 mM parvalbumin, and 0.125 mM troponin, with conventional parameters for the reactions of these buffers (given in Zhou et al., 2003a). In this case, the peak [Ca2+] was 220 μM and the kinetics of the transient changed only slightly. In experiments using 1 mM NP-EGTA, the peak [Ca2+] was ∼70 μM (50 μM with buffers), but the kinetics were similar.
Figure 1.
Calibrations of Ca2+ photolytic release. (A) Line scan of fluorescence of a saline containing caged Ca2+ (5 mM NP-EGTA and calcium added for a nominal [Ca2+] of 150 nM) and fluo-3. xt image was acquired at 2 ms per line and 0.1428 μm per pixel. The white box covers 3.7 μm and 250 ms. At arrow, a 355-nm flash from a Nd:YAG laser was delivered via a tapered optic fiber of 200 μm end diameter. (B) Black trace: time course of spatial average of fluorescence within the box in A. Red: time course of [Ca Dye] (proportional to fluorescence) derived by numerical solution of a model of Ellis-Davies et al. (1996), represented in inset. (C) Time course of [Ca2+] (black) and of [Ca Dye] (red), derived from the numerical solution, on expanded time scale. (D) Occupancy of a (activation) Ca2+ binding site, driven by the [Ca2+] transient in black trace (reproduced from C). Blue and red traces are for [Mg2+] of 1 and 0.4 mM, respectively. Parameters of photorelease model: k1F = 0.017 μM−1 ms−1, k1R = 0.00136 ms−1, k2 = 450 ms−1, k3F = 0.082 μM−1 ms−1, k3R = 0.09 ms−1, k4F = 0.08 μM−1 ms−1, k4R = 800 ms−1, [NP-EGTA] = 5000 μM, fcg = fcgCa = 0.14, [Fluo-4] = 100 μM, [Ca2+]cyto = 0.11 μM, [sites] = 1 μM, [Mg2+] = 0.4 (red) or 1 mM. Parameters of Ca2+ binding site (Schiefer et al., 1995): kon CaRyR = 0.23 μM−1 ms−1, koff CaRyR = 0.69 ms−1, kon MgRyR = 40 μM−1ms−1, koff MgRyR = 1200 ms−1. Image identifier 102501B1.
Fig. 1 D shows a simple simulation of the occupancy of a Ca2+-binding site with kinetic parameters derived by Schiefer et al. (1995) for the activator site of the RyR, driven by a Ca2+ spike like the one calculated for this photorelease event. The occupancy peaks at either 8 or 16%, depending on the concentration of free Mg2+. When Ca2+ spikes derived from 1 mM NP-EGTA drove the reaction, the occupancy peaked at 3.5 to 8%. Similar occupancies were found using parameter values of Zahradníková et al. (1999).
The changes in [Mg2+] upon photolysis of NP-EGTA, due to both release from the cage and displacement of Mg2+ by Ca2+ from shared ligands, were also calculated (assuming a dissociation constant of 8.99 mM and a diffusion-limited binding rate for the reaction of NP-EGTA and Mg2+; Ellis-Davies and Kaplan, 1994). Upon photolysis of 25% of the cage in a solution containing 1 mM NP-EGTA, 150 nM [Ca2+], and 0.600 mM [Mg2+], the calculation yielded a monotonic increase reaching a maximum of 0.612 mM Mg2+, 6 ms after the flash. Based on the small magnitude of this change, any effects of the photolysis should be attributed to Ca2+, rather than the Mg2+ that it displaces.
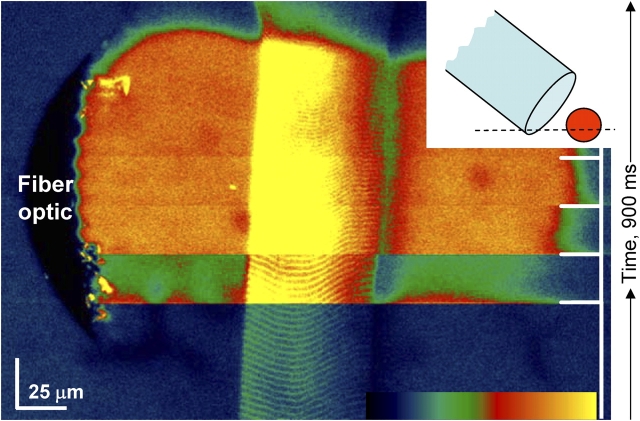
An illustration of the technique applied to a frog fiber is in Fig. 2, a raw confocal image of fluorescence in an xy scan. The optic fiber is visible as a crescent at left. The black color represents the absence of fluorescence in the region occupied by the optic fiber. As illustrated in the inset diagram, the crescent shape results from the intersection of the optic fiber, a cylinder at ∼45°, and the horizontal plane of the confocal section, represented by the dashed line. Four flashes were applied at the times indicated in the plot on the right side (white trace). While the increase in fluorescence produced by the first flash was transient, the other flashes produced a sustained elevation because the main Ca2+ removal agent, NP-EGTA, was saturated with Ca2+ after the first flash. Additionally, the level of fluorescence reached inside the muscle fiber during the last flashes was close to saturation of the acquisition system.
Figure 2.
Ca2+ photorelease in a muscle fiber. Raw confocal image of fluorescence. xy image was obtained at 2 ms per line, with time increasing in the upward direction. Solution contained 5 mM NP-EGTA at [Ca2+] of 150 nM. Four laser pulses of 355 nm were applied at the times indicated in the right side plot. Note optic fiber, as a zero-fluorescence crescent at left. The crescent shape results from the confocal section of a cylinder at ∼45°, at the level indicated by the dashed horizontal line in the inset diagram. Note the transient nature of the increase in fluorescence ([Ca2+]) produced by the first flash, and the sustained increase produced by the other flashes. Normalizations not shown indicate that the free [Ca2+] reached throughout the central segment of fiber and in the neighboring fluid are similar (the variable fluorescence reflects higher concentration of Ca2+ monitoring dye inside the fiber). Color table spans the interval 0–255. Image identifier 103001Bxy9.
A rough normalization analysis demonstrated that the [Ca2+] reached in front of the optic fiber was spatially homogeneous. In the example and almost every case, the fluorescence increased to a greater value inside the cell, but did so proportionally to the resting fluorescence, which was also greater inside due to binding of the Ca2+-monitoring dye to cellular structures.
In control experiments without NP-EGTA, UV flashes of the highest intensity failed to cause any effect on Ca2+ release activity. When the more efficient Surelite III laser was used in later experiments, some bleaching of the Ca2+ monitoring dye was observed after high intensity pulses.
Simulation of Ca2+ Sparks
Computations in discussion require the “sampled volume” in a line scan: volume of a region close enough to the scanned line for an average spark originating there to be imaged with amplitude greater than the detection threshold. For this purpose, it was necessary to simulate sparks, and then simulate their scanning. Ca2+ sparks were simulated by solving diffusion–reaction equations of a model that included a discrete Ca2+ source, of known geometry and Ca2+ current, and a homogeneous surrounding space (a cytosol), with known concentrations of fixed or diffusing ligands. A detailed description of the model is in Zhou et al. (2003a). The parameter values used are described there as “model 1B.” While other parameter sets, explored in that paper, result in sparks of different sizes, the magnitude sought by the simulation here, which is the maximum distance between scan line and source of a detectable spark, was largely insensitive to model parameters. The simulation yields a “spark” (illustrated in Fig. 11 of Zhou et al., 2003a), which is the fluorescence associated with the calculated concentration of Ca2+-bound fluo-4 at all values of the spatial coordinates and time. The spark is then imaged; that is, line scans at successive points in time are calculated by convolution with the point spread function of the imaging system, shifted according to the position of the source relative to the line of scanning. The measure of interest, in this case amplitude, is made on the image formed by stacked line scans.
Figure 11.
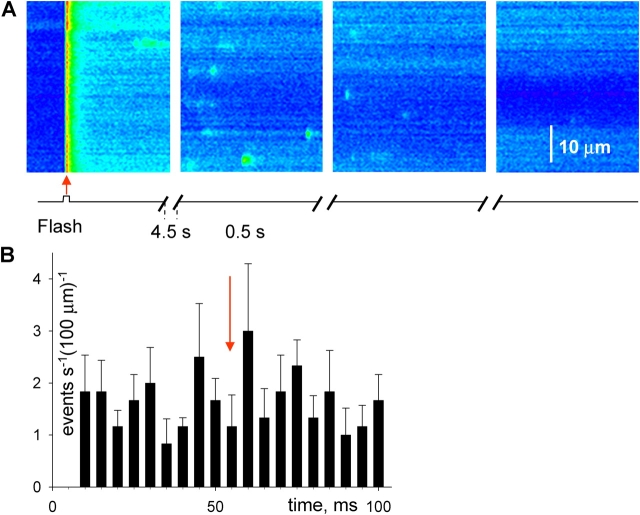
Response to photorelease of Ca2+ in the rat. (A) Successive line scan images in a fiber equilibrated with a solution containing 0.5 mM NP-EGTA. Flash was applied at red arrow. (B) Diary plot of event frequency as a function of time, during images acquired at 5-s intervals. Flash was applied during the 10th image, at red arrow. Bars represent averages over five flashes applied in the same fiber; error bars span one SEM. Image identifier 082603e.
RESULTS
This section first presents results from experiments designed to study the role of cytosolic Ca2+ in shaping Ca2+ release events. This was explored by rapid solution exchanges or by Ca2+ photorelease in amphibian and mammalian muscle. A second set of results describes the effects of modifying [Mg2+] by rapid solution changes, in both frogs and rats and under similar conditions.
Cytosolic Ca2+ Modulates Spark Frequency
Ca2+ sparks were affected by changes in cytosolic Ca2+ concentration. This was studied on spontaneous sparks of frog and rat fibers. Measurements were performed on single fibers with the plasmalemma made permeable by brief exposure to saponin. Experiments were started in a solution containing 100 nM [Ca2+]. After recording two to four sets of 20–30 line scan images, the solution was changed rapidly to a different [Ca2+] and more sets of images were acquired. Representative line scan images from a frog fiber are presented in Fig. 3. A–D correspond, respectively, to 100, 200, 400, and 800 nM [Ca2+]. Images were acquired in the same cell in the order A, D, B. C is from a different cell of the same muscle.
Figure 3.
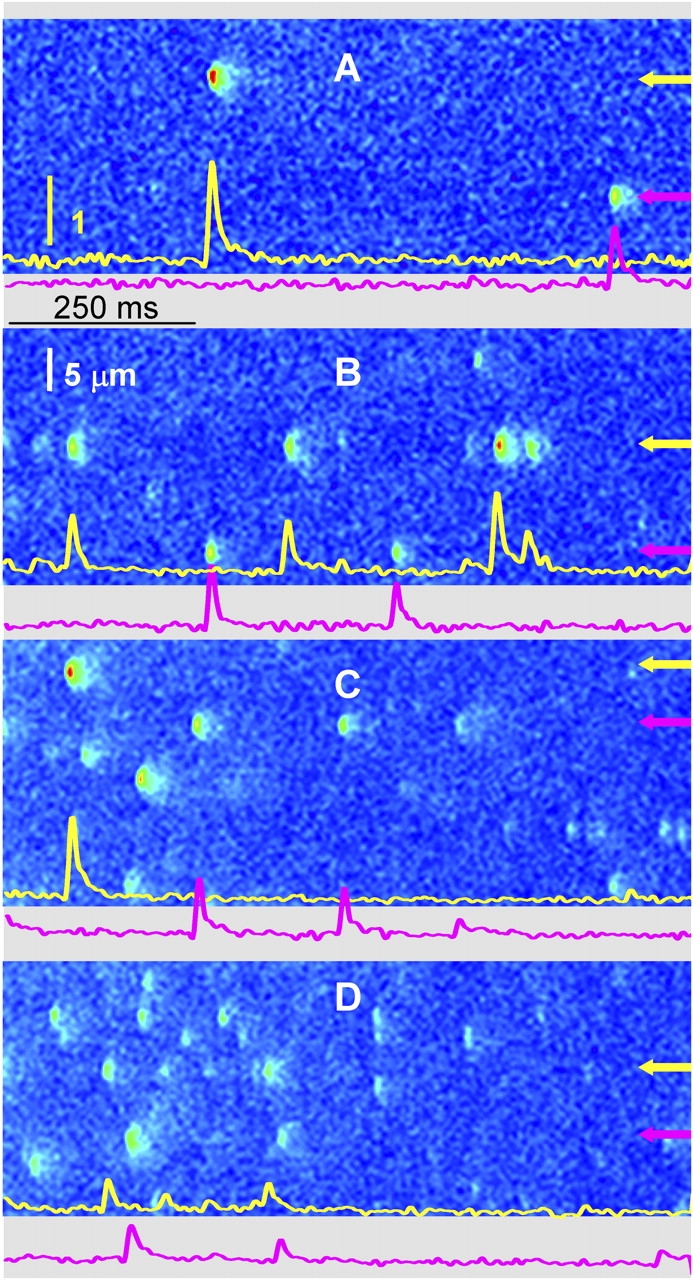
Line scans of fluorescence at different cytosolic [Ca2+] in frog fibers. Images are of fluorescence normalized to its resting average F 0 as described in materials and methods. [Ca2+]cyto = 100 nM (A), 200 nM (B), 400 nM (C), 800 nM (D). Panels are portions of images that were acquired in groups of 30 after solution changes. Because one cell was typically cycled through three different [Ca2+]cyto, the examples shown were chosen from two cells in the same muscle. The images at 100, 800, and 200 nM were acquired in that order from one cell; that at 400 nM from another cell in which 100 and 200 nM were also applied, with similar results. Traces are of F/F 0 averaged over five pixels (of 0.143 μm) centered at the positions indicated by arrows. The yellow vertical bar represents one unit of normalized fluorescence. Image identifiers: (A) 0718d1_29; (B) 0718d6_25; (C) 0718c4_30; (D) 0718d4_25.
The most obvious effect of the [Ca2+] modification was a change in event frequency. A view of magnitude and time course of the effect is represented for frog and rat, diary plot-style, in Fig. 4. The number of events per frame was plotted (normalized to 1 s and 100 μm of scanned fiber length) as a function of time of image acquisition. Fig. 4 A shows that in frogs, spark frequency changed markedly upon solution changes. The effect was sometimes complex, with a rapid response followed by slower trends, and it was generally reversible. Fig. 4 B plots the [Ca2+] dependence of frequency in nine experiments. Frequency increased in a linear manner with [Ca2+]cyto. However, while the dependence was as described up to 400 nM, at 800 nM [Ca2+]cyto, the response was variable. When the high [Ca2+]cyto was reached after several solution changes, spark frequency was reduced. On the other hand, when the fiber was exposed to this concentration at early times during the experiment, the effect was a clear increase in spark frequency. The value shown in the graph is an average of frequencies observed during early exposures only.
Figure 4.
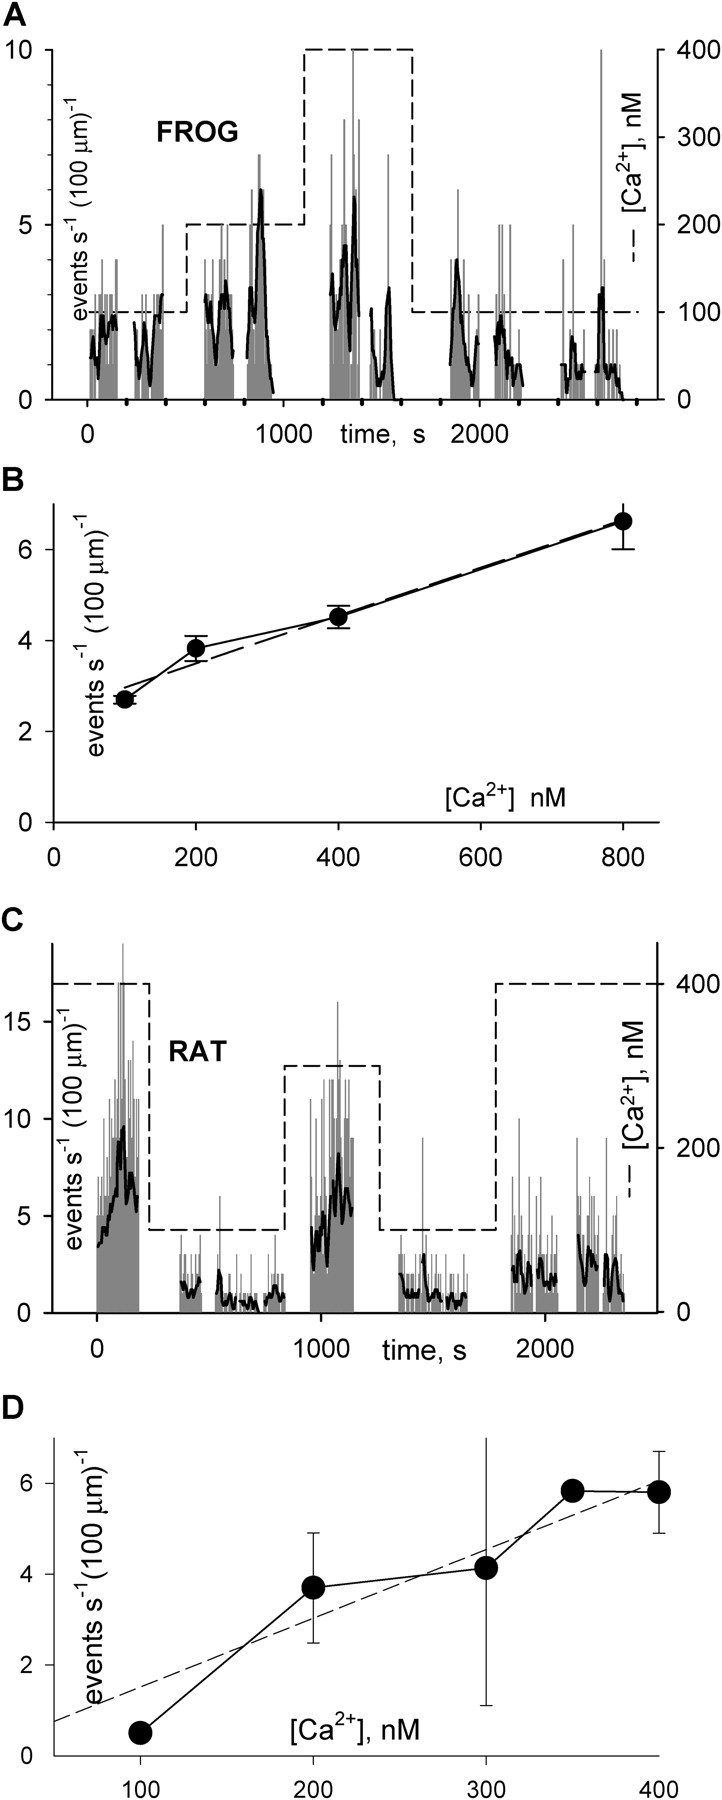
Dependence of spark frequency on cytosolic [Ca2+]. (A and C) Frequency of events (number, per second, per 100 μm of line scanned) determined objectively in successive line scans, versus time. In red is a smoothed version of the same frequency. Dashed trace: nominal [Ca2+] in perfusing solution. (B and D) Averaged frequency versus nominal cytosolic [Ca2+], frog data (B) derived from all experiments listed in Table II. Rat data (D) derived from all experiments in Table III. Frequency in repeated passages at same [Ca2+] were averaged first in individual fibers, and then fiber values were averaged with equal weight. Bars represent ± one SEM (range when n = 2). Regression slope for frog data: 0.0052; intercept: 2.43; r2: 0.977. Regression slope for rat: 0.017; intercept: −0.67; r2: 0.911.
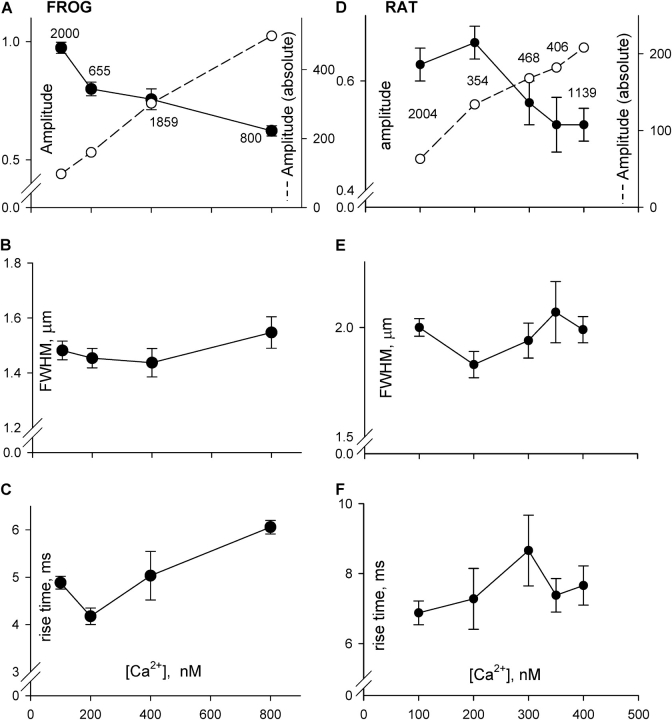
A large number of events was detected in these experiments, giving us the opportunity to explore in detail the effect of [Ca2+]cyto on morphology of Ca2+ sparks. Table II summarizes the spark parameters at different cytosolic [Ca2+], and a graphic view is in Fig. 5 (A–C). As already suggested by the images shown, amplitude of events (relative to resting fluorescence) decreased monotonically with [Ca2+]cyto. In the range of [Ca2+] explored, 100–800 nM, resting fluorescence was nearly proportional to [Ca2+]cyto. Thus it was possible to infer a measure of “absolute” amplitude of sparks, by multiplying the relative amplitude and the nominal [Ca2+] in the solution. Such absolute amplitude, represented by open symbols in Fig. 5 A, increased less than proportionally with cytosolic [Ca2+].
TABLE II.
Morphology of Frog Events in Glutamate Solutions
| [Ca2+] | Amplitude | FWHM | Rise time | FDHM | N | |
|---|---|---|---|---|---|---|
| nM | μM | ms | ms | |||
| 071803b | 100 | 0.89 | 1.39 | 4.78 | 9.37 | 179 |
| 071803c | 100 | 0.97 | 1.30 | 4.36 | 10.22 | 375 |
| 071803d | 100 | 0.92 | 1.50 | 4.98 | 10.18 | 179 |
| 072103b | 100 | 0.91 | 1.45 | 4.73 | 9.84 | 139 |
| 072103c | 100 | 0.98 | 1.56 | 5.20 | 9.96 | 353 |
| 072103d | 100 | 1.03 | 1.65 | 4.51 | 8.29 | 47 |
| 072903a | 100 | 1.12 | 1.45 | 4.72 | 10.31 | 168 |
| 072903b | 100 | 0.95 | 1.46 | 4.93 | 9.64 | 342 |
| 072803a | 100 | 1.00 | 1.55 | 5.74 | 10.42 | 218 |
| Averages | 0.97 | 1.48 | 4.88 | 9.80 | 2000 | |
| SEM | 0.02 | 0.03 | 0.14 | 0.22 | ||
| 071803b | 200 | 0.78 | 1.46 | 3.89 | 8.97 | 131 |
| 072103b | 200 | 0.86 | 1.39 | 4.15 | 9.09 | 190 |
| 071803d | 200 | 0.76 | 1.51 | 4.49 | 9.08 | 334 |
| Averages | 0.80 | 1.45 | 4.18 | 9.05 | 655 | |
| SEM | 0.03 | 0.04 | 0.17 | 0.04 | ||
| 071803b | 400 | 0.76 | 1.35 | 4.01 | 8.48 | 125 |
| 071803c | 400 | 0.73 | 1.32 | 4.54 | 10.01 | 702 |
| 072103b | 400 | 0.76 | 1.39 | 4.34 | 9.43 | 314 |
| 072903a | 400 | 0.94 | 1.38 | 4.60 | 10.24 | 295 |
| 072903b | 400 | 0.75 | 1.53 | 5.23 | 10.62 | 102 |
| 072803a | 400 | 0.61 | 1.65 | 7.47 | 14.19 | 321 |
| Averages | 0.76 | 1.44 | 5.03 | 10.49 | 1859 | |
| SEM | 0.04 | 0.05 | 0.51 | 0.80 | ||
| 071803d | 800 | 0.60 | 1.49 | 6.20 | 11.77 | 186 |
| 072103c | 800 | 0.64 | 1.60 | 5.92 | 11.74 | 614 |
| 800 |
All concentrations, except 800 nM, were alternated repeatedly, and data from repeated visits to the same concentration were pooled. For 800 nM [Ca2+], only initial exposure values are listed. N is number of events. Values of N in bold are totals rather than averages. All other parameters are defined in materials and methods. FWHM, full width at half magnitude; FDHM, full duration at half magnitude.
Figure 5.
Dependence of Ca2+ spark parameters on [Ca2+]cyto. Data are from all events detected in the experiments listed in Table II (for frogs, A–C) or Table III (rats, D–F). Parameter values were averaged first in individual fibers (including repeated passages at the same [Ca2+]cyto). Then fiber values were averaged with equal weight. Amplitude is the peak value of ΔF/F0. Absolute amplitude (open symbols, dashed lines in A and D) was obtained by multiplying amplitude by nominal [Ca2+].
As shown in Fig. 5, the other morphologic parameters were remarkably insensitive to changes in [Ca2+]cyto, with spatial width unchanged, and rise time perhaps increased by 1 ms. This stability of morphology indicates that the changes in amplitude must have been due to changes in unitary Ca2+ current, rather than numbers of channels or the time course of their open probability.
While the general approach was similar in mammalian skeletal muscle fibers to that followed in the frog muscle experiments, the lower frequency of spontaneous events dictated that all experiments be performed in sulfate-based internal solutions. While this substitution of convenience may weaken the comparison, we believe that the anion change should not significantly change the modulation by cations. Indeed, Zhou et al. (2003a) demonstrated that the morphologic spark parameters barely change when glutamate is replaced by sulfate. Moreover, the effects of the changes in [Ca2+] were remarkably similar in both species, in spite of the different main anion in the solution. Finally, the observations on modulation by Mg2+, communicated later, are consistent with earlier results by Kirsch et al. (2001) using glutamate as main anion. One additional difference in the protocol applied to mammalian fibers was the omission of 800 nM Ca2+ solutions, which were not tolerated well.
Fig. 4 C is a diary plot of event frequency in successive line scan images of a complete experiment. [Ca2+] in the perfusing solution, starting at 400 nM, was changed several times, as indicated in the upper trace. The changes resulted in modifications of event frequency, which appeared to follow [Ca2+]cyto roughly in the same manner as observed for frog muscle. The plot in Fig. 4 B, which includes data from 15 rat fibers, reproduces the observation made in frog cells, that spark frequency increases with [Ca2+]cyto.
The average values of the morphologic spark parameters in different Ca2+ solutions are listed in Table III, and plotted for comparison with those in frog events in Fig. 5 (D–F). The effects on event parameters were largely similar to those in the frog: a decrease in relative amplitude with [Ca2+]cyto (corresponding to a less than proportional increase in absolute amplitude), no change in spatial width, and a barely significant increase in rise time.
TABLE III.
Morphology of Rat Events in Sulfate Solutions
| [Ca2+] | Amplitude | FWHM | Rise time | FDHM | N | |
|---|---|---|---|---|---|---|
| nM | μM | ms | ms | |||
| 080701a | 100 | 0.58 | 2.06 | 7.54 | 12.38 | 425 |
| 080701b | 100 | 0.61 | 2.05 | 7.19 | 11.41 | 469 |
| 080801a | 100 | 0.69 | 2.11 | 5.69 | 9.68 | 341 |
| 080801b | 100 | 0.73 | 1.98 | 5.99 | 9.73 | 48 |
| 011002a | 100 | 0.58 | 1.81 | 7.15 | 10.50 | 433 |
| 011602a | 100 | 0.60 | 1.97 | 7.73 | 12.04 | 288 |
| Averages | 0.63 | 2.00 | 6.88 | 10.96 | 2004 | |
| SEM | 0.03 | 0.04 | 0.34 | 0.47 | ||
| 082401a | 200 | 0.72 | 1.76 | 6.94 | 11.13 | 156 |
| 082801a | 200 | 0.70 | 1.76 | 5.97 | 10.03 | 84 |
| 082801b | 200 | 0.60 | 1.96 | 8.94 | 14.25 | 114 |
| Averages | 0.67 | 1.83 | 7.28 | 11.80 | 354 | |
| SEM | 0.03 | 0.06 | 0.87 | 1.26 | ||
| 082901a | 300 | 0.55 | 1.80 | 7.88 | 10.72 | 139 |
| 100101a | 300 | 0.50 | 1.95 | 10.67 | 15.78 | 358 |
| 090401a | 300 | 0.64 | 2.07 | 7.44 | 11.79 | 45 |
| Averages | 0.56 | 1.94 | 8.66 | 12.76 | 468 | |
| SEM | 0.04 | 0.08 | 1.01 | 1.54 | ||
| 081401a | 350 | 0.57 | 2.21 | 7.86 | 13.36 | 250 |
| 081401b | 350 | 0.47 | 1.93 | 6.89 | 10.68 | 156 |
| 406 | ||||||
| 101001b | 400 | 0.44 | 2.08 | 8.25 | 12.24 | 64 |
| 082401a | 400 | 0.61 | 2.03 | 8.28 | 13.11 | 272 |
| 082401b | 400 | 0.55 | 2.06 | 7.14 | 12.00 | 181 |
| 082801a | 400 | 0.50 | 1.76 | 6.86 | 9.76 | 396 |
| 082801b | 400 | 0.48 | 2.01 | 7.79 | 12.07 | 226 |
| Averages | 0.52 | 1.99 | 7.66 | 11.84 | 1139 | |
| SEM | 0.03 | 0.06 | 0.29 | 0.56 |
For details, see Table II legend.
Frequency of Events Changes After a Lag
A reproducible observation was an apparent delay in the onset of the effects after changes in [Ca2+] solution. Fig. 6 represents xt scans obtained during a solution change in a frog (A) or a rat fiber (B). The upper traces schematically depict the time course of [Ca2+] in the solution. After the small artifact produced by the early flow of solution in the chamber, there is a lag that precedes the increased spark activity. This delay, which was always present, appeared to be unrelated to diffusion or mixing times, because the fluorescence increase expected from the increased [Ca2+] was observed within 100 ms (both in actual experiments and in calibration situations, with no fiber in the chamber, as shown in the inset). In contrast, the change in event frequency usually occurred after 1 or 2 s. Moreover, scanning was performed at <10 μm from the fiber surface, so that the diffusion delays would be minimal. Finally, the changes in these cases seemed disproportionately large compared with the change in [Ca2+] in the solution. By analogy with the nonlinearity of the effects of intra-SR Ca2+ reported in cardiac muscle (e.g., Shannon et al., 2000), this hints at a locus inside the SR as effector for the delayed increase in frequency.
Upon solution changes, however, we could not rule out significant delays in the actual changes of [Ca2+]cyto. A faster, more homogeneous change in [Ca2+] was sought in photorelease of Ca2+ from NP-EGTA previously equilibrated in the cytosol. The photorelease approach also offered the possibility to achieve much greater increases in [Ca2+]cyto.
Event Frequency Follows Homogeneous Changes in [Ca2+]cyto After a Lag
The photorelease technique, illustrated in materials and methods, consisted in delivery of high intensity pulses of UV light to a cell immersed in a solution with NP-EGTA, ∼80% saturated with calcium. Each flash resulted in an abrupt and fairly homogeneous change in [Ca2+] within the irradiated fiber volume (Figs. 1 and 2). The presence of NP-EGTA itself resulted in substantial reduction of the frequency of spontaneous sparks. Use of scavengers of free radicals (like ascorbate, at 5 mM) did not change the effect. The inhibition of sparks was reversible upon removal of NP-EGTA, but it precluded use of cage concentrations >1 mM in the frog, or 0.5 mM in the rat for studies of the control of sparks.
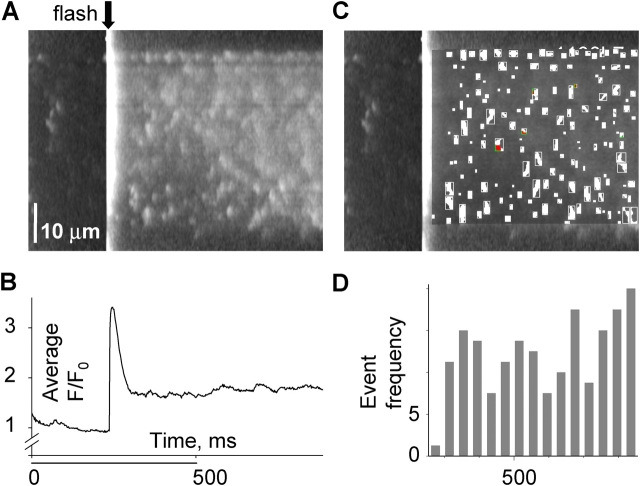
Fig. 7 A illustrates a line scan synchronized with a UV flash in a frog fiber. Upon application of the flash (arrow), the spatially averaged fluorescence increased abruptly and then decayed to a steady value (B). As shown in materials and methods, this increase corresponds to a [Ca2+] spike of ∼60 μM, followed by a steady increase of ∼80 nM above resting level. During the scanning time before the flash a few events were observed in the image. After the flash, the event frequency increased markedly. Sparks were located by the automatic detection program. A modified image, with markings made by the detector is in Fig. 7 C. The frequency of events detected in successive time bins is plotted in Fig. 7 D. Following the fluorescence transient, there was an interval when no increment in frequency was apparent. This was observed in every application of single flashes in six frog fibers. The delay was typically 80 ms, while that in solution change experiments was 1 s or greater.
Figure 7.
Fluorescence with synchronized flash photorelease of Ca2+. (A) Line scan of fluorescence in a frog fiber, synchronized with a 355-nm flash (at arrow). The cell was equilibrated with solution containing 1 mM NP-EGTA and 100 nM nominal [Ca2+]. Fluorescence was normalized to its average before the flash. (B) Spatial average of fluorescence vs. time. Profiles like this, fitted in Fig. 1, are consistent with a peak of [Ca2+] near 100 μM. The steady increase that follows the peak corresponds to ∼80 nM above resting level. (C) Sparks located by the automatic detection program, which mark the image with boundaries of the suprathreshold “footprint” of each event. (D) Number of events detected in successive time bins of 40 ms, starting 40 ms after the flash. Image identifier 1030B7.1.
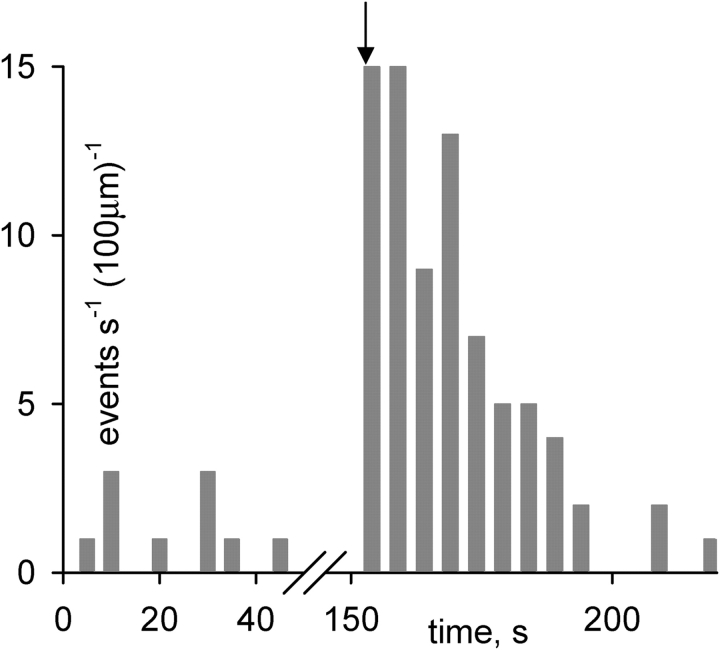
Fig. 8 documents the time course of the frequency change in a different cell, diary plot-style, over a more extended time scale. Each bar corresponds to an image acquired at 5-s intervals. The frequency was significantly increased by the flash. Unlike the effect of a solution change, where typically the first image in the new solution had a less-than-complete change in frequency, the effect of the flash was usually maximal in the first image; again, a consequence of the briefer lag. The effect was transient, typically reversing in minutes.
Figure 8.
Evolution of event frequency after Ca2+ photorelease in the frog. Frequency (number of events per second and 100 μm) in successive line scan images, 10 before and 15 after the flash, taken at 5-s intervals. The cell contained 1 mM NP-EGTA, at nominal [Ca2+] of 100 nM. The flash was applied at the beginning of a line scan, at arrow. Image identifier 082003a1.1-10, 082003a2.1-15
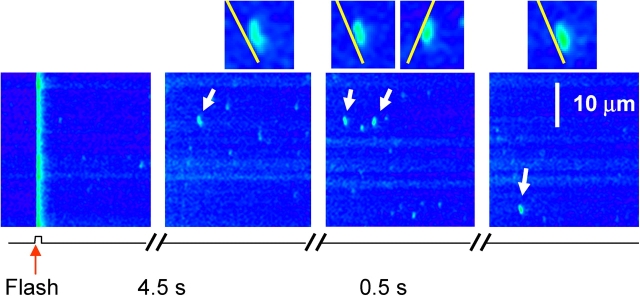
Another aspect of the effect in frog fibers is presented in Fig. 9, where a flash of low intensity was applied. In these cases, the rise in event frequency induced by the flash was rather small, and the delay was greater. This observation indicates that the low frequency interval after a UV flash was not due to inactivation by photoreleased Ca2+.
Figure 9.
Fluorescence after a low intensity UV flash in a frog fiber. Successive line scan images, in a frog fiber prepared as described in the legend of Fig. 8. The flash was applied in the first frame at arrowhead. White arrows indicate sparks that propagate. They are represented enlarged threefold in the corresponding insets. The yellow lines, with a slope of 155.9 μm/s, are approximately parallel to the slanted edge of each spark. Image identifier 082903a9.1-4.
The lower intensity flashes also allowed for a better separation of post-flash sparks, and better resolution of their morphology. Visual examination showed numerous events like those magnified in insets in the figure, characterized by a slanted “front end.” As first shown for adult muscle by Brum et al. (2000) and for primary myotubes by Shirokova et al. (1999), the slanted front is evidence of physical migration of the Ca2+ source. It is noteworthy that the slant angles are essentially equal in all propagating sparks, consistent with a stereotyped propagation velocity of 156 μm/s.
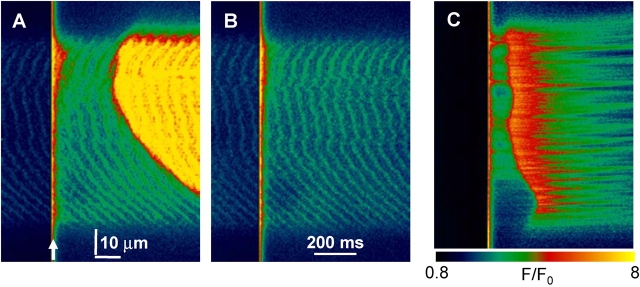
As stated above, the presence of NP-EGTA inhibited the production of spontaneous Ca2+ sparks. When concentrations >1 or 2 mM were present, no sparks were observed. The effect of photorelease in those cases, though not on sparks, was still dramatic, and provided additional evidence of an intra-SR mechanism. An example using 5 mM NP-EGTA is in Fig. 10. Panel A is an xy scan image of fluorescence. Photorelease by a laser flash, applied at the arrow, had no immediate effects other than the expected, quite homogeneous spike in [Ca2+]cyto. This spike, which as estimated in materials and methods peaked at ∼300 μM, caused no immediate effects. After a lag of 250 ms, SR Ca2+ release started and propagated rapidly across the fiber. That this response required the increase in SR load was confirmed by the failure to elicit response by an identical flash, applied 60 s later (Fig. 10 B). Recovery from depletion requires 3 min or longer in frog fibers at room temperature (Pizarro and Ríos, 2004); hence the second flash found a partially depleted SR. Fig. 10 C is a line scan image (normalized to resting fluorescence), obtained 4 min later, with the delayed response now shown as a function of time. It evidences reproducibility of the effect on a rested SR, showing additionally that the response may originate more or less simultaneously at several locations. The activation of other areas may then be locally generated or propagated by CICR.
Figure 10.
Delayed responses to photorelease in the absence of Ca2+ sparks. Transversal scans of fluorescence in a frog fiber equilibrated with 5 mM NP-EGTA at 150 nM free [Ca2+]. (A) Fluorescence in an xy scan. A 355-nm flash was applied at the arrow, causing Ca2+ photorelease. Massive Ca2+ release from the SR followed photorelease after a lag. (B) Same protocol, repeated 60 s later. No SR Ca2+ release occurred. (C) Same protocol, applied 4 min later, but imaging in xt mode. Fluorescence in C was normalized to F0(t), average of fluorescence over time before application of the flash. Image identifiers 102501bxy4, xy5, 9.
Similar photorelease experiments were performed in rat fibers. Due to the basal reduction of event frequency by NP-EGTA, cage concentration was limited to 0.5 mM. In the example of Fig. 11, the flash-induced transient did not have an immediate effect, but in the next frame, the number increased. Responses in rat fibers were qualitatively similar to those in the frog, but the magnitude of the changes was extremely variable, always less pronounced than in the frog, and often absent. Thus, while individual experiments like the one shown leave no doubt of the existence of an effect, the aggregate result of five flashes applied in the same fiber, shown in Fig. 11 B as an average diary plot of frequency before and after a flash, showed a barely significant change (the average frequency over four images after the flash was not different from the reference in a two-sided t test; it was significant at a P < 0.05 in the one-sided test). As shown in Fig. 8 for the effects in the frog, the increase in frequency appeared to decay rapidly. The difficulty to demonstrate significance may have been due to the use of a lower concentration of NP-EGTA, combined with the rapid restoration of resting frequency. An additional difference between the results in the two species was that propagating sparks were never observed in the rat, before or after the flash. As noted for the frog, even the most intense UV flashes acting on the highest concentrations of NP-EGTA used did not directly induce Ca2+ release in rat muscle fibers.
Changing Cytosolic [Mg2+] in Frog Fibers
[Mg2+] in the cytosol was varied in the range 0.2–10 mM through rapid solution exchange. In experiments in frog muscle, all solutions were glutamate based and had 100 nM [Ca2+]. Fig. 12 illustrates an experiment in a frog fiber. The diary plot shows that increasing [Mg2+] produced a reduction in event frequency and vice versa, in agreement with the observations of Lacampagne et al. (1998). A plot of average frequency versus [Mg2+] in several experiments, Fig. 14 (green symbols and lines), shows a monotonic increase as [Mg2+] was lowered. The changes were restricted to concentrations <1.45 mM, as the frequency of events decayed precipitously above this range.
Figure 12.
Dependence of spark frequency on cytosolic [Mg2+] in frog. Frequency in successive images (obtained as described for Fig. 4) vs. time. Dashed trace: nominal [Mg2+] in perfusing solution. Image identifier 073003a.
Figure 14.
[Mg2+] dependence of event frequency in frogs and rats. Green symbols and lines, frog events. Dark red, rat events. Continuous curves: a, obtained with Eq. 4, K Ca = 1 μM, K Mg = 25 μM, K i = 1 mM, κ = 0.025, and N = 39,000; b, best fit with Eq. 6, K Ca = 375 μM, K i = 3.1 mM, κ = 0.025, and N = 134,000.
In Rat Fibers, Changing Cytosolic [Mg2+] Has Different Effects than in the Frog
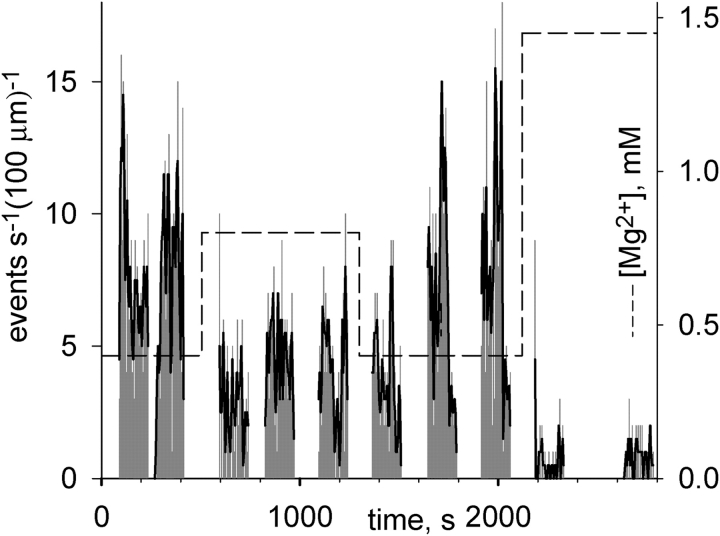
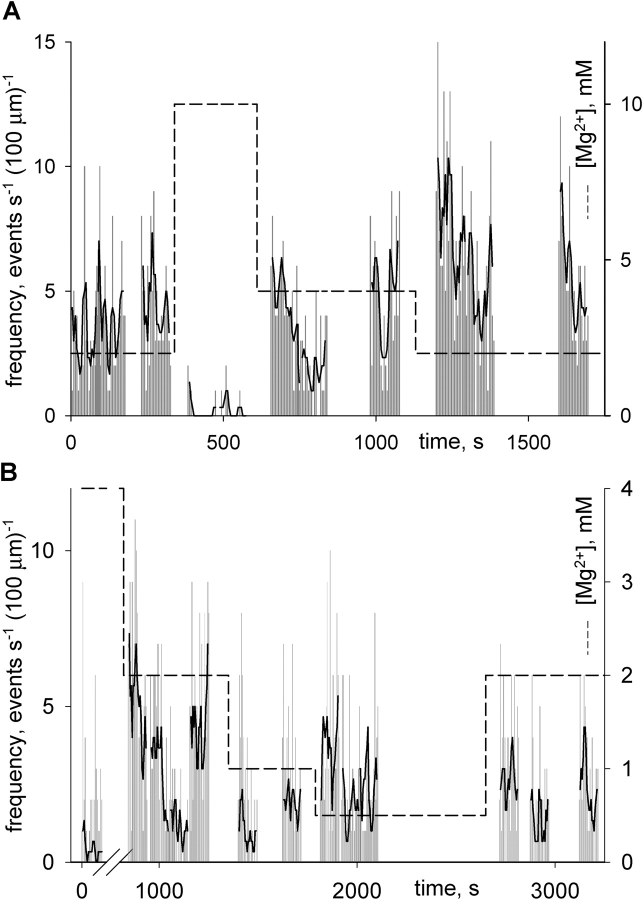
The changes of [Mg2+] in the rat, however, had strikingly different effects, depending on the range of concentrations explored. Fig. 13 A illustrates the effects of changing [Mg2+] in the 2–10 mM range. To maximize event frequency, in this and all other experiments the nominal [Ca2+] was 300 nM. There is clear evidence of concentration dependence of frequency, which is qualitatively similar to that in the frog (i.e., an increase with decreasing [Mg2+]). There were important quantitative differences, namely the ability to observe sparks in the rat at concentrations of 4 mM and higher. Because events could be observed even at 40 mM [Mg2+], the range 0.2–40 mM was explored thoroughly in several fibers. Each experiment typically focused on two or three concentrations, which were visited repeatedly. The effects were fully reversible and the frequencies were calculated averaging data in all repeated passages. Table IV summarizes the results.
Figure 13.
Dependence of spark frequency on cytosolic [Mg2+] in the rat. Frequency in successive images vs. time. Dashed trace: nominal [Mg2+] in perfusing solution. (A) Changes in a high [Mg2+] range. (B) Changes in a low [Mg2+] range. Note absence of systematic changes of frequency in B. Image identifiers: (A) 011301d; (B) 011701b.
TABLE IV.
Effects of [Mg2+] on Event Frequency in the Rat
| [Mg2+], mM | |||||||
|---|---|---|---|---|---|---|---|
| 40.0 | 10.0 | 4.0 | 2.0 | 1.0 | 0.5 | 0.2 | |
| 073001a | 0.83 | ||||||
| 073101a | 2.28 | 4.92 | |||||
| 073101c | 3.43 | 5.25 | |||||
| 091101a | 0.40 | 1.33 | 5.65 | ||||
| 091301b | 0.30 | 2.67 | 2.81 | ||||
| 091301c | 0.25 | 0.75 | 4.71 | ||||
| 091301d | 0.73 | 5.11 | |||||
| 091701a | 3.52 | 2.90 | 1.83 | ||||
| 091701b | 0.45 | 2.85 | 1.48 | 2.65 | |||
| 092001a | 0.10 | 0.32 | |||||
| 093003a | 5.02 | 6.18 | |||||
| 093003b | 3.83 | 4.94 | |||||
| 100903a | 4.06 | 3.36 | |||||
| Averages | 0.10 | 0.32 | 1.19 | 3.84 | 2.22 | 3.99 | 4.3 |
| SEM | 0.04 | 0.40 | 0.45 | 0.41 | 0.67 | 0.95 | |
Scans were parallel to the fiber axis. Frequencies are events per second per 100 μm of fiber. In all fibers, at least one of the concentrations was applied twice. In most cases, several passes were made through two or more concentrations and all images at the same concentration were pooled. Averages are of equally weighted frequencies for individual experiments. Nominal [Ca2+]cyto was in all cases 100 nM.
At variance with the frog, when [Mg2+] was changed in the rat in the range <2 mM, the event frequency became essentially independent of concentration (Fig. 13 B). The changes in concentration often resulted in a transient increase in frequency, which occurred in the first few images after the change, but then settled to a frequency that was not statistically different from that before the change. Averages and SEM are plotted versus [Mg2+] in Fig. 14 (dark red). The continuous lines (a and b) represent fits of functions considered in discussion.
Fig. 15 plots morphologic sparks parameters versus [Mg2+] in the rat. There were only slight changes in morphology as a function of [Mg2+]. This is generally consistent with the observation in the frog of essentially invariant morphologic properties (Lacampagne et al., 1998).
Figure 15.

Dependence of rat Ca2+ spark parameters on [Mg2+]. Data are from all events detected in the experiments listed in Table IV. Parameter values were averaged first in individual fibers (including repeated passages at the same [Mg2+]), and then fiber values were averaged with equal weight.
DISCUSSION
The present study sought to describe the dependence of local events of Ca2+ release on the cytosolic concentrations of the main ionic modulators of RyRs. The studies, initially designed to look for steady effects, turned out an unexpected temporal dependence of the frequency of events. Striking differences were also found in the modulation of events in mammalian (rat) compared with amphibian (frog) muscle.
Cytosolic Ca2+ Had Major Effects on Event Frequency
In both species studied, the increase in [Ca2+]cyto between 100 and 400 nM resulted in a substantial increase in event frequency. This increase was not distinguishable from a linear function, consistent with a simple, single (noncooperative) action site. The effect on event frequency was quantitatively more important than any changes of morphologic spark parameters. The latter included a decrease in relative amplitude (i.e., ΔF/F0) and no significant changes in other parameters. While the significant changes had a straightforward dependence on [Ca2+]cyto in steady state, their peculiar time dependence suggested a complex mechanism.
Frequency of Events Followed Increases in [Ca2+]cyto After a Time Lag
Diary plots of frequency in successive images often showed a trend of slow increase after a change to a greater [Ca2+]. When the change in concentration was done while imaging was in progress, a time lag was found between intervention and response. While the lag time between intervention and frequency increase was of 1 or 2 s when the intervention was a change in bathing solution, it was as brief as 80 ms after a Ca2+ photoreleasing flash. When low intensity flashes were applied, the latency for the increase in frequency became greater, indicating an inverse relationship between lag time and the magnitude of the Ca2+ concentration change.
A simple interpretation of lag and its relationship to magnitude of the change in [Ca2+]cyto is that the effect requires an increase in free calcium inside the SR, [Ca2+]SR, or total SR calcium, CaSR. An alternative hypothesis, that the lag is due to Ca2+-dependent inhibition of RyRs, cannot explain the inverse relationship between lag and magnitude of the concentration change.
Likewise, the slow trends in frequency observed after a solution change may reflect slow changes in the SR Ca2+ content. Immediate and reversible changes, which were also seen, may instead reflect [Ca2+] acting on the cytosolic side of the channels.
Studies of cardiac muscle have provided evidence of control of Ca2+ release by luminal SR calcium (for review see Györke, et al., 2002). These effects feature a highly supralinear dependence on CaSR, suggesting threshold phenomena of high cooperativity (Lukyanenko and Györke 1999; Shannon et al., 2000; Trafford et al., 2000). If the increase in spark frequency observed in the present work after a photorelease spike is due to the increase in CaSR, then it must also have a highly supralinear dependence on concentration. Indeed, CaSR probably rises slowly during the latency interval after cytosolic [Ca2+] increase, but the event frequency increase is sudden and substantial. Therefore, the postulated intra-SR regulation is consistent with the well-established nonlinearity of the homologous mechanism in cardiac muscle.
While the present study was mainly focused on the effects of [Ca2+]cyto on Ca2+ sparks, we also made a limited exploration of global effects of photorelease, when higher cage concentrations prevented the occurrence of spontaneous Ca2+ sparks. The results in those cases were qualitatively similar: no immediate response to the Ca2+ spike, followed by release from the SR after a lag. This response had highly nonlinear properties, a sudden massive response, clearly self-sustained and reinforced by propagation, demonstrated in Fig. 10. It was also dependent on the SR load (or overload), as evidenced by the strict requirement of several minutes of recovery between repeated responses.
As mentioned, the intra-SR actions of Ca2+ demonstrated in cardiac myocytes, and now putatively here, have supralinear properties; they are threshold like, apparently related to high powers of [Ca2+]SR. This may reflect multiple cooperative binding sites of Ca2+ inside the SR lumen, consistent with a proposed regulatory role of calsequestrin (Ikemoto et al., 1989; Hidalgo and Donoso, 1995; Györke et al., 2004) discussed below. Alternatively, an interaction of sites may be at work, whereby intralumenal Ca2+ increases both p o of RyRs and their unitary current. Such dually increased “leak” feeds back on the (cytosolic) activation site of the channels and becomes self-sustaining at some point, thus explaining disproportionate all-or-none responses.
While Ca2+ sparks are believed to require CICR, and the response to photoreleased [Ca2+]cyto also appears to involve CICR, the fact that large, propagated responses with CICR characteristics can be elicited without sparks suggests a separation of these two phenomena. Sparks apparently have additional requirements, and can therefore be inhibited separately in cells whose RyRs remain robustly activatable by calcium. Zhou et al. (2003a) showed that Ca2+ sparks of amphibian and mammalian muscle are morphologically different, and suggested that the latter may not require CICR. We have also communicated preliminary evidence of two mechanisms for the mutual interactions of Ca2+ release channels required in the production of sparks in the frog (Zhou et al., 2003b). Only one of these would involve CICR, while the other would be similar to the allosteric coupling postulated to occur between channels in bilayers (Marx et al., 1998).
In summary, the consequences of changing cytosolic Ca2+ are complex, with features of direct cytosolic side effects, secondary lumenal actions, and positive feedback. To better separate these interlocked mechanisms, we are implementing a new technique that affords direct measurement of [Ca2+]SR (Zhou et al., 2004). Without such measurements, any dissection of lumenal and cytosolic mechanisms will remain incomplete.
Large Increases in [Ca2+]cyto Did Not Directly Cause Ca2+ Release
As illustrated in Fig. 1, peak [Ca2+]cyto upon photorelease of caged Ca2+ probably reached near 300 μM when 5 mM NP-EGTA was present, and 70 μM with 1 mM NP-EGTA. These large spikes never caused an immediate response, while always eliciting an increase in frequency after a lag. Fast steps of cis Ca2+ are known to open channels reconstituted in bilayers (e.g., Zahradníková et al., 1999; 2003; Zoghbi et al., 2004). The failure to observe an immediate effect here might reflect a basal inhibition of RyRs in situ. We calculated numerically the occupancy of a Ca2+ binding site exposed to spikes of photoreleased Ca2+, using for the site kinetic parameters defined in bilayers. The calculation illustrated in Fig. 1 D used parameters of Schiefer et al. (1995) and yielded peak occupancies ranging from 8 to 16% (depending on [Mg2+]). When 1 mM NP-EGTA was present, the peak occupancy was 3.5–8%. If, as postulated in the bilayer models, Ca2+ binding to the site translated directly to channel opening, the frequency of sparks would have increased immediately and enormously (see analysis of relationship between channel opening and spark frequency in next section). Our failure to observe any direct response indicates that RyRs are inhibited in situ, in rats and frogs, by comparison with their properties in reconstituted systems. The conclusion that CICR would require extremely high [Ca2+]cyto under physiological conditions was first reached by Endo (1975), who predicted that a concentration of at least 300 μM would be necessary. We now show that not even those levels are capable of triggering Ca2+ release directly. Consequently, additional inhibitory factors must be contemplated.
Ca2+ Spark Frequency Should Reflect Spontaneous Opening of Single Channels
While the effects of changes in cytosolic [Ca2+] were similar in rats and frogs, the concentration profiles of the effects of Mg2+ were qualitatively different, a fact that may afford new insights into diverse mechanisms that control their Ca2+ release channels. To interpret the species differences within a theoretical framework of channel regulation, we used simple models of control, largely based on measurements in bilayer-reconstituted channels, to account for the steady frequency of Ca2+ sparks and its changes.
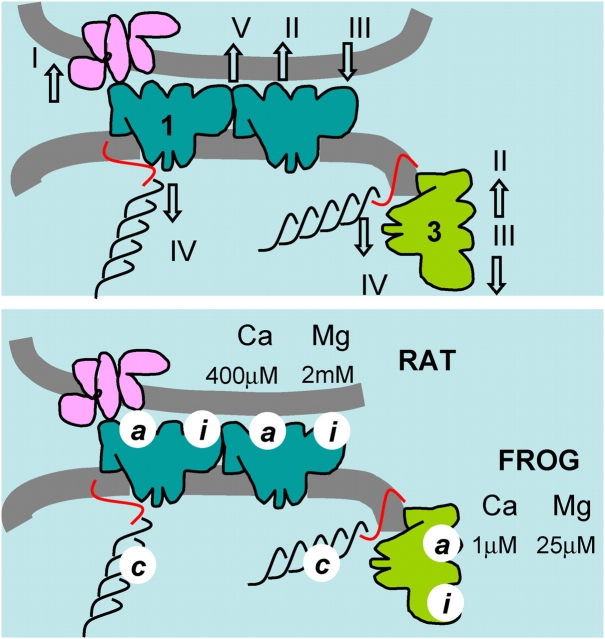
The state of openness of RyRs can be affected by many ligands (for review see Meissner, 1994). Ca2+ is known to exert its effect mainly by binding to two sites, named I and II by Laver et al. (1997), on cytosolic domains of the RyR. In the discussion that follows, and in the diagrams of Fig. 16, these sites are named instead “a” and “i”. Binding to site a, with dissociation constant of 1 μM in mammalian muscle, activates the channels (an action underpinning the CICR phenomenon). Binding to site i, with dissociation constant near 1 mM (Meissner et al., 1986), puts the channels in a closed state with features of inactivation (in this state the channel cannot be opened by binding to its activation site). Mg2+ may bind to both sites, with dissociation constant ∼30 μM at site a and one indistinguishable from that of Ca2+ at site i (Laver et al., 1997). Bound to either site, Mg2+ is inhibitory; at site a preventing activation by Ca2+, and at site i causing inactivation.
Figure 16.
Control of Ca2+ release. (Top) Actions required to explain the present results. RyR1 in blue, RyR3 in green. I, activation of RyR1 by the T membrane voltage sensor. II, activation (of RyR1 or 3) by Ca2+. III, inhibition by Mg2+. IV, basal inhibition (of either isoform) by interactions in vivo, attributed here to triadin (red) or calsequestrin (black). V, putative interchannel allosteric interaction, which could participate in the generation of sparks and/or contribute to effect IV. (Bottom) Dissociation constants derived in the present work. Values corresponding to high affinity binding of Ca2+ and Mg2+ explain results in the frog but not the rat; hence they are attributed to RyR3 exclusively. Low affinity activation by Ca2+ and inhibition by Mg2+ was observed in the rat only and is attributed to sites in its RyR1. The species names clarify these attributions in the figure.
Binding at a High Affinity Site Explains the Effect of Mg2+ on Frequency in the Frog
The effect of reducing [Mg2+] on spontaneous Ca2+ sparks of frog muscle can be accounted for quantitatively on the basis of the interactions described above. The approach here generalizes one of Laver et al. (1997) introduced to interpret effects on unitary currents of channels in bilayers. Upon simplification, it is reducible to that used by Lacampagne et al. (1998) to explain the effect of [Mg2+] on frequency of Ca2+ sparks in the frog.
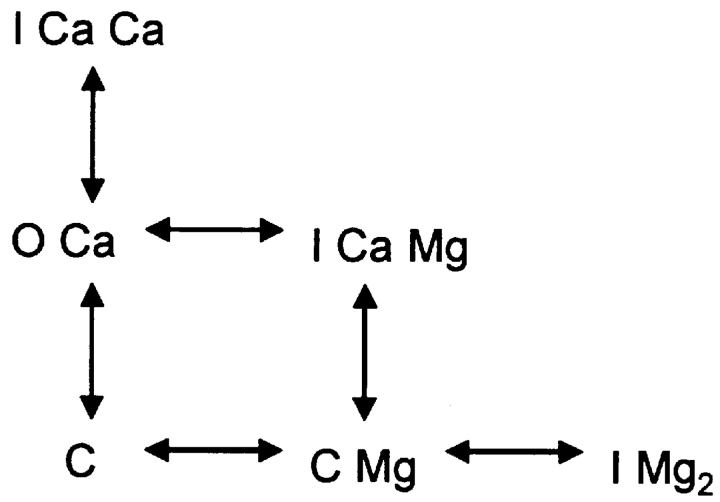
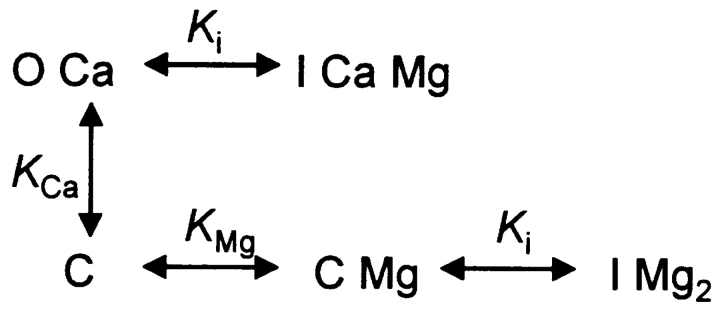
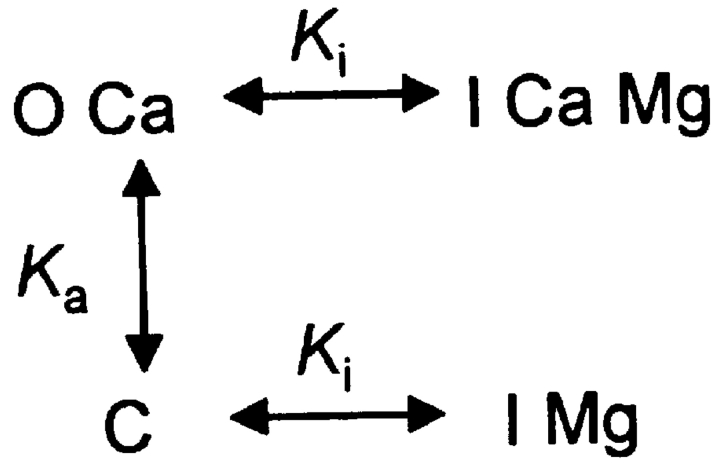
The assumed interactions of the RyR with Ca2+ and Mg2+ are represented in state Scheme 1. C, O, and I represent states of the channel. Because the analysis is only concerned with steady probabilities, states that are theoretically possible but populated very seldom (like O with no bound Ca2+) are omitted. Therefore, all transitions require ion binding or unbinding, and all dissociation constants have dimensions of concentration. At the cytosolic [Ca2+] used in the present experiments, Scheme 1 reduces to Scheme 2. The relevant dissociation constants are represented as K, with self-explanatory sub-indicies.
(SCHEME 1).
(SCHEME 2).
Because it is not necessary in the argument that follows, these diagrams do not assume cooperativity. A simple cooperativity is introduced in Scheme 3 to interpret the rat data.
(SCHEME 3).
The four equilibrium equations of Scheme 2 and its conservation equation can be solved for the probability (occupancy) OCa of the open state (occupancies and concentrations are in italics).
 |
(1) |
Translating Open Channel Probability to Event Frequency
To compare Eq. 1 with data, it is necessary to relate observed frequency (sparks per second per 100 μm of scan) to p o, which is identical to occupancy. This requires recognizing first that a line scan samples a nearby volume, where there are N channels, randomly gating at open probability p o.
N can be derived from either biochemical studies of ryanodine binding or morphometry of EM images. The density of RyRs was reported as 44 pmoles/g of muscle and 77 pmoles/g of muscle, respectively, for frog and rabbit (Anderson et al., 1994). This is 4.4 × 10⁻¹¹ moles/g × NA molecules mole−1 × 10⁻¹² μm−3 g, or 25 channels per cubic micron of muscle. Considering that isoforms 1 and 3 are present in similar densities, the number would be 12.5 channels of each isoform per μm3. The density in the rabbit, used here as estimator for the rat, will be 43 μm−3.
Different estimates are reached through morphometry. We combined the fractional volume of T tubules in frog muscle (0.0025; Mobley and Eisenberg, 1975),1 with an average sectional area of T tubules of 0.002 μm2 (Peachey, 1965) to derive length of T tubules per unit volume (1.25 μm−2). Assuming that 80% of tubule length is junctional (Mobley and Eisenberg, 1975), and that in these regions there are 120 channels of each isoform per micron, a channel density of 120 μm−3 is reached. While there are no comparable numbers for mammalian muscle, it is possible to use images and morphometry of stained T tubules in Franzini-Armstrong et al. (1999) to relate density of RyRs in rats and frogs. In similarly prepared thick sections, the average number of (junctional) channels derived by these authors from measured tubule length in a 0.5 μm3 volume (selected to contain T tubules in the whole section) was 120 for rat EDL and 70 for frog iliofibularis. Considering that the number of T tubule–containing sections per unit fiber length is double for the rat, the ratio of densities, rat/frog, should be 240/70, or 3.43, which is actually the same as that derived from ryanodine binding measurements (43/1.5, or 3.44). In conclusion, the best estimates of receptor density from morphometry are 120 μm−3 for frog and 412 μm−3 for rat fast-twitch muscle.
The next step is to associate to the line scan a sampled volume, defined so that every spark of average magnitude that originates in it will be detected. In experiments on permeabilized frog fibers equilibrated with solutions of 100 nM [Ca2+], the average amplitude of sparks, given in Table II, is 0.97. A basic result of the theory of spark scanning is that the “true amplitude” of sparks will be underestimated by 2–2.5-fold due to off-focus errors (Ríos et al., 2001). This implies that the modal amplitude of sparks, if they were all in focus, would be 1.9–2.4. Using a simulation method described in detail in Zhou et al. (2003a), whereby sparks are produced as a consequence of a known current of Ca2+ release exiting a source of specified dimensions, we found that to have amplitude 2.1, a simulated spark, sampled in-focus by our confocal microscope (i.e., its fluorescence convolved with the PSF of our system), required a current of 9 pA flowing for 5 ms. This “modal” or “canonical” spark was then used to determine the sampled volume of a line scan, the volume of a region such that canonical sparks originating there will have in the scan image an amplitude greater than the detection criterion (0.3 F0). For this purpose, the spark's source was shifted relative to the scan line in the y or the z direction (both perpendicular to x, the scanning coordinate). It was found that a vertical (z) shift of 1.15 μm and a horizontal (y) shift of 0.90 μm reduced the scanned amplitude to 0.3; these distances mark the boundaries of the detection region.
The associated volume has therefore the length of the scan, 100 μm, and the cross area of an ellipse, of diameters 2.3 and 1.8 μm, or 325 μm3. Using the density estimates from morphometry, the number N of channels of each isoform contained in this volume in frog muscle is 39,000 and in the rat 134,000 of isoform 1. The number of openings in 1 s is N p o τ−1 (where τ is the mean open duration).
Assume that a single channel opening results in the production of a spark in a fraction κ of cases. Hence, the frequency of Ca2+ sparks will be
 |
(2) |
Assuming that the channel's open time is equal to the spark's rise time,2 i.e., 5 ms,
 |
(3) |
The probability in Eq. 1 can be substituted in Eq. 3 to obtain the predicted frequency f in line scan images
 |
(4) |
While the derivation of Eq. 4 required several approximations, its main virtue, to allow for an unbiased comparison of event frequencies in frogs and rats, should not be affected by its likely errors.
In the Frog, Spark Activity is Controlled by Mg2+ at the Activation Site
Eq. 4 with conventional values for the dissociation constants, K Ca = 1 μM, K Mg = 25 μM, K i = 1 mM, and κ = 0.025, generated curve “a”, which describes well the frog values in Fig. 14. In the interesting range where f is measurable, the denominator of Eq. 4 is dominated by the first order term, implying that the channels are largely inhibited by Mg2+ at the activation site.
Because the present frog data are similar to those of Lacampagne et al. (1998), the simple function used in that study
 |
(5) |
also described the data well (with n = 1.24; unpublished data).
At the low [Ca2+] used here, the interactions at site a determine the changes in spark frequency when [Mg2+] changes. Therefore, the occupancy of site i is not reflected in the frequency versus [Mg2+] dependence, and cannot be characterized in the frog studies. No insights on site i were expected, given the impossibility to elicit sparks when site a is saturated.
The frog results can therefore be accounted for within existing theory (represented by Eq. 4), provided that an efficiency factor, κ, is included. While we introduced κ as an efficiency, a success rate at which channel openings cause sparks, its definition must be revised. Indeed, fluorescence signals from single channel openings should be detectable as “embers” (for example see González et al., 2000; Zhou et al., 2003a), but under the present conditions, we did not observe many embers. Therefore κ should be understood as an ad hoc factor. Its low value, 0.025, underscores the basic mismatch between the activity of channels in the simplified preparations where the properties of the control sites were established, and their activity in situ, which appears to be much lower. A parsimonious speculation, previously made for cardiac muscle (for example see Györke et al., 2004), reconciles this observation with the evidence provided here of control from the SR lumen: perhaps the inhibition manifested in the low κ is relieved by intra-SR Ca2+. For example, a basal inhibition by calsequestrin could be eliminated by conformational changes associated with an increased [Ca2+]SR. This and other mechanisms are summarized graphically in Fig. 16.
A Low Affinity Mg2+ Site Determines Spark Frequency in the Rat
The rat data (dark red in Fig. 14) clearly cannot be accounted for by Eq. 4 or its simplified version, Eq. 5. Qualitatively, the frequency ceases to depend on [Mg2+] at concentrations <1 or 2 mM. This cannot be fitted by Eq. 5, or by Eq. 4 with consensus parameter values.
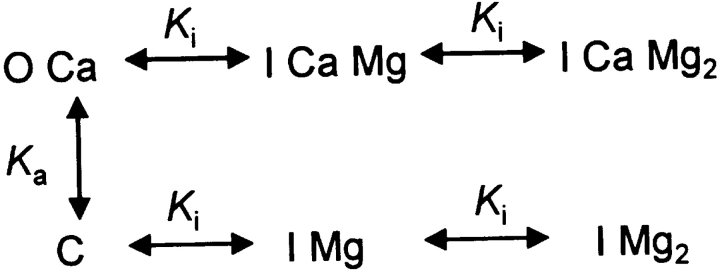
A straightforward change in the reaction scheme accounted for the difference. This is represented in Scheme 3.
Activation is still equated to transition to a bound state OCa, but there is no more competition by Mg2+. Mg2+ binds as before to site i, with low affinity, to inhibit the channel (driving it to states IMg or ICaMg). Scheme 4,
(SCHEME 4).
which assumes the possibility of binding of a second Mg2+, providing cooperativity, improves the description slightly. Solving the system of equations of Scheme 4 for OCa and using Eq. 3, the following expression for event frequency is obtained:
 |
(6) |
The continuous curve “b” in Fig. 14 represents a best fit of Eq. 6, with K Ca = 375 μM, K i = 3.1 mM, and κ = 0.025. When the simpler Scheme 3 was used, a slightly worse fit was obtained, with K Ca = 350 μM and K i = 2.1 mM. The agreement of these values of K i with the dissociation constant of the inhibitory site i (Meissner et al., 1986) identifies i as the probable Mg2+ binding site.3
By comparison with the frog, spark activity in the rat was found to be much less sensitive to activation by Ca2+ (K Ca = 375 μM instead of the 1 μM expected for site a). Strangely as well, spark activity appears to occur in spite of the occupancy of site a by Mg2+. The seemingly inescapable conclusion is that the CICR site is deeply altered in the mammal, with reduced Ca2+ affinity and inure to Mg2+.
The conclusion is consistent with a body of evidence (for review see Ríos and Zhou, 2004) of limited or no involvement of CICR in mammalian muscle. The functional evidence includes the paucity of Ca2+ sparks in rats in conditions that elicit them abundantly in the amphibian (Shirokova et al., 1998), the smaller size in the rat of the peak of Ca2+ release elicited by voltage clamp (Shirokova et al., 1996), and the absence in the rat of voltage dependence of the ratio peak/steady release flux, which in the frog is steep and appears to reflect CICR. Additionally, there are clear differences in the ability of directly applied Ca2+ to induce release in skinned mammalian fibers (for review see Lamb, 2000). Finally, CICR should, under some conditions, result in wave-like propagation of channel opening. Indeed, as reported by Brum et al. (2000) and shown in Fig. 9, Ca2+ sparks may propagate in space, doing so at velocities close to those predicted by CICR models (Stern et al., 1997, 1999) and those of the CICR-driven Ca2+ waves of cardiac muscle (Lukyanenko and Györke, 1999). After examining thousands of sparks, we did not find propagating ones in rat muscle (Zhou et al., 2003a and the present work).
The functional evidence of differences is consistent with the presence in frog muscle of two isoforms of the RyR. Indeed, the parajunctional arrays of RyR3 or β have been proposed as structural basis of the functional differences and main effectors of CICR (Ríos and Zhou, 2004). In this view, these channels would underlie spontaneous and voltage-evoked Ca2+ sparks, making a major contribution to the peak of Ca2+ release, as well as other manifestations of CICR, including propagating sparks. Because of intrinsic properties or tissue-specific interactions, RyR1 would be much less able to participate in these manifestations of CICR, remaining largely under control of the voltage sensors.
The control actions discussed above are illustrated schematically in Fig. 16 (top). Action I is the excitatory effect of the voltage sensors on the (junctional, RyR1) channels. Action II is the promotion of channel opening by Ca2+. III is the inhibition/inactivation by binding to site i. IV is the basal inhibition evidenced here by the low frequency of spontaneous sparks and the failure to respond to photoreleased Ca2+, an effect possibly mediated by interactions in situ with intra-SR proteins like calsequestrin and triadin. The promotion of activity by intra-SR Ca2+ could be a relief from this inhibition upon binding to sites c. High [Ca2+]SR will also increase unitary current, which feeds back on the cytosolic sites upon channel opening. For some of these effects, apparent dissociation constants were derived, and are listed in the bottom panel of Fig. 16. Because high affinity parameters of the activation site were consistent with the properties of the activation site in the frog only, they are attributed to RyR3, present only in the frog. The values derived in the rat experiments are tentatively assigned to RyR1 and, as stated before, are inconsistent with a significant role of CICR in mammalian muscle.
Acknowledgments
We are grateful to Drs. Clara Franzini-Armstrong (University of Pennsylvania) and Gerhard Meissner (University of North Carolina at Chapel Hill) for help in the estimation of RyR density.
This work was supported by grants-in-aid AR049184 and AR32808 from the United States Public Health Service National Institute of Arthritis and Musculoskeletal and Skin Diseases. B.S. Launikonis was the recipient of a C.J. Martin Fellowship of the National Health and Medical Research Council, Australia.
Olaf S. Andersen served as editor.
Footnotes
This figure, derived from stereology of EM images, is substantially different from in vivo estimates by Launikonis and Stephenson (2002). They are used here for consistency, because the information regarding T tubule cross-sectional area was obtained from EM images as well (Peachey, 1965).
The dwell times of single RyRs opening in situ, equated to the rise times of “q = 1” or single channel sparks, were shown by Wang et al. (2004) to be distributed exponentially, with τ = 11.6 ms, in rat ventricular myocytes. In multichannel sparks, the rise time remained close to this value. By analogy, here we assume the mean open time to be equal to the average rise time, or 5 ms.
The parameters κ and K Ca are dependent, as at low [Ca2+] the rhs of Eq. 4 depends on their product only. K i instead can be fitted independently of κ.
References
- Anderson, K., A.H. Cohn, and G. Meissner. 1994. High-affinity [3H]PN200-110 and [3H]ryanodine binding to rabbit and frog skeletal muscle. Am. J. Physiol. 266:C462–C466. [DOI] [PubMed] [Google Scholar]
- Block, B.A., T. Imagawa, K.P. Campbell, and C. Franzini-Armstrong. 1988. Structural evidences for direct interaction between the molecular components of the transverse tubule/sarcoplasmic reticulum junction in skeletal muscle. J. Cell Biol. 107:2587–2600. [DOI] [PMC free article] [PubMed] [Google Scholar]
- Brum, G., A. González, J. Rengifo, N. Shirokova, and E. Ríos. 2000. Fast imaging in two dimensions resolves extensive sources of Ca2+ sparks in frog skeletal muscle. J. Physiol. 528:419–433. [DOI] [PMC free article] [PubMed] [Google Scholar]
- Brum, G., N. Piriz, R. De Armas, E. Ríos, M.D. Stern, and G. Pizarro. 2003. Differential effects of voltage-dependent inactivation and local anesthetics on kinetic phases of Ca2+ release in frog skeletal muscle. Biophys. J. 85:245–254. [DOI] [PMC free article] [PubMed] [Google Scholar]
- Brum, G., J. Zhou, B. Launikonis, and E. Ríos. 2004. Differences in regulation of Ca2+ sparks by Mg2+ in mammals and amphibians may reflect different RyR isoform arrangement. Biophys. J. 86:577a. [Google Scholar]
- Cheng, H., L.S. Song, N. Shirokova, A. González, E.G. Lakatta, E. Ríos, and M.D. Stern. 1999. Amplitude distribution of calcium sparks in confocal images. Theory and studies with an automatic detection method. Biophys. J. 76:606–617. [DOI] [PMC free article] [PubMed] [Google Scholar]
- Csernoch, L., V. Jacquemond, and M.F. Schneider. 1993. Microinjection of strong calcium buffers suppresses the peak of calcium release during depolarization in frog skeletal muscle fibers. J. Gen. Physiol. 101:297–333. [DOI] [PMC free article] [PubMed] [Google Scholar]
- Csernoch, L., J. Zhou, M.D. Stern, G. Brum, and E. Ríos. 2004. The elementary events of Ca2+ release elicited by membrane depolarization in mammalian muscle. J. Physiol. 557:43–58. [DOI] [PMC free article] [PubMed] [Google Scholar]
- Ellis-Davies, G.C., and J.H. Kaplan. 1994. Nitrophenyl-EGTA, a photolabile chelator that selectively binds Ca2+ with high affinity and releases it rapidly upon photolysis. Proc. Natl. Acad. Sci. USA. 91:187–191. [DOI] [PMC free article] [PubMed] [Google Scholar]
- Ellis-Davies, G.C., J.H. Kaplan, and R.J. Barsotti. 1996. Laser photolysis of caged calcium: rates of calcium release by nitrophenyl-EGTA and DM-nitrophen. Biophys. J. 70:1006–1016. [DOI] [PMC free article] [PubMed] [Google Scholar]
- Endo, M. 1975. Conditions required for calcium-induced release of calcium from the sarcoplasmic reticulum. Proc. Jpn. Acad. 51:467–472. [Google Scholar]
- Endo, M. 1977. Calcium release form the sarcoplasmic reticulum. Physiol. Rev. 57:71–108. [DOI] [PubMed] [Google Scholar]
- Felder, E., and C. Franzini-Armstrong. 2002. Type 3 ryanodine receptors of skeletal muscle are segregated in a parajunctional position. Proc. Natl. Acad. Sci. USA. 99:1695–1700. [DOI] [PMC free article] [PubMed] [Google Scholar]
- Franzini-Armstrong, C., F. Protasi, and V. Ramesh. 1999. Shape, size, and distribution of Ca2+ release units and couplons in skeletal and cardiac muscles. Biophys. J. 77:1528–1539. [DOI] [PMC free article] [PubMed] [Google Scholar]
- González, A., and E. Ríos. 1993. Perchlorate enhances transmission in skeletal muscle excitation–contraction coupling. J. Gen. Physiol. 102:373–421. [DOI] [PMC free article] [PubMed] [Google Scholar]
- González, A., W.G. Kirsch, N. Shirokova, G. Pizarro, M.D. Stern, and E. Ríos. 2000. The spark and its ember: separately gated local components of Ca2+ release in skeletal muscle. J. Gen. Physiol. 115:139–158. [DOI] [PMC free article] [PubMed] [Google Scholar]
- Györke, I., N. Hester, L.R. Jones, and S. Györke. 2004. The role of calsequestrin, triadin, and junctin in conferring cardiac ryanodine receptor responsiveness to luminal calcium. Biophys. J. 86:2121–2128. [DOI] [PMC free article] [PubMed] [Google Scholar]
- Györke, S., I. Györke, V. Lukyanenko, D. Terentyev, S. Viatchenko-Karpinski, and T.F. Wiesner. 2002. Regulation of sarcoplasmic reticulum calcium release by luminal calcium in cardiac muscle. Front. Biosci. 7:d1454–d1463. [DOI] [PubMed] [Google Scholar]
- Hidalgo, C., and P. Donoso. 1995. Luminal calcium regulation of calcium release from sarcoplasmic reticulum. Biosci. Rep. 15:387–397. [DOI] [PubMed] [Google Scholar]
- Ikemoto, N., M. Ronjat, L.G. Meszaros, and M. Koshita. 1989. Postulated role of calsequestrin in the regulation of calcium release from sarcoplasmic reticulum. Biochemistry. 28:6764–6771. [DOI] [PubMed] [Google Scholar]
- Jacquemond, V., L. Csernoch, M.G. Klein, and M.F. Schneider. 1991. Voltage-gated and calcium-gated calcium release during depolarization of skeletal muscle fibers. Biophys. J. 60:867–873. [DOI] [PMC free article] [PubMed] [Google Scholar]
- Jong, D.S., P.C. Pape, W.K. Chandler, and S.M. Baylor. 1993. Reduction of calcium inactivation of sarcoplasmic reticulum calcium release by fura-2 in voltage-clamped cut twitch fibers from frog muscle. J. Gen. Physiol. 102:333–370. [DOI] [PMC free article] [PubMed] [Google Scholar]
- Kirsch, W.G., D. Uttenweiler, and R.H. Fink. 2001. Spark- and ember-like elementary Ca2+ release events in skinned fibres of adult mammalian skeletal muscle. J. Physiol. 537:379–389. [DOI] [PMC free article] [PubMed] [Google Scholar]
- Klein, M.G., H. Cheng, L.F. Santana, Y.H. Jiang, W.J. Lederer, and M.F. Schneider. 1996. Two mechanisms of quantized calcium release in skeletal muscle. Nature. 379:455–458. [DOI] [PubMed] [Google Scholar]
- Kovacs, L., E. Rios, and M.F. Schneider. 1983. Measurement and modification of free calcium transients in frog skeletal muscle fibres by a metallochromic indicator dye. J. Physiol. 343:161–196. [DOI] [PMC free article] [PubMed] [Google Scholar]
- Lacampagne, A., M.G. Klein, and M.F. Schneider. 1998. Modulation of the frequency of spontaneous sarcoplasmic reticulum Ca2+ release events (Ca2+ sparks) by myoplasmic [Mg2+] in frog skeletal muscle. J. Gen. Physiol. 111:207–224. [DOI] [PMC free article] [PubMed] [Google Scholar]
- Lamb, G.D. 2000. Excitation-contraction coupling in skeletal muscle: comparisons with cardiac muscle. Clin. Exp. Pharmacol. Physiol. 27:216–224. [DOI] [PubMed] [Google Scholar]
- Launikonis, B.S., and D.G. Stephenson. 1997. Effect of saponin treatment on the sarcoplasmic reticulum of rat, cane toad and crustacean (yabby) skeletal muscle. J. Physiol. 504:425–437. [DOI] [PMC free article] [PubMed] [Google Scholar]
- Launikonis, B.S., and D.G. Stephenson. 2002. Tubular system volume changes in twitch fibres from toad and rat skeletal muscle assessed by confocal microscopy. J. Physiol. 538:607–618. [DOI] [PMC free article] [PubMed] [Google Scholar]
- Laver, D.R., T.M. Baynes, and A.F. Dulhunty. 1997. Magnesium inhibition of ryanodine-receptor calcium channels: evidence for two independent mechanisms. J. Membr. Biol. 156:213–229. [DOI] [PubMed] [Google Scholar]
- Lukyanenko, V., and S. Györke. 1999. Ca2+ sparks and Ca2+ waves in saponin-permeabilized rat ventricular myocytes. J. Physiol. 521:575–585. [DOI] [PMC free article] [PubMed] [Google Scholar]
- Marx, S.O., K. Ondrias, and A.R. Marks. 1998. Coupled gating between individual skeletal muscle Ca2+ release channels (ryanodine receptors). Science. 281:818–821. [DOI] [PubMed] [Google Scholar]
- Meissner, G. 1994. Ryanodine receptor/Ca2+ release channels and their regulation by endogenous effectors. Annu. Rev. Physiol. 56:485–508. [DOI] [PubMed] [Google Scholar]
- Meissner, G., E. Darling, and J. Eveleth. 1986. Kinetics of rapid Ca2+ release by sarcoplasmic reticulum. Effects of Ca2+, Mg2+, and adenine nucleotides. Biochemistry. 25:236–244. [DOI] [PubMed] [Google Scholar]
- Mobley, B.A., and B.R. Eisenberg. 1975. Sizes of components in frog skeletal muscle measured by methods of stereology. J. Gen. Physiol. 66:31–45. [DOI] [PMC free article] [PubMed] [Google Scholar]
- Ogawa, Y., N. Kurebayashi, and T. Murayama. 1999. Ryanodine receptor isoforms in excitation-contraction coupling. Adv. Biophys. 36:27–64. [DOI] [PubMed] [Google Scholar]
- Pape, P.C., D.S. Jong, W.K. Chandler, and S.M. Baylor. 1993. Effect of fura-2 on action potential-stimulated calcium release in cut twitch fibers from frog muscle. J. Gen. Physiol. 102:295–332. [DOI] [PMC free article] [PubMed] [Google Scholar]
- Peachey, L.D. 1965. Transverse tubules in excitation-contraction coupling. Fed. Proc. 24:1124–1134. [PubMed] [Google Scholar]
- Pizarro, G., and E. Ríos. 2004. How source content determines intracellular Ca2+ release kinetics. Simultaneous measurement of [Ca2+] transients and [H+] displacement in skeletal muscle. J. Gen. Physiol. 124:239–258. [DOI] [PMC free article] [PubMed] [Google Scholar]
- Ríos, E., and G. Pizarro. 1988. The voltage sensors and calcium channels of excitation-contraction coupling. News Physiol. Sci. 3:223–228. [Google Scholar]
- Ríos, E., and J. Zhou. 2004. Control of dual isoforms of Ca2+ release channels in muscle. Biol. Res. In press. [DOI] [PubMed] [Google Scholar]
- Ríos, E., M.D. Stern, A. González, G. Pizarro, and N. Shirokova. 1999. Calcium release flux underlying Ca2+ sparks of frog skeletal muscle. J. Gen. Physiol. 114:31–48. [DOI] [PMC free article] [PubMed] [Google Scholar]
- Ríos, E., N. Shirokova, W.G. Kirsch, G. Pizarro, M.D. Stern, H. Cheng, and A. González. 2001. A preferred amplitude of calcium sparks in skeletal muscle. Biophys. J. 80:169–183. [DOI] [PMC free article] [PubMed] [Google Scholar]
- Rome, L.C., D.A. Syme, S. Hollingworth, S.L. Lindstedt, and S.M. Baylor. 1996. The whistle and the rattle: the design of sound producing muscles. Proc. Natl. Acad. Sci. USA. 93:8095–8100. [DOI] [PMC free article] [PubMed] [Google Scholar]
- Schiefer, A., G. Meissner, and G. Isenberg. 1995. Ca2+ activation and Ca2+ inactivation of canine reconstituted cardiac sarcoplasmic reticulum Ca2+ release channels. J. Physiol. 489:337–348. [DOI] [PMC free article] [PubMed] [Google Scholar]
- Shannon, T.R., K.S. Ginsburg, and D.M. Bers. 2000. Potentiation of fractional sarcoplasmic reticulum calcium release by total and free intra-sarcoplasmic reticulum calcium concentration. Biophys. J. 78:334–343. [DOI] [PMC free article] [PubMed] [Google Scholar]
- Shirokova, N., and E. Ríos. 1996. Activation of Ca2+ release by caffeine and voltage in frog skeletal muscle. J. Physiol. 493:317–339. [DOI] [PMC free article] [PubMed] [Google Scholar]
- Shirokova, N., J. Garcia, G. Pizarro, and E. Ríos. 1996. Ca2+ release from the sarcoplasmic reticulum compared in amphibian and mammalian skeletal muscle. J. Gen. Physiol. 107:1–18. [DOI] [PMC free article] [PubMed] [Google Scholar]
- Shirokova, N., J. Garcia, and E. Ríos. 1998. Local calcium release in mammalian skeletal muscle. J. Physiol. 512:377–384. [DOI] [PMC free article] [PubMed] [Google Scholar]
- Shirokova, N., R. Shirokov, D. Rossi, A. González, W.G. Kirsch, J. Garcia, V. Sorrentino, and E. Ríos. 1999. Spatially segregated control of Ca2+ release in developing skeletal muscle of mice. J. Physiol. 521:483–495. [DOI] [PMC free article] [PubMed] [Google Scholar]
- Stern, M.D., G. Pizarro, and E. Ríos. 1997. Local control model of excitation–contraction coupling in skeletal muscle. J. Gen. Physiol. 110:415–440. [DOI] [PMC free article] [PubMed] [Google Scholar]
- Stern, M.D., L.S. Song, H. Cheng, J.S. Sham, H.T. Yang, K.R. Boheler, and E. Ríos. 1999. Local control models of cardiac excitation–contraction coupling. A possible role for allosteric interactions between ryanodine receptors. J. Gen. Physiol. 113:469–489. [DOI] [PMC free article] [PubMed] [Google Scholar]
- Sutko, J.L., and J.A. Airey. 1996. Ryanodine receptor Ca2+ release channels: does diversity in form equal diversity in function? Physiol. Rev. 76:1027–1071. [DOI] [PubMed] [Google Scholar]
- Trafford, A.W., M.E. Díaz, G.C. Sibbring, and D.A. Eisner. 2000. Modulation of CICR has no maintained effect on systolic Ca2+: simultaneous measurements of sarcoplasmic reticulum and sarcolemmal Ca2+ fluxes in rat ventricular myocytes. J. Physiol. 522:259–270. [DOI] [PMC free article] [PubMed] [Google Scholar]
- Wang, S.Q., M.D. Stern, E. Ríos, and H. Cheng. 2004. The quantal nature of Ca2+ sparks and in situ operation of the ryanodine receptor array in cardiac cells. Proc. Natl. Acad. Sci. USA. 101:3979–3984. [DOI] [PMC free article] [PubMed] [Google Scholar]
- Ward, C.W., F. Protasi, D. Castillo, Y. Wang, S.R. Chen, I.N. Pessah, P.D. Allen, and M.F. Schneider. 2001. Type 1 and type 3 ryanodine receptors generate different Ca2+ release event activity in both intact and permeabilized myotubes. Biophys. J. 81:3216–3230. [DOI] [PMC free article] [PubMed] [Google Scholar]
- Zahradníková, A., I. Zahradník, I. Györke, and S. Györke. 1999. Rapid activation of the cardiac ryanodine receptor by submillisecond calcium stimuli. J. Gen. Physiol. 114:787–798. [DOI] [PMC free article] [PubMed] [Google Scholar]
- Zahradníková, A., M. Dura, I. Györke, A.L. Escobar, I. Zahradnik, and S. Györke. 2003. Regulation of dynamic behavior of cardiac ryanodine receptor by Mg2+ under simulated physiological conditions. Am. J. Physiol. Cell Physiol. 285:C1059–C1070. [DOI] [PubMed] [Google Scholar]
- Zhou, J., A. González, R. Segura, E. Ríos, G. Ferreira, J. Yi, and G. Brum. 2002. Modulation by Ca2+ and Mg2+ of mammalian muscle Ca2+ sparks. Biophys. J. 82:510a. [Google Scholar]
- Zhou, J., G. Brum, A. González, B.S. Launikonis, M.D. Stern, and E. Ríos. 2003. a. Ca2+ sparks and embers of mammalian muscle. Properties of the sources. J. Gen. Physiol. 122:95–114. [DOI] [PMC free article] [PubMed] [Google Scholar]
- Zhou, J., L. Csernoch, B. Launikonis, M.D. Stern, H. Cheng, and E. Ríos. 2003. b. Concerted vs. sequential opening of vast arrays of channels in Ca sparks of twitch muscle. Biophys. J. 84:9a. [Google Scholar]
- Zhou, J., G. Brum, and E. Ríos. 2004. Dynamic imaging of SR[Ca2+] in single frog skeletal muscle fibers, by excitation- and emission-shifted ratioing of mag-indo 1 fluorescence. Biophys. J. 86:343a. [Google Scholar]
- Zoghbi, M.E., J.A. Copello, C.A. Villalba-Galea, P. Velez, P.L. Diaz Sylvester, P. Bolanos, A. Marcano, M. Fill, and A.L. Escobar. 2004. Differential Ca2+ and Sr2+ regulation of intracellular divalent cations release in ventricular myocytes. Cell Calcium. 36:119–134. [DOI] [PubMed] [Google Scholar]


