

Abstract
There is a good deal of evidence that the lens generates an internal micro circulatory system, which brings metabolites, like glucose, and antioxidants, like ascorbate, into the lens along the extracellular spaces between cells. Calcium also ought to be carried into the lens by this system. If so, the only path for Ca2+ to get out of the lens is to move down its electrochemical gradient into fiber cells, and then move by electrodiffusion from cell to cell through gap junctions to surface cells, where Ca-ATPase activity and Na/Ca exchange can transport it back into the aqueous or vitreous humors. The purpose of the present study was to test this calcium circulation hypothesis by studying calcium homeostasis in connexin (Cx46) knockout and (Cx46 for Cx50) knockin mouse lenses, which have different degrees of gap junction coupling. To measure intracellular calcium, FURA2 was injected into fiber cells, and the gradient in calcium concentration from center to surface was mapped in each type of lens. In wild-type lenses the coupling conductance of the mature fibers was ∼0.5 S/cm2 of cell to cell contact, and the best fit to the calcium concentration data varied from 700 nM in the center to 300 nM at the surface. In the knockin lenses, the coupling conductance was ∼1.0 S/cm2 and calcium varied from ∼500 nM at the center to 300 nM at the surface. Thus, when the coupling conductance doubled, the concentration gradient halved, as predicted by the model. In knockout lenses, the coupling conductance was zero, hence the efflux path was knocked out and calcium accumulated to ∼2 μM in central fibers. Knockout lenses also had a dense central cataract that extended from the center to about half the radius. Others have previously shown that this cataract involves activation of a calcium-dependent protease, Lp82. We can now expand on this finding to provide a hypothesis on each step that leads to cataract formation: knockout of Cx46 causes loss of coupling of mature fiber cells; the efflux path for calcium is therefore blocked; calcium accumulates in the central cells; at concentrations above ∼1 μM (from the center to about half way out of a 3-wk-old lens) Lp82 is activated; Lp82 cleaves cytoplasmic proteins (crystallins) in central cells; and the cleaved proteins aggregate and scatter light.
Keywords: connexin knockout, connexin knockin, intracellular calcium, gap junctions, coupling conductance
INTRODUCTION
In all animal cells, intracellular calcium is quite low, usually a few hundred nM. Transient increases to somewhat higher values of [Ca2+]i occur, but these initiate dramatic changes in a host of cellular processes, hence prolonged higher levels of [Ca2+]i are never allowed. However, all animal cell membranes have some small baseline permeability to Ca2+, thus the maintenance of low [Ca2+]i requires continuous membrane transport of Ca2+ out of cells by Ca-ATPase activity and Na/Ca exchange. The cells of the lens also need to maintain low [Ca2+]i, however the lens as an organ has some unique structural and physiological properties, which make regulation of [Ca2+]i more complicated than in other cells. At the outset, we will introduce these properties (for review see Mathias et al., 1997) and show why they have led us to speculate that Ca2+ handling in the lens is unique.
Fig. 1 A illustrates the cellular structure of a lens cut in cross section. The surface of the anterior hemisphere is covered with a layer of epithelial cells (E, red). These cells are thought to carry out essentially all of the active transmembrane transport in the lens, including the Na/K-ATPase and Ca-ATPase activity (for review see Paterson and Delamere, 2004). Nevertheless, all lens cells maintain physiologically low internal Na+, very low internal Ca2+, and typically high internal K+ (for review see Mathias et al., 1997), presumably through gap junction coupling with the epithelial cells and the circulation described below. The only cell division in the lens is within the epithelium, where the new cells are pushed toward the equator. At the equator, the epithelial cells begin to elongate and then differentiate into fiber cells (DF, green), which express a new compliment of cytoplasmic and membrane proteins. New DF are formed throughout life. At a distance 10–20% of the radius into the lens, there is another abrupt differentiation into mature fibers (MF, blue). This transition is the site where organelles are lost (Bassnett, 2002), gap junction proteins have their COOH termini cleaved (Gong et al., 1998), and gap junction plaques are significantly reorganized (Jacobs et al., 2004). These studies identified the transition as occurring at ∼10% of the distance into the lens at either pole and 20% at the equator. As the lens grows, the DF are internalized and then make the transition to MF, so this zone is always 80–90% of the lens diameter. Although the MF have no organelles and their membrane transport proteins are modified through cleavage and other processing at the DF to MF transition, they are living cells that maintain typical intracellular concentrations of ions and carry out a low level of anaerobic glycolysis for homeostasis. The purpose of this paper is to describe Ca homeostasis in the MF zone.
Figure 1.

The anatomy of the lens and its internal circulation. (A) A sketch of the anatomy of a lens cut in cross section. There are three physiologically distinct zones: the anterior epithelium (E, red), the peripheral shell of differentiating fibers (DF, green), and the central mature fibers (MF, blue). The purpose of this paper is to describe calcium homeostasis in the MF, which fill 80–90% of the lens diameter. The lens generates an internal circulation of ions and fluid, which flow in the pattern indicated by the arrows. Based on our understanding of this circulation, it is likely to ensure that there is a significant concentration of extracellular calcium in the narrow extracellular spaces between MF. (B) Our model of how the circulation is generated. The major ion carrier of the circulating current appears to be sodium, which enters the lens everywhere along the extracellular spaces between cells and then moves down its electrochemical gradient into fiber cells, where it returns to the surface via gap junctions. The pattern of gap junction coupling directs the intracellular current flow to the equator, where the equatorial epithelial cells provide the Na/K-ATPase activity to transport it out of the lens and complete the loops of flow shown in A. Both the extracellular voltage gradients and fluid flow associated with this Na circulation will bring calcium from the aqueous and vitreous into the extracellular spaces of the lens.
The lens generates an internal circulating current as shown in Fig. 1 (A and B). This current appears to be carried primarily by Na+. Na+ enters the lens extracellularly at all surface locations and flows inward along the pervading extracellular spaces. As the Na+ moves inward, it is continuously crossing into fiber cells, driven by its transmembrane electrochemical gradient. Once in the intracellular compartment, it reverses direction and flows from cell to cell via gap junctions toward the lens surface. The DF have their gap junction coupling conductance concentrated in the equatorial region, so the intracellular current is directed to the equatorial surface epithelial cells. Recent studies (Gao et al., 2000; Candia and Zamudio, 2002; Tamiya et al., 2003) have shown that Na/K-ATPase activity is highly concentrated at the equatorial surface, where it can transport the intracellular flux of Na+ out of the lens.
The circulating current appears to also represent a circulation of solute that generates water flow in the same pattern. This micro circulatory system convects glucose into the lens along the extracellular spaces to the inner MF where membrane glucose transporters are located (for review see Donaldson et al., 2001) to provide fuel for metabolism. However, the extracellular fluid flow, as well as voltage gradients associated with the current flow, will both tend to bring Ca2+ into the extracellular spaces within the lens. Since the concentration of calcium is relatively low and the flux is small, it would not significantly affect the circulation of fluid, rather it would be a consequence of it. As mentioned earlier, no membrane is totally impermeable to small ions, so some of the extracellular Ca2+ will enter the MF. Once in the intracellular compartment, Ca2+ will have to find its way back to the surface in order to be transported out of the lens. We expect that Ca2+ will circulate in the same manner as Na+ (Fig. 1 B). Our hypothesis is that Ca2+ moves into the lens along extracellular clefts then back to the surface via gap junctions. The surface cells have the Na/Ca exchange and Ca-ATPase activity (Paterson and Delamere, 2004) to transport the Ca2+ out of the lens. The unique features of this model are (a) Ca2+ is continuously circulating through the lens, and (b) gap junctions coupling the interior fiber cells to the surface cells are an essential component of Ca homeostasis.
Newly developed lens connexin knockout (KO) (Gong et al., 1997; White et al., 1998) and knockin (KI) (White, 2002) mice provide lenses in which gap junction coupling conductance between MF and the lens surface is modulated either up (in Cx46 for Cx50 KI mouse lenses; Martinez-Wittinghan et al., 2003, 2004) or down (in Cx46 knockout mouse lenses; Gong et al., 1998). These lenses therefore provide a means of testing the above model. This model predicts a gradient for diffusion of intracellular Ca2+ from the interior of the lens to the surface. In KI lenses, where MF gap junction coupling conductance is elevated relative to control lenses, intracellular Ca concentration gradients should be smaller than in control lenses; hence [Ca2+]i in the inner fiber cells should be closer to values in surface cells. Whereas, in the Cx46 knockout lenses, where the MF are totally uncoupled from surface cells, Ca homeostasis in the MF will be lost and Ca2+ will accumulate in the inner cells. The KO lenses develop a dense central cataract (Gong et al., 1997), which might be caused by this accumulation of Ca2+ (Baruch et al., 2001).
To test these predictions, we developed a new method of measuring intracellular Ca concentrations at various depths into the lens. The method is to inject the Ca indicator dye FURA2 into fiber cells at various depths and compare the ratio of fluorescence emission at the two wavelengths of excitation with calibration curves that related the ratio to intracellular calcium. However, because the lens is itself an optical element that absorbs light at the wavelengths of interest, the calibration curves changed with depth. This paper presents the results of using our new method to map intracellular Ca concentrations in intact lenses from wild-type (WT), Cx46 knockout, and Cx46 for Cx50 KI mice.
MATERIALS AND METHODS
Generation of KO/KI Mice
The generation of Cx46 KO and Cx50/Cx46 KI mice has been described previously (Gong et al., 1997; White, 2002). Genotypes of all animals were confirmed by PCR analysis of genomic DNA from tail biopsies using previously described protocols (Gong et al., 1997; White, 2002).
Isolation of Lenses
Mice (maintained in a mixed 129S4 × C57BL/6J genetic background) were killed by peritoneal injection of pentobarbital (100 mg/kg of weight). The eyes were removed and placed in a sylgard Petri dish containing normal Tyrode solution, which contained (in mM) NaCl 137.7, NaOH 2.3, KCl 5.4, CaCl2 2, MgCl2 1, HEPES 5, glucose 10, pH 7.4.
To isolate and mount the lenses from either species, the cornea and iris were removed and the optic nerve was cut. The sclera was cut into four flaps from the posterior surface and pinned to the vertical wall of a sylgard base, so that the lens was in a standing position with the posterior surface facing to the front, and the sclera out of the light path coming from the bottom of the bath and passing through the posterior half of the lens (Fig. 2 A). When viewed from above, the plane that bisects the upper and lower halves will contain fiber cells that are in the same focal plane. Dye injections into fiber cells near this plane will thus minimize scatter from out of focus fluorescence. The dish with the lens in normal Tyrode solution was mounted on the stage of a fluorescent microscope for measurements of [Ca2+]i. All experiments were conducted on freshly dissected lenses.
Figure 2.

The method of generating depth-dependent calibration curves within an intact lens. The data in this figure are from WT mouse lenses, but the other types of lenses studied were treated in the same manner. (A) The method of mounting the lens. For all studies, the lens is mounted in a standing position so that injections of FURA2 can be made as close as possible to the plane of parfocal fibers, and thus reduce out of focus fluorescence. However, before injections were attempted, we realized that depth-dependent calibration curves were required, since when an electrode containing FURA2 was inserted into the lens and fluorescence was stimulated by excitation at the typical wavelength (340 nm) for studies of internal calcium, the electrode simply vanished. By trial and error, we determined that using 360-nm excitation instead of 340 nm allowed us to visualize the fluorescence emission as well as estimate internal calcium. (B) A picture of fluorescence emission from a microelectrode containing FURA2 inserted into a lens and excited with 360- and 380-nm light. Clearly emission can be recorded with either wavelength of excitation, but what is not as apparent is that emission varies with depth into the lens. At the bottom of the picture, we have shown seven zones. Emission was averaged in each zone, and the ratio at 360- to 380-nm excitation was recorded for microelectrodes containing various concentrations of calcium. (C) A graph of the average ratio as a function of the zone of depth into the lens. Each curve is the mean ± SD for five to six lenses/pipets containing the indicated concentration of calcium. (D) The same data as in C, but with the ratio at each zone of depth plotted as a function of pipette calcium. To within the accuracy of these data, the dissociation constant, Kd, for calcium with FURA2 was ∼320 nM at all depths, whereas the maximum values of the ratios varied considerably with depth.
Isolation of Lens Fiber Vesicles
Lenses were obtained by following the same procedures as described above. As described in Varadaraj et al. (1999), clumps of fibers were peeled from the lens and transferred into a 2-ml centrifuge tube containing Tyrode solution. Large, right side out vesicles bud off the fibers when they are gently triturated in the centrifuge tube. The environment within these vesicles is probably similar to fiber cell cytoplasm, since the vesicles retain the enzyme to cleave FURA2-AM to FURA2.
Generation of Calibration Curves
The lens is an optical element with its own absorption spectrum, which unfortunately absorbs almost all light at one of the optimum Ca imaging wavelengths of 340 nm. Through trial and error we determined that using excitation wavelengths of 360 and 380 nm allowed detectable signals that were Ca concentration dependent. However, because the lens absorbs some of the light at these wavelengths, calibration changed with depth into the lens. To obtain depth-dependent calibration curves, we inserted long sharp glass pipettes into the center of lenses. These pipettes were filled with a Ca2+ buffer solution containing (in mM) KCl 100, MOPS 30, K2EGTA 10, CaEGTA 1–10, pH 7.2 (Molecular Probes). The resulting solutions had known free [Ca2+] ranging from 17 nM to 39.8 μM, plus 2–5 μM FURA2. Images of the pipettes were acquired with excitation at wavelengths 360 and 380 nm (Fig. 2 B). We divided the distance from the surface of the lens to its center into seven equal length sections. The ratio of pipette fluorescence when excitation was 360 nm to that when excitation was 380 nm was determined in each section for pipettes containing different [Ca2+] (Fig. 2 C). Then, ratios versus [Ca2+] were graphed and fit with Eq. 1 (Fig. 2 D).
 |
(1) |
where R is the ratio of pipette fluorescence, R min and R max are the minimum and maximum values of R, and Kd is the effective disassociation constant for the binding of Ca2+ with FURA2. The best fit values of Kd were, to within the accuracy of the data, the same at all depths, ranging from 220 to 340 nM with an average value of 320 nM (pCa = 6.5), whereas the values of R max were generally reduced at greater depths, but not in exactly a linear progression.
Relative values of [Ca2+]i within a lens should be accurately determined by these calibration curves, but the absolute value of [Ca2+]i determined with these calibration curves may be somewhat lower than actual, owing to interactions of the dye with intracellular molecules. However, we cannot do intracellular calibration curves in intact lenses. We therefore isolated mouse lens fiber cell membrane vesicles as described above. We constructed calibration curves from these vesicles by incubating them for 40 min with FURA2-AM plus the Ca2+-ionophore A23187 and known values of bath [Ca2+]. Once again, images were acquired (Fig. 3 A shows mouse lens fiber cell membrane vesicles). The ratios were determined in different [Ca2+]i (Fig. 3 B shows calibration in mouse lens fiber cell membrane vesicles). To control for possible effects of Ca2+ transport by the Na/Ca exchanger, we repeated the 150 nM [Ca2+] point in the presence of 1 mM Cd2+, which should inhibit most Na/Ca exchange activity. The open circle and triangle represent the comparison of control and Cd2+ data respectively from this experiment. There is no significant deviation from the original curve, suggesting that Na/Ca exchange was not active in these vesicles. The Kd for Ca binding with FURA2 in mouse lens vesicles was 670 nM, which was 0.32 pCa units higher than in the pipette. The depth-dependent calibration curves were therefore shifted to the right by 0.32 pCa units according to the calibration curve obtained from the vesicles.
Figure 3.
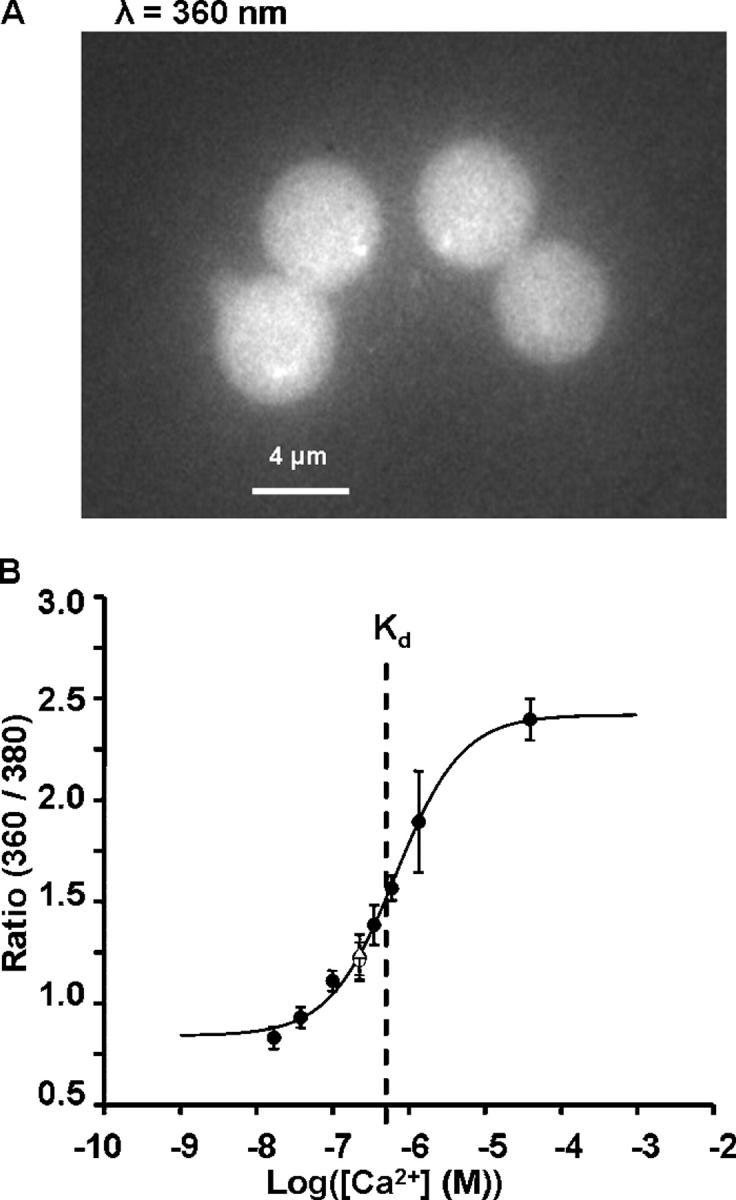
Calibration curves measured in fiber cell membrane vesicles. (A) A picture of typical vesicles fluorescing with excitation at 360 nm. These are large, right side out vesicles, which spontaneously bud off of clumps of fiber cells that were teased from WT mouse lenses. They were loaded with FURA2 by incubating them in solution containing FURA2-AM, which is cleaved in the vesicle to FURA2. The fact that the intracellular esterases, which cleave the FURA2-AM to FURA2, were present in these vesicles suggests that other cytoplasmic constituents might also be present. This is important because we were interested in determining the effects of cytoplasmic constituents on the binding of FURA2 to free calcium, since the calibration curves shown in Fig. 2 D were measured in buffer solution. (B) The intravesicular calibration curve. FURA2 was loaded as described above. Intravesicular calcium was controlled by incubating the vesicles in solution containing the calcium ionophore A23187 plus known values of [Ca2+]. As in other cells, the Kd for FURA2 binding with calcium is shifted ∼0.3 pCa units to the right in the intracellular-like environment. Thus, our best estimates of calibration curves were those shown in Fig. 2 D but with their value of Kd shifted by 0.3 pCa units to the right.
The accuracy of this method depends on how constant the Kd is at the different depths in the lens. These lenses were so small that it was not possible to obtain vesicles from different depths to test this possibility. In larger lenses, there are gradients in protein concentration from surface to center (Magid et al., 1992), and this could conceivably affect the Kd. However, once again because of the smallness of the mouse lenses, protein gradients have not been detected. This suggests that effects, if any, should be small. Moreover, the effect of lens cytoplasm on the Kd was typical of what has been reported for other cell types. For example, Haworth and Redon (1998) reported that the cytoplasm of heart cells shifted the Kd of FURA2 by 0.34 pCa units to the right when compared with the value in buffer solution. The internal protein composition of heart cells is quite different from that of lens fiber cells, yet they both had the same effect on the Kd for FURA2, suggesting that Kd is not very sensitive to the specific cellular environment. Moreover, in developing this technique, we first used frog lens, and the calibration curve for FURA2 in vesicles from frog lens had the same Kd as the data shown in Fig. 3 B, even though the concentrations of all ions are somewhat lower in the amphibian lenses. In summary, there is a possibility that the Kd depends on depth into the lens, but there are reasons to think this effect would be small. Nevertheless, we cannot test this possibility, so it cannot be dismissed.
Measurements of [Ca2+]i Within the Lens
We injected a small volume of 2 mM FURA2 solution into the fiber cells at different depths into the lens. FURA2 was dissolved in the pipette solution containing (in mM) K-Aspartic Acid 83, KCl 17, NaCH3OSO3 10, and HEPES 5. The pH was 6.9 adjusted with KOH. The images were acquired, the ratios calculated, and these ratios were converted into [Ca2+]i with the Ca2+ calibration curve from the appropriate depth.
Since FURA2 must bind with Ca2+ in order to provide the Ca-dependent fluorescent signal, it can potentially act as a local buffer, which could alter the local Ca concentration. The lens provided an opportunity to control for this potential artifact. As shown in results (Fig. 5 A), the FURA2 diffused a significant distance from the site of injection along the axes of the fiber cells, creating a concentration gradient with the highest concentration of FURA2 just adjacent to the pipette, and the concentration going to zero as one looked more distal to the injection site along the axes of the fibers. We exploited this concentration gradient to determine if the FURA2 ratio method gave different values proximal to the site of injection, where the concentration was highest, and distal to the injection, where the concentration was significantly less. We do not know the actual concentrations of FURA2, but based on the reduction in fluorescence intensity, the concentration at the distal site was 0.62 ± 0.05 of its proximal value. The ratio was 1.657 ± 0.087 at the proximal site and 1.665 ± 0.080 at the distal site (n = 11), so there was no significant difference in the Ca concentrations at the two sites, even though the FURA2 concentrations were significantly different. This control suggests that the small amount of FURA2 we injected into the fiber cells did not significantly alter the Ca concentration.
Figure 5.
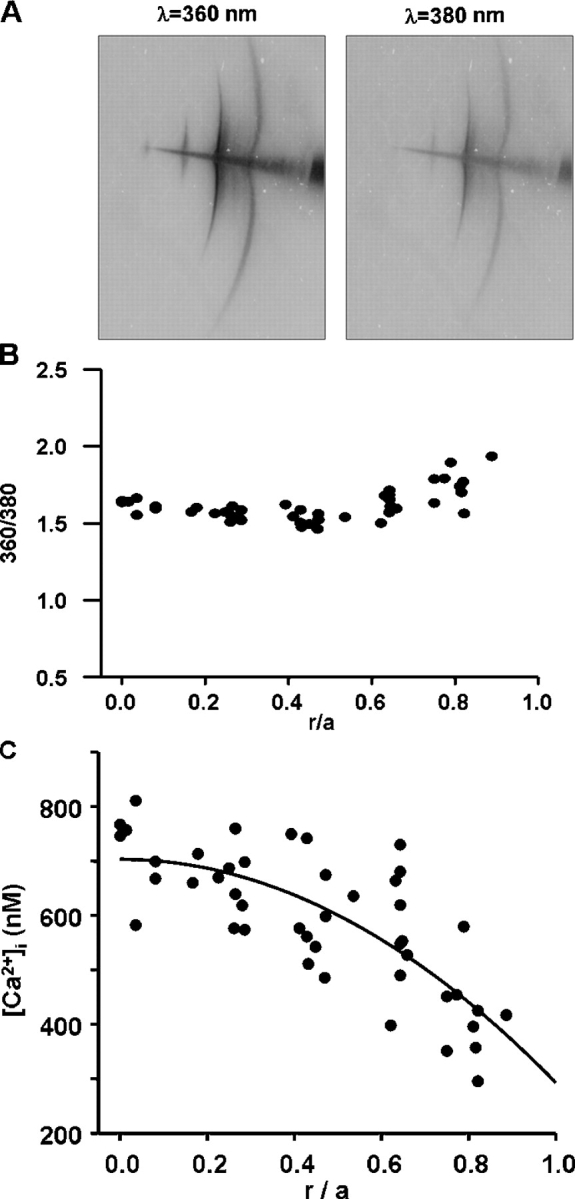
The various steps involved in determining intracellular calcium in a lens. (A) An original image of FURA2 fluorescence in a WT mouse lens. A microelectrode containing FURA2 was advanced into the lens, with the outermost injection site being 100–200 μm beneath the surface, where the electrode popped through the capsule. FURA2 was first injected at the outer site. We waited for diffusion to slow to an imperceptible rate, then we excited the dye at 360 and 380 nm and recorded emission. The electrode was then advanced into the lens to the next site of injection and the procedure repeated. In a single lens, we generally obtained data at three to five depths. The procedure was repeated in 12 lenses to obtain the data shown in B. (B) The ratio of fluorescence emission at 360 nm excitation to that at 380 nm, graphed as a function of distance from the lens center. The distance of the site of injection from the lens center was r (cm) and the radius of the lens was a (cm). The ratios are graphed as a function of normalized distance (r/a) from the lens center. The data shown are from WT mouse lenses, but data from other types of lenses had similar scatter. (C) A scatter plot of calcium as a function of distance from the lens center. The data were pooled from 12 mouse lenses, each contributing three to five locations.
Immunostaining
Postnatal day 7 eyes were dissected, cut open at the posterior pole, fixed in 4% formaldehyde in PBS overnight, rinsed in PBS, and dehydrated through an ethanol series. Eyes were cleared in xylene and embedded in paraffin. Paraffin sections (2–3 μm) were cut on a 0.5-cm diamond knife, floated on water, and dried onto Superfrost Plus slides overnight at 37°C. Sections were deparaffinized, rehydrated, and blocked with 3% BSA in PBS. Sections were stained with rabbit antisera against Cx46, diluted in 3% BSA in PBS, and washed with PBS. Primary antisera were visualized with a Cy3-conjugated goat anti-rabbit antibody (Jackson ImmunoResearch) and photographed on an Olympus BX51 microscope using an Optronics MagnaFire digital camera.
Theory
We have generated a simple model that evaluates intracellular Ca diffusion under the assumption that the value of the inward transmembrane Ca flux (j Ca moles/cm2/s) is constant with depth into the lens. The effective intracellular diffusion coefficient for Ca2+ (D Ca cm2/s) is not known, but it should be proportional to gap junction coupling, which we measure; hence we can predict changes in D Ca. The intracellular Ca flux is given by the effective diffusion coefficient times the Ca concentration gradient. Eq. 2 is simply a statement in spherical geometry that the change in Ca flux per unit distance from the lens center equals the transmembrane flux.
 |
(2) |
where the distance from the lens center is r (cm), the lens radius is a (cm), and the surface of membrane per volume of tissue is Sm/VT (cm−1). To solve Eq. 2, two boundary conditions are required. The first is that the Ca flux is zero at r = 0. The second is at r = a, where the Ca flux depends on Ca-ATPase and Na/Ca exchange activity. These relationships are not known, but we can write the solution in terms of the [Ca2+]i(a), which is experimentally measured. If we define the change in Ca concentration between r = a and r = 0 as Δ[Ca2+]i, then the solution to Eq. 2 is
 |
(3) |
 |
For a constant value of j Ca, Δ[Ca2+]i will increase with lens size in proportion to the radius squared, whereas increases in the effective diffusion coefficient are predicted to cause a proportional decrease in Δ[Ca2+]i. We do not have experimental estimates of either j Ca or D Ca, but the latter should scale with the number of gap junction channels, and hence with total coupling conductance. Thus most of our uncertainty about absolute values can be removed by considering the ratio of Δ[Ca2+]i measured in WT and KI lenses. Curve fits of Eq. 3 to the data on [Ca2+]i were done using Sigma Plot, 2000 (SPSS Inc.).
Limitations of the Model
The model presented in Eqs. 2 and 3 was designed to be as simple as possible, yet capture the essential factors governing Ca homeostasis in the lens. This model assumes that intracellular Ca fluxes are driven entirely by diffusion, whereas mobile cations in the lens move by a combination of diffusion, conduction, and convection. If one estimates the contribution of each, convection is negligible. On the other hand, the measured intracellular voltage gradient (for examples in mouse lenses see Gong et al., 1998; Baldo et al., 2001) is expected to drive a component of the Ca flux that is comparable to that driven by diffusion, but for simplicity, we have ignored this component. The major limitation is the lack of consideration of intracellular calcium buffers, some of which could be mobile and shuttle Ca2+ from interior MF to surface cells. Such a mobile buffer would have to permeate gap junction channels, so known buffers like calmodulin would not work. But if such mobile buffers exist, they could carry far larger calcium fluxes than those due to diffusion or conduction of free calcium. There is no way to include this level of complexity in the present calculations. We conclude that j Ca in the model in Eq. 3 is a somewhat nebulous parameter that refers to the average fraction of membrane calcium flux that is associated with diffusion of free intracellular calcium.
Use of the Model
The model provides the expected shape of the diffusion gradient in spherical coordinates, and this can be compared with the data. It also provides a mechanism to quantify the average concentration gradient based on data from multiple lenses. Lastly, it predicts the dependence of the diffusion gradient on lens size and coupling conductance, both of which differ between WT and KI lenses, so it facilitates comparison.
RESULTS
Types of Lenses Studied
Fig. 4 contains representative photographs of the three types of lenses studied. WT mouse lenses shown in Fig. 4 A had an average radius of a = 0.103 ± 0.003 cm. The mouse lenses in which Cx46 was knocked out (KO shown in Fig. 4 B) were the same size as WT, but they had a dense central cataract (Gong et al., 1997). Baruch et al. (2001) found that this cataract is associated with increases in total lens Ca2+, and activation of the Ca-dependent, lens-specific protease Lp82. Lp82 appears to degrade γ-crystallins, allowing them to aggregate and scatter light. Fig. 6 of this paper presents a model of how the central cataract could be related to KO of Cx46, causing a large Ca concentration increase with depth into the KO lenses. In the KI lenses shown in Fig. 4 C, the Cx50 coding region has been replaced with the amino acid sequence for Cx46; hence these lenses express four copies of Cx46 and no copies of Cx50 (White, 2002). These lenses are as transparent as the control lenses, however they have a growth defect (White, 2002; Gerido et al., 2003). This group of KI lenses was slightly smaller than WT with an average radius of a = 0.09 ± 0.003 cm.
Figure 4.

A comparison of the three types of lenses studied. (A) WT mouse lens. (B) KO mouse lens. (C) KI mouse lens. The most notable difference is that the KO mouse lens has a dense central cataract beginning about half way into the lens.
Figure 6.

Gap junction coupling and its expected effect on Ca handling. (A) A comparison of gap junction coupling conductance recorded in the MF of KO, WT, and KI mouse lenses. The KO data are from Gong et al. (1998). The WT and KI data are from Martinez-Wittinghan et al. (2004). Based on the model in B, these different values of gap junction coupling conductance are expected to lead to the differences in intracellular calcium shown in the next figure. (B) A model of calcium handling in the lens. Calcium moves into the lens along the extracellular spaces, crosses into fiber cells down its electrochemical gradient, and then moves back to the surface by diffusion through gap junctions. This model is quantitatively analyzed in the Theory section in materials and methods.
Measurement of [Ca2+]i
In all types of lenses studied, the data were recorded and analyzed as shown in Fig. 5 for the WT mouse lens. Fig. 5 A shows a typical pattern of injection of the Ca indicator dye FURA2. The FURA2-containing microelectrode usually popped into the lens at a distance of 100–200 μm below the surface, where the first FURA2 injection was made. After a few minutes, the pattern of diffusion slowed to an undetectable rate, and then fluorescence was recorded at 360 and 380 nm wavelength excitation, and the images were stored for future analysis. The microelectrode was then advanced into the lens and a second injection and fluorescence measurements were made. In a single lens, we typically made three to five injections at increasing depths into the lens. Data from all lenses were pooled, the ratio of fluorescence emission at 360 nm excitation to that at 380 nm excitation was calculated, and the results graphed as a function of normalized distance from the lens center (r/a), as shown in Fig. 5 B. The depth-dependent calibration curves, described in materials and methods, were used to convert the ratios to estimates of [Ca2+]i at different distances into a typical lens (Fig. 5 C).
The smooth curve is the best fit of the diffusion model (Eq. 3) to the data. The best fit value of [Ca2+]i in the WT mouse lenses shown in Fig. 5 C varied systematically from its highest value of 700 nM at the lens center to its lowest value of 300 nM at the lens surface. Thus, the Ca gradient between surface and center, Δ[Ca2+]i, was 400 nM. Since all of these cells are in communication via gap junction channels, and since gap junction channels generally have significant Ca2+ permeability (Harris, 2001), one expects that this gradient in calcium will lead to diffusion of calcium from the lens center to the surface. This hypothesis can be tested by comparing [Ca2+]i gradients in lenses that have different values of gap junction coupling conductance.
A Comparison of WT, KI, and KO Mouse Lenses
The values of coupling conductance per unit area of cell to cell contact in the MF of the three types of mouse lenses studied are shown in Fig. 6 A. The total loss of coupling in the MF of lenses from Cx46 KO mice was reported by Gong et al. (1998). This was the first indication that the functional gap junction channels in MF are made from Cx46 and that Cx50 channels are rendered nonfunctional at the DF to MF transition. The values of coupling conductance for the MF of WT and Cx46 for Cx50 KI lenses are taken from Martinez-Wittinghan et al. (2004). These data are consistent with the hypothesis that only Cx46 channels remain functional in the MF, since when Cx46 is substituted for Cx50, coupling conductance, and presumably the number of functional channels, in the MF essentially doubles. This means we are not altering the subunit composition of the MF channels, so Ca2+ selectivity should not be an issue. For the purposes of this study, the differences in the number of functional Cx46 channels in the three types of lenses provided an opportunity to study the relationship between our measured values of coupling conductance and [Ca2+]i.
Fig. 6 B illustrates our model of how coupling conductance affects Ca handling. Ca2+ moves toward the center of the lens along the extracellular spaces between cells. As it moves inward, it is continually driven by its transmembrane electrochemical gradient to enter the fiber cells. In the WT and KI lenses (top panel) there is an effective diffusion path for intracellular Ca2+ to diffuse from cell to cell via gap junctions to the surface, where the active Ca transport systems are located. However, as shown in Fig. 6 A, the conductance of that path is twice as large in KI as WT lenses. For simple diffusion, we expect that if the effective diffusion constant is doubled, the concentration gradient will be halved. In the bottom panel of Fig. 6 B we have sketched the problem for the KO lenses, where there is no diffusion path for the Ca2+ to get back to the surface. Hence, the model predicts that intracellular Ca2+ will accumulate in the central cells.
Fig. 7 shows the profiles for [Ca2+]i in lenses from the three types of mice. Fig. 7 A shows the same WT data as Fig. 5 C, but plotted on the same scale as the data from the other two types of lenses. Comparison of the WT data in A with the KI data in B illustrates a significant flattening of the concentration gradient in the KI lenses, as predicted by the model in Fig. 6 B (top). To make a quantitative comparison of these datasets, Eq. 3 was curve fitted to the WT and KI data. In either the WT or KI lenses, the best fit value of [Ca2+]i(a) is ∼300 nM, but in the WT lenses it reaches 700 nM at the lens center, whereas in the KI lenses it only reaches 470 nM. Thus, the Ca gradient, Δ[Ca2+]i, is 400 nM in WT lenses versus 170 nM in KI lenses. As suggested above, if the effective diffusion coefficient doubles, one expects the gradient to halve, which is close to what was recorded; however, the other factor is lens size, and the KI lenses were slightly smaller than WT. According to Eq. 3 of the Theory section in materials and methods, the ratio of Δ[Ca2+]i(WT)/Δ[Ca2+]i(KI) scales as the ratio of radii squared, (a 2(WT)/a 2(KI) = 1.2) and as the inverse ratio of effective diffusion coefficients (DCa(KI)/DCa(WT) = 2). So for a 400 nM gradient in WT, with all else equal, we expect the KI gradient to be 400/(1.2 × 2) = 167 nM, which is very close to the measured 170 nM. This analysis suggests that Ca handling was not different in the WT and KI lenses; rather, the differences were in the value of effective diffusion coefficient for Ca2+ and lens size.
Figure 7.

A comparison of the distribution of [Ca2+]i in the three types of lenses. In each panel, the value of [Ca2+]i is graphed as a function of normalized distance from the lens center (r/a). The raw data in each panel represent measurement of [Ca2+]i at three to five depths in 10–12 different lenses. (A) Raw data from WT lenses. The data follow the smooth curve that was generated from the diffusion model (Eq. 3) and suggest a continuous increase in [Ca2+]i with increasing depth into the lens. Such a diffusion gradient is expected to be associated with a flux of Ca2+ from the center to surface of the lens. That flux would move from cell to cell through gap junction channels connecting the MF. (B) Raw data from KI lenses. The value of [Ca2+]i at the lens surface is similar to that in WT lenses, but the increase with depth is much less. The smaller diffusion gradient is thought to reflect the higher gap junction coupling in MF of the KI lenses (see Fig. 6 A), and not a difference in Ca handling. In the text, we estimate that the Ca flux in KI and WT lenses is the same. (C) Raw data from KO lenses. The MF of these lenses lack gap junctions, hence the efflux path to the surface does not exist and [Ca2+]i accumulates without the normal homeostatic mechanism of the circulation being present. (D) An overplot of the data from the three types of lenses. The data have been binned for clarity.
The KO lens data shown in Fig. 7 C were not curve fit with our model, since the lack of MF coupling shown in Fig. 6 A suggests that there will not be cell to cell diffusion between the MF, as sketched in the bottom panel of Fig. 6 B. Thus Ca2+ is expected to enter the MF, but with no path back to the surface; it simply accumulates. Looking at either the raw data, or the comparison of binned data shown in Fig. 7 D, one can see that in the WT or KI lenses, not only is [Ca2+]i significantly lower than in KO lenses, it is also much better controlled. This comparison suggests that Ca homeostasis in the lens depends critically on gap junction coupling.
The outermost measurements of [Ca2+]i for the KO lenses were made right at the transition from DF to MF, where the microelectrode first popped into the lenses, so the value is already somewhat elevated. Presumably, if we could have recorded [Ca2+]i at locations closer to the surface, it would have been better controlled, since we think that the DF coupling conductance is still reasonably high, due to the presence of Cx50 channels in the DF of Cx46 KO lenses (Baldo et al., 2001). If one considers how the lens grows, cells that are DF this week will be MF next week, and in the MF intracellular calcium begins to accumulate. The following week, these cells will be deeper in the MF with a still higher value of [Ca2+]i, owing to a longer time for accumulation. In lenses from mice of this age (2–3 wk postnatal), growth is still relatively rapid, hence the value of [Ca2+]i has increased to 1 μM and above at locations central to r/a = 0.5, which is the zone where the cataract forms, presumably because Ca concentrations >1 μM initiate Lp82 protease activity, as described in Baruch et al. (2001). Although we have not yet studied lenses from older KO mice, we know that growth slows, allowing more time for the peripheral MF to accumulate Ca2+, and we know that the central cataract spreads outward to fill a larger fraction of the lens diameter, consistent with [Ca2+]i being the cause.
Is [Ca2+]i a Trigger for Connexin Cleavage at the DF to MF Transition?
It has long been known that fiber cells lose their intracellular organelles and that the COOH termini of most membrane proteins, including the connexins, are cleaved at the DF to MF transition. More recently, Jacobs et al. (2004) have shown that gap junction plaques are completely reorganized at this transition. Data presented in Martinez-Wittinghan et al. (2004) suggest even more complexity. Lens proteases are generally in the calpain family (Reed et al., 2003), such as Lp82; hence proteolytic activity may be regulated by [Ca2+]i. In the KO lenses, our hypothesis is that increased [Ca2+]i in MF causes activation of Lp82. In the KI lenses, [Ca2+]i is decreased in MF, perhaps leading to reduced protease activity. Although we cannot evaluate all that is occurring at the DF to MF transition, by using an antibody to the COOH terminus of Cx46, we were able to compare the cleavage of its COOH terminus in WT and KI lenses (Fig. 8).
Figure 8.
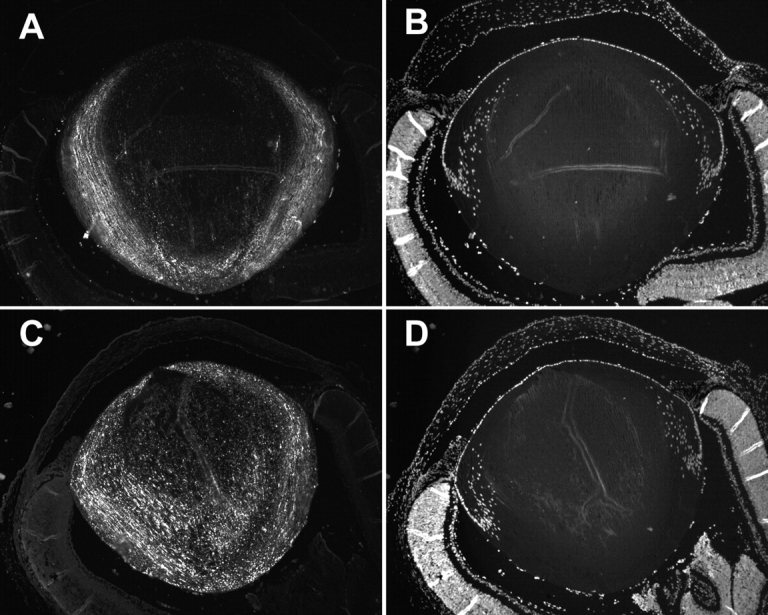
Differences in the processing of Cx46 in WT and KI lenses. (A) Immunostaining of the COOH termini of Cx46 in WT lenses. The loss of signal at the DF to MF transition indicates cleavage of the COOH termini. (B) Staining of nuclei in WT lenses. The loss of signal suggests that intracellular organelles disintegrate at the DF to MF transition. (C) Immunostaining of the COOH termini of Cx46 in KI lenses. The signal persists into the MF, indicating that many of the Cx46 COOH termini were not cleaved as they were in the WT lenses. (D) Staining of nuclei in KI lenses. The loss of signal at the DF to MF transition suggests that the disintegration of organelles is the same in WT and KI lenses.
Fig. 8 (A and B) illustrates WT lenses. Fig. 8 A illustrates labeling of the COOH terminus of Cx46, which is cleaved at the DF to MF transition, causing loss of signal at 10–20% of the distance into the lens. Fig. 8 B shows labeling of nuclei with the nuclear marker 4′,6-diamidino-2-phenylindole (DAPI). One can see that the epithelium is more or less oriented toward the top of the panels, and that nuclear staining is lost at the DF to MF transition. Fig. 8 (C and D) illustrates KI lenses, in which the same labeling was used. As can be seen in Fig. 8 C, the COOH terminus is not cleaved from many of the Cx46 proteins in the MF of KI lenses, and the staining persists into central MF. However, nuclear staining is still lost at the DF to MF transition (Fig. 8 D). Clearly there are major differences in Cx46 processing at the DF to MF transition in these two types of lenses.
DISCUSSION
Calcium Homeostasis in the Lens
Based on the circulating fluxes that have been measured in the normal lens (for review see Mathias et al., 1997), we thought that calcium handling in the lens might follow a similar pattern. The data we have presented are consistent with this idea. Calcium homeostasis in the central MF of the lens appears to be more complex than in most cells. The MF do not have the Ca-ATPase activity or Na/Ca exchange to transport calcium out, yet they have some finite membrane permeability to calcium, hence it is continuously leaking into these cells throughout the volume of the lens. This causes Ca2+ to accumulate in the MF until diffusion to the surface balances the volume leak into cells of the lens. At the surface, Ca-ATPase activity and Na/Ca exchange transport it out of the lens. This sets up a circulation of Ca2+, where the path to the surface depends on the presence of fiber cell gap junctions. The data that support this model are as follows: (a) there is a diffusion gradient for Ca2+ in normal lenses, with the highest concentration in the central cells and the lowest in the surface cells; (b) this diffusion gradient for Ca2+ can be modulated either up or down, as the gap junction resistance between cells is modulated either up or down; (c) a simple model of the proposed circulation is quantitatively consistent with the changes in concentration gradient being due to changes in cell to cell coupling in the MF.
In an isolated single cell at steady state, plasma membrane Ca influx and efflux must balance. In the lens, this is not true for any particular cell, but must obviously still hold for the total flux across all cell membranes. The data suggest that influx and efflux are at different spatial locations; hence, a circulation exists, as described in our model. Moreover, in an isolated cell, internal buffers must be at equilibrium with [Ca2+]i, and organelles must be in steady state such that there is no net transmembrane Ca flux. The MF of the lens have no organelles, so this is not a consideration; however, there are internal buffers in all cells. If a buffer cannot move from cell to cell, presumably because it is too large to pass through gap junction channels, then that buffer will have to be at equilibrium with the Ca concentration at the location of the buffer. This implies that the same buffer will bind with Ca2+ to a greater degree in central than peripheral cells. If some of these buffers are capable of moving from cell to cell, either through gap junction channels or perhaps through the cell fusion system suggested by Shestopalov and Bassnett (2003), then Ca handling could be much more complex than described here. There would be loaded buffer molecules diffusing down their concentration gradient from the central fiber cells to the surface, and empty buffer molecules diffusing back into the center of the lens. This is an intriguing possibility, but it is not one that we currently have the means to detect.
A Role for [Ca2+]i in Connexin Cleavage?
We have shown that [Ca2+]i is much lower in KI than WT mouse lenses. We have also shown that the COOH termini of Cx46 are all cleaved at the DF to MF transition in WT lenses, whereas many Cx46 proteins retain their COOH termini in the KI lenses. Most lens protease activity is [Ca2+]i dependent (Lin et al., 1997; Yin et al., 2001, Reed et al., 2003), so the abnormally low [Ca2+]i in the KI lenses may relate to the lack of protease activity. At this stage, we do not know. There are clearly other possible causes for the differences in processing, but Ca signaling is one intriguing possibility. Whatever the signal for connexin cleavage at the DF to MF transition, it must be different from the signal to degrade organelles, since the loss of nuclei staining is the same in the WT and KI lenses.
Connexins, Calcium, and Cataracts
Although many studies have found a correlation between elevated lens calcium and cataract (Duncan and van Heyningen, 1977; Hightower and Reddy, 1982; Baruch et al., 2001; Tang et al., 2003), it has not been possible to establish a cause and effect relationship. Probably the most direct relationship was established by Baruch et al. (2001), who showed that activation of the Ca-dependent protease Lp82 caused the cataract in the Cx46 KO lenses. The model described here provides a cause and effect explanation for the cataract found in the KO lenses. We have shown (Gong et al., 1998) that KO of Cx46 causes loss of coupling of the MF with surface cells, where active Ca2+ transport is located (for review see Paterson and Delamere, 2004). As a consequence, Ca2+ accumulates in the MF in a time-dependent manner. The more central the fiber cell, the greater its age; hence, the most central fibers have the highest values of [Ca2+]i. In the 2–3-wk-old KO mouse lenses, the critical concentration of calcium for activation of Lp82 appears to be ∼1 μM, which is the value at 50% of the distance into these lenses. As described in Baruch et al. (2001), when [Ca2+]i reaches a critical level (presumably 1 μM based on our data), Lp82 is activated, it cleaves γ-crystallins, causing them to aggregate and scatter light. Since [Ca2+]i in WT lenses ranges from ∼600 nM at r = 0.5a to 700 nM at r = 0, there appears to be little safety margin between WT and KO lenses. However, it is probably rather difficult to change [Ca2+]i in a normal lens, given its size and capacity to buffer perturbations in Ca handling. The KO of the Cx46 channels that couple the MF was, after all, a very significant compromise of the normal homeostatic mechanisms.
The dense central cataract seen in the Cx46 KO mouse lenses is very similar to the senile cataract found in human lenses. However, there are no compelling reasons to suggest that the causes are the same. The general finding is that central cataracts involve proteolysis of crystallins and their aggregation, but the causes of the proteolysis remain to be determined. Certainly, oxidative damage (Truscott and Augusteyn, 1977) is as viable a candidate as elevated calcium in the central cells. However, the two models may not be exclusive. For example, based on the model presented here, if gap junction channels suffered oxidative damage, this could lead to accumulation of calcium in central cells. Although we cannot yet identify the steps leading to formation of the senile cataract, we are slowly but surely filling in the blanks where the causes could lie.
Acknowledgments
This work was supported by National Institutes of Health grants EY06391, EY13163, and EY13849.
Olaf S. Andersen served as editor.
Abbreviations used in this paper: DF, differentiating fibers; KI, knockin; KO, knockout; MF, mature fibers; WT, wild type.
References
- Baldo, G.J., X. Gong, F.J. Martinez-Wittinghan, N.M. Kumar, N.B. Gilula, and R.T. Mathias. 2001. Gap junctional coupling in lenses from alpha(8) connexin knockout mice. J. Gen. Physiol. 118:447–456. [DOI] [PMC free article] [PubMed] [Google Scholar]
- Baruch, A., D. Greenbaum, E.T. Levy, P.A. Nielsen, N.B. Gilula, N.M. Kumar, and M. Bogyo. 2001. Defining a link between gap junction communication, proteolysis, and cataract formation. J. Biol. Chem. 276:28999–29006. [DOI] [PubMed] [Google Scholar]
- Bassnett, S. 2002. Lens organelle degradation. Exp. Eye Res. 74:1–6. [DOI] [PubMed] [Google Scholar]
- Candia, O.A., and A.C. Zamudio. 2002. CI secretagogues reduces basolateral K permeability in the rabbit corneal epithelium. J. Membr. Biol. 190:197–205. [DOI] [PubMed] [Google Scholar]
- Donaldson, P.J., J. Kistler, and R.T. Mathias. 2001. Molecular solutions to mammalian lens transparency. News Physiol. Sci. 16:118–123. [DOI] [PubMed] [Google Scholar]
- Duncan, G., and R. van Heyningen. 1977. Distribution of non-diffusible calcium and sodium in normal and cataractous human lenses. Exp. Eye Res. 25:183–193. [DOI] [PubMed] [Google Scholar]
- Gao, J., X. Sun, V. Yatsula, R.S. Wymore, and R.T. Mathias. 2000. Isoform-specific function and distribution of Na/K pumps in the frog lens epithelium. J. Membr. Biol. 178:89–101. [DOI] [PubMed] [Google Scholar]
- Gerido, D.A., C. Sellitto, L. Li, and T.W. White. 2003. Genetic background influences cataractogenesis, but not lens growth deficiency, in Cx50-knockout mice. Invest. Ophthalmol. Vis. Sci. 44:2669–2674. [DOI] [PubMed] [Google Scholar]
- Gong, X., E. Li, G. Klier, Q. Huang, Y. Wu, H. Lei, N.M. Kumar, J. Horwitz, and N.B. Gilula. 1997. Disruption of alpha3 connexin gene leads to proteolysis and cataractogenesis in mice. Cell. 91:833–843. [DOI] [PubMed] [Google Scholar]
- Gong, X., G.J. Baldo, N.M. Kumar, N.B. Gilula, and R.T. Mathias. 1998. Gap junctional coupling in lenses lacking alpha3 connexin. Proc. Natl. Acad. Sci. USA. 95:15303–15308. [DOI] [PMC free article] [PubMed] [Google Scholar]
- Haworth, R.A., and D. Redon. 1998. Calibration of intracellular Ca transients of isolated adult heart cells labelled with fura-2 by acetoxymethyl ester loading. Cell Calcium. 24:263–273. [DOI] [PubMed] [Google Scholar]
- Harris, A.L. 2001. Emerging issues of connexin channels: biophysics fills the gap. Q. Rev. Biophys. 34:325–472. [DOI] [PubMed] [Google Scholar]
- Hightower, K.R., and V.N. Reddy. 1982. Calcium content and distribution in human cataract. Exp. Eye Res. 34:413–421. [DOI] [PubMed] [Google Scholar]
- Jacobs, M.D., C. Soeller, A.M. Sisley, M.B. Cannell, and P.J. Donaldson. 2004. Gap junction processing and redistribution revealed by quantitative optical measurements of connexin46 epitopes in the lens. Invest. Ophthalmol. Vis. Sci. 45:191–199. [DOI] [PubMed] [Google Scholar]
- Lin, J.S., S. Fitzgerald, Y. Dong, C. Knight, P. Donaldson, and J. Kistler. 1997. Processing of the gap junction protein connexin50 in the ocular lens is accomplished by calpain. Eur. J. Cell Biol. 73:141–149. [PubMed] [Google Scholar]
- Magid, A.D., A.K. Kenworthy, and T.J. McIntosh. 1992. Colloid osmotic pressure of steer crystallins: implications for the origin of the refractive index gradient and transparency of the lens. Exp. Eye Res. 55:615–627. [DOI] [PubMed] [Google Scholar]
- Mathias, R.T., J.L. Rae, and G.J. Baldo. 1997. Physiological properties of the normal lens. Physiol. Rev. 77:21–50. [DOI] [PubMed] [Google Scholar]
- Martinez-Wittinghan, F.J., C. Sellitto, L. Leping, X. Gong, P. Brink, R.T. Mathias, and T.W. White. 2003. Dominant cataracts results from incongruous mixing of wild-type lens connexins. J. Cell Biol. 161:969–978. [DOI] [PMC free article] [PubMed] [Google Scholar]
- Martinez-Wittinghan, F.J., C. Sellitto, T.W. White, R.T. Mathias, D. Paul, and D.A. Goodenough. 2004. Lens gap junctional coupling is modulated by connexin identify and the locus of gene expression. Invest. Ophthalmol. Vis. Sci. In press. [DOI] [PubMed] [Google Scholar]
- Paterson, C.A., and N.A. Delamere. 2004. ATPases and lens ion balance. Exp. Eye Res. 78:699–703. [DOI] [PubMed] [Google Scholar]
- Reed, N.A., M.A. Castellini, H. Ma, T.R. Shearer, and M.K. Duncan. 2003. Protein expression patterns for ubiquitous and tissue specific calpains in the developing mouse lens. Exp. Eye Res. 76:433–443. [DOI] [PubMed] [Google Scholar]
- Shestopalov, V.I., and S. Bassnett. 2003. Development of a macromolecular diffusion pathway in the lens. J. Cell Sci. 116:4191–4199. [DOI] [PMC free article] [PubMed] [Google Scholar]
- Tamiya, S., W.L. Dean, C.A. Paterson, and N.A. Delamere. 2003. Regional distribution of Na,K-ATPase activity in porcine lens epithelium. Invest. Ophthalmol. Vis. Sci. 4:4395–4399. [DOI] [PubMed] [Google Scholar]
- Tang, D., D. Borchman, M.C. Yappert, G.F. Vrensen, and V. Rasi. 2003. Influence of age, diabetes, and cataract on calcium, lipid-calcium, and protein-calcium relationships in human lens. Invest. Ophthalmol. Vis. Sci. 44:2059–2066. [DOI] [PubMed] [Google Scholar]
- Truscott, R.J., and R.C. Augusteyn. 1977. Oxidative changes in human lens proteins during senile nuclear cataract formation. Biochim. Biophys. Acta. 492:43–52. [DOI] [PubMed] [Google Scholar]
- Varadaraj, K., C. Kushmerick, G.J. Baldo, S. Bassnett, A. Shiels, and R.T. Mathias. 1999. The role of MIP in lens fiber cell membrane transport. J. Membr. Biol. 170:191–203. [DOI] [PubMed] [Google Scholar]
- White, T.W. 2002. Unique and redundant connexin contributions to lens development. Science. 295:319–320. [DOI] [PubMed] [Google Scholar]
- White, T.W., D.A. Goodenough, and D.L. Paul. 1998. Targeted ablation of connexin50 in mice results in microphthalmia and zonular pulverulent cataracts. J. Cell Biol. 143:815–825. [DOI] [PMC free article] [PubMed] [Google Scholar]
- Yin, X., S. Gu, and J.X. Jiang. 2001. The development-associated cleavage of lens connexin 45.6 by caspase-3-like protease is regulated by casein kinase II-mediated phosphorylation. J. Biol. Chem. 276:34567–34572. [DOI] [PubMed] [Google Scholar]