

Abstract
The serum and glucocorticoid induced kinase 1 (SGK1) participates in the regulation of sodium reabsorption in the distal segment of the renal tubule, where it may modify the function of the epithelial sodium channel (ENaC). The molecular mechanism underlying SGK1 regulation of ENaC in renal epithelial cells remains controversial. We have addressed this issue in an A6 renal epithelial cell line that expresses SGK1 under the control of a tetracycline-inducible system. Expression of a constitutively active mutant of SGK1 (SGK1T S425D) induced a sixfold increase in amiloride-sensitive short-circuit current (I sc). Using noise analysis we demonstrate that SGK1 effect on I sc is due to a fourfold increase in the number of functional ENaCs in the membrane and a 43% increase in channel open probability. Impedance analysis indicated that SGK1T S425D increased the absolute value of cell equivalent capacitance by an average of 13.7%. SGK1T S425D also produced a 1.6–1.9-fold increase in total and plasma membrane subunit abundance, without changing the half-life of channels in the membrane. We conclude that in contrast to aldosterone, where stimulation of transport can be explained simply by an increase in channel synthesis, SGK1 effects are more complex and involve at least three actions: (1) increase of ENaC open probability; (2) increase of subunit abundance within apical membranes and intracellular compartments; and (3) activation of one or more pools of preexistent channels within the apical membranes and/or intracellular compartments.
Keywords: ENaC, serum- and glucocorticoid-induced kinase, sodium reabsorption, open probability, channel density
INTRODUCTION
Regulation of epithelial sodium channel (ENaC) activity in the distal segments of the renal tubule is critical for the control of sodium balance and blood pressure. Aldosterone is a potent stimulus for sodium reabsorption in the kidney and a major regulator of ENaC activity. The mechanisms involved in aldosterone effects are only partially understood. The following evidence suggests that the serum and glucocorticoid-induced kinase 1 (SGK1) might be an important mediator of aldosterone action. Aldosterone increases the expression of SGK1 in the kidney and in cultured renal cells (Chen et al., 1999; Naray-Fejes-Toth et al., 1999; Shigaev et al., 2000; Bhargava et al., 2001), although aldosterone is not the only transcriptional regulator of SGK1 in the rat kidney (Alvarez de la Rosa et al., 2003; Farjah et al., 2003). Coexpression of SGK1 and ENaC in heterologous systems increases amiloride-sensitive sodium current and transepithelial sodium transport (Alvarez de la Rosa et al., 1999; Chen et al., 1999; Naray-Fejes-Toth et al., 1999; Faletti et al., 2002; Alvarez de la Rosa and Canessa, 2003). The importance of SGK1 on ENaC regulation in the kidney has been corroborated in an SGK1 knock-out mouse (Wulff et al., 2002; Huang et al., 2004). These animals [sgk1(−/−)] exhibit normal kidney structure and function under standard salt intake. In contrast, restriction of dietary salt reveals a defect in sodium retention by the kidney that decreases blood pressure significantly (Wulff et al., 2002). These findings are consistent with an inability of sgk1(−/−) mice to maximally activate or express ENaC.
The mechanisms underlying the effect of SGK1 on ENaC have been elucidated only partly. Current data do not support direct phosphorylation of ENaC by SGK1, at least in Xenopus oocytes (Pearce, 2001). More likely, SGK1 interacts with other proteins that ultimately stimulate ENaC function by increasing either the number or the activity of channels in the plasma membrane. Co-injection of SGK1 and ENaC in Xenopus oocytes increases channel expression in the plasma membrane (Alvarez de la Rosa et al., 1999). It has been proposed that ENaC abundance in the membrane is regulated by changes in the rate of channel endocytosis, which in turn is controlled by the ubiquitin ligase Nedd4 (Kamynina and Staub, 2002). Nedd4 binds proline-rich motives (PY) located in the carboxy terminus of the three ENaC subunits and catalyzes the ubiquitination of residues in the amino terminus of the subunits. Addition of ubiquitin provides a signal for the endocytic machinery to retrieve the channel (Staub et al., 1997). Recently, it has been shown that SGK1 is able to phosphorylate Nedd4, diminishing its affinity for the PY motifs and consequently leading to a decrease in retrieval of channels (Debonneville et al., 2001; Snyder et al., 2002). However, other studies indicate the situation is more complex because: (a) SGK1 effects persist after Nedd4 binding is abolished by deletion of the COOH terminus of the three subunits (Alvarez de la Rosa et al., 1999) or by selective mutation of PY motifs (Alvarez de la Rosa et al., 1999; Shigaev et al., 2000); (b) the half life of ENaC in the apical membrane of A6 cells remains unchanged after aldosterone treatment (Alvarez de la Rosa et al., 2002); (c) SGK1 has been shown to activate other channels and transporters that lack PY motifs and are not targets of Nedd4, such as NKCC2 and Na,K-ATPase (Lang et al., 2000; Setiawan et al., 2002); and (d) besides effects on channel traffic, it has been deduced from measurements of whole-cell currents and labeling of ENaC on the surface of Xenopus oocytes that SGK1 increases by 50% the activity of channels expressed in the membrane (Vuagniaux et al., 2002).
The goals of this study are to investigate the mechanism by which SGK1 regulates ENaC and to compare the effects of SGK1 to those induced by aldosterone in renal epithelial cells in culture. To this end, we used an A6 cell line that conditionally expresses a constitutively active mutant of SGK1 (Alvarez de la Rosa and Canessa, 2003). To study the mechanisms underlying the increase in sodium transport, we examined the functional properties of ENaC by blocker-induced noise analysis and correlated the changes in channel function with variations in membrane capacitance and ENaC subunits steady-state abundance, traffic and biosynthesis.
MATERIALS AND METHODS
Cell Culture
The generation and characterization of A6 cells with tetracycline-inducible expression of SGK1 has been described previously (Alvarez de la Rosa and Canessa, 2003). In brief, we used the T-Rex system (Invitrogen) to generate A6 cell lines with stable coexpression of tetracycline repressor protein (TetR) and various forms of transfected Xenopus SGK1 (SGK1T) under the control of a promoter containing a tetracycline operator sequence (TetO). Under basal conditions TetR binds to TetO and represses SGK1T transcription. When tetracycline (Invitrogen) is added to the medium TetR is released from TetO and expression of SGK1Toccurs. In this study we used one of the cell lines described in our previous work, clone 1 conditionally expressing a constitutively active mutant of SGK1, SGK1T S425D (Alvarez de la Rosa and Canessa, 2003).
Cells were grown at 27°C in amphibian medium (0.75× Dulbecco's modified eagle's medium; GIBCO BRL) buffered with sodium bicarbonate and supplemented with 10% fetal bovine serum (Hyclone) and antibiotics for plasmid selection (500 μg/ml zeocin and 10 μg/ml blasticidin; Invitrogen) in a humidified incubator containing 1.5% CO2. Cells were routinely expanded in plastic dishes and subcultured onto 4.7 cm2 polycarbonate permeable supports (Transwell) for at least 10 d to achieve confluence and complete development of transepithelial transport characteristics (Helman and Liu, 1997). Cells were fed twice weekly with growth medium. After achieving confluence, the cells were depleted of serum and maintained in these conditions for two more days before experiments were performed. To induce expression of the mutant kinase, tetracycline (1 μg/ml) was added to the cells 24 h before the onset of the experiments. During electrical measurements tetracycline was maintained in the basolateral perfusion solution for the duration of the experiments. Control experiments show that 1 μg/ml of tetracycline does not change electrical properties in the A6 parental cell line or in A6 cells transfected with an empty vector and grown on selective conditions (Alvarez de la Rosa and Canessa, 2003). Where indicated 100 nM aldosterone (Sigma-Aldrich) was added to the cells 24 h before the onset of the experiments.
For electrical measurements, the filters were transferred to edge damage-free chambers (Abramcheck et al., 1985) and short circuited for the duration of the experiments using a very low noise, four electrode (Ag/AgCl, 4.5 M NaCl, 3% agar) voltage clamp while being perfused continuously at flow rates of ∼7 ml/min through chamber volumes of ∼0.5 ml with serum-free growth medium. Short-circuit currents (I sc) were allowed to stabilize for at least 75 min before the start of experimental periods. At the ends of the experiments 100 μM amiloride was added to the apical perfusion solution to measure the amiloride-insensitive Na+ currents. Macroscopic rates of sodium transport are expressed as blocker-sensitive Na+ currents (I Na), determined from the difference between the I sc and the respective amiloride-insensitive currents.
Noise Analysis
The pulse method of blocker-induced noise analysis described in detail previously (Helman et al., 1998), permits determination of single-channel current (i Na), channel open probability (P o), and functional channel density (N T) during steady-state and transient periods of transport. In brief, the apical perfusion solution contained 10 μM CDPC (6-chloro-3,5-diamino-pyrazine-2-carboxamide; Sigma-Aldrich) throughout the experiment. From previous experience, this causes a small inhibition of the short-circuit current (I sc 10), followed by an autoregulatory return to the original baseline values of the I sc (Helman et al., 1998). Once the I sc has stabilized, at 15-min intervals during control and experimental periods, the CDPC concentration was increased from 10 to 30 μM for pulse intervals of 3 min. CDPC is a low affinity Na+ channel blocker that interacts with open channels causing fluctuations of the channels between open and blocked states and thereby giving rise to blocker-induced current noise characterized by Lorentzians in power density spectra (PDS).
For each time point, low-frequency plateau values (S o) and corner frequencies (f c) of the CDPC Lorentzians were determined by nonlinear curve fitting (Table Curve 2D; Jandel Scientific Software) for the pair of PDS measured at 10 and 30 μM CDPC, respectively. The blocker on (k ob) and off (k bo) rate coefficients were calculated from the slopes and intercepts of the time-filtered pairs of f c at the respective CDPC concentrations (2πf c = k ob B+k bo where B is the blocker concentration), and the blocker equilibrium constants, K B, are given by K B = k bo/k ob (Helman and Baxendale, 1990). i Nas were calculated with the following equation:
 |
(1) |
using the power gain correction factor (P gain) defined and calculated as described previously (Paunescu et al., 2000). The channel open probabilities P o were calculated in the usual way (Helman et al., 1998):
 |
(2) |
where B 1 and B 2 indicate the two blocker concentrations at which the measurements were performed. Open channel densities (N o) in the absence of blocker were determined from the respective open channel densities in the presence of blocker N
| B |
| o |
=
 |
(3) |
and the functional channel densities (N T), defined as the total number of functional channels actively involved in transmembrane Na+ transport (thereby excluding nonfunctional or quiescent channels), is given by the quotient N o/P o.
At the end of the experiments 100 μM amiloride was added to the apical perfusion solution to measure the amiloride-insensitive short-circuit sodium currents (see Fig. 1). These values were subtracted from the I sc measured previously to determine macroscopic rates of sodium transport expressed as I Na.
Figure 1.

Representative strip-chart recordings of the short-circuit current, I sc, in (A) nontreated and (B) tetracycline-stimulated cells. The apical perfusion solution contained 10 μM CDPC except for the pulse periods when the blocker concentration was increased to 30 μM (arrows). The marked inhibition of current by 100 μM amiloride at the end of the experiments (arrowhead) confirmed that the I sc mostly reflects ENaC mediated Na+ currents. The amiloride sensitive currents are also subtracted from the short-circuit currents to determine macroscopic rates of sodium transport expressed as blocker-sensitive Na+ currents (I Na).
Impedance Analysis
Transepithelial electrical impedance (Z T) was measured under voltage clamp conditions in the frequency range of 0.244–10.45 kHz as described previously (Paunescu and Helman, 2001). The measured transepithelial voltage and current signals were amplified, filtered at the Nyquist frequencies and digitized using an IBM-compatible computer containing a DSP2200 board (National Instruments). The voltage and current vectors were determined by the Fourier transform of these signals, and the measured impedance (Z meas) was calculated as their quotient at the respective frequencies. Z meas was corrected for the series resistance of apical and basolateral perfusion solutions (R sol) to yield the Z T.
The equivalent cell capacitance (C eq*) was determined accordingly from the measured values of Z T and the shunt resistance (R p=Z
| dc |
| meas |
−R
sol, where  is the dc value of Z
meas) using the following equation (Paunescu and Helman, 2001):
is the dc value of Z
meas) using the following equation (Paunescu and Helman, 2001):
 |
(4) |
To better characterize the changes in cell membrane capacitance in tetracycline-treated versus control cells at audio frequencies we investigated the changes of |C eq*|, the absolute value or magnitude of C eq*, as described previously (Paunescu and Helman, 2001).
Cell Surface Biotinylation and Western Blot Analysis
A6 cells grown on filters were treated overnight with 100 nM aldosterone or 1 μg/ml of tetracycline. Cell surface biotinylation and Western blot analysis of Xenopus ENaC (xENaC) subunits were performed as described previously (Alvarez de la Rosa et al., 2002). In brief, apical membrane proteins were biotinylated at 4°C with the cell-impermeant biotin derivative sulfo-NHS-SS-biotin (Pierce Chemical Co.). After biotinylation free biotin was quenched with 50 mM glycine and cells were either solubilized immediately in a buffer containing 1% Triton X-100 or washed with serum-free culture medium and returned to the incubator for different periods of time before processing. Cell lysates were cleared by centrifugation and protein concentration was determined with the bicinchoninic acid procedure (BCA kit; Pierce Chemical Co.). 250 μg of lysate from each sample were incubated with streptavidin-agarose beads (Pierce Chemical Co.) to recover biotinylated proteins. The conditions used for streptavidin pull-down were optimized to ensure quantitative recovery of biotinylated proteins (Alvarez de la Rosa et al., 2002). Pull-down products were eluted from streptavidin beads and one third of each sample was separated in SDS-PAGE. In parallel gels, 40 μg of total protein from each sample were loaded. After transfer to Immobilon-P membranes (Millipore), xENaC subunits were detected using specific polyclonal antibodies (Alvarez de la Rosa et al., 2002). The signal was developed with the enhanced chemiluminiscence system (ECL+; Amersham Biosciences) and detected with Biomax MR film (Eastman Kodak Co.). Signal intensities were quantified with a scanning densitometer (Bio-Rad Laboratories).
Quantification of xENaC Subunits Protein Abundance
To obtain an estimate of the number of total channels in the cell and in the plasma membrane a quantitative assay was developed following the method described by Valentijn et al. (1998). The sequence of xENaC α subunit used to raise the antibody (Alvarez de la Rosa et al., 2002) was subcloned in the vector pMAL2cx (New England Biolabs), which allows the expression of maltose binding protein (MBP) fused with a sequence of interest in Escherichia coli. The fusion protein was affinity purified in a maltose column and quantified by absorption spectroscopy at 280 nM. Serial dilutions with known amounts of fusion protein (20, 10, 5, 1, and 0.1 fmol) were loaded on SDS-PAGE gels in parallel with samples of total protein (19.5 μg) and plasma membrane proteins from A6 cells. Plasma membrane proteins were recovered by cell-surface biotinylation and streptavidin-pull down as described in the previous section. The input for streptavidin-pull down was 61 μg of total protein in the cell lysate. Proteins were detected by Western blot with polyclonal antibody against xENaC α subunit. Signal intensity was quantified with a scanning densitometer (Bio-Rad Laboratories). Fusion protein signals were used to construct a standard curve. Signal intensities obtained with samples between 5 and 20 fmol were linear.
Metabolic Labeling and Immunoprecipitation
xENaC subunit rate of synthesis was examined as described previously (Alvarez de la Rosa et al., 2002). In brief, cells were treated overnight with 100 nM aldosterone or 1 μg/ml of tetracycline and then labeled with a mixture of [35S]methionine and [35S]cysteine (PerkinElmer) for 15 min. Cells were then resuspended in lysis buffer and incubated on ice for 30 min. Lysates were cleared by centrifugation and total protein content was quantified with the BCA kit (Pierce Chemical Co.). Polyclonal antibodies were used to specifically immunoprecipitate each of the xENaC subunits from cell lysates containing equal amounts of total protein. Conditions used for immunoprecipitation were optimized to ensure quantitative recovery of the antigen (Alvarez de la Rosa et al., 2002). The products of each immunoprecipitation were resolved in SDS-PAGE, transferred to Immobilon-P (Millipore) and exposed to Biomax MR film with a Biomax intensifying screen (Eastman Kodak Co.). Signal intensity was quantified by densitometry.
Phosphorylation of xENaC subunits was studied essentially as described (Shimkets et al., 1998). In brief, cells were treated overnight with 100 nM aldosterone or a combination of 100 nM aldosterone and 1 μg/ml of tetracycline. After two washes in phosphate-free medium, 1 mCi/ml of [32P]orthophosphate (Amersham Biosciences) was added to the basolateral side and cells were incubated for 4 h in the presence of aldosterone or aldosterone and tetracycline. Cells were then lysed in the presence of phosphatase inhibitors and xENaC subunits were recovered by immunoprecipitation as described above.
Statistical Analysis
Data of noise experiments are summarized as means ± SE. Noise and impedance experiments were performed at room temperature. All other data represent the mean of number of independent experiments ± SE. Differences between groups were evaluated with nonpaired t test. P and n values are given in the text or figure legends when appropriate.
RESULTS
Open-circuit Parameters
Before the transfer of A6 monolayers to the chambers in which noise and impedance analysis were performed, the transepithelial open-circuit voltages (V oc) and transepithelial electrical resistances (R T) were measured under open-circuit conditions, and the apparent short-circuit currents (I sc) were calculated from the measured parameters. Tetracycline-induced expression of a constitutively active mutant of SGK1 (SGK1T S425D) consistently increased mean V oc values, 72.6 ± 6.8 mV (n = 9) compared with the control value of 31.9 ± 5.2 mV (n = 8) and markedly lowered mean R T values, 4.8 ± 0.4 kΩ·cm2 (n = 9) compared with the control value of 17.0 ± 2.7 kΩ·cm2 (n = 8). Accordingly, the calculated short-circuit currents of the tetracycline-treated monolayers averaging 15.1 ± 0.8 μA/cm2 were approximately sixfold higher than control I sc values averaging 2.4 ± 0.6 μA/cm2.
Noise Analysis
The representative strip chart recordings shown in Fig. 1 illustrate that typically I sc in both control and tetracycline-treated monolayers stabilized within ∼60 min after chronic tissue short-circuiting and remained stable for the duration of the experiments. The figure further shows that tetracycline-treated cells maintained macroscopic currents that were substantially higher than those of control cells (note the different ordinate scales in Fig. 1). As summarized in Fig. 2 A, rates of Na+ transport measured as macroscopic Na+ current (I Na) were on average five times higher in tetracycline-treated monolayers expressing SGK1T S425D than in control monolayers. I Na averaged 9.12 ± 0.07 μA/cm2 in tetracycline-treated monolayers and 1.81 ± 0.02 μA/cm2 in control monolayers over the period of analysis (n = 8 measurement points between 75 and 180 min after short-circuiting), with a mean I Na experimental vs. control ratio (E/C) of 5.05 ± 0.04.
Figure 2.

Stimulation of Na+ transport in A6 epithelia by SGKT S425D expression. (A) Rates of Na+ transport measured as macroscopic Na+ currents (I Na) are fivefold higher in tetracycline-treated cells (open circles) compared with nontreated cells (closed circles). (B) i Nas do not change significantly with expression of SGKT S425D (+tetracycline). (C) The increase in Na+ transport in tetracycline-treated cells is due to a comparable increase in ENaC open channel densities (N o). Values are means ± SE (n = 8 for nontreated cells, n = 9 for tetracycline-treated cells).
Lorentzians were easily resolved at 10 and 30 μM CDPC. Typical pairs of current noise–PDS for control and tetracycline-treated tissues are shown in Fig. 3 and were similar to those reported previously in studies of the effects of aldosterone in A6 cells (Helman et al., 1998).
Figure 3.
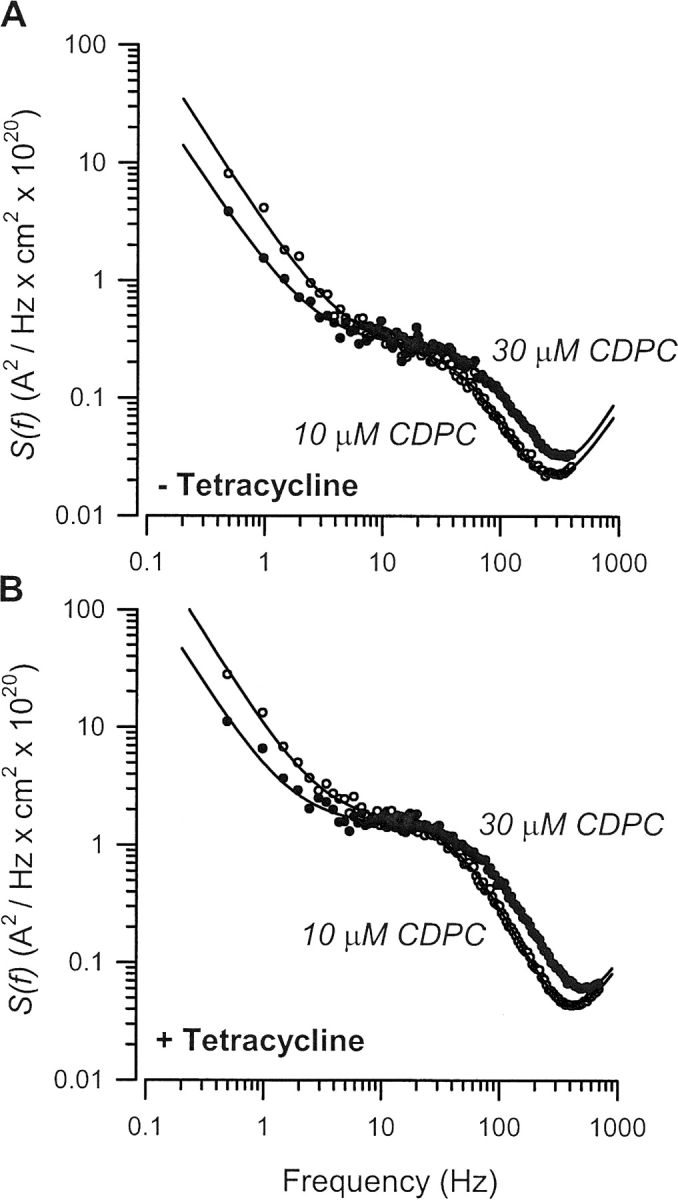
Typical current noise PDS in control and SGKT S42 5 D expressing A6 cells. Current noise PDS at 10 μM (open circles) and 30 μM CDPC (solid circles) in (A) control and (B) tetracycline-treated cells. Data were fit by nonlinear regression to three components, including a Lorentzian {S o/[1 + (f/f c)2]}, noise at low frequencies (S 1/fα), and noise at higher frequencies (S 2fβ), originating at the input stage of the voltage amplifier.
The higher levels of Na+ transport induced by the expression of SGKT S425D could not be attributed to changes of i Na. Disregarding small time-dependent variations of i Na, there was no significant difference in the average values of i Na amongst tetracycline-treated and control cells (Fig. 2 B). i Na values were closest to their respective mean values for the entire experimental periods at 135 min, where they averaged 0.47 ± 0.04 pA and 0.50 ± 0.09 pA in SGK1T S425D-expressing (n = 9) and control cells (n = 8), respectively. These mean i Na values are similar to those reported previously for ENaCs of frog skin (Helman and Liu, 1997) and A6 epithelia (Baxendale-Cox et al., 1997; Blazer-Yost et al., 1999).
Given that i Na is not changed by the expression of SGK1T S425D, the stimulation of macroscopic I Na must be explained by a proportional stimulation of the open channel density (N o), as illustrated in Fig. 2 C. At the end of the experimental periods, N o averaged 21.46 ± 2.15 and 3.66 ± 0.50 open channels/100 μm2 in tetracycline-treated (n = 9) and control epithelia (n = 8), respectively.
Data summarized in Fig. 4 A show that the higher transport rates and open channel densities in tetracycline-treated cells are in part the result of an increased channel P o. Notwithstanding small variations in P o over the period of analysis, E/C values determined at each time point were on average 43% higher in tetracycline-treated than in control cells. At the end of the experimental periods, P o averaged 0.64 ± 0.05 in SGK1T S425D-expressing cells, a significantly higher value than the mean 0.44 ± 0.03 calculated in control cells at this time point. The mean 43% increase of P o could not result alone in a fivefold increase in the Na+ transport rate as measured in tetracycline-treated monolayers. Instead, the higher levels of I Na and N o found in SGK1T S425D-expressing monolayers were mainly due to large and sustained increases of the total number of functional channels (N T), as illustrated in Fig. 4 B. At the end of the noise analysis experiments, i.e., 180 min after short circuiting of epithelia, N T averaged 34.2 ± 3.4 channels/100 μm2 in tetracycline-treated monolayers (n = 9) compared with 8.4 ± 0.9 channels/100 μm2 in control monolayers (n = 8). The fourfold difference in N T is maintained for most time points, as E/C values average 3.81 ± 0.21 throughout the experimental period (n = 8 time points). This increase in channel density is consequently the main determinant for the stimulation of Na+ transport in A6 epithelia by SGK1T S425D expression.
Figure 4.

SGKT S425D expression increases the number of active ENaCs and channel P o in A6 epithelia. (A) Expression of SGKT S425D (open circles, +tetracycline) increases P o by 43% above control cells (closed circles, −tetracycline). (B) N T, calculated as the quotient N o/P o, increased by fourfold in cells expressing SGKT S425D (open circles, +tetracycline) compared with control cells (closed circles, −tetracycline). Values are means ± SE (n = 8 for nontreated cells, n = 9 for tetracycline-treated cells).
Analysis showed that CDPC on and off rate coefficients remained essentially unchanged over the period of analysis. Furthermore, there was practically no difference between k bo values measured in control and tetracycline-treated cells, whereas k ob values only showed a slight decrease (11% on average) in tetracycline-treated cells, which was reflected in the KB as a slight increase. Typical values for the two groups of cells were recorded around 135 min, when k ob averaged 6.48 ± 0.30 and 7.17 ± 0.25 rad · s−1 · μM−1, respectively, whereas k bo averaged 201.5 ± 8.5 and 205.7 ± 12.6 rad · s−1 in treated and nontreated cells, respectively. At this time point K B averaged 32.0 ± 2.6 μM in SGK1T S425D-expressing cells and 29.0 ± 2.3 μM in control cells. Therefore, the blocker binding site appears to be conserved between the two groups of cells. Moreover, the values for CDPC blocker kinetics reported here are typical for ENaCs in frog skin (Els and Helman, 1997) and A6 epithelia (Els et al., 1998).
Impedance Analysis
On completion of noise analysis, 100 μM amiloride was added to the apical perfusion solution and the transepithelial impedance was measured under amiloride-blocked conditions. The impedance locus conformed to a depressed Nyquist semicircle (unpublished data) at frequencies above 100 Hz as described previously (Paunescu and Helman, 2001). Tetracycline-treated A6 cells exhibited a qualitatively similar frequency-dependent Z T, but with lower mean values of the magnitude of Z T than the control group measured both 10 and 20 min after exposure to amiloride. The lower impedance values in the tetracycline-treated cells, including lower Z
| dc |
| meas |
values, were to be expected, given the higher rates of transport and lower transepithelial resistances seen in these cells.
The C eq* was found to be frequency dependent as shown previously, exhibiting an apparent Cole–Cole α dielectric relaxation process (Paunescu and Helman, 2001). Fig. 5 shows a summary of the average absolute value of |C eq*| calculated at 20 min after exposure to amiloride in control and tetracycline-treated cells. In control A6 epithelia mean |C eq*| decreased from 1.50 ± 0.06 μF/cm2 at 2.7 Hz to 1.14 ± 0.04 μF/cm2 at 2.4 kHz (n = 8). Average |C eq*| of SGK1T S425D-expressing cells behaved in a similar frequency-dependent manner, decreasing at the same time point from 1.71 ± 0.07 μF/cm2 at 2.7 Hz to 1.30 ± 0.04 μF/cm2 at 2.4 kHz (n = 7). Despite the dependency of |C eq*| on frequency, the statistically significant increase of cell capacitance due to SGK1T S425D expression was evident at each and every frequency point. The calculated E/C values for the mean |C eq*| in the two groups of monolayers at all frequencies revealed that mean |C eq*| in tetracycline-treated cells was on average 13.7 ± 0.1% higher than in nontreated cells (n = 103 frequency points in the 2.7 Hz to 2.4 kHz range).
Figure 5.

Expression of SGKT S425D increases the absolute value of the |C eq* | in A6 epithelia. Summary of the |C eq*| at frequencies between 2.5 Hz and 5.5 kHz. Values are means ± SE for control (closed circles, n = 8) and tetracycline-treated (open circles, n = 7) A6 monolayers. For clarity, only every third point is shown. Induction of SGKT S425D expression caused a significant increase of cell capacitance at every frequency point.
Effects of SGK1T S425D Expression on Steady-State Abundance of Total and Cell Surface xENaC Subunits
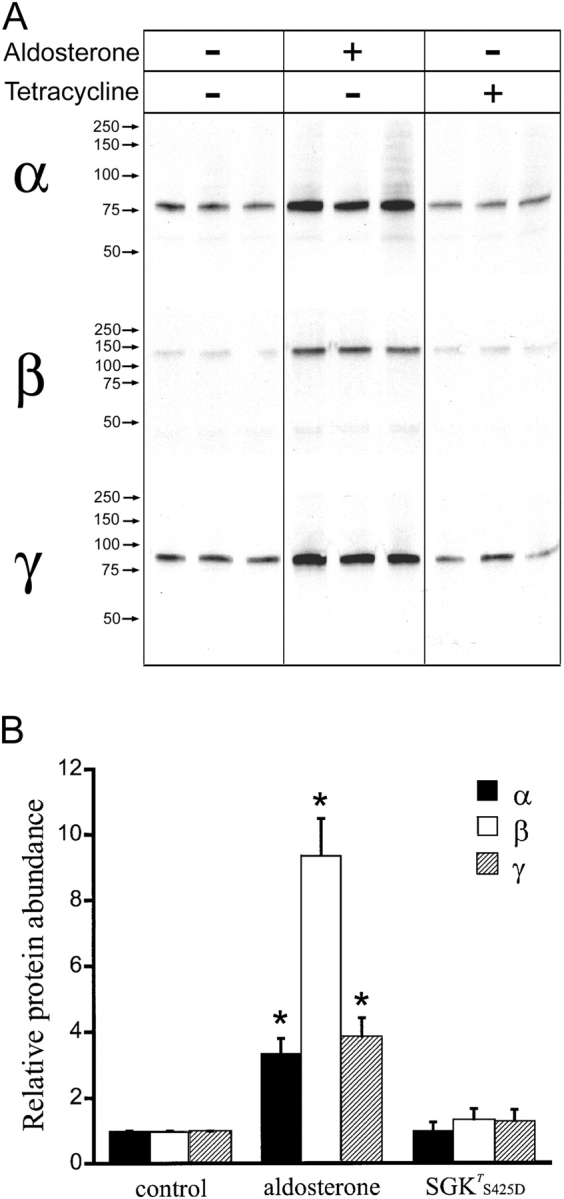
We investigated whether the increase in the number of functional channels (N T) observed by noise analysis was associated with a similar increase in the abundance of xENaC subunits in the apical membrane. The effects of SGK1T S425D expression were compared with those induced by aldosterone, which we have shown previously to occur by increased synthesis and steady-state abundance of the three xENaC subunits in A6 cells (Alvarez de la Rosa et al., 2002). To measure surface expression of xENaC we biotinylated apical proteins of cells grown on permeable supports and analyzed the abundance of subunits by Western blotting with specific polyclonal antibodies. Fig. 6 A shows Western blots of A6 cells examined under three different conditions: control cells incubated on serum-free medium overnight; cells treated with 100 nM aldosterone overnight; and cells treated with 1 μg/ml tetracycline overnight to induce the expression of SGK1T S425D. Samples from whole-cell homogenates (total protein) were run in parallel to samples of biotinylated proteins (plasma membrane). As described previously (Alvarez de la Rosa et al., 2002), the α subunit from A6 cells migrates in SDS-PAGE as two bands with apparent mobilities of 85 and 65 kD, due to posttranslational modifications. The β subunit also exhibits two bands (115 and 100 kD), while the γ subunit migrates predominantly as a single band (90 kD). Quantitative analysis of the data is shown in Fig. 6 B. Each bar represents the average of six to nine independent experiments performed in triplicate and normalized to the respective control. The black bars correspond to subunits in the whole-cell lysate, whereas the empty bars correspond to the subunits expressed in the plasma membrane. The results indicate that aldosterone increases the total abundance of subunits by four to sevenfold, which is mirrored by a similar change in subunit abundance at the apical membrane, as we have previously shown (Alvarez de la Rosa et al., 2002). In contrast, SGK1T S425D increased the total and apical fraction of each of the three subunits only by 1.6- to 1.9-fold depending on the subunit (Fig. 6 B). The small increase in the abundance of subunits induced by SGK1T S425D cannot account for the much larger increase in the number of functional channels in the membrane measured by noise analysis.
Figure 6.

Aldosterone and SGKT S425D effects on the relative abundance of xENaC subunits in A6 cells. (A) A6 cells grown on filters were treated overnight with 100 nM aldosterone or 1 μg/ml of tetracycline. Each condition was performed in triplicate. Apical plasma membrane proteins were biotinylated, recovered with streptavidin–agarose beads and analyzed by Western blot with antibodies against xENaC subunits (plasma membrane). Aliquots of cells lysates were run in parallel (total protein). Representative Western blots are shown for α, β, and γ ENaC subunits. Arrows indicate the migration of molecular mass standards. Molecular mass values are given in kD. (B) Quantification of relative changes in α, β, and γ ENaC subunit protein abundance. Bars represent mean ± SE of the values obtained in six to nine independent experiments, each of them performed in triplicate. Solid bars correspond to total protein and open bars to plasma membrane protein. Asterisks indicate statistically significant changes when compared with control conditions (P < 0.05).
Quantification of Total and Plasma Membrane xENaC in A6 Cells
The previous results suggest that not all channels in the apical membrane participate in sodium transport but there is a pool of inactive channels that can be activated by SGK1T S425D. To test this hypothesis we estimated the total number of xENaC α subunit in the plasma membrane using a quantitative biotinylation approach. A standard curve was constructed with a purified MBP fusion protein containing αENaC sequence used to raise the antibody loaded in decreasing amounts on a SDS-PAGE gel and analyzed by Western blotting with anti-αENaC antibody (Fig. 7, A and B). Signal intensities measured by densitometry were linear between 5 and 20 fmol and were used to construct the standard curve (Fig. 7 B). Samples of total protein and plasma membrane protein recovered by biotinylation from A6 cells grown on filters in control conditions were loaded in parallel lanes of the same Western blot (Fig. 7 C). By comparison with the standard curve we estimated that the content of α subunit was 15.8 fmol in the total protein sample and 6.2 fmol in the cell-surface protein sample. These values allowed to calculate the total amounts recovered from the original 4.7-cm2 filters, which was 455 μg. Assuming a cell surface area of 100 μm2, the filter contained 4.7 × 10⁶ cells. Thus, the total protein sample loaded on the gel (19.5 μg) corresponds approximately to 0.29 × 10⁶ cells and the cell-surface protein sample (61 μg) corresponds to 0.63 × 10⁶ cells. This gives ∼4.7 × 10⁴ molecules of α subunit per cell and 0.6 × 10⁴ molecules in the membrane. If all molecules are forming channels and the stoichiometry of ENaC is 2α:1β:1γ (Firsov et al., 1998), each cell would have a total of 2.35 × 10⁴ channels, 0.3 × 10⁴ of them located in the plasma membrane. In other words, ∼13% of all the α subunits is expressed in the plasma membrane. This number is in agreement with previous results obtained with the A6 parental cell line (Weisz et al., 2000), where it was calculated that ∼20% of each of the subunits is in the plasma membrane. Thus, using a biochemical method to estimate the number of channels in the plasma membrane, we obtained a value that is approximately two orders of magnitude higher than the number of functional channels revealed by blocker-induced noise analysis. Nonetheless, it is important to highlight that this method involves many experimental steps that introduce errors in the quantification, as well as several assumptions that together render the final value somewhat inaccurate. We could not confirm our conclusions with data from the β and γ subunits because of difficulties in the purification of the MBP fusion proteins. Therefore, the results of our calculation should be regarded as a gross estimate rather than a precise value.
Figure 7.

Quantification of total and plasma membrane ENaC in A6 cells. We used cell surface biotinylation to obtain an estimate of the number of ENaCs endogenously expressed in the plasma membrane of A6 cells. (A) Coomassie blue staining of a SDS-PAGE with the product of MBP–αENaC fusion protein purification. Molecular mass (kD) of each of the standards is indicated on the left. (B) A serial dilution of the MBP–αENaC fusion protein was detected by Western blot with a polyclonal antibody against α subunit. Signal intensities were quantified with a densitometer and plotted against the amount of fusion protein in fmol. The signal was linear between 5 and 20 fmol. (C) Samples from total protein (T) and biotinylated plasma membrane proteins (PM) were loaded in the same gel used for the serial dilution of fusion protein.
xENaC Subunits Half-Life in the Plasma Membrane
It has been proposed that SGK1 decreases the rate of ENaC endocytosis by down-regulating Nedd4 ubiquitin ligase activity (Debonneville et al., 2001; Snyder et al., 2002). To test whether SGK1 changes the rate of endocytosis of ENaC, we examined the half-life of the channel subunits in the plasma membrane. We have shown previously that the three xENaC subunits have a half-life of ∼15 min in the apical membrane of A6 cells and that most of the endocytosed channels are subsequently degraded in lysosomes (Alvarez de la Rosa et al., 2002). Moreover, aldosterone does not affect the half-life of ENaC at the apical membrane. In the present study, we compared the three xENaC subunit half-lives in control cells and in cells treated with tetracycline by pulse-chase experiments of biotinylated apical plasma membrane proteins. After biotinylation at 4°C filters were returned to the incubator for different periods of time before cells were lysed and proteins were analyzed by Western blot with specific anti-xENaC subunits antibodies. Fig. 8 A shows typical Western blots of the degradation of apical xENaC subunits in control cells or in cells expressing SGKT S425D. Fig. 8 B shows plots of normalized signal intensities fitted to a single exponential. No statistical difference was observed between the two groups at any time point (n = 4–5). The calculated half-life was ∼16 min for α subunits, 15 min for β subunits, and 16 min for γ subunits, all consistent with previously reported values in A6 cells (Alvarez de la Rosa et al., 2002).
Figure 8.

xENaC subunits half-life in the plasma membrane. A6 cells were grown on filters, serum depleted, and treated overnight with 1 μg/ml of tetracycline. Apical membrane proteins were biotinylated at 4°C and then chased in serum-free medium for the indicated period of time (min). (A) Representative Western blots of biotinylated proteins recovered from the lysates of nontreated and tetracycline-treated cells and probed with antibodies against α, β, or γ xENaC subunits. The arrows on the left indicate migration of molecular mass markers (kD). (B) Time course of the decay in surface xENaC subunits. Data points are the mean ± SE of four to five independent experiments normalized to the values at time 0 fitted to a single exponential. There is no statistically significant difference between any of the data points in the two groups.
Effects of SGK1T S425D on the Rate of Synthesis of xENaC Subunits
The relatively small but significant increase (1.6- to 1.9-fold) in total and plasma membrane xENaC subunits (Fig. 6) could be due to an increased rate of synthesis, a decreased rate of degradation or a combination of both processes. We examined xENaC subunits rates of synthesis in cells expressing SGKT S425D and compared them with the rates of synthesis in cells stimulated overnight with aldosterone. Cells were metabolically labeled for 15 min and xENaC subunits were then immunoprecipitated with specific antibodies under conditions optimized for quantitative recovery of antigens. Immunoprecipitation products were separated on a SDS-PAGE and exposed to film. Fig. 9 A shows an autoradiograph of a representative experiment performed in triplicate. The three xENaC subunits migrate as single bands because during the 15-min labeling period posetranslational modification have not yet occurred (Alvarez de la Rosa et al., 2002). Fig. 9 B shows the average values obtained in five independent experiments normalized to control. Consistent with our previous results aldosterone increased the rate of synthesis of the three xENaC subunits by 3.4- to 9.4-fold, depending on the subunit (Alvarez de la Rosa et al., 2002). In contrast, SGK1T S425D did not significantly change the rate of synthesis of any of the subunits (Fig. 9 B).
Figure 9.
Aldosterone and SGKT S425D effects on xENaC subunits rate of synthesis. (A) A6 cells grown on filters and serum depleted were treated overnight with 100 nM aldosterone or 1 μg/ml of tetracycline as indicated. Cells were metabolically labeled with [35S]methionine and [35S]cysteine for 15 min and lysed immediately afterwards. xENaC α, β, and γ subunits were recovered from the lysates by immunoprecipitation with specific polyclonal antibodies. The products of each immunoprecipitation were separated in SDS-PAGE and detected by autoradiography. A representative experiment performed in triplicate for each condition is shown. Arrows indicate the migration of molecular mass markers (kD). (B) Quantification of relative changes in α, β, and γ ENaC subunit rate of synthesis. Bars represent the mean ± SE of the values obtained in five independent experiments normalized to control conditions. Solid bars correspond to values for α subunit, open bars correspond to values for β subunit, and hatched bars correspond to values for γ subunit. Asterisks represent statistically significant changes when compared with control conditions. *, P < 0.01 compared with control.
As changes in synthesis did not account for the small increase in steady-state abundance of xENaC subunits, we investigated the rate of degradation by conducting pulse-chase experiments in control or SGK1T S425D expressing cells. However, we were unable to detect a significant change in the half-life of any of the subunits (unpublished data), most likely because the expected increase was too small to be detected by the technique used.
xENaC Subunits Phosphorylation in the Absence or in the Presence of SGK1T S425D
To further investigate the mechanisms involved in SGK1 effects on ENaC, we studied whether expression of SGK1T S425D changes the state of phosphorylation of xENaC subunits. We compared subunit phosphorylation in cells treated overnight with aldosterone alone or with a combination of aldosterone and tetracycline. As we have described recently, aldosterone does not change the level of phosphorylation of xENaC subunits in A6 cells (Zhang et al., 2004), but it increases the abundance of subunits, markedly improving the signal to noise ratio in phosphorylation experiments. After treatment overnight and labeling with [32P]orthophosphate for 4 h, cells were lysed, and xENaC subunits were recovered by immunoprecipitation. The products were then separated on a SDS-PAGE and exposed to film. Fig. 10 A shows autoradiographies of representative experiments. Consistent with our previous observations, only the 65-kD band of the α-subunit appears to be phosphorylated (Zhang et al., 2004). Quantitative analysis of the data is shown in Fig. 10 B. Bars represent the average values obtained from three independent immunoprecipitation reactions normalized to the aldosterone conditions. No statistically significant change between the two conditions was detected (P values were 0.104, 0.540, and 0.103 for α, β, and γ, respectively). This experiment was repeated twice with similar results. Therefore, SGK1T S425D expression does not affect the phosphorylation levels of any of the three ENaC subunits in A6 cells. Nevertheless, there is a trend toward a small increase in phosphorylation in the three subunits. This is not surprising, since SGK1T S425D expression per se produces a small increase in the steady-state abundance of the three subunits (Fig. 6).
Figure 10.

SGKT S425D effects on xENaC subunits phosphorylation. (A) A6 cells grown on filters were treated overnight with 100 nM aldosterone or 100 nM aldosterone and 1 μg/ml of tetracycline. Each condition was performed in triplicate. Cells were metabolically labeled with [32P]orthophosphate for 4 h in the presence of aldosterone or a combination of aldosterone and tetracycline and then lysed in the presence of phosphatase inhibitors. xENaC α, β, and γ subunits were recovered from the lysates by immunoprecipitation with specific polyclonal antibodies. The products of each immunoprecipitation were separated in SDS-PAGE and detected by autoradiography. Representative examples of α, β, and γ immunoprecipitation products for each condition are shown. Arrows indicate the migration of molecular mass markers (kD). (B) Quantification of relative changes in α, β, and γ ENaC subunit phosphorylation. Bars represent the mean ± SE of the values obtained from three samples normalized to those obtained from cells treated with aldosterone (solid bars). Open bars correspond to values obtained from cells treated with aldosterone and tetracycline.
DISCUSSION
In this study we investigated the mechanism of ENaC regulation by SGK1 in renal epithelial A6 cells using a conditional SGK1 expression system (Alvarez de la Rosa and Canessa, 2003). We combined biophysical methods of noise analysis with biochemical methods of cell surface biotinylation and metabolic labeling. Noise analysis experiments assess only blocker-sensitive functional channels directly involved in transport at the apical membrane, whereas biochemical techniques estimate the number of channel subunits, regardless of whether they are involved in transport or not. This distinction is important for the interpretation of the results because the abundance of α subunits estimated to be present in the apical membranes far exceeds the number of functional channels involved in transport, even considering the uncertainties involved in our estimation. Accordingly, only a very small fraction of subunits present in the plasma membrane are involved directly in mediating sodium transport. Therefore, it is prudent to recognize that changes of subunit abundance measured biochemically reflect changes predominantly of nonfunctional subunits, which may or may not occur in parallel to those subunits actually involved in transport of sodium through functional channels. Previous studies measuring amiloride-sensitive currents and the abundance of cell-surface subunits in Xenopus oocytes and transfected MDCK cells, concluded that expression of ENaC subunits at the cell surface far exceeds the number of subunits involved in sodium transport (Firsov et al., 1996; Morris and Schafer, 2002), indicating that excess expression of subunits is not unique to A6 cells.
Taking into account this caveat, we compared the effects of aldosterone and SGK1 on N T, P o, and subunit abundance. Noise analysis showed that SGK1 stimulates transport by a fourfold increase of N T and a lesser but important 43% increase of P o. Biotinylation experiments revealed that SGK1 increases the steady-state abundance of total ENaC subunits in whole cells and in the apical membranes by 1.6- to 1.9-fold, without detectable changes in subunit synthesis or half-life in the membrane. However, such relatively small increases of subunit expression cannot alone account for the fourfold increases of N T. In contrast, aldosterone has been shown to increase ENaC N T without significant changes in P o (Helman et al., 1998) but with parallel increases in subunits synthesis and steady-state abundance (Alvarez de la Rosa et al., 2002). By mass law action it seems reasonable to expect that aldosterone increases the amount of subunits associated with apical membrane functional channels, in parallel with increases of subunits not associated with functional channels that reside not only in the apical membranes but also within the cells. To the extent that only a small proportion of the apical membrane subunits are associated with functional channels, it is virtually impossible to know with certainty whether the increases of functional channels were due to activation of channels already within apical membranes and/or by exocytic/endocytic trafficking of subunits to and/or from the apical membranes by examination of the biochemical data alone. Nevertheless, the observation that there is a parallel proportional increase of subunits and functional channel densities caused by aldosterone suggests that the increase of N T is due to increased subunit synthesis.
In contrast to aldosterone, it is necessary to invoke the idea that in addition to increasing P o, SGK1 activates non functional channels or channels with low P o already present in the apical membrane and/or alters the rate of insertion/retrieval of functional channels in the membrane. Given the large excess of subunits within the apical membrane and intracellular space, it is presently impossible to know which pools of subunits are depleted to account for the increase of N T. We measured the rate of subunits retrieval from the plasma membrane and found that it was not changed by SGK1T S425D, in contrast to the predicted decrease if SGK1 controls ENaC endocytosis (Kamynina and Staub, 2002). We cannot discard, however, the possibility that the overall rate of ENaC subunit endocytosis does not reflect the rate of endocytosis of channels involved in sodium transport. Accordingly, functional channels could be retrieved from the membrane at a different rate than nonfunctional subunits.
Changes in capacitance are commonly used as an index of change in membrane area. Increases of capacitance would allow for the possibility that increases of functional channels could be mediated by insertion of channels to the apical membrane. Therefore, we examined whether SGK1 changed apical membrane capacitance. Indeed, capacitance was increased 13.7% by SGK1 while N T was increased from a mean of 8.4 to 34.2 functional channels/100 μm2. Depending on vesicle size as noted previously in confocal imaging trafficking studies in A6 epithelia (Butterworth et al., 2001), increases of membrane area normalized to planar surface area would be expected to fall in the range of ∼1% and 20% if vesicle diameter ranged between 0.1 and 0.5 μm, respectively. To the extent that vesicles may contain more than one channel or none at all, and despite the fact that the observed increases of capacitance are in the range expected, it remains necessary to show that vesicles actually contain subunits at the appropriate stoichiometries and densities before concluding that SGK1 uses insertion of channels as a mechanism for regulation of apical membrane functional channel densities. It is also conceivable that the observed increase in capacitance reflects increased delivery of vesicles that expands membrane area without changes in ENaC subunit density. The 3-phosphoinositide-dependent protein kinase-1 (PDK1), which phosphorylates and activates SGK1 (Kobayashi and Cohen, 1999; Park et al., 1999), is known to play an essential role in regulating cell size. PDK-null mice are 40–50% smaller than control animals and the change in body size is due to a 35–60% reduction in cell volume (Lawlor et al., 2002). Therefore the change in capacitance in A6 cells could reflect cross-activation by SGK1T S425D of signaling pathways that control cell size.
As part of the effort to understand the molecular mechanisms involved in ENaC regulation by SGK1, we also studied whether the expression of the kinase induced phosphorylation of xENaC subunits. We observed that SGK1T S425D did not alter the phosphorylation of any of the three subunits. However, it is important to notice that these experiments compare phosphorylation levels of the entire pool of subunits, making it difficult to detect changes in phosphorylation that affect only a subset of subunits. Therefore, the possibility of phosphorylation of only the pool of channels that is activated by SGK1 cannot be ruled out completely.
The studies reported here illustrate the difficulty of combining biophysical and biochemical data to arrive at conclusions regarding mechanism of regulation of apical membrane transport. On one hand, the biophysical data indicate that a relatively small number of subunits, both absolutely and relative to those present within the cells and apical membranes, are actually involved in sodium transport. On the other hand, the high excess number of subunits that exists in various pools both within the apical membrane and the cytosol provides a background noise level that makes it difficult to determine the density of functional channels actually involved in transport. Nevertheless, it is important to know quantitatively the magnitude and changes in direction of the various pools of subunits in different membrane compartments. In this regard, it is clear that, unlike aldosterone, SGK1-induced increase in subunit densities is not proportional to the increase in N T. Moreover, SGK1 increases ENaC P o, whereas aldosterone does not affect it (Helman et al., 1998). Taken together, these observations indicate that the mechanisms involved in ENaC stimulation by SGK1 are different to those of aldosterone, at least in A6 cells. In contrast to aldosterone where stimulation of transport can be explained simply by increase of subunit synthesis, both in the early as well as in the late phase of the response (Alvarez de la Rosa et al., 2002), it is necessary to invoke at least three actions of SGK1: (1) increase of ENaC P o; (2) increase of subunit densities within apical membranes and intracellular compartments; and (3) activation of one or more pools of preexistent subunits/channels within the apical membranes and/or intracellular compartments. These results are consistent with our previous study showing that SGK1 and aldosterone effects on ENaC activity are additive in A6 cells (Alvarez de la Rosa and Canessa, 2003). This study raises additional questions for the understanding of SGK1 effects in sodium transport, especially concerning the nature of the modification and/or processes that increase ENaC N T and P o without parallel changes in steady-state subunit abundance.
Acknowledgments
We thank Dr. Joseph F. Hoffman for his comments on the manuscript.
This work was supported by a research fellowship from the National Kidney Foundation to D. Alvarez de la Rosa and by National Institutes of Health grant PO5-HL 55077 to C. Canessa.
Lawrence G. Palmer served as editor.
D. Alvarez de la Rosa's present address is Unidad de Farmacología, Facultad de Medicina, Universidad de La Laguna, 38071 La Laguna, Tenerife, Spain.
Abbreviations used in this paper: C eq*, equivalent cell capacitance; CDPC, 6-chloro-3,5-diamino-pyrazine-2-carboxamide; E/C, experimental vs. control ratio; ENaC, epithelial sodium channel; f c, corner-frequency; I Na, blocker-sensitive sodium currents; i Na, single-channel current; I sc, short-circuit current; KB, blocker equilibrium constant; k ob, blocker on rate coefficient; k bo, blocker off rate coefficient; N o, open channel density; N T, functional channel density; PDS, power density spectra; PDK1, 3-phosphoinositide-dependent protein kinase-1; P o, open probability; RT, transepithelial electrical resistance; SGK1, serum and glucocorticoid-induced kinase 1; SGK1T S425D, transfected constitutively active kinase SGK1; S o, low-frequency plateau value; TetO, tetracycline operator; TetR, tetracycline repressor; Voc, transepithelial open-circuit voltage; xENaC, Xenopus laevis epithelial sodium channel; Zmeas, measured impedance; Z T, transepithelial electrical impedance.
References
- Abramcheck, F.J., W. Van Driessche, and S.I. Helman. 1985. Autoregulation of apical membrane Na+ permeability of tight epithelia. Noise analysis with amiloride and CGS 4270. J. Gen. Physiol. 85:555–582. [DOI] [PMC free article] [PubMed] [Google Scholar]
- Alvarez de la Rosa, D., and C.M. Canessa. 2003. Role of SGK in hormonal regulation of epithelial sodium channel in A6 cells. Am. J. Physiol. Cell Physiol. 284:C404–C414. [DOI] [PubMed] [Google Scholar]
- Alvarez de la Rosa, D., P. Zhang, A. Naray-Fejes-Toth, G. Fejes-Toth, and C.M. Canessa. 1999. The serum and glucocorticoid kinase sgk increases the abundance of epithelial sodium channels in the plasma membrane of Xenopus oocytes. J. Biol. Chem. 274:37834–37839. [DOI] [PubMed] [Google Scholar]
- Alvarez de la Rosa, D., H. Li, and C.M. Canessa. 2002. Effects of aldosterone on biosynthesis, traffic, and functional expression of epithelial sodium channels in A6 cells. J. Gen. Physiol. 119:427–442. [DOI] [PMC free article] [PubMed] [Google Scholar]
- Alvarez de la Rosa, D., T. Coric, N. Todorovic, D. Shao, T. Wang, and C.M. Canessa. 2003. Distribution and regulation of expression of serum- and glucocorticoid-induced kinase-1 in the rat kidney. J. Physiol. 551:455–466. [DOI] [PMC free article] [PubMed] [Google Scholar]
- Baxendale-Cox, L.M., R.L. Duncan, X. Liu, K. Baldwin, W.J. Els, and S.I. Helman. 1997. Steroid hormone-dependent expression of blocker-sensitive ENaCs in apical membranes of A6 epithelia. Am. J. Physiol. 273:C1650–C1656. [DOI] [PubMed] [Google Scholar]
- Bhargava, A., M.J. Fullerton, K. Myles, T.M. Purdy, J.W. Funder, D. Pearce, and T.J. Cole. 2001. The serum- and glucocorticoid-induced kinase is a physiological mediator of aldosterone action. Endocrinology. 142:1587–1594. [DOI] [PubMed] [Google Scholar]
- Blazer-Yost, B.L., T.G. Paunescu, S.I. Helman, K.D. Lee, and C.J. Vlahos. 1999. Phosphoinositide 3-kinase is required for aldosterone-regulated sodium reabsorption. Am. J. Physiol. 277:C531–C536. [DOI] [PubMed] [Google Scholar]
- Butterworth, M.B., S.I. Helman, and W.J. Els. 2001. cAMP-sensitive endocytic trafficking in A6 epithelia. Am. J. Physiol. Cell Physiol. 280:C752–C762. [DOI] [PubMed] [Google Scholar]
- Chen, S.Y., A. Bhargava, L. Mastroberardino, O.C. Meijer, J. Wang, P. Buse, G.L. Firestone, F. Verrey, and D. Pearce. 1999. Epithelial sodium channel regulated by aldosterone-induced protein sgk. Proc. Natl. Acad. Sci. USA. 96:2514–2519. [DOI] [PMC free article] [PubMed] [Google Scholar]
- Debonneville, C., S.Y. Flores, E. Kamynina, P.J. Plant, C. Tauxe, M.A. Thomas, C. Munster, A. Chraibi, J.H. Pratt, J.D. Horisberger, et al. 2001. Phosphorylation of Nedd4-2 by Sgk1 regulates epithelial Na(+) channel cell surface expression. EMBO J. 20:7052–7059. [DOI] [PMC free article] [PubMed] [Google Scholar]
- Els, W.J., and S.I. Helman. 1997. Dual role of prostaglandins (PGE2) in regulation of channel density and open probability of epithelial Na+ channels in frog skin (R. pipiens). J. Membr. Biol. 155:75–87. [DOI] [PubMed] [Google Scholar]
- Els, W.J., X. Liu, and S.I. Helman. 1998. Differential effects of phorbol ester (PMA) on blocker-sensitive ENaCs of frog skin and A6 epithelia. Am. J. Physiol. 275:C120–C129. [DOI] [PubMed] [Google Scholar]
- Faletti, C.J., N. Perrotti, S.I. Taylor, and B.L. Blazer-Yost. 2002. sgk: an essential convergence point for peptide and steroid hormone regulation of ENaC-mediated Na+ transport. Am. J. Physiol. Cell Physiol. 282:C494–C500. [DOI] [PubMed] [Google Scholar]
- Farjah, M., B.P. Roxas, D.L. Geenen, and R.S. Danziger. 2003. Dietary salt regulates renal SGK1 abundance: relevance to salt sensitivity in the Dahl rat. Hypertension. 41:874–878. [DOI] [PubMed] [Google Scholar]
- Firsov, D., L. Schild, I. Gautschi, A.M. Merillat, E. Schneeberger, and B.C. Rossier. 1996. Cell surface expression of the epithelial Na channel and a mutant causing Liddle syndrome: a quantitative approach. Proc. Natl. Acad. Sci. USA. 93:15370–15375. [DOI] [PMC free article] [PubMed] [Google Scholar]
- Firsov, D., I. Gautschi, A.M. Merillat, B.C. Rossier, and L. Schild. 1998. The heterotetrameric architecture of the epithelial sodium channel (ENaC). EMBO J. 17:344–352. [DOI] [PMC free article] [PubMed] [Google Scholar]
- Helman, S.I., and L.M. Baxendale. 1990. Blocker-related changes of channel density. Analysis of a three-state model for apical Na channels of frog skin. J. Gen. Physiol. 95:647–678. [DOI] [PMC free article] [PubMed] [Google Scholar]
- Helman, S.I., and X. Liu. 1997. Substrate-dependent expression of Na+ transport and shunt conductance in A6 epithelia. Am. J. Physiol. 273:C434–C441. [DOI] [PubMed] [Google Scholar]
- Helman, S.I., X. Liu, K. Baldwin, B.L. Blazer-Yost, and W.J. Els. 1998. Time-dependent stimulation by aldosterone of blocker-sensitive ENaCs in A6 epithelia. Am. J. Physiol. 274:C947–C957. [DOI] [PubMed] [Google Scholar]
- Huang, D.Y., P. Wulff, H. Volkl, J. Loffing, K. Richter, D. Kuhl, F. Lang, and V. Vallon. 2004. Impaired regulation of renal K+ elimination in the sgk1-knockout mouse. J. Am. Soc. Nephrol. 15:885–891. [DOI] [PubMed] [Google Scholar]
- Kamynina, E., and O. Staub. 2002. Concerted action of ENaC, Nedd4-2, and Sgk1 in transepithelial Na(+) transport. Am. J. Physiol. Renal Physiol. 283:F377–F387. [DOI] [PubMed] [Google Scholar]
- Kobayashi, T., and P. Cohen. 1999. Activation of serum- and glucocorticoid-regulated protein kinase by agonists that activate phosphatidylinositide 3-kinase is mediated by 3-phosphoinositide-dependent protein kinase-1 (PDK1) and PDK2. Biochem. J. 339:319–328. [PMC free article] [PubMed] [Google Scholar]
- Lang, F., K. Klingel, C.A. Wagner, C. Stegen, S. Warntges, B. Friedrich, M. Lanzendorfer, J. Melzig, I. Moschen, S. Steuer, et al. 2000. Deranged transcriptional regulation of cell-volume-sensitive kinase hSGK in diabetic nephropathy. Proc. Natl. Acad. Sci. USA. 97:8157–8162. [DOI] [PMC free article] [PubMed] [Google Scholar]
- Lawlor, M.A., A. Mora, P.R. Ashby, M.R. Williams, V. Murray-Tait, L. Malone, A.R. Prescott, J.K. Lucocq, and D.R. Alessi. 2002. Essential role of PDK1 in regulating cell size and development in mice. EMBO J. 21:3728–3738. [DOI] [PMC free article] [PubMed] [Google Scholar]
- Morris, R.G., and J.A. Schafer. 2002. cAMP increases density of ENaC subunits in the apical membrane of MDCK cells in direct proportion to amiloride-sensitive Na(+) transport. J. Gen. Physiol. 120:71–85. [DOI] [PMC free article] [PubMed] [Google Scholar]
- Naray-Fejes-Toth, A., C. Canessa, E.S. Cleaveland, G. Aldrich, and G. Fejes-Toth. 1999. sgk is an aldosterone-induced kinase in the renal collecting duct. Effects on epithelial Na+ channels. J. Biol. Chem. 274:16973–16978. [DOI] [PubMed] [Google Scholar]
- Park, J., M.L. Leong, P. Buse, A.A. Maiyar, G.L. Firestone, and B.A. Hemmings. 1999. Serum and glucocorticoid-inducible kinase (SGK) is a target of the PI 3-kinase-stimulated signaling pathway. EMBO J. 18:3024–3033. [DOI] [PMC free article] [PubMed] [Google Scholar]
- Paunescu, T.G., and S.I. Helman. 2001. PGE(2) activation of apical membrane Cl(−) channels in A6 epithelia: impedance analysis. Biophys. J. 81:852–866. [DOI] [PMC free article] [PubMed] [Google Scholar]
- Paunescu, T.G., B.L. Blazer-Yost, C.J. Vlahos, and S.I. Helman. 2000. LY-294002-inhibitable PI 3-kinase and regulation of baseline rates of Na(+) transport in A6 epithelia. Am. J. Physiol. Cell Physiol. 279:C236–C247. [DOI] [PubMed] [Google Scholar]
- Pearce, D. 2001. The role of SGK1 in hormone-regulated sodium transport. Trends Endocrinol. Metab. 12:341–347. [DOI] [PubMed] [Google Scholar]
- Setiawan, I., G. Henke, Y. Feng, C. Bohmer, L.A. Vasilets, W. Schwarz, and F. Lang. 2002. Stimulation of Xenopus oocyte Na(+),K(+)ATPase by the serum and glucocorticoid-dependent kinase sgk1. Pflugers Arch. 444:426–431. [DOI] [PubMed] [Google Scholar]
- Shigaev, A., C. Asher, H. Latter, H. Garty, and E. Reuveny. 2000. Regulation of sgk by aldosterone and its effects on the epithelial Na(+) channel. Am. J. Physiol. Renal Physiol. 278:F613–F619. [DOI] [PubMed] [Google Scholar]
- Shimkets, R.A., R. Lifton, and C.M. Canessa. 1998. In vivo phosphorylation of the epithelial sodium channel. Proc. Natl. Acad. Sci. USA. 95:3301–3305. [DOI] [PMC free article] [PubMed] [Google Scholar]
- Snyder, P.M., D.R. Olson, and B.C. Thomas. 2002. Serum and glucocorticoid-regulated kinase modulates Nedd4-2-mediated inhibition of the epithelial Na+ channel. J. Biol. Chem. 277:5–8. [DOI] [PubMed] [Google Scholar]
- Staub, O., I. Gautschi, T. Ishikawa, K. Breitschopf, A. Ciechanover, L. Schild, and D. Rotin. 1997. Regulation of stability and function of the epithelial Na+ channel (ENaC) by ubiquitination. EMBO J. 16:6325–6336. [DOI] [PMC free article] [PubMed] [Google Scholar]
- Valentijn, J.A., G.K. Fyfe, and C.M. Canessa. 1998. Biosynthesis and processing of epithelial sodium channels in Xenopus oocytes. J. Biol. Chem. 273:30344–30351. [DOI] [PubMed] [Google Scholar]
- Vuagniaux, G., V. Vallet, N.F. Jaeger, E. Hummler, and B.C. Rossier. 2002. Synergistic activation of ENaC by three membrane-bound channel-activating serine proteases (mCAP1, mCAP2, and mCAP3) and serum- and glucocorticoid-regulated kinase (Sgk1) in Xenopus oocytes. J. Gen. Physiol. 120:191–201. [DOI] [PMC free article] [PubMed] [Google Scholar]
- Weisz, O.A., J.M. Wang, R.S. Edinger, and J.P. Johnson. 2000. Non-coordinate regulation of endogenous epithelial sodium channel (ENaC) subunit expression at the apical membrane of A6 cells in response to various transporting conditions. J. Biol. Chem. 275:39886–39893. [DOI] [PubMed] [Google Scholar]
- Wulff, P., V. Vallon, D.Y. Huang, H. Volkl, F. Yu, K. Richter, M. Jansen, M. Schlunz, K. Klingel, J. Loffing, et al. 2002. Impaired renal Na(+) retention in the sgk1-knockout mouse. J. Clin. Invest. 110:1263–1268. [DOI] [PMC free article] [PubMed] [Google Scholar]
- Zhang, Y.H., D. Alvarez de la Rosa, C.M. Canessa, and J.P. Hayslett. 2004. Insulin-induced phosphorylation of ENaC correlates with increased sodium channel function in A6 cells. Am J Physiol Cell Physiol. 101152/ajpcell.00343.2004. [DOI] [PubMed]