Abstract
Recent studies have shown that microRNA (miRNA) regulates gene expression by repressing translation or directing sequence-specific degradation of complementary mRNA. Here, we report new evidence in which miRNA may also function to induce gene expression. By scanning gene promoters in silico for sequences complementary to known miRNAs, we identified a putative miR-373 target site in the promoter of E-cadherin. Transfection of miR-373 and its precursor hairpin RNA (pre-miR-373) into PC-3 cells readily induced E-cadherin expression. Knockdown experiments confirmed that induction of E-cadherin by pre-miR-373 required the miRNA maturation protein Dicer. Further analysis revealed that cold-shock domain-containing protein C2 (CSDC2), which possesses a putative miR-373 target site within its promoter, was also readily induced in response to miR-373 and pre-miR-373. Furthermore, enrichment of RNA polymerase II was detected at both E-cadherin and CSDC2 promoters after miR-373 transfection. Mismatch mutations to miR-373 indicated that gene induction was specific to the miR-373 sequence. Transfection of promoter-specific dsRNAs revealed that the concurrent induction of E-cadherin and CSDC2 by miR-373 required the miRNA target sites in both promoters. In conclusion, we have identified a miRNA that targets promoter sequences and induces gene expression. These findings reveal a new mode by which miRNAs may regulate gene expression.
Keywords: E-cadherin, miRNA
Small double-stranded RNAs (dsRNAs) are known to be the trigger of RNA interference (RNAi) (1, 2). MicroRNAs (miRNAs) are a group of small noncoding RNAs (ncRNAs) that serve as endogenous sources of dsRNA. In a manner similar to the way they use RNAi, cells use miRNAs to negatively regulate gene expression by repressing translation or directing sequence-specific degradation of target mRNAs (3–6). In this regard, miRNAs are considered to be key regulators of gene expression.
We reported in ref. 7 that synthetic dsRNAs targeting promoter regions induce gene expression, a phenomenon referred to as RNA activation (RNAa). Others have since observed similar results (8). RNAa induces predictable changes in phenotype and affects downstream gene expression in response to targeted gene induction (7, 8). Much like RNAi, RNAa can manipulate gene expression to alter cellular pathways and change cell physiology.
MicroRNAs play important roles in numerous cellular processes including development, proliferation, and apoptosis (9). Cancer development has also been linked to alterations in miRNA expression patterns (10–12). It is currently believed that miRNAs elicit their effect by silencing the expression of target genes (13). However, in a manner similar to RNAa, miRNAs may also function to positively regulate gene expression. To determine whether miRNAs can induce gene expression, we scanned gene promoters for sequences highly complementary to known miRNAs and identified miR-373 target sites in the promoters of E-cadherin and CSDC2 (cold shock domain-containing protein C2). We observed robust induction of both E-cadherin and CSDC2 in response to miR-373. In this study, we identify a new potential function for miRNA in regulating gene expression.
Results
miR-373 Targets the E-Cadherin Promoter to Induce Gene Expression.
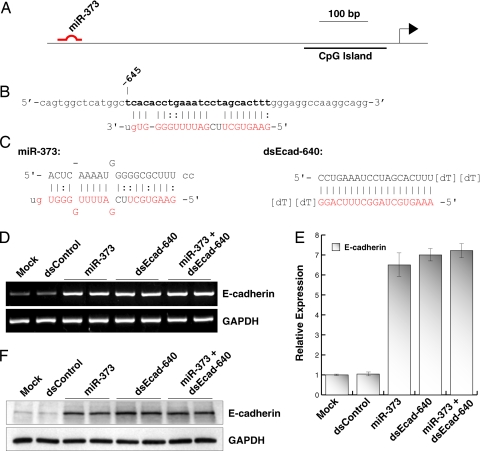
We reported in ref. 7 that E-cadherin is susceptible to gene induction by targeting promoter sequences with small dsRNA molecules. This prompted us to speculate that miRNAs complementary to sequences in the E-cadherin promoter may also induce gene expression. We scanned 1 kb of E-cadherin promoter for sites complementary to known miRNAs, using online RegRNA software (available at http://regrna.mbc.nctu.edu.tw) (14). This software is designed to scan input RNA sequences for regulatory motifs and miRNA target sites. However, by simply plugging in promoter sequence, the software can also identify putative sites complementary to miRNAs in DNA strands. Scanning analysis revealed a sequence located at position −645 relative to the transcription start site in the E-cadherin promoter highly complementary to miR-373 (Fig. 1 A and B). We therefore synthesized the native mature duplex of miR-373, and another dsRNA molecule (dsEcad-640) fully complementary to the putative miR-373 target site (Fig. 1C). We also designed and synthesized a control dsRNA (dsControl) that lacked significant homology to all known human sequences. We transfected each dsRNA duplex into PC-3 prostate cancer cells and analyzed E-cadherin expression 72 h later. Analysis of mRNA expression revealed a profound induction in E-cadherin levels after miR-373 and dsEcad-640 transfections (Fig. 1D). Compared with mock transfections, both miR-373 and dsEcad-640 increased E-cadherin levels by ≈7-fold (Fig. 1E). Interestingly, the combination transfection of miR-373 and dsEcad-640 did not further increase E-cadherin expression implying that both dsRNA molecules are, in fact, targeting the same site (Fig. 1 D and E). Induction of E-cadherin was further confirmed by immunoblot analysis. As shown in Fig. 1F, elevated levels of E-cadherin protein strongly correlate to the increase in E-cadherin mRNA expression. These results suggest that miR-373 induces gene expression by targeting the E-cadherin promoter.
Fig. 1.
miR-373 induces gene expression by targeting a complementary sequence in the E-cadherin promoter. (A) Schematic representation of the E-cadherin promoter and its CpG island. Indicated is the location of the miR-373 target site. (B) Sequence of the miR-373 target site located at nucleotide −645 relative to the transcription start site. Bases in boldface indicate the target site in the sense strand of promoter DNA. The sequence in red corresponds to those bases in miR-373 that are complementary to the target site, including G:U/T wobble base-pairing. (C) Sequence and structure of miR-373 and dsEcad-640. Lowercase letters in both strands of miR-373 correspond to the native two-base 3′ overhangs. Sequences in red correspond to those bases that are complementary to the target site. (D) PC-3 cells were transfected with 50 nM concentrations of the indicated dsRNAs for 72 h. Combination treatment of miR-373 and dsEcad-640 (miR-373 + dsEcad-640) was performed by transfecting at 50 nM each dsRNA. Mock samples were transfected in the absence of dsRNA. E-cadherin and GAPDH mRNA expression levels were assessed by standard RT-PCR. GAPDH served as a loading control. (E) Relative expression of E-cadherin was determined by real-time PCR (mean ± standard error from four independent experiments). Values of E-cadherin were normalized to GAPDH. (F) Induction of E-cadherin protein was confirmed by immunoblot analysis. GAPDH was also detected and served as a loading control.
miR-373 Biogenesis Is Required for E-Cadherin Induction.
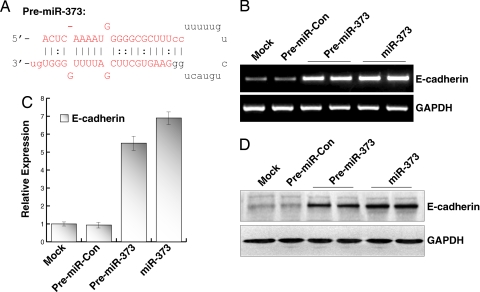
Functionally mature miRNAs are processed from precursor miRNA (pre-miRNA) hairpins by the RNase III enzyme Dicer (15). To determine whether the precursor to miR-373 (pre-miR-373) can facilitate E-cadherin induction, we synthesized the native RNA sequence of pre-miR-373 (Fig. 2A) and transfected it into PC-3 cells. We also transfected cells with a nonspecific pre-miRNA (pre-miR-Con) to serve as a control. Seventy-two hours after transfection, pre-miR-373 caused a significant induction in E-cadherin mRNA expression similar to miR-373 treatments (Fig. 2B). Compared with mock transfections, pre-miR-373 and miR-373 increased E-cadherin mRNA levels by ≈5.5- and ≈7-fold, respectively (Fig. 2C). Immunoblot analysis also revealed a robust increase in E-cadherin protein levels (Fig. 2D). Overall, no changes in E-cadherin expression were detected in cells transfected with mock, dsControl, or pre-miR-Con controls.
Fig. 2.
Pre-miR-373 induces E-cadherin expression. (A) Sequence of the miR-373 precursor hairpin RNA (pre-miR-373). Bases in red indicate the mature sequence of the miR-373 duplex. (B) PC-3 cells were transfected at 50 nM pre-miR-Con, pre-miR-373, or miR-373 for 72 h. E-cadherin and GAPDH mRNA expression levels were assessed by standard RT-PCR. (C) Relative expression was determined by real-time PCR (mean ± standard error from four independent experiments). Values of E-cadherin were normalized to GAPDH. (D) E-cadherin and GAPDH protein levels were detected by immunoblot analysis. GAPDH served as a loading control.
We also evaluated cellular levels of miR-373 by real-time PCR to quantify miR-373 in transfected cells. As shown in supporting information (SI) Fig. 7A, robust levels of miR-373 were detected in miR-373 and pre-miR-373 transfected cells; miR-373 was ≈30,000 times greater in transfected cells than control samples. Such levels are comparable to those found in Tera-1 cells (SI Fig. 7B), a cell line known to express endogenous miR-373 (16). This data indicates that miR-373 approaches relevant cellular levels after transfection and correlates with the induction of E-cadherin in PC-3 cells.
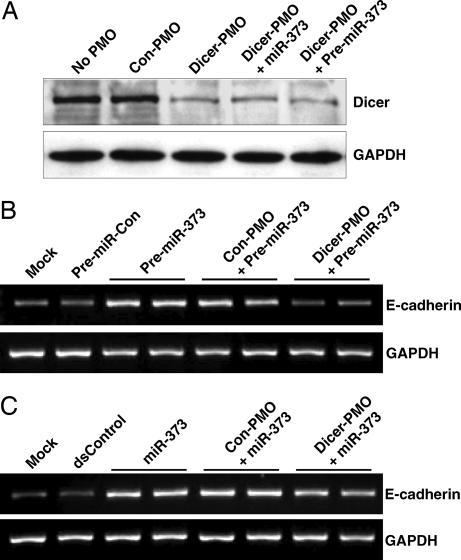
To determine whether E-cadherin induction by pre-miR-373 required the Dicer protein, we synthesized an antisense phosphorodiamidate morpholino oligonucleotide (PMO) targeting the translation initiation site in the Dicer mRNA to obstruct protein synthesis. This technique, as an alternative to RNAi, allowed for the knockdown of Dicer function without using any endogenous enzymatic machinery that may also be required for miRNA-induced gene expression. As shown in Fig. 3A, immunoblot analysis validated the effectiveness of Dicer knockdown by antisense PMO (Dicer-PMO). Further analysis of E-cadherin expression revealed that Dicer-PMO completely inhibited E-cadherin induction after pre-miR-373 transfection (Fig. 3B), whereas miR-373 retained the ability to activate E-cadherin (Fig. 3C). This data suggests that biogenesis of pre-miR-373 by Dicer is required to induce E-cadherin expression.
Fig. 3.
Dicer is required for E-cadherin induction by pre-miR-373. (A) PC-3 cells were treated with Dicer-PMO or Con-PMO for 48 h. No PMO treatments were performed in absence of PMO molecules. Cells cotreated with miR-373 or pre-miR-373 were transfected 24 h after initial PMO treatments. Total protein was extracted and levels of Dicer and GAPDH were determined by immunoblot analysis. GAPDH served as a loading control. (B) PC-3 cells were treated with or without Dicer-PMO or Con-PMO. The following day, cells were transfected with 50 nM pre-miR-Con or pre-miR-373 for 72 h. E-cadherin and GAPDH mRNA expression levels were assessed by standard RT-PCR. (C) PC-3 cells were treated with the indicated PMO molecules. The following day, cells were transfected at 50 nM dsControl or miR-373 for 72 h. E-cadherin and GAPDH mRNA expression levels were assessed by standard RT-PCR.
miR-373 Induces the Expression of CSDC2.
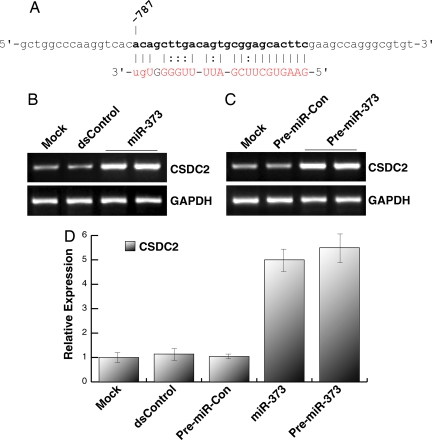
MicroRNAs elicit pleiotropic effects by silencing multiple transcripts (17). Likewise, miRNAs may also target similar sequences in gene promoters to activate the expression of multiple genes. To determine whether miR-373 can induce the expression of other genes, we used the open-source miRNA target prediction algorithm, miRanda (18), to scan 1 kb of promoter sequence from every gene in the human genome for sites highly complementary to miR-373. Our results yielded >372 genes with promoter sequences complementary to miR-373. We selected 12 genes from the list with known function that had the greatest overall sequence complementarity to miR-373 at promoter sites (SI Table 1). We transfected PC-3 cells with miR-373 or pre-miR-373 and analyzed mRNA expression. As shown in Fig. 4 A–C, miR-373 and pre-miR-373 readily induced the expression of target gene CSDC2; a putative miR-373 target site existing at nucleotide −787 relative to the transcription start site in the CSDC2 promoter. Compared with mock transfections, miR-373 and pre-miR-373 induced CSDC2 expression levels by ≈5- and ≈5.2-fold, respectively (Fig. 4D). These results suggest that similar target sequences in gene promoters may allow miRNAs to induce the expression of multiple genes.
Fig. 4.
miR-373 induces the expression of CSDC2. (A) Sequence of the miR-373 target site located at nucleotide −787 relative to the transcription start site in the CSDC2 promoter. Bases in boldface indicate the putative target site in the sense strand of promoter DNA. The sequence in red corresponds to those bases in miR-373 that are complementary to the target site, including G:U/T wobble base-pairing. (B) PC-3 cells were transfected at 50 nM dsControl or miR-373 for 72 h. Expression of CSDC2 and GAPDH was determined by standard RT-PCR. GAPDH served as a loading control. (C) CSDC2 and GAPDH expression levels were also determined in PC-3 cells after mock, pre-miR-Con, or pre-miR-373 transfections. (D) Relative expression of CSDC2 was determined by real-time PCR (mean ± standard error from four independent experiments). Values of CSDC2 were normalized to GAPDH.
Transfection of miR-373 and pre-miR-373 was also performed in HCT-116 (colorectal carcinoma) and LNCaP (prostate carcinoma) cell lines. Although E-cadherin levels did not change in HCT-116 cells, CSDC2 expression was readily induced in response to both miR-373 and pre-miR-373 transfections (SI Fig. 8A). However, neither E-cadherin nor CSDC2 were induced by miR-373 or pre-miR-373 in LNCaP cells (SI Fig. 8B). This data indicates that miR-373 differentially activates target genes in different cell lines.
Enrichment of RNA Polymerase II at miR-373-Targeted Gene Promoters.
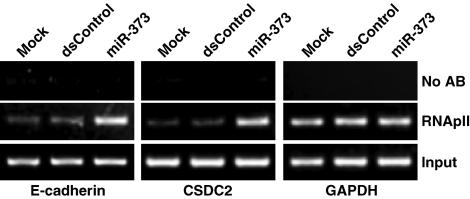
To determine whether enrichment of RNA polymerase II (RNApII) at targeted gene promoters was associated with miR-373-induced gene expression, we performed chromatin immunoprecipitation (ChIP) assays, using an antibody specific to RNApII. We mapped three regions corresponding to the transcription start sites of E-cadherin, CSDC2, and GAPDH. Analysis of the GAPDH promoter served as an internal control for RNApII binding. As shown in Fig. 5, mock and dsControl treatments were associated with low levels of RNApII binding; however, after miR-373 transfection, RNApII density increased at the transcription start sites of E-cadherin and CSDC2. RNApII levels at the GAPDH core promoter did not change in any treatment (Fig. 5). These results indicate that enrichment of RNApII at targeted gene promoters is associated with miR-373-induced gene expression.
Fig. 5.
Enrichment of RNApII at miR-373-targeted promoters. PC-3 cells were transfected with mock, dsControl, or miR-373 for 72 h. ChIP assays were performed by using an RNApII-specific antibody to immunoprecipitate transcriptionally active regions of DNA. The purified DNA was amplified by PCR, using primer sets specific to the transcriptional start sites of E-cadherin, CSDC2, or GAPDH. DNA pulled down in the absence of antibody (No AB) served to identify background amplification. Input DNA was amplified as a loading control.
Sequence Specificity for Gene Induction by miR-373.
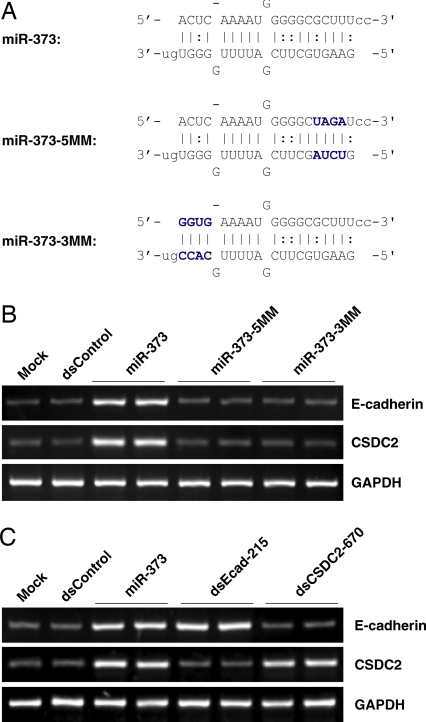
To determine whether induction of E-cadherin and CSDC2 was specific to the sequence of miR-373, we synthesized two miR-373 mutants to create mismatches with the target sites. Mutation to 4 bases at the 5′ end (relative to the antisense strand) or 3′ end of miR-373 resulted in mutant derivatives miR-373–5MM and miR-373–3MM, respectively (Fig. 6A). As shown in Fig. 6B, neither miR-373–5MM nor miR-373–3MM were capable of inducing E-cadherin or CSDC2 expression. We also cotransfected cells with a complementary oligonucleotide (anti-miR-373) designed specifically to bind and sequester mature miR-373 sequence activity. Although transfection of a nonspecific control oligonucleotide (anti-miR-Con) had no impact on miR-373-induced gene expression, anti-miR-373 blocked E-cadherin and CSDC2 induction by both miR-373 and pre-miR-373 (SI Fig. 9). Taken together, these results indicate that the induction of E-cadherin and CSDC2 was specific to the sequence of miR-373.
Fig. 6.
Sequence specificity for miR-373. (A) Mutations to four of the first or last base pairs in miR-373 resulted in miR-373–5MM and miR-373–3MM, respectively. The mutated bases are shown in blue. (B) PC-3 cells were transfected at 50 nM each indicated miRNA duplex. Expression of E-cadherin, CSDC2, and GAPDH were assessed by standard RT-PCR. GAPDH served as a loading control. (C) dsRNAs targeting divergent sites in either the E-cadherin or CSDC2 promoter specifically induce the expression of only the target gene. PC-3 cells were transfected with dsControl, miR-373, dsEcad-215, or dsCSDC2–670 for 72 h, as indicated. E-cadherin, CSDC2, and GAPDH mRNA expression levels were determined by standard RT-PCR.
Both miR-373 target sites in the E-cadherin and CSDC2 promoters are similar in sequence. To determine whether targeting nonsimilar sequences would result in selective induction of only the target gene, we created two dsRNA molecules that specifically targeted the E-cadherin (dsEcad-215) or CSDC2 (dsCSDC2–670) promoter at different sites. We reported in ref. 7 that dsEcad-215 readily induced the expression of E-cadherin by targeting sequence −215 relative to the transcription start site in the E-cadherin promoter. Using similar criteria for dsRNA design, dsCSDC2–670 was created to target position −670 relative to the transcription start site in the CSDC2 promoter and induce CSDC2 expression. Whereas transfection of miR-373 readily induced the expression of both genes, dsEcad-215 and dsCSDC2–670 only activated the expression of E-cadherin and CSDC2, respectively (Fig. 6C). By targeting divergent sites in both promoters, gene induction was specifically limited to only targeted genes. These results suggest that activation of E-cadherin and CSDC2 occurs because miR-373 specifically targets similar sequences in the promoters of both genes.
Contrary to miR-373 and dsEcad-640 cotreatments (Fig. 1 D and E), the combination transfection of miR-373 and dsEcad-215 additively enhanced E-cadherin levels (SI Fig. 10). By targeting separated sites in the E-cadherin promoter, miR-373 and dsEcad-215 both contributed to E-cadherin induction.
Discussion
We reported in ref. 7 that small dsRNAs targeting the promoters of E-cadherin, p21WAF1/CIP1, and vascular endothelial growth factor (VEGF) readily activate gene expression. Shortly thereafter, Janowski et al. (8) described the induction of progesterone receptor (PR) and major vault protein (MVP) by promoter-targeting dsRNAs. These reports indicate an unexpected ability small dsRNAs have to induce gene expression. Just as miRNAs have been found to be the natural facilitator of RNAi (3), we speculated that miRNAs might also function to trigger RNAa. Our first clue came from our original dsRNA mutation experiments, in which mismatches between dsRNA and targeted promoter sequences were still capable of inducing gene expression (7). This feature is remarkably similar to miRNA target recognition; natural mismatches between target transcripts and miRNAs are quite common and tolerable in gene silencing mechanisms (19).
In the present study, we identify two genes (E-cadherin and CSDC2) that possess target sites highly complementary to miR-373 within their promoters. Transfection of miR-373 or its precursor hairpin RNA (pre-miR-373) readily induced the expression of both genes. Several lines of evidence indicate that gene induction was specific for miR-373 and the targeted promoter sites. (i) No modifications to miR-373 or pre-miR-373 sequences were required for experimental success. We synthesized native miR-373 molecules to ensure we were analyzing natural miR-373 sequence function. (ii) Nonspecific control molecules (dsControl and pre-miR-Con) did not impact target gene expression. (iii) Combination treatment of miR-373 and dsEcad-640 did not further enhance E-cadherin expression; both dsRNAs targeted the same site in the E-cadherin promoter. Cotreatment with miR-373 and dsEcad-215, molecules targeting separated sites in the E-cadherin promoter, additively increased gene expression. (iv) Activity required complementarity with target sequences. Mutation to nucleotides involved in target recognition completely prevented gene induction by miR-373. Although we previously reported that mutations to the 3′ end of dsRNAs were tolerable for RNAa (7), we suspect that the additional wobble base-pairs, bulges, and mismatches that exist between miR-373 and the targeted promoter sites further enhanced the inactivity of miR-373–3MM. (v) Cotransfection with an inhibitory oligonucleotide (anti-miR-373) designed specifically to bind and sequester mature miR-373 sequence activity suppressed target gene induction. (vi) Selective activation of E-cadherin or CSDC2 was achieved by targeting different sites in the promoter of either gene. This alleviates the possibility that gene induction by miR-373 was the result of an off-target-mediated phenomenon (e.g., silencing the expression of a transcriptional repressor protein) and suggests that the concurrent activation of E-cadherin and CSDC2 by miR-373 was specific for the miRNA target sites in both gene promoters.
It is important to note that not all genes with promoter sequences complementary to miR-373 were induced in response to miR-373 transfection. For instance, GAA (acid α-glucosidase) and RBKS (ribokinase) both contain miR-373 complementary sequences within their promoters; however, transfection of miR-373 into PC-3 cells did not induce the expression of either gene (data not shown). We have previously reported that intrinsic conditions within targeted gene promoters (e.g., DNA methylation) can impair gene induction by RNAa (7). It is possible that differences in promoter environments from one cell type to another may affect the number of target genes induced by miRNAs. For instance, although GAA and RBKS are unresponsive to miR-373 in PC-3 cells, they may be activated by miRNA in other cell types where promoter conditions are optimal for gene induction. Direct examples of differential induction of target genes were observed in PC-3, HCT-116, and LNCaP cells, in which E-cadherin and CSDC2 were differentially susceptible to gene induction by miR-373.
Although Tera-1 cells express robust levels of miR-373, transfection of anti-miR-373 had no impact on E-cadherin or CSDC2 expression (data not shown); neither E-cadherin nor CSDC2 appear to be regulated by endogenous miR-373 in Tera-1 cells. As mentioned above, promoter conditions may account for cell line variability and impair gene induction by miR-373. Perhaps, endogenous levels of miR-373 do not contribute to E-cadherin or CSDC2 expression because neither gene is susceptible to RNAa in Tera-1 cells. In support, transfection of dsEcad-215 and dsCSDC2–670 into Tera-1 cells did not further enhance the expression of either E-cadherin or CSDC2, respectively (data not shown).
Although the exact mechanism for RNAa remains unclear, we do know that it requires complementarity to targeted DNA sequences and causes changes in chromatin associated with gene activation (7, 8). A simple model for the mechanism of miRNA-induced gene expression involves miRNA (e.g., miR-373) directly binding to complementary DNA within gene promoters to trigger gene expression. In this regard, miRNA functions like a transcription factor targeting complementary motifs in gene promoters. Alternatively, cells may be producing RNA copies of the target promoter region. Complementary miRNA would interact with the promoter transcripts to result in downstream gene expression. It has been reported that ncRNAs transcribed in promoter regions repress downstream gene expression (20, 21). In this regard, miRNAs would function to inhibit the activity of the upstream promoter transcripts. However, because mismatches and bulges are known to interfere with target mRNA cleavage (22, 23), it is likely that gene induction by miRNA does not require cleavage of target sequences. To clarify the mechanism, further research is required to identify the target molecule and the molecular components required to activate gene expression. Regardless, the ability for miR-373 to specifically activate target genes reveals a new potential function miRNAs have in regulating gene expression.
In summary, we have provided proof of principle that miRNAs may also function to induce gene expression. Both miR-373 and its premature hairpin (pre-miR-373) induced E-cadherin and CSDC2 expression by targeting specific sites in gene promoters. With the absence of certain endogenous miRNAs (e.g., miR-373), it is possible to speculate that stimulation of miRNA expression (via stress response, drug treatment, etc.) may lead to the activation of downstream-targeted genes. In association, alterations in miRNA expression profiles seen in numerous cancer types may also influence the expression of those genes positively regulated by promoter-targeting miRNAs. The ability for miRNAs to concurrently down-regulate transcripts by posttranscriptional gene silencing mechanisms and potentially up-regulate target genes reveal a more complex nature and fundamental importance miRNAs have in regulating gene expression. Identifying more natural targets induced by miRNAs may give further insight into the phenotypic consequences and gene expression profiles associated with certain miRNAs.
Materials and Methods
Double-Stranded RNA/miRNA.
Native miR-373, mismatched derivatives miR-373–5MM and miR-373–3MM, promoter-specific dsRNAs (dsEcad-640, dsEcad-215, and dsCSDC2–670), and the nonspecific control dsRNA (dsControl) were synthesized by Invitrogen. All dsRNA/miRNA duplexes possessed 2-nucleotide 3′ overhangs. The CSDC2 activating dsRNA (dsCSDC2–670) was designed according to criteria published in ref. 7. The miR-373 precursor (pre-miR-373) was synthesized by Dharmacon. Pre-miR negative control no. 1 (pre-miR-Con) was purchased from Ambion and served as a nonspecific premature miRNA control. Anti-miR miR-373 inhibitory oligonucleotide (anti-miR-373) and Anti-miR negative control no. 1 (anti-miR-Con) were also acquired from Ambion. All custom dsRNA sequences are listed in SI Table 2.
Cell Culture and dsRNA Transfection.
PC-3, LNCaP, and HCT-116 cells were maintained in RPMI medium 1640 supplemented with 10% FBS, 2 mM l-glutamine, penicillin (100 units/ml), and streptomycin (100 μg/ml) in a humidified atmosphere of 5% CO2 at 37°C. Tera-1 cells were cultured in McCoy's 5A media supplemented with 10% FBS, 2 mM l-glutamine, penicillin, and streptomycin. The day before dsRNA transfection, cells were plated in growth medium without antibiotics at a density of ≈50–60%. Transfection of dsRNA was carried out by using Lipofectamine 2000 (Invitrogen) according to the manufacture's protocol. All dsRNA treatments proceeded for 72 h as described in ref. 7.
Dicer Knockdown by Antisense Phosphorodiamidate Morpholino Oligonucleotides (PMO).
An antisense PMO molecule (Dicer-PMO) (SI Table 2) was designed and synthesized against the translation initiation site in the Dicer mRNA (Gene Tools). A standard control oligo was also purchased from Gene Tools and served as a nonspecific control PMO (Con-PMO). To block Dicer protein synthesis, semiconfluent PC-3 cells were transfected with 15 μM Dicer-PMO, using the Endo-Porter delivery system (Gene Tools). Control treatments were transfected in absence of PMO molecules. The following day, treated cells were reseeded at ≈50–60% and immediately transfected with or without dsRNA/miRNA, using Lipofectamine 2000 (Invitrogen). All treatments proceeded for 72 h after dsRNA/miRNA transfection. It is important to note that pretreatment with Endo-Porter delivery system reduced the magnitude of E-cadherin induction by miR-373 and pre-miR-373.
Quantification of miR-373 Expression.
Total RNA, including miRNA, was extracted by using the miRNeasy mini kit (Qiagen) according to the manufacturer's protocol. Reverse transcription reactions containing 200 ng of total RNA were performed by using the TaqMan MicroRNA reverse transctription kit (Applied Biosystems) in conjunction with miR-373-specific primers. One microgram of total RNA was also reverse transcribed by using oligo(dT) primers for analysis of GAPDH expression. To quantify miR-373 expression, real-time PCR was performed by using the TaqMan miRNA assay kit for hsa-miR-373 (Applied Biosystems). Amplification of GAPDH served as an endogenous control used to normalize miR-373 expression data. Each sample was analyzed in quadruplicate. It is important to note that the miR-373-specific primer used in the reverse transcription reaction recognizes both the mature and premature sequence of miR-373. Therefore, results are a quantitative measurement of the combined cellular levels of miR-373 and pre-miR-373.
Chromatin Immunoprecipitation.
ChIP analysis was performed as published in ref. 24. An antibody specific to the C-terminal domain of RNA polymerase II (Millipore) was used to immunoprecipitate transcriptionally active regions of DNA. Primers specific to E-cadherin, CSDC2, or GAPDH transcription start sites (SI Table 2) were used to amplify DNA purified in the ChIP procedure. The resulting PCR products were visualized on an agarose gel.
Other experimental procedures are available in SI Materials and Methods.
Supplementary Material
ACKNOWLEDGMENTS.
We thank S. T. Okino and R. Erikson for their critical readings and discussion of the manuscript. This work was supported by the Veterans Affairs Research Enhancement Award Program (REAP), a Veterans Affairs Merit Review grant, and National Institutes of Health Grants RO1CA101844, RO1CA111470, and T32DK007790 (to R.D.).
Footnotes
The authors declare no conflict of interest.
This article is a PNAS Direct Submission.
This article contains supporting information online at www.pnas.org/cgi/content/full/0707594105/DC1.
References
- 1.Fire A, Xu S, Montgomery MK, Kostas SA, Driver SE, Mello CC. Nature. 1998;391:806–811. doi: 10.1038/35888. [DOI] [PubMed] [Google Scholar]
- 2.Elbashir SM, Harborth J, Lendeckel W, Yalcin A, Weber K, Tuschl T. Nature. 2001;411:494–498. doi: 10.1038/35078107. [DOI] [PubMed] [Google Scholar]
- 3.Zeng Y, Yi R, Cullen BR. Proc Natl Acad Sci USA. 2003;100:9779–9784. doi: 10.1073/pnas.1630797100. [DOI] [PMC free article] [PubMed] [Google Scholar]
- 4.Reinhart BJ, Slack FJ, Basson M, Pasquinelli AE, Bettinger JC, Rougvie AE, Horvitz HR, Ruvkun G. Nature. 2000;403:901–906. doi: 10.1038/35002607. [DOI] [PubMed] [Google Scholar]
- 5.Llave C, Xie Z, Kasschau KD, Carrington JC. Science. 2002;297:2053–2056. doi: 10.1126/science.1076311. [DOI] [PubMed] [Google Scholar]
- 6.Lee RC, Feinbaum RL, Ambros V. Cell. 1993;75:843–854. doi: 10.1016/0092-8674(93)90529-y. [DOI] [PubMed] [Google Scholar]
- 7.Li LC, Okino ST, Zhao H, Pookot D, Place RF, Urakami S, Enokida H, Dahiya R. Proc Natl Acad Sci USA. 2006;103:17337–17342. doi: 10.1073/pnas.0607015103. [DOI] [PMC free article] [PubMed] [Google Scholar]
- 8.Janowski BA, Younger ST, Hardy DB, Ram R, Huffman KE, Corey DR. Nat Chem Biol. 2007;3:166–173. doi: 10.1038/nchembio860. [DOI] [PubMed] [Google Scholar]
- 9.Carrington JC, Ambros V. Science. 2003;301:336–338. doi: 10.1126/science.1085242. [DOI] [PubMed] [Google Scholar]
- 10.Lu J, Getz G, Miska EA, Alvarez-Saavedra E, Lamb J, Peck D, Sweet-Cordero A, Ebert BL, Mak RH, et al. Nature. 2005;435:834–838. doi: 10.1038/nature03702. [DOI] [PubMed] [Google Scholar]
- 11.O'Donnell KA, Wentzel EA, Zeller KI, Dang CV, Mendell JT. Nature. 2005;435:839–843. doi: 10.1038/nature03677. [DOI] [PubMed] [Google Scholar]
- 12.He L, Thomson JM, Hemann MT, Hernando-Monge E, Mu D, Goodson S, Powers S, Cordon-Cardo C, Lowe SW, Hannon GJ, Hammond SM. Nature. 2005;435:828–833. doi: 10.1038/nature03552. [DOI] [PMC free article] [PubMed] [Google Scholar]
- 13.He L, Hannon GJ. Nat Rev Genet. 2004;5:522–531. doi: 10.1038/nrg1379. [DOI] [PubMed] [Google Scholar]
- 14.Huang HY, Chien CH, Jen KH, Huang HD. Nucleic Acids Res. 2006;34:W429–W434. doi: 10.1093/nar/gkl333. [DOI] [PMC free article] [PubMed] [Google Scholar]
- 15.Ketting RF, Fischer SE, Bernstein E, Sijen T, Hannon GJ, Plasterk RH. Genes Dev. 2001;15:2654–2659. doi: 10.1101/gad.927801. [DOI] [PMC free article] [PubMed] [Google Scholar]
- 16.Voorhoeve PM, le Sage C, Schrier M, Gillis AJ, Stoop H, Nagel R, Liu YP, van Duijse J, Drost J, Griekspoor A, et al. Cell. 2006;124:1169–1181. doi: 10.1016/j.cell.2006.02.037. [DOI] [PubMed] [Google Scholar]
- 17.Lim LP, Lau NC, Garrett-Engele P, Grimson A, Schelter JM, Castle J, Bartel DP, Linsley PS, Johnson JM. Nature. 2005;433:769–773. doi: 10.1038/nature03315. [DOI] [PubMed] [Google Scholar]
- 18.Enright AJ, John B, Gaul U, Tuschl T, Sander C, Marks DS. Genome Biol. 2003;5:R1. doi: 10.1186/gb-2003-5-1-r1. [DOI] [PMC free article] [PubMed] [Google Scholar]
- 19.Doench JG, Sharp PA. Genes Dev. 2004;18:504–511. doi: 10.1101/gad.1184404. [DOI] [PMC free article] [PubMed] [Google Scholar]
- 20.Petruk S, Sedkov Y, Riley KM, Hodgson J, Schweisguth F, Hirose S, Jaynes JB, Brock HW, Mazo A. Cell. 2006;127:1209–1221. doi: 10.1016/j.cell.2006.10.039. [DOI] [PMC free article] [PubMed] [Google Scholar]
- 21.Martens JA, Laprade L, Winston F. Nature. 2004;429:571–574. doi: 10.1038/nature02538. [DOI] [PubMed] [Google Scholar]
- 22.Doench JG, Petersen CP, Sharp PA. Genes Dev. 2003;17:438–442. doi: 10.1101/gad.1064703. [DOI] [PMC free article] [PubMed] [Google Scholar]
- 23.Saxena S, Jonsson ZO, Dutta A. J Biol Chem. 2003;278:44312–44319. doi: 10.1074/jbc.M307089200. [DOI] [PubMed] [Google Scholar]
- 24.Okino ST, Quattrochi LC, Pookot D, Iwahashi M, Dahiya R. Mol Pharmacol. 2007;72:1457–1465. doi: 10.1124/mol.107.039826. [DOI] [PubMed] [Google Scholar]
Associated Data
This section collects any data citations, data availability statements, or supplementary materials included in this article.


