

Abstract
β-Thalassemia and sickle cell disease both display a great deal of phenotypic heterogeneity, despite being generally thought of as simple Mendelian diseases. The reasons for this are not well understood, although the level of fetal hemoglobin (HbF) is one well characterized ameliorating factor in both of these conditions. To better understand the genetic basis of this heterogeneity, we carried out genome-wide scans with 362,129 common SNPs on 4,305 Sardinians to look for genetic linkage and association with HbF levels, as well as other red blood cell-related traits. Among major variants affecting HbF levels, SNP rs11886868 in the BCL11A gene was strongly associated with this trait (P < 10−35). The C allele frequency was significantly higher in Sardinian individuals with elevated HbF levels, detected by screening for β-thalassemia, and patients with attenuated forms of β-thalassemia vs. those with thalassemia major. We also show that the same BCL11A variant is strongly associated with HbF levels in a large cohort of sickle cell patients. These results indicate that BCL11A variants, by modulating HbF levels, act as an important ameliorating factor of the β-thalassemia phenotype, and it is likely they could help ameliorate other hemoglobin disorders. We expect our findings will help to characterize the molecular mechanisms of fetal globin regulation and could eventually contribute to the development of new therapeutic approaches for β-thalassemia and sickle cell anemia.
Keywords: globin gene regulation, polymorphism, sickle cell anemia
Sickle cell disease (SCD) and β-thalassemia are among the most common inherited disorders worldwide. Both disorders display a marked phenotypic heterogeneity, which is related to environmental as well as genetic factors (1); those that determine the persistence of fetal hemoglobin (HbF) production may ameliorate the clinical and hematologic severity in both conditions. HbF levels show a marked variation in β-thalassemia as well as in SCD but also in normal individuals, 10–15% of whom display a moderate increase of 0.8–5% in HbF levels [heterocellular hereditary persistence of HbF (HPFH)] (2). Twin studies have clearly demonstrated that HbF is a highly heritable trait (3). Linkage studies have suggested that both loci within the β-globin gene cluster, especially the −158 C-T Gγ polymorphism and quantitative trait loci (QTL) mapping elsewhere in the genome (Xp 22.2–22.3 region, 6q23 and 8q), may play a role in the regulation of HbF levels (3–5). Recent association studies have suggested that a variant between the HBS1L and c-MYB genes is implicated in the QTL for HbF at 6q23 (6).
In Sardinia, β-thalassemia mutations occur at high frequency (cumulative frequency of 5% corresponding to a carrier frequency of >10%) and, despite showing a marked genetic homogeneity, display an extensive phenotypic variation only partially explained by coinherited α-thalassemia or hereditary persistence of HbF mapping within the β-cluster [(−158 C→T Gγ) polymorphism]. With its isolated founder population, Sardinia provides an attractive venue for identifying alleles associated with the persistence of HbF expression into adult life and are thereby able to ameliorate the clinical and hematological features of individual homozygotes for β-thalassemia or SCD. Sardinians present relative genetic and environmental homogeneity that has already facilitated the identification of genes responsible for several Mendelian and complex disorders (7–9). This simpler genetic architecture should facilitate gene identification. Here we used genome-wide linkage and association scans to dissect the genetic architecture of several quantitative traits related to the regulation of hemoglobin patterns in adults (1). Our approach allowed us to identify genetic variants at the BCL11A locus that can lead to the persistence of HbF in adults. Importantly, we have further shown that this BCL11A variant, by influencing the HbF levels, may moderate the phenotype of homozygous β-thalassemia.
Results
Linkage and Association Analyses.
We have recently conducted a study on a series of quantitative traits related to aging in a cohort of 6,148 Sardinians (10, 11). In addition to traits affecting cardiovascular function, personality, and anthropometric parameters (11), all participants were characterized for eight traits underlying hemoglobin composition and red blood cell indices (RBC, MCV, Hb, HbA1c, HbA2, HbF, and the derived indices MCH and MCHC). Among study participants, we genotyped 4,305 individuals who had four Sardinian grandparents and one or more additional first-degree relatives available for genotyping (to allow for genetic linkage analysis). We genotyped 3,329 of these individuals with the Affymetrix 10K SNP chip and 1,412 individuals with the Affymetrix 500K SNP chip, with 436 individuals genotyped on both platforms. We used computational methods to fill in missing genotypes in 2,893 individuals genotyped only with the 10K SNP chips (12, 13), allowing us to increase the effective sample size for association mapping. A total of 362,129 SNPs between the 10K and 500K SNP Arrays had minor allele frequency >5% and passed quality control filters examining call rates, Mendelian transmission and Hardy–Weinberg equilibrium (11).
We previously estimated that linkage analysis would result in expected logarithm of odds (lod) scores of >≈ 3.0 for traits that explain more than ≈10% of the genetic variance in this sample (14). We used variance components methods (15–17) to identify regions of the genome associated with variation in each of the traits analyzed in this study [Fig. 1A; supporting information (SI) Fig. 4 and SI Table 4]. Average information content (18) was 89%, indicating that our strategy provided excellent coverage of the genome and extracted nearly all of the available linkage information. In particular for the HbF levels, only the region of the β-globin cluster on chromosome 11 shows a lod >3 (Fig. 1A).
Fig. 1.

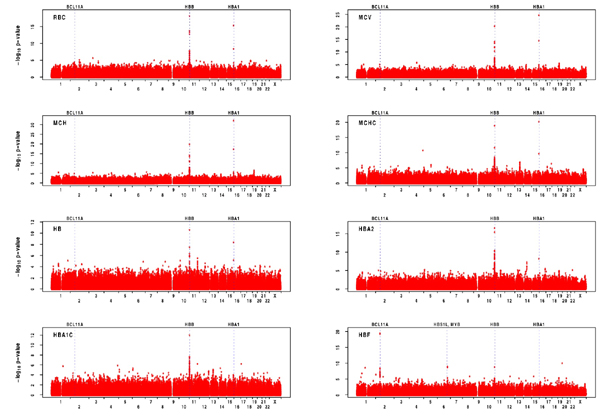
Genome-wide linkage and association scan results for HbF. (A) Result of genome-wide linkage scan. Variance component linkage analysis lod scores were calculated at positions 0.5 cM apart along each chromosome. Dotted line indicates the conventional lod >3 significance threshold. (B) Genome-wide association scan results using only 1,412 individuals genotyped with the 500K chip. For each marker that passed quality-control filters, -log10 of the P value resulting from an association test that evaluates its additive effect on the phenotype is plotted. The position of selected genes (discussed in the text) is annotated. (C) Genome-wide association scan results after imputation of missing genotypes.
Because association analysis can pinpoint smaller regions of the genome associated with particular quantitative traits and reveal regions not detectable by linkage, we continued with genetic association analyses.
The association analysis revealed striking signals for all red blood cell and hemoglobin traits at the β- and α-globin loci (1), as shown by linkage analysis (SI Figs. 5 and 6). For HbF levels, the results of the genome-wide association (GWA) scan showed, in addition to the β-globin locus, strong association with the MYB/HBS1L and BCL11A loci (Fig. 1 B and C). More detailed results of the GWA scans are provided in SI Table 5, listing the SNPs exhibiting the strongest associations for each trait.
We also performed a sequential analysis that accounts for associated alleles of large effect when searching for alleles with smaller effects. The analysis is slightly more powerful and easier to understand, because it highlights a statistically “nonredundant” set of hits. We selected only one associated SNP for each of the loci discussed below, except for chromosome 11, where multiple SNPs were selected for several traits (Table 1, SI Table 6, SI Fig. 7). In particular for HbF levels, we also evaluated possible interaction among all of the SNPs selected in the sequential analysis. The only detected interactions were between pairs of SNPs on the β-globin locus, and, interestingly, between rs4895441 on the MYB/HBS1L locus and rs1391619 on chromosome 11 (SI Table 7). Further analysis will be necessary to investigate on the underlying molecular pattern of those interactions.
Table 1.
Association signals identified in a sequential analysis of HbF levels
| Trait | Round | SNP | Chr | Position | Allele | Effect | H2, % | P value |
|---|---|---|---|---|---|---|---|---|
| HbF | 1 | rs11886868 | 2 | 60631897 | T | −0.486 | 7.66 | 6.70 × 10⁻³⁵ |
| 2 | rs4895441 | 6 | 135468266 | A | −0.340 | 4.39 | 1.60 × 10⁻²⁰ | |
| 3 | rs4910742 | 11 | 5263085 | A | −0.581 | 4.79 | 1.20 × 10⁻²¹ | |
| 4 | rs6037828 | 20 | 437009 | C | −0.457 | 2.04 | 8.80 × 10⁻¹⁰ | |
| 5 | rs1391619 | 11 | 5412505 | A | −0.163 | 1.03 | 1.10 × 10⁻⁹ | |
| 6 | rs840716 | 11 | 4910038 | G | −0.332 | 1.60 | 9.30 × 10⁻⁹ | |
| 7 | rs7937649 | 11 | 5178955 | A | 0.186 | 1.51 | 7.30 × 10⁻⁸ | |
| 8 | rs968856 | 11 | 5217152 | G | −0.118 | 0.79 | 6.70 × 10⁻⁷ | |
| 9 | rs10837540 | 11 | 5170989 | T | 0.157 | 1.41 | 1.80 × 10⁻⁷ |
Summary results of an analysis where all SNPs in genome were evaluated in turn. After identifying the ″best″ SNP, its corresponding allele count was incorporated in the association model and the genome-wide scan was repeated to identify the second-best SNP. The procedure was repeated successively until adding any other SNP resulted in a P value >10−6. See Methods for further details. For each SNP, the round in which it was selected is listed, followed by the chromosome and corresponding position. The allele tested is listed together with its impact on the trait (in standard deviation units for the transformed phenotype), the proportion of variance it explains, and the P value for a test evaluating significance of the observed association.
Finally, we tested whether a different genetic model might better fit the data, and we found that among all SNPs selected in the sequential analysis for HbF levels, only rs4910742 and rs4895441 show a significative deviation from the additive model (P < 0.05, details in SI Table 8).
To confirm the association results in our cohort, we genotyped the most highly associated SNP for each trait in a set of 521 additional Sardinians unrelated to the individuals in the first-stage analysis. We note that, because of constraints in the design of a followup genotyping chip, the markers selected for followup were not always the markers showing the strongest association in our initial screen. Nevertheless, the initial followup provides convincing evidence for all signals discussed below (Table 2).
Table 2.
Replication of our strongest association signals
| Locus | SNP | Chr | Position, bp | Trait | GWA P value | Replication P value |
|---|---|---|---|---|---|---|
| HBB | rs4910742 | 11 | 5263085 | RBC | 5.80 × 10−47 | 4.60 × 10⁻¹⁷ |
| HbA2 | 3.00 × 10−46 | 1.60 × 10⁻²² | ||||
| MCV | 2.50 × 10−56 | 3.80 × 10⁻¹⁶ | ||||
| MCH* | 2.80 × 10−54 | 2.20 × 10⁻¹⁵ | ||||
| Hb | 2.30 × 10−39 | 4.10 × 10⁻¹³ | ||||
| MCHC* | 1.20 × 10⁻³¹ | 4.90 × 10⁻¹³ | ||||
| HbF | 1.80 × 10⁻²¹ | 3.40 × 10⁻¹² | ||||
| BCL11A | rs11886868 | 2 | 60631897 | HbF | 6.70 × 10⁻³⁵ | 8.50 × 10⁻¹⁰ |
| MYB/HBS1L | rs4895441 | 6 | 135468266 | HbF | 1.20 × 10⁻¹⁶ | 0.00002† |
| HBA | rs6600143‡ | 16 | 141389 | MCH* | 4.10 × 10⁻⁷ | 0.002 |
| MCV | 3.00 × 10⁻⁶ | 0.002 | ||||
| Hb | 0.0012 | 0.04 | ||||
| RBC | 0.0003 | 0.04 | ||||
| MCHC* | 0.0002 | 0.02 | ||||
| HbA2 | 0.3 | 0.4 | ||||
| CSNK2A1 | rs6037828 | 20 | 437009 | HbF | 1.10 × 10⁻⁹ | NA§ |
We genotyped an independent group of 521 unrelated individuals using the Affymetrix/ParAllele custom chip. We attempted to include the SNPs showing the strongest association in each region (exceptions are indicated below).
*Derived red blood cell index.
†rs9389269 was used as a proxy in the followup genotyping (HapMap r2 = 1.0), because rs4895441 could not be included in our followup chip.
‡rs17525396, the SNP showing the strongest association in the initial screen, did not yield robust probes in the design phase. Instead, we followed up rs6600143, another strongly associated SNP in the region.
§rs6037828 did not yield adequate probes in the design phase, and genotyping attempts with alternative methods failed. Thus, we have no followup data for this SNP.
Association of BCL11A with HbF Levels.
We were particularly struck by the genomic regions associated with HbF levels (3, 4, 19–22) (Table 1, Fig. 1 B and C). For this trait, we observed strong association with rs11886868 and other SNPs in the β-globin gene cluster, which includes the genes encoding HbF (reviewed in ref. 1) and with rs4895441 near the HBS1L and MYB genes mapping on 6q23 (both P < 10−15 in the initial screen and P < 10−4 in the followup sample) and recently implicated in persistence of HbF (6, 21). It is known that deletions and promoter point mutations within the β-globin gene cluster can result in increased HbF levels in adults, and six of the nine SNPs that show the strongest association with HbF levels in our sample fall in the β-globin gene cluster. Sequencing of the γ-promoter region in four sampled individuals with extremely high HbF percentage (HbF = 22, 15.5, 8.2, and 6) revealed variants known to result in persistence of HbF in three of them. One individual was a heterozygote for the β039 and Aγ-196 (C→T) mutations (8, 23), and two individuals were homozygous for the Gγ-158 (C→T) mutation (20). In a fourth individual, we found previously unreported Aγ-225 (delA) and −20 (G→T) polymorphisms whose significance is still unclear (SI Fig. 7).
To our knowledge, causal variants in the HBS1L and MYB genes on 6q23 region have not been identified so far. However, the MYB gene, which encodes a hematopoietic transcription factor, is down-regulated in cultured erythroid cells from adults with high HbF levels and can act as a trans regulator of hemoglobin F levels (21), whereas expression of HBS1L (a putative member of the GTPase superfamily) correlates with high F cell alleles (6). In addition to the 6q23 loci, other loci outside the β-globin gene cluster affecting HbF have been mapped to Xp22.2–22.3 and 8q, but relevant genes have not been identified (4, 19, 22). We found no support in our sample for either of these loci.
Instead, the strongest observed association was on chromosome 2 with SNP rs11886868, in intron 2 of the BCL11A gene (P < 10−34 in the initial screen [see Table 1, Fig. 1C, and Fig. 2(24, 25) P < 10−9; in the followup sample, see Table 2 and Fig. 3]. This SNP is in strong linkage disequilibrium with other nearby SNPs in Sardinia, in the HapMap Utah residents with ancestry from northern and western Europe (CEU), and Yoruba in Ibaden, Nigeria (YRI) samples (see Fig. 2). The intron is slightly unusual, because it shows somewhat more linkage disequilibrium in the HapMap YRI than the HapMap CEU (Fig. 2). Sequencing of all of the exons as well as intron/exon boundaries of the BCL11A gene in two groups of 10 individuals (including normal and β-thalassemia carriers), each homozygous for the two rs11886868 alleles, showed no coding variants in the gene, suggesting that regulatory variants may be responsible for the observed association.
Fig. 2.

Association with HbF levels and linkage disequilibrium patterns in the region surrounding BCL11A. (A Upper) Summary of association between the SNPs and the proportion of HbF in each individual (-log10 of the P value). The SNP showing strongest association (rs11886868) is highlighted. Other SNPs are colored according to their degree of disequilibrium with rs11886868, ranging from high (red) to intermediate (green) to low (blue). (A Lower) Alternative transcripts for BCL11A are indicated, with an arrow indicating transcript direction. (B) Summary of the patterns of disequilibrium in the region in Sardinia and in two of the HapMap populations (CEU and YRI). r2 values are colored as in A and ref. 28. The gray bar marks the region of association and facilitates comparisons between images.
Fig. 3.

Association between rs11886868 genotypes and proportion of HbF. The box plot shows the distribution of the HbF levels within each genotype class on the followup sample.
Among the 1,412 individuals directly genotyped for rs11886868, the genotype distribution was markedly different between individuals with normal HbF values (≤0.8%) and those with higher HbF levels [>0.8% of total hemoglobin, the threshold for HPFH (2)]. Specifically, genotype frequencies were 67% (T/T), 30% (T/C), and 3% (C/C) in 1,268 individuals with normal HbF levels (allele frequency for C, fC = 0.18). In 134 individuals with heterocellular HPFH, these frequencies become 40%, 47%, and 13% (fC. = 0.37), corresponding to a 2-fold enrichment in the C allele and a 5-fold enrichment in the C/C genotype (P value = 2.7 × 10⁻¹³ for difference in allele frequency). Furthermore, the C allele for rs11886868 is increased in frequency among 66 Sardinian subjects with HPFH, independently detected by population screening for β-thalassemia over the entire island (Table 3).
Table 3.
Distribution of rs11886868 genotypes in thalassemic patients, HPFH individuals, and the general population from Ogliastra
| Frequency |
P value genotypic vs. allelic test |
|||||||
|---|---|---|---|---|---|---|---|---|
| n individuals | C/C | C/T | T/T | HPFH | Thalassemia Intermedia | Thalassemia Major | SardiNIA | |
| HPFH* | 66 | 0.227 | 0.546 | 0.227 | — | 0.987 | 3.29 × 10⁻⁷ | 2.15 × 10⁻¹⁶ |
| Thalassemia intermedia | 52 | 0.192 | 0.597 | 0.211 | 0.847 | — | 2.91 × 10⁻⁶ | 1.23 × 10⁻¹² |
| Thalassemia major | 74 | 0.040 | 0.355 | 0.635 | 1.72 × 10⁻⁶ | 6.49 × 10⁻⁶ | — | 0.963 |
| SardiNIA | 1,412 | 0.040 | 0.316 | 0.644 | 8.52 × 10⁻¹³ | 3.16 × 10⁻¹² | 0.969 | — |
On the left are the genotype frequencies for each group. On the right, the upper and lower diagonal represents χ2 P values for the allelic and genotypic tests, respectively, between the indicated groups of individuals.
*HPFH was detected by population screening in the entire Sardinian population.
In addition to the loci discussed above (the β-globin gene cluster, the region between MYB and HBS1L and the BCL11A region), our initial screen suggested association for rs6037828 on chromosome 20. However, we were unable to genotype this SNP in our followup samples, using either ABI TaqMan assays or an Affymetrix custom chip.
Correlation of the BCL11A Polymorphism with Ameliorated Homozygous β-Thalassemia in Sardinia and Effect in Sickle Cell Disease.
We next explored the hypothesis that variant(s) at the BCL11A locus, by influencing the HbF levels, may modulate the clinical phenotype of β-thalassemia. To test this hypothesis, we genotyped the rs11886868 polymorphism in 52 patients affected by thalassemia intermedia and 74 by thalassemia major, detected by population screening for β-thalassemia over the entire island. All these patients were homozygous for the β039 mutation, and none of them carried the C→T mutation at position −158 in the γ-globin gene that is associated with high HbF in conditions of erythropoietic stress. In both groups of patients, the Hb pattern was comprised of HbF and trace amounts of HbA2 with no HbA present. The thalassemia major patients were transfusion-dependent, whereas those with thalassemia intermedia did not receive or had only sporadic transfusions and were characterized by high hemoglobin levels (almost entirely composed by HbF). As shown in Table 3, which compares the genotype and allele frequencies at this locus, the C allele of the rs11886868, strongly associated with high HbF, is significantly more frequent in patients with thalassemia intermedia (P value genotype 6.49 × 10−06; allelic 2.91 × 10−06). This indicates that the BCL11A variant carrying the rs11886868 “C” allele, by increasing HbF levels, may contribute to the development of a milder phenotype.
Increased HbF levels are associated with reduced morbidity and mortality not only in β-thalassemia but also in sickle cell disease (26–28). In a sample of 1,242 sickle cell disease patients from the Cooperative Study of Sickle Cell Disease (CSSCD) (27), including patients with homozygous sickle cell disease and sickle-hemoglobin C disease (SC), the C allele of marker rs11886868 was also strongly associated with increased HbF levels (P < 10−20), accounting for 8.6% of the variance in the trait. These findings are important, because they suggest that variants in BCL11A not only influence HbF levels in nonanemic individuals but also have an important effect in the context of the hemoglobinopathies.
Discussion
Genome-wide association scans are producing rapid advances in the dissection of genetic factors for complex diseases and quantitative traits. Our analysis clearly identified known loci associated with globin levels and red blood cell phenotypes and confirmed that polymorphisms in the BCL11A gene region as well as in the region between MYB and HBS1L are associated with elevated HbF levels in adulthood.
The BCL11A association with HbF levels reported here was clearly replicated in an independent sample of Sardinian individuals. Furthermore, a recently reported parallel study also shows that BCL11A variants influence HbF levels in nonanemic Caucasians from a European twin study (29). Importantly, our study shows that the C variant at rs11886868 in the BCL11A locus was more frequent both in subjects with heterocellular HPFH (detected by β-thalassemia screening) and in homozygotes β0-thalassemia with a mild phenotype compared with those with a severe form, likely partly compensating for the imbalance of hemoglobin production through the augmentation of HbF levels. Thus the BCL11A is a gene able to modify the phenotype of homozygous β-thalassemia by augmenting HbF levels. Our initial analysis of sickle cell patients from the CSSCD cohort supports the importance of BCL11A variants in modulating HbF levels in patients with SCD as well. In sickle cell disease the levels of HbF are much higher than in nonanemic individuals and our results suggest that the variant in BCL11A is responsive to stress erythropoiesis.
The BCL11A gene has been implicated in blood-related phenotypes. The gene encodes a zinc finger transcription factor with multiple isoforms that share a common N terminus but differ in the number of C-terminal zinc fingers. BCL11A binds directly to GG-rich motifs and acts as a transcriptional repressor that interacts with several proteins, including BCL6, COUP-TF, and SIRT1 (30, 31). It is expressed in red blood cell precursors and has been implicated in hematopoietic malignancies (32–34). The mechanism of action of BCL11A in regulating HbF levels is unknown at present, but it is tempting to speculate that it may bind to regulatory regions in the γ-globin gene cluster and thus be involved in the molecular switch that determines the relative production of fetal and adult globin chains (35).
The findings from the sickle cell patient cohort indicate that the BCL11A polymorphism is present with comparable effect in other populations, and that genotyping of the locus may have a practical utility not only in the Sardinian population. The determination of its status in young β-thalassemia and sickle cell patients may serve as a prognostic indicator for the severity of disease and future prospective studies will be necessary to study this. In the long run, targeted manipulation of BCL11A in red blood cell precursors may eventually lead to more effective therapies for β-thalassemia and SCD, which worldwide are major sources of morbidity and mortality (36).
Methods
Study Sample.
We recruited and phenotyped 6,148 individuals, male and female, ages 14–102 years, from a cluster of four towns in the Lanusei Valley of Sardinia (10). During physical examination, a blood sample was collected from each individual and divided into two aliquots. One aliquot was used for DNA extraction and the other to characterize several blood phenotypes. All red blood indices and hemoglobin patterns have been determined as described (37). In particular, HbF percentages have been determined with an HPLC system (Variant II, Bio-Rad), which is linear for values higher than 0.7%. In our cohort, HbF values range from 0 to 23.6, with an average of 0.3.
Genotyping was carried out on 4,305 individuals using Affymetrix 10K and 500K chips with standard protocols as described in ref. 11.
To follow up the strongest associated SNPs, we designed an Affymetrix/ParAllele custom SNP chip that was processed according to the manufacturer's recommendations.
To explore the involvement of the rs11886868 SNP at the BCL11A locus in regulating the HbF levels, we genotyped 66 HPFH Sardinians, which account for the total identified cases in a population screening for β-thalassemia. We also genotyped the rs11886868 SNP in β-thalassemia patients with either thalassemia major (74 cases) or thalassemia intermedia (52 cases). All these patients showed the electrophoretic pattern typical of β0-thalassemia (HbF, trace amount of HbA2 and absence of HbA), were born in Sardinia; were homozygous for β0 39 nonsense mutation; and did not carry the Gγ-158 (C→T) mutation20, which can also activate HbF production. Diagnosis of β-thalassemia intermedia was based on the lack of continuous transfusion requirement.
DNA from 1,242 sickle cell disease patients from the CSSCD was genotyped using the multiplex base extension and mass spectrometry Sequenom iPLEX platform. Genotyping completion rate was >97% and the error rate was <0.5% (calculated using replicate samples). The samples from this cohort included 830 patients with a SS genotype, 350 with a SS and concomitant α-thalassemia genotype, and 62 with a SC genotype who were recruited from multiple centers in the United States between 1978 and 1988. Patient data continued to be obtained until 1998. Mean steady-state HbF measurements when patients were over the age of 5 years were used in this analysis.
Statistical Analysis.
To ensure adequate control of type I error rates, we applied an inverse normal transformation to each trait before analysis (10).
For linkage analyses, we used the variance component method as implemented in Merlin (16, 17). lod scores were calculated along a 0.5-cM grid for the entire genome and used all available genotype data (including both the 500K and 10K SNP chip genotypes). Similar results were obtained with a regression-based approach (38). For association analysis, we fitted a simple regression model to each trait and used a variance component approach to account for correlation between different observed phenotypes within each family (11, 13). Gender, age, and age2 were included as covariates in all analyses.
For individuals genotyped with a sparse map, we used a modified version of the Lander–Green algorithm to estimate identity by descent sharing at the location of the SNPs being tested and identify stretches of haplotype shared with close relatives who were genotyped at higher density and probabilistically infer missing genotypes (12, 13). Details are provided in SI Text.
Our analytical approach considers all observed or estimated genotypes (rather than focusing on alleles transmitted from heterozygous parents) and thus is not immune to effects of population stratification. In homogenous populations, this type of analysis is expected to be more powerful (39). To evaluate the effects of population structure and cryptic relatedness between sampled individuals, we used the genomic control method to calculate an inflation parameter for our test statistics (40). The resulting inflation factor was small and comparable to that of other published genome-wide association scans (1.077); thus, no adjustment was applied.
For the CSSCD, mean steady-state HbF measurements for individuals older than 5 years old were log10-transformed. The data were corrected for gender and then converted to Z-scores. Association analysis was done by using linear regression testing a genetic additive model.
Supplementary Material
ACKNOWLEDGMENTS.
We thank Monsignore Piseddu, Bishop of Ogliastra; the Mayors of Lanusei, Ilbono, Arzana, and Elini; the head of the local Public Health Unit ASL4; and the residents of the towns for volunteering and cooperation. In addition, we are grateful to the mayor and the administration in Lanusei for providing and furnishing the clinic site. We thank the team of physicians Drs. Angelo Scuteri, Maria Grazia Pilia, Marco Orrù, Maria Cristina Spada, Maria Valeria Cherchi, Marina D'Aquila, Danilo Fois, Liana Ferreli, Marcello Argiolas, Francesco Loi, Pietro Figus, and Massimo Muggianu, and the nurses Paola Loi, Monica Lai, and Anna Cau, who carried out the physical examinations and made the observations, and the recruitment personnel Stefania Aresu and Eride Usai, who enrolled the volunteers. We also thank Eliana Lai for supplying thalassemia intermedia samples and Susanna Barella (both at Università degli Studi di Cagliari) for phenotypic analysis of the ProgeNIA samples for blood traits. We thank the CSSCD Investigators for the collection of DNA and patient data used in this study. This work was supported by the Intramural Research Program of the National Institute on Aging (NIA), and the National Institutes of Health. The SardiNIA (“ProgeNIA“) team was supported by Contract NO1-AG-1-2109 from the National Institute on Aging. The efforts of G.R.A. and W.M.C. were supported in part by contract 263-MA-410953 from the National Institute on Aging to the University of Michigan and by research grants from the National Human Genome Research Institute and the National Heart, Lung, and Blood Institute (to G.R.A.).
Footnotes
The authors declare no conflict of interest.
This article contains supporting information online at www.pnas.org/cgi/content/full/0711566105/DC1.
References
- 1.Weatherall D-J, Clegg J-B. The Thalassaemia Syndromes. Oxford, UK: Blackwell Scientific; 2001. [Google Scholar]
- 2.Thein S-L, Craig J-E. Genetics of Hb F/F cell variance in adults and heterocellular hereditary persistence of fetal hemoglobin. Hemoglobin. 1998;22:401–414. doi: 10.3109/03630269809071538. [DOI] [PubMed] [Google Scholar]
- 3.Garner C, et al. Genetic influences on F cells and other hematologic variables: A twin heritability study. Blood. 2000;95:342–346. [PubMed] [Google Scholar]
- 4.Dover G-J, Smith K-D, Chang Y-C. Fetal hemoglobin levels in sickle cell disease and normal individuals are partially controlled by an X-linked gene located at Xp22.2. Blood. 1992;80:816–824. [PubMed] [Google Scholar]
- 5.Craig J-E, et al. Dissecting the loci controlling fetal haemoglobin production on chromosomes 11p and 6q by the regressive approach. Nat Genet. 1996;12:58–64. doi: 10.1038/ng0196-58. [DOI] [PubMed] [Google Scholar]
- 6.Thein S-L, et al. Intergenic variants of HBS1L-MYB are responsible for a major QTL on chromosome 6q23 influencing HbF levels in adults. Proc Natl Acad Sci USA. 2007;104:11346–11351. doi: 10.1073/pnas.0611393104. [DOI] [PMC free article] [PubMed] [Google Scholar]
- 7.Crisponi L, et al. Crisponi syndrome is caused by mutations in the CRLF1 gene and is allelic to cold-induced sweating syndrome type 1. Am J Hum Genet. 2007;80:971–981. doi: 10.1086/516843. [DOI] [PMC free article] [PubMed] [Google Scholar]
- 8.Pirastu M, Kan Y-W, Galanello R, Cao A. Multiple mutations produce delta beta 0 thalassemia in Sardinia. Science. 1984;223:929–930. doi: 10.1126/science.6198720. [DOI] [PubMed] [Google Scholar]
- 9.Balaci L, et al. IRAK-M is involved in the pathogenesis of early-onset persistent asthma. Am J Hum Genet. 2007;80:1103–1114. doi: 10.1086/518259. [DOI] [PMC free article] [PubMed] [Google Scholar]
- 10.Pilia G, et al. Heritability of cardiovascular and personality traits in 6,148 Sardinians. PLoS Genet. 2006;25:e132. doi: 10.1371/journal.pgen.0020132. [DOI] [PMC free article] [PubMed] [Google Scholar]
- 11.Scuteri A, et al. Genome Wide Association Scan shows Genetic Variants in the FTO gene are Associated with Obesity Related Traits. PLoS Genet. 2007;3:e115. doi: 10.1371/journal.pgen.0030115. [DOI] [PMC free article] [PubMed] [Google Scholar]
- 12.Burdick J-T, Chen W-M, Abecasis G-R, Cheung V-G. In silico method for inferring genotypes in pedigrees. Nat Genet. 2006;38:1002–1004. doi: 10.1038/ng1863. [DOI] [PMC free article] [PubMed] [Google Scholar]
- 13.Chen W-M, Abecasis G-R. Family Based Association Tests for Genome Wide Association Scans. Am J Hum Genet. 2007;81:913–926. doi: 10.1086/521580. [DOI] [PMC free article] [PubMed] [Google Scholar]
- 14.Chen W-M, Abecasis G-R. Estimating the power of variance component linkage analysis in large pedigrees. Genet Epidemiol. 2006;30:471–484. doi: 10.1002/gepi.20160. [DOI] [PubMed] [Google Scholar]
- 15.Amos C-I. Robust variance-components approach for assessing genetic linkage in pedigrees. Am J Hum Genet. 1994;54:535–543. [PMC free article] [PubMed] [Google Scholar]
- 16.Abecasis G-R, Cherny S-S, Cookson W-O, Cardon L-R. Merlin–rapid analysis of dense genetic maps by using sparse gene flow trees. Nat Genet. 2002;30:97–101. doi: 10.1038/ng786. [DOI] [PubMed] [Google Scholar]
- 17.Abecasis G-R, Wigginton J-E. Handling Marker-Marker Linkage Disequilibrium: Pedigree Analysis with Clustered Markers. Am J Hum Genet. 2005;77:754–767. doi: 10.1086/497345. [DOI] [PMC free article] [PubMed] [Google Scholar]
- 18.Kruglyak L, Daly M-J, Reeve-Daly M-P, Lander E-S. Parametric and nonparametric linkage analysis: A unified multipoint approach. Am J Hum Genet. 1996;58:1347–1363. [PMC free article] [PubMed] [Google Scholar]
- 19.Miyoshi K, et al. X-linked dominant control of F-cells in normal adult life: characterization of the Swiss type as hereditary persistence of fetal hemoglobin regulated dominantly by gene (s) on X chromosome. Blood. 1988;72:1854–1860. [PubMed] [Google Scholar]
- 20.Gilman J-G, Huisman T-H. DNA sequence variation associated with elevated fetal G gamma globin production. Blood. 1985;66:783–787. [PubMed] [Google Scholar]
- 21.Jiang J, et al. cMYB is involved in the regulation of fetal hemoglobin production in adults. Blood. 2006;108:1077–1083. doi: 10.1182/blood-2006-01-008912. [DOI] [PubMed] [Google Scholar]
- 22.Garner C, Silver N, Best S. Quantitative trait locus on chromosome 8q influences the switch from fetal to adult hemoglobin. Blood. 2004;104:2184–2186. doi: 10.1182/blood-2004-02-0527. [DOI] [PubMed] [Google Scholar]
- 23.Ottolenghi S, et al. Sardinian delta beta zero-thalassemia: a further example of a C to T substitution at position -196 of the A gamma globin gene promoter. Blood. 1987;69:1058–1061. [PubMed] [Google Scholar]
- 24.Abecasis G-R, Cookson W-O. GOLD–Graphical overview of linkage disequilibrium. Bioinformatics. 2000;16:182–183. doi: 10.1093/bioinformatics/16.2.182. [DOI] [PubMed] [Google Scholar]
- 25.The International HapMap Consortium. The International HapMap Project. Nature. 2005;437:1299–1320. [Google Scholar]
- 26.Platt O-S, et al. Mortality in sickle cell disease - Life expectancy and risk factors for early death. N Engl J Med. 1994;330:1639–1644. doi: 10.1056/NEJM199406093302303. [DOI] [PubMed] [Google Scholar]
- 27.Platt O-S, et al. Pain in sickle cell disease. Rates and risk factors. N Engl J Med. 1991;325:11–16. doi: 10.1056/NEJM199107043250103. [DOI] [PubMed] [Google Scholar]
- 28.Castro O, et al. The acute chest syndrome in sickle cell disease: incidence and risk factors. The Cooperative Study of Sickle Cell Disease. Blood. 1994;8:643–649. [PubMed] [Google Scholar]
- 29.Menzel S, et al. A QTL influencing F cell production maps to a gene encoding a zinc-finger protein on chromosome 2p15. Nat Genet. 2007;39:1197–1199. doi: 10.1038/ng2108. [DOI] [PubMed] [Google Scholar]
- 30.Liu H, et al. Functional studies of BCL11A: characterization of the conserved BCL11A-XL splice variant and its interaction with BCL6 in nuclear paraspeckles of germinal center B cells. Mol Cancer. 2006;5:18. doi: 10.1186/1476-4598-5-18. [DOI] [PMC free article] [PubMed] [Google Scholar]
- 31.Senawong T, Peterson V-J, Leid M. BCL11A-dependent recruitment of SIRT1 to a promoter template in mammalian cells results in histone deacetylation and transcriptional repression. Arch Biochem Biophys. 2005;434:316–325. doi: 10.1016/j.abb.2004.10.028. [DOI] [PMC free article] [PubMed] [Google Scholar]
- 32.Liu P, et al. Bcl11a is essential for normal lymphoid development. Nat Immunol. 2003;4:525–532. doi: 10.1038/ni925. [DOI] [PubMed] [Google Scholar]
- 33.Satterwhite E, et al. The BCL11 gene family: involvement of BCL11A in lymphoid malignancies. Blood. 2001;98:3413–3420. doi: 10.1182/blood.v98.12.3413. [DOI] [PubMed] [Google Scholar]
- 34.Pulford K, et al. The BCL11AXL transcription factor: its distribution in normal and malignant tissues and use as a marker for plasmacytoid dendritic cells. Leukemia. 2006;20:1439–1441. doi: 10.1038/sj.leu.2404260. [DOI] [PubMed] [Google Scholar]
- 35.Quek L, Thein S-L. Molecular therapies in beta-thalassaemia. Br J Haematol. 2007;136:353–365. doi: 10.1111/j.1365-2141.2006.06408.x. [DOI] [PubMed] [Google Scholar]
- 36.Weatherall D, Akinyanju O, Fucharoen S, Olivieri N, Musgrove P. Inherited disorders of hemoglobin. Disease Control Priorities in Developing Countries. 2nd Ed. New York: Oxford Univ Press; 2006. pp. 663–680. [Google Scholar]
- 37.Cao A, et al. Thalassaemia and glucose-6-phosphate dehydrogenase screening in thirteen-fourteen year old students of the Sardinian population: preliminary findings. Commun Genet. 2008 doi: 10.1159/000113873. in press. [DOI] [PubMed] [Google Scholar]
- 38.Sham P-C, Purcell S, Cherny S-S, Abecasis G-R. Powerful regression-based quantitative-trait linkage analysis of general pedigrees. Am J Hum Genet. 2002;71:238–253. doi: 10.1086/341560. [DOI] [PMC free article] [PubMed] [Google Scholar]
- 39.Fulker D-W, Cherny S-S, Sham P-C, Hewitt J-K. Combined linkage and association analysis for quantitative traits. Am J Hum Genet. 1999;64:259–267. doi: 10.1086/302193. [DOI] [PMC free article] [PubMed] [Google Scholar]
- 40.Devlin B, Roeder K. Genomic control for association studies. Biometrics. 1999;55:997–1004. doi: 10.1111/j.0006-341x.1999.00997.x. [DOI] [PubMed] [Google Scholar]
Associated Data
This section collects any data citations, data availability statements, or supplementary materials included in this article.