

Abstract
Spontaneous neural activity has been recorded in the auditory nerve of cats as early as 2 days postnatal (P2 ), yet individual auditory neurons do not respond to ambient sound levels below 90–100 dB SPL until about P10. Significant refinement of the central projections from the spiral ganglion to the cochlear nucleus occurs during this neonatal period. This refinement may be dependent on peripheral spontaneous discharge activity. We recorded from single spiral ganglion cells in kittens aged P3 to P9. The spiral ganglion was accessed via the round window through the spiral lamina. A total of 112 ganglion cells were isolated for study in 9 animals. Spike rates in neonates were very low, ranging from 0.06 to 56 sp/s with a mean of 3.09 +/− 8.24 sp/s. Ganglion cells in neonatal kittens exhibited remarkable repetitive spontaneous bursting discharge patterns. The unusual patterns were evident in the large mean interval coefficient of variation (CVi = 2.9 +/−1.6) and burst index of 5.2 +/− 3.5 across ganglion cells. Spontaneous bursting patterns in these neonatal mammals were similar to those reported for cochlear ganglion cells of the embryonic chicken suggesting this may be a general phenomenon that is common across animal classes. Rhythmic spontaneous discharge of retinal ganglion cells has been shown to be important in the development of central retinotopic projections and normal binocular vision (Shatz, 1996, Proc Natl Acad Sci 93). Bursting rhythms in cochlear ganglion cells may play a similar role in the auditory system during pre-hearing periods.
Keywords: Rhythmic bursting, primary afferents, auditory nerve, ontogeny, development, endogenous activity
INTRODUCTION
Many mammals, including the kitten, are altricial and they spend the first several days to weeks as neonates before appreciable hearing sensitivity develops. During this pre-hearing period, projections of spiral ganglion cells to target zones in the cochlear nucleus undergo refinement to form precisely segregated cochleotopic terminal fields (for review see: Cant 1998). A similar cochleotopic organization of auditory projections is formed and preserved at essentially all levels of the neuraxis including the auditory cortex. These projections ultimately relay information about sound frequency, which is encoded spatially in the cochlea, and thus provide the basis for tonotopic mapping through out the central auditory system. In auditory nuclei receiving binaural input, the projections of each ear are segregated and preserved during ontogeny and these connections provide a means to locate sounds in the environment through neural computations. Understanding the mechanisms involved in the refinement, segregation and preservation of these maps is of great interest.
The initial topographical adjustments and final refinement of the cochlear nerve terminal fields in cochlear nuclei of the cat are essentially completed before hearing begins (Cant 1998; Leake et al. 1992; Snyder et al. 1997; Snyder and Leake 1997; Leake et al. 2002). However, the mechanisms underlying these pre-hearing developmental processes are not yet clear. In the visual system, segregation and refinement of central retinotopic projections occurs in neonatal mammals prior to the onset of vision (McLaughlin and O’leary 2005). The detailed refinements of retinotopic projections are thought to depend critically on both molecular guidance and patterned neural activity in retinal ganglion cells (O’Leary and McLaughlin 2005; McLaughlin et al. 2003b; McLaughlin et al. 2003a; Hindges et al. 2002; Yates et al. 2004; Demas et al. 2006; Ruthazer et al. 2003; Stellwagen and Shatz 2002; Mrsic-Flogel et al. 2005; McLaughlin et al. 2003c; Ruthazer and Cline 2004; Cang et al. 2005).
Of particular interest is the observation that spontaneous waves of correlated rhythmic neural activity in retinal ganglion cells provide a signal that is critical for the establishment of fully refined retinotopic maps at all levels of the neuraxis (Cang et al. 2005; O’Leary and McLaughlin 2005; Demas et al. 2006; Ruthazer et al. 2003; Stellwagen and Shatz 2002; Mrsic-Flogel et al. 2005; McLaughlin et al. 2003c). Spontaneous rhythmic discharge has been reported in brainstem auditory pathways of prehearing birds and mammals (Lippe 1994; Gummer and Mark 1994; Rubsamen and Schafer 1990; Kotak and Sanes 1995). The presence of rhythmic bursting among cochlear ganglion cells in the embryonic chicken has also been established recently and is reminiscent of rhythmic discharge patterns in the retina (Jones et al. 2001). The idea that rhythmic discharge patterns play a role in guiding refinements in central cochleotopic fields has been suggested by a number of investigators (Jones et al. 2001; Jones et al. 2006; Lippe 1994; Lippe 1995; Gummer and Mark 1994). Not firmly established in the mammal is the question of whether spiral ganglion cells themselves exhibit such spontaneous activity patterns. Neurons of the auditory nerve in cats are known to be spontaneously active as early as 2 days postnatal (P2, e.g., Carlier et al. 1975; Romand 1984; Walsh and McGee 1987). However, it is not clear whether SGCs of neonatal kittens exhibit the necessary repetitive spontaneous bursting discharge patterns. We hypothesize that spontaneous rhythmic bursting discharge patterns are present in mammalian spiral ganglion cells (SGCs) before hearing begins and that such discharge patterns serve to guide activity-dependent central refinements in mammals. To critically address the first of these assertions, we recorded spontaneous activity of SGCs in neonatal kittens ranging in age from P3 to P9.
METHODS
Animals and surgical approach
The care and use of animals in this study were approved by the Institutional Animal Care and Use Committee at the University of California at San Francisco (UCSF) and conformed to all NIH guidelines. All animals included in this study were bred in a closed colony maintained at UCSF. Queens were bred for periods of ≤ 24 hours, so the gestation period for each litter was known within +/− 12 hours. Total number of days post-conception (dpc, number of days of gestation plus number of days postnatal) is used to define age because this value correlates best with development of the organ of Corti (Sato et al. 1999) and development of electrophysiological response properties in the auditory nerve (Fitzakerley et al. 1998). This report includes recordings made in 8 young kittens ranging in age from 69 to 75 dpc (corresponding to postnatal ages P3 to P9) and in one older cat studied at 102 dpc (P36 ) as summarized in Table 1.
Table 1.
Summary of ages for animals studied. “Days Gest.” = days of gestation. “Total Age” = total days post-conception (dpc). “Isolated” = number of cells isolated. “Used” = number of cells used to form metrics for spontaneous discharge and bursting.
| Subject ID # | Days Gest. | Postnatal Age | Total Age | Isolated | Used |
|---|---|---|---|---|---|
| SG-13 | 66 | 3 | 69 | 16 | 10 |
| SG-12 | 66 | 4 | 70 | 17 | 6 |
| SG-14 | 66 | 4 | 70 | 16 | 7 |
| SG-15 | 66 | 5 | 71 | 31 | 14 |
| SG-11 | 67 | 5 | 72 | 12 | 6 |
| SG-4 | 66 | 6 | 72 | 8 | 0 |
| SG-5 | 66 | 7 | 73 | 4 | 2 |
| SG-6 | 66 | 9 | 75 | 5 | 3 |
| SG-9 | 66 | 36 | 102 | 3 | 1 |
The animals were anesthetized with inhaled isoflurane (3% for induction; 1–2% for maintenance). A tracheostomy tube was inserted, and animals were maintained on a small animal pressure-controlled ventilator (Kent Scientific). The respiratory rate, heart rate and body temperature were monitored throughout the experimental procedures and body temperature was maintained using a warm water recirculating blanket with a thermostatic coupler. The head was stabilized using a nylon screw mounted on the skull with dental acrylic and 3 small bone screws. The auditory bulla on the left side was exposed and opened to permit access to the cochlea. In the youngest animals, mesenchyme was dissected from the middle ear to visualize the round window. The round window membrane was exposed and excised to allow direct visualization of Rosenthal’s canal in the hook region and lower basal turn of the cochlea. In younger kittens (prior to ossification of the modiolus) the recording micropipettes could be inserted directly into the spiral ganglion. In older kittens a small opening into the modiolus was made using the tip of a 30 gauge needle to lift a small flap of bone over Rosenthal’s canal. Glass micropipettes (Flaming/Brown micropipette puller, Sutter Instrument Co. model P-97) filled with 0.5 M KCL in 0.05 M Tris buffer (pH 7.6) were lowered into the scala tympani using a micromanipulator and advanced into the ganglion using a hydraulic microdrive. A silver wire was plated with silver chloride, placed in the muscle posterior to the bulla and used as a reference electrode. Microelectrode impedance ranged from 5 to 70 MΩ and was measured in situ using an electrometer (World Precision Instruments; model WPI 767-B).
Electrophysiological recording
The discharge activity of spiral ganglion cells (SGCs), ongoing electrocardiogram (ECG) and ventilation were recorded digitally (12 bit conversion, 44100 Hz sampling). Electrophysiological activity was recorded for up to ~14 minutes. Figure 1A illustrates a typical spiral ganglion neuron recording and signal-to-noise ratio generally achieved in the neonate. Analysis of discharge patterns was accomplished offline using the digital records. Throughout this report, mean values will be expressed as the mean ± standard deviation (n) where n = sample size. Useful data were obtained from cellular recordings having 1) a signal-to-noise ratio (spike amplitude/background noise) that permitted unambiguous spike detection; and 2) a recording duration that was sufficient to glean useful information about cell discharge. We used the product of the number of spikes multiplied by the time between the first and last spike of a record as an objective metric (spike-seconds) to exclude cells. Cells not providing at least 50 spike-seconds of well resolved spike activity were excluded from analysis.
Figure 1.
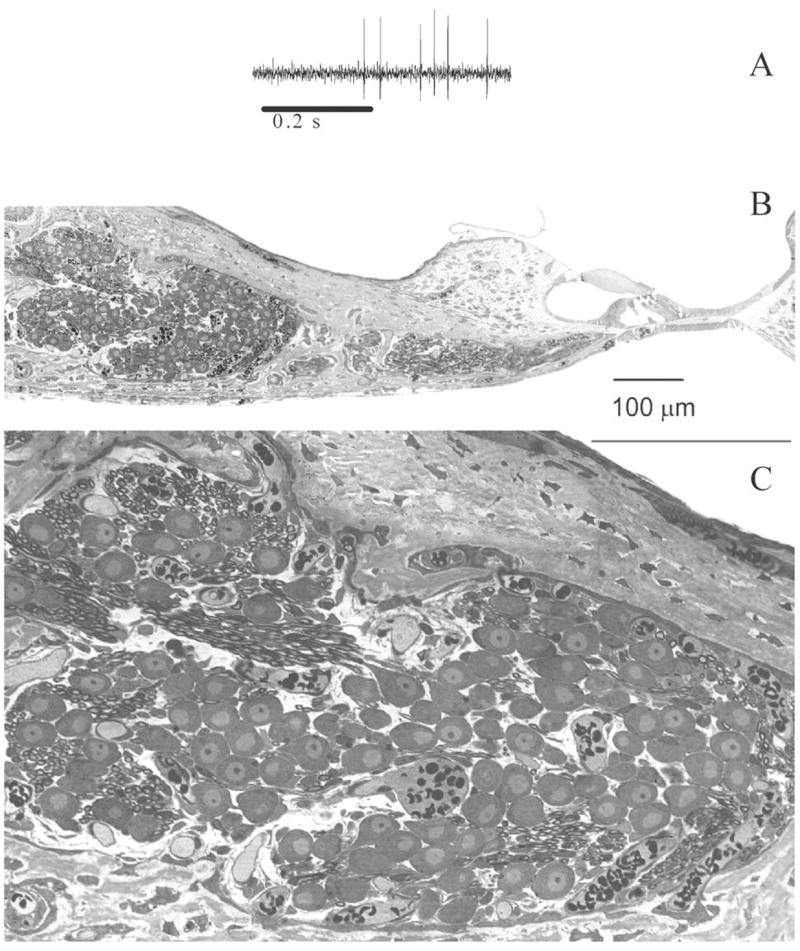
A. Representative example of a spike discharge record illustrating the typical signal-to-noise ratio generally achieved in the current study. B. Histological sections of the organ of Corti and spiral ganglion in one neonatal kitten at P5 (67 dpc) illustrating the typical developmental status of the cochlea at the ages examined. C. A higher magnification of the spiral ganglion cell shows that the neural somata have not yet become myelinated, and the bone of the modiolus surrounding the ganglion is not yet ossified. Scale bars for Panels B and C represent a length of 100μm.
Metrics documented for each neuron included total recording time (time between first and last spike), total number of spikes, spike rate (total number of spikes/total recording time), mean spike time interval, standard deviation of the spike interval (SDi) and interval coefficient of variation (CVi = SDi/mean ). The spike time interval for any given spike was defined as the onset time of the spike minus the onset time of the preceding spike. CVi is a traditional metric used to characterize spontaneous discharge patterns of neurons in terms of spike time intervals(Goldberg and Fernandez 1971; Anastasio et al. 1985; Jones and Jones 2000). The CVi for spontaneously discharging auditory ganglion cells ranges between 0.6 and 1.0 with a mean of approximately 0.8 in the mature mammal (cat, Walsh et al. 1972) and about 1.0 for the mature bird (Jones and Jones 2000). CVi’s ranging between 0.7 and 1.0 reflect the near stochastic discharge of mature auditory neurons, which is often described as a quasi-Poisson excitation or renewal process. CVi was reported for all neurons in which recording times were sufficient to determine whether bursting was present and adequate numbers of spikes occurred to permit the calculation of the burst index (below). Burst rate was calculated as a simple count of the total number of bursts divided by the total recording time. Bursts were defined in the context of a preceding period of low activity and this was signaled by long spike intervals. For the purpose of counting bursts, we defined a minimum pre-burst period (PBp, in ms). This was used as a threshold to define the onset spike of bursts. Here PBp was set equal to three times the mean spike interval for the entire discharge record. This is the same criterion used by Gummer and Mark, (1994). The onset of a prospective burst was signaled by a spike having a spike interval equal to or greater than the PBp. A burst was counted only if the onset spike was followed by a group of two or more spikes having spike intervals less than PBp. The word ‘spontaneous’ in the current report means ‘in the absence of sound stimulation’.
Determination of bursting versus entrainment
Entrainment to cardiac or ventilation rhythms, which could be misinterpreted as bursting, was determined by: 1) visual inspection of the time records; 2) cross correlation; and 3) probability density functions. Entrained cells were excluded from summary spontaneous discharge data. Bursting was evaluated using two computational methods: 1) probability density functions; and 2) burst index (BI); a dimensionless metric useful for identifying and ranking bursting patterns (originally referred to as burst factor, ‘BF’; Jones and Jones 2000; Jones et al. 2001).
Visual inspection of time records and cross correlation
The original spike records were displayed and recording quality confirmed. Spike onset times were scored and evaluated for obvious signs of entrainment (e.g., inspected for regular bursting at rates equal to ECG or ventilation rates etc.). Spike rate and onset time were then plotted. Plots of cardiac and ventilation cycle onset times were added to spike time plots. These combined plots were examined visually in detail for evidence of SGC entrainment. Neurons found to discharge in a manner that was linked in time to either cycle were designated as “entrained”. An example of such a plot and a detailed description of the graphical method used for inspection is provided in Supplemental Figure 1.
Cross correlation of spike times with cardiac or ventilation cycle onset times involved constructing two separate period histograms for the recorded spike onset times (Perkel et al. 1967). One period histogram was based on cardiac cycle onsets and the other on ventilation cycle onsets. The term “period histogram” will be used herein to indicate the final result of a cross correlation. The duration of the time window for a cross correlation and resultant period histogram was equal to the mean cardiac or ventilator period, and we used bins that were 10 ms long. The time window was centered on the onset of each cardiac or ventilation cycle. Theoretically, for a neuron exhibiting discharge activity that is randomly generated and independent of the cardiac and/or ventilation cycle, the distribution of the period histogram amplitudes should be relatively flat, reflecting a uniform probability distribution across the time window (Perkel et al. 1967).
Probability density functions
A simple spike time histogram was created to represent discharge probability as a function of time. The number of spikes occurring in the space of each time bin was taken as the discharge amplitude (spike count) and this was plotted as a function of time, where each time bin corresponded to one cycle period of ECG or ventilation. The time represented by the total number of bins was equal to the total time of the recording. If spike discharge was strictly linked to the ECG or ventilation cycle, then each cycle (bin) would have a comparable number of counts and the spike discharge amplitudes would distribute evenly across all bins throughout the time histogram. Similarly, if spike discharge was randomly generated and independent of ECG and ventilation events, then spike discharge amplitude would also be randomly distributed throughout the time histogram. However, if spike discharges were non-stochastic and occurred in recurrent bursts interspersed with silent periods, then the distribution of spike counts would not be uniform and would not follow a Poisson distribution as described below.
Using the variation coefficient (VC) to identify non-uniform probability distributions
To construct frequency distribution functions for period histograms and spike time histograms, the amplitude of a given time bin i (measured in spikes) was denoted g(i), i = 1, 2, …, m, where m was the total number of bins in the period or time histogram window. Values of the frequency distribution array, p(k), were calculated by counting the number of times that g(i) was exactly equal to k (k = 0, 1, 2, …) Thus, p(2) was the number of bins of the period or time histogram that contained exactly two spikes. The weighted mean (Mw, also widely referred to as expected value) and variance (σw2) of the frequency distribution function p(k) were calculated as follows:
and
, where k is the number of counts (spike counts), q is the maximum number of spike counts in any bin, p(k) is the number of bins with a spike count of k and m is the total number of bins. The variation coefficient (VC), a single value describing the amplitude (spike count) distribution of the period histogram (VCPH) or spike time histogram (VCTH), was calculated using the following equation:
The variation coefficients of sampled SGC spike discharge data were contrasted with the variation coefficients of Monte Carlo simulations having an equal number of spikes. Spike onset times in simulations were randomly assigned over the same recording period as sampled data, and these “simulated spike trains” were cross correlated with the mechanical event cycles (cardiac and ventilation) present in the sampled data records. This process produced a period histogram for simulated data. In a similar fashion, the simulated spike trains were accumulated in appropriate time bins of the spike time histogram and the results compared to those for sampled spike data. Frequency distribution functions were constructed for the simulations and VC values were calculated from the weighted mean and variance as described above.
Interpreting VCs
Theoretically, if SGC spike discharges are independent of cardiac and ventilation cycles, then the distribution of period histogram amplitudes, (g(i)), should approach that produced by a stochastic Poisson excitation process and approximate those produced by Monte Carlo simulations. The same is true for amplitudes (spike counts) of the spike time histograms. The resulting frequency distribution (p(k)) would in those cases follow or approach the theoretical Poisson probability distribution P(k), which is given by P(k) = (ck/k!) e−c, where c is a constant equal to the mean counts per bin, k is the spike count and k! is k factorial (Batschelet 1979). The value P(k) for any given k is the fraction of the total number of bins that will contain k spike counts if each spike event is equally likely to enter any of the bins and must enter one. For a true Poisson frequency distribution, the resulting variation coefficient is 1.0 (VC = 1.0) since in that case the weighted mean and variance are equal (σw2 = Mw). Values of VC substantially larger or smaller than 1.0 were taken to indicate substantial deviation from a Poisson distribution and thus were indicative of spike event times that were linked to the ventilation or cardiac cycle in period histograms or that were produced by non-stochastic bursting activity represented in spike time histograms. Values of variation coefficients obtained from simulated and sampled data were compared and statistical contrasts made using the Wilcoxon signed-rank test.
Nomenclature for VCs
As noted above, general reference to the variation coefficient will be made using the acronym “VC”. VCs derived from period histograms (PH) will be referred to as VCPH and those derived from time histograms (TH) as VCTH. To distinguish VCs based on cardiac (ECG) and ventilation (vent) data the corresponding subscripts will be added (i.e., VCPH ECG, VCPH vent, VCTH ECG, VCTH vent). Finally, there are occasions where VCs are pooled for ECG and ventilation data and these are referred to as VCPH ECG&vent or VCTH ECG&vent.
Burst Index (BI)
BI was calculated only for those records with 11 or more spikes. The intervals in each spike record were ranked from longest to shortest. The longest intervals were then used to calculate BI. The four longest intervals were used for records containing 11 to 80 spikes. If more than 80 spikes were recorded, then the number of longest intervals used was calculated as 5% of the total number of spikes (truncated to an integer). The BI was then calculated as follows:
or
The first component (A) of the BI equation reflects the proportion of time that a cell spent in long silent periods. The second component (B) provides an adjustment of the BI for the relative amount of activity present during discharge bursts such that the greater the contrast between silent and active periods, the greater was the BI. BIs above 1.0 signal the presence of bursting, and the greater the BI, the more pronounced is the bursting (Jones and Jones 2000; Jones et al. 2001).
RESULTS
Action potential discharges (APs) of spiral ganglion cells (SGCs) were recorded from the cochleas of eight pre-hearing neonates (ages 69 dpc to 75 dpc, P3 to P9) and one three-week-old kitten. The typical developmental status of the organ of Corti and spiral ganglion in the pre-hearing neonates is illustrated in the histological sections shown in Figures 1B & 1C. At the ages examined the spiral ganglion cells have not yet developed somatic myelin. All recordings were made in the absence of auditory stimulation. A total of 112 SGCs were isolated for study. Sixty-six of these cells provided useful data with recordings of sufficient quality and adequate numbers of APs to carry out data analysis. Responses to cardiac or ventilation cycles, when present, appeared to be epiphenomena superposed on the background of ongoing spontaneous activity. Such phenomena have been reported in neonatal mice and birds (Sanes and Walsh 1998; Jones and Jones 2000). The discharge patterns of 17 of these 66 useful cells (~25%) were clearly seen graphically to be in part synchronized with the mechanical action of the heart beat or with the respiratory ventilation cycle. We have designated all 17 of these cells as “entrained cells”. Data from these entrained cells were not used to generate metrics for spontaneous discharge activity although data from six of the cells were used to illustrate the effects of entrainment on period histograms and VCs. The discharge activity of the remaining well-characterized 49 SGCs (48 neurons in neonates) was designated as “spontaneous” (non-entrained) and these data served as the basis for the quantitative description of SGC spontaneous discharge activity.
Cross correlation: period histograms and entrainment
An example of a typical period histogram of an “entrained” neuron is illustrated in Supplemental Figure 2. Spike counts in the period histograms of entrained cells showed considerable bias in spike distribution toward some phase of the ECG or ventilation cycle. Variation coefficients for such period histograms (VCPH ECG and VCPH vent) were considerably larger than 1.0 and ranged up to 27. The mean value for the pooled VCs was ~8.6 (see VCPH ECG&vent Table 2 section “B”) and this served as an illustration of the values expected from spike discharge driven in part by cardiac or ventilation cycles.
Table 2.
Summary results from cross correlations: Listed are mean values for variation coefficients (VCs) from both period histograms (PH) and time histograms (TH). Section “A” reports summary values for neonatal cells classified as ‘spontaneous’. Section “B” lists the mean of the pooled cardiac and ventilation VCs for ‘entrained’ cells (VCPH ECG&vent). There were 7 VCs for the ‘entrained’ group because one SGC was entrained to both ECG and ventilation thus contributing two VCs. Compare results from sampled (Sampled) and simulated discharge data (Simulated). “Difference” is the difference in mean VC values for sampled and simulated data. Values are given as: mean ± standard deviation (n) where n = sample size.
| A. Spontaneous Group | VCPH ECG | VCPH vent | VCTH ECG | VCTH vent |
|---|---|---|---|---|
| Sampled | 1.42 ± 0.66(26) | 1.17 ± 0.27(25) | 5.73 ± 4.54(24) | 11.10 ± 10.99(25) |
| Simulated | 1.15 ± 0.28(26) | 0.99 ± 0.10(25) | 1.14 ± 0.29(24) | 1.28 ± 0.55(25) |
| Difference | 0.27 | 0.18** | 3.99 ** | 9.82** |
| B. Entrained Cells | VCPH ECG&vent | |||
|
|
||||
| Sampled | 8.58 ± 9.95(7) | |||
| Simulated | 1.02 ± 0.28(7) | |||
| Difference | 7.56 | |||
|
|
||||
indicates a statistical significance of p < 0.001. PH = period histogram; ECG = cardiac cycle; vent = ventilation cycle; TH = time histogram, ECG&vent = pooled VCs for cardiac and ventilation cycles. Acronyms are combined to form column label designations as follows: e.g., VCPH ECG is the variation coefficient from a cardiac cycle period histogram. For period histograms, a value of VCPH approaching 1.0 reflects the absence of entrainment. For time histograms (TH), a VCTH approaching 1.0 reflects the presence of a stochastic discharge process and the absence of a bursting discharge pattern.
In contrast, the spike distributions in period histograms from cells of the ‘spontaneous group’ were relatively uniform across ECG and ventilation cycles. A typical example (VCPH vent = 1.41) is shown in Supplemental Figure 3. Individual values of VCs for period histograms from cells of the ‘spontaneous’ group are shown in Figure 2 (Panel ‘A’, ECG, VCPH ECG; Panel ‘B’, Ventilation, VCPH vent). The distribution of VCPHs for sampled spike data (filled circles) and simulated spike data (open triangles) showed considerable overlap indicating that spike discharge in sampled neurons generally approximated the distribution for random spike discharge for both ECG and ventilation cycles. The range of VCs for both ECG and ventilation PHs was slightly larger for sampled data. Only a few cells (5) had VCs above 2.0, which was the upper limit of VCs obtained from simulated data.
Figure 2.

Distribution of variation coefficient values calculated from period histograms (VCPH) of non-entrained SGCs. Period histograms (PH) were generated by cross correlating spike discharge times with ECG or ventilation cycles. VCPH values for sampled (filled circles) and simulated (open triangles) spike discharge data are shown. Sampled data were obtained from spontaneously discharging SGC neurons of neonatal kittens. Simulated data were created for each sampled data set and were composed of an identical number of randomly generated spike onset times. Panel A shows VCPH ECG values from cross-correlations with ECG cycles, whereas panel B illustrates the VCPH vent values for cross-correlations with ventilation cycles. Horizontal dashed lines are placed at VCs of 1.0 and 2.0. The overlapping distributions of sample and simulated data reflect the general lack of correlation between spike discharge and ECG/ventilation cycles. Summary means are presented in Table 2.
Summary values of the data in Figure 2 are listed in Table 2. The mean values of VCPH ECG and VCPH vent for all sampled and simulated groups were below 2.0 (Table 2) and were consistent with relatively independent discharge patterns. There were no significant differences in mean values of VCPH ECG for simulated and sampled ECG data. There was a very small difference (0.18) in the means for simulated and sampled ventilation data (VCPH vent, Table 2, p < 0.001). This difference (i.e., 0.18) was less than the standard deviation of all other simulation groups and in our view was too small to be of practical importance. The means for the pooled VCs (ECG and ventilation) for sampled data were: VCPH ECG&vent = 1.3 +/− 0.5(51), and for simulated data: VCPH ECG&vent = 1.1 +/− 0.2 (51) and these may be contrasted with that for the entrained cells (i.e., VCPH ECG&vent = ~ 8.6, see Table 2). Together, these results showed that entrainment by ECG and ventilation played a negligible role in forming the activity patterns of the spontaneous group.
Spike Rates
As reported by many investigators, the spontaneous discharge rate of SGCs in the neonatal kitten was considerably lower than rates observed for most cells in older kittens and adults (e.g., Walsh and Romand 1992). Figure 3 summarizes the distribution of spontaneous spike discharge rates for neonates at various ages post conception. Spike rates ranged from 0.06 to 56 sp/s. Only two ganglion cells had spike rates above 10 sp/s. The mean spontaneous discharge rate across all 48 SGCs in neonates was 3.09 +/− 8.2 (48) sp/s. Neonatal spike rates reported here are similar to those reported by Romand (1984) for 6 day-old kittens (i.e. ~4 sp/s, figure line labeled C.). This contrasts markedly with the rate of 88.6 sp/s for an SGC recorded in the one-month-old kitten; a spontaneous discharge rate that falls within the upper ranges reported for mature cats (60 to 100 sp/s) (e.g., Kiang 1965; Walsh et al. 1972; Liberman 1978; Walsh and McGee 1987). Romand (1984) reported the mean discharge rates for the adult as ~ 45 sp/s and for a one-month-old kitten as ~ 27 sp/s and these values are represented on Figure 3 (lines labeled A. and B. respectively).
Figure 3.

Summary of discharge rates obtained from neonates in the present study (mean rate = 3.08 +/− 8.2 sp/s, n = 48). The graph reflects the spike rate (sp/s) distribution as a function of neonatal age in days post-conception (dpc). Days 69 to 75 dpc correspond approximately to P3 to P9 postnatal days in the present study. Forty-eight neurons are represented. The one outlier at 56 sp/s was obtained from a very short record of 6 seconds and thus may not well represent the general spike rate of the cell. Mean recording duration for the group of neurons was ~151 seconds. Horizontal lines labeled A., B. and C. reflect mean spike rates reported by Romand (1984) for the adult cat (A. => ~ 45 sp/s), one month-old kitten (B. => ~ 27 sp/s) and 6 day kitten (C. ~ 4 sp/s).
Bursting patterns
The pattern of spike discharge over time was also remarkably different for neonates in comparison to mature animals as illustrated in Figures 4 and 5. Figure 4 shows examples of the original recordings from SGCs of a mature animal (upper trace) and a neonate (lower trace). The discharge in the mature animal reflected relatively continuous, irregular spike discharges that contained no appreciable long periods of inactivity whereas the discharge pattern in the neonate occured in a series of bursts interrupted by long silent periods. The variation in discharge rate over much longer periods of time is better appreciated in discharge rate plots as illustrated in Figure 5. The panels of Figure 5 illustrate results from the same two cells shown in Figure 4. Each point in the plots of Figure 5 represents the onset time and the reciprocal of the spike interval. The reciprocal of the time interval gives the corresponding spike rate in sp/s for the interval, which is sometimes referred to as the ongoing “instantaneous spike rate”. Figure 5A clearly shows the steady, near-stochastic spontaneous discharge of an SGC in a one-month-old animal (g001D). The spontaneous discharge pattern shown in Figure 5A gave a CVi = 0.88 and a BI = 0.65. A CVi approaching 1.0 and a BI less than 1.1 are consistent with an exponential distribution of inter-spike intervals, which is characteristic of a stochastic discharge pattern, and the absence of a bursting process (e.g., Kiang 1965; Walsh et al. 1972; Jones et al. 2001; Jones and Jones 2000). In contrast, Figure 5B shows a typical pattern of discharge for the neonatal animal (sg15014D). This pattern of discharge gave a CVi = 4.11 and a BI = 8.8. These large values of CVi and BI are indicative of a non-stochastic discharge process. Note the striking repetitive bursting periods in the record obtained from the neonate (burst rate was 4.1 bursts/min).
Figure 4.
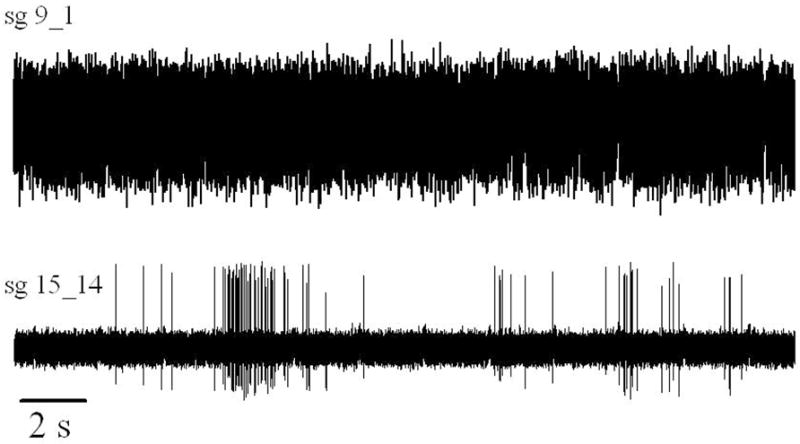
Spontaneous electrical discharge of two spiral ganglion cells, one from an older P36 (102 dpc) kitten (Upper trace: sg9_1) and one from a P5 (71 dpc) neonatal kitten (Lower trace: sg15_14). Twenty-five seconds of data are shown for both animals. The upper trace reflects the steady near stochastic discharge of a mature SGC. The discharge rate was 88sp/s, CVi = 0.89 and BI = 0.9. The lower trace illustrates the prominent bursting periods of the P5 SGC. This cell discharged slowly on average (mean spike rate = 1.8 sp/s) with repeated periods of intense activity separated by long silent periods. Interval coefficient of variation (CVi ) = 4.1, burst index (BI) = 8.8. This recording segment evidenced an equivalent burst rate approaching 10 burst per minute but over the entire 6 minute period the burst rate was much lower ~ 4.1 bursts per minute since there were several very long periods with no activity (not shown here).
Figure 5.
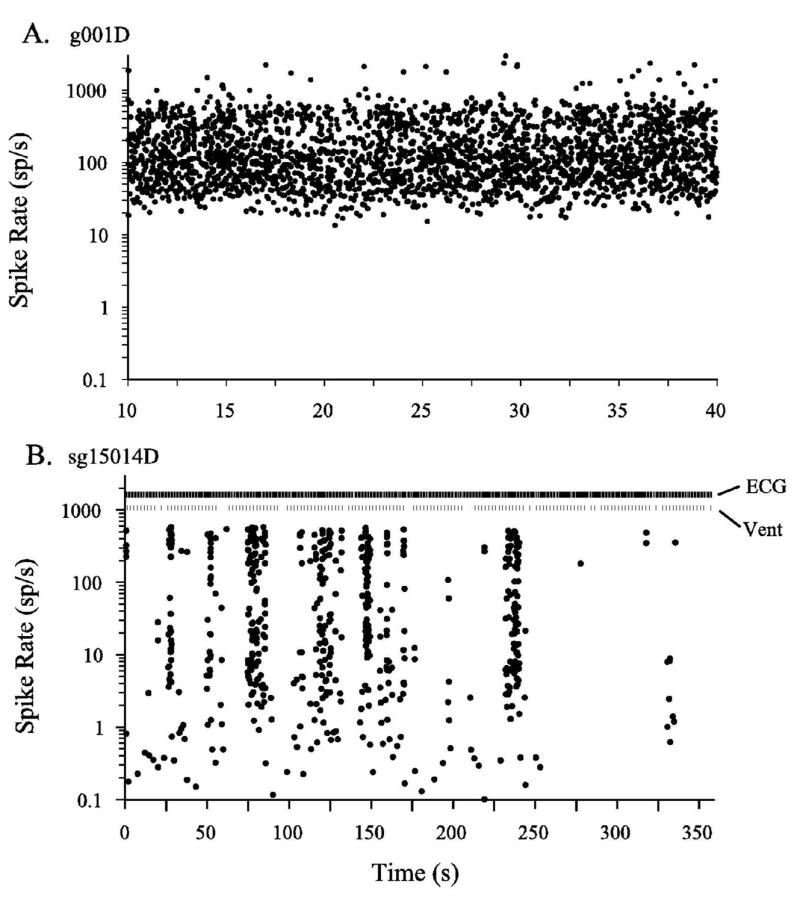
Spike discharge rate (sp/s) plotted as a function of time in seconds (s) for two SGC neurons. Each point represents the onset time (x-axis, s) of a neural spike discharge and the equivalent spike rate (y-axis, sp/s), where spike rate was calculated as the reciprocal of the time interval between the current and previous spike. The neuron represented in panel A (g001D) was recorded from a one-month-old kitten (102 dpc) and displays a rather continuous stochastic discharge pattern. In contrast, the neuron in panel B was recorded from a 71 dpc (P5) neonate, sg15014D. Panel B shows the striking repetitive periods of high activity separated by periods of low activity or silence. The scales for the time axes are considerably different for panels A and B. The overall spike discharge rates were also remarkably different. Numerical summary: Panel A: age = 102 dpc (P36), spike rate = 88 sp/s, CVi = 0.89, BI = 0.9. Panel B: age = 71 dpc (P5); spike rate = 1.8 sp/s; CVi = 4.1; BI = 8.8; burst rate = 4.1 bursts/min. ECG and ventilation (Vent) timing marks are indicated.
Bursting patterns represent a substantial deviation from the normal quasi-Poisson discharge pattern of a mature SGC, and for this reason the coefficient of variation of spike intervals (CVi) in the neonate was considerably larger than 1.0 (mean CVi = 2.9 across neurons, see below). In addition, the BI provided a more specific metric that emphasized the contrasts between multiple long silent and active periods. A BI value of 8.8 for cell sg15014D of Figure 5B is consistent with its prominent bursting pattern. Bursting patterns were apparent in graphic records when recordings were of sufficient length to capture several sequential active and quiet periods of discharge. This required relatively long continuous recordings. The average record duration was ~151 seconds. Bursting discharge patterns were characteristic of all but one (k001bD) neuron in neonates. Only three neurons had BI values below 2.0 and only the aforementioned single cell evidenced the absence of bursting based on the graphical discharge record and on the values for CVi and BI (k001bD: CVi = 1.08; BI = 0.78).
CVi ranged from 1.08 (one non-bursting cell) up to 10.4 and the mean CVi was 2.9 for all non-entrained neonatal neurons. The mean BI for the group was 5.2 and BI ranged from 0.78 (one non-bursting cell) to 16.5. In all but the one cell, CVi and BI values were greater than 1.1 reflecting dominant non-stochastic discharge patterns associated with the basic spontaneous spike activity and the presence of prominent periods of both silence and high activity (bursting). The overall distributions of values for both CVi and BI were independent of the duration of the recorded activity and CVi was independent of the mean discharge rate. These distributions of CVi and BI are illustrated in Figures 6 and 7. Salient quantitative features of spontaneous activity in the neonatal and one-month-old kittens are summarized in Table 3.
Figure 6.
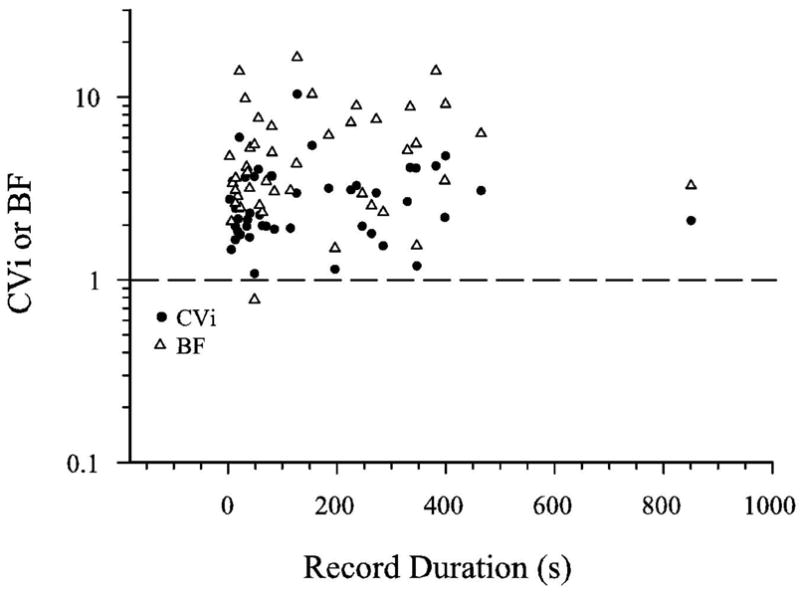
Distribution of CVi and BI for non-entrained cells of neonates. Values are plotted as a function of recording duration(s). CVi and BI were independent of recording duration.
Figure 7.

CVi versus spike rate. Spike interval coefficient of variation, CVi, plotted as a function of the mean spike interval (ms) for non-entrained cells of neonatal kittens. CVi was independent of spike rate and was generally well above 1.0 in the pre-hearing kitten.
Table 3.
Summary data for spontaneous discharge activity: Mean, standard deviation (SD) and number of neurons (n) are presented for several discharge metrics including: Recording duration (Duration, s), total number of spikes (Spikes), discharge rate (Rate, sp/s), inter-spike interval (Interval, ms), interval coefficient of variation (CVi), burst index (BI), burst rate, (bursts/minute). Means do not include cells evidencing modulation (i.e., entrainment) by cardiac or ventilation cycles.
| Age | Duration(s) | Spikes | Rate | Interval | CVi | BI | Burst Rate | |
|---|---|---|---|---|---|---|---|---|
| 69–75 dpc P3-P9 | mean | 151.7 | 288.8 | 3.09 | 2639.8 | 2.9 | 5.2 | 9.9 |
| SD | 169.2 | 689.4 | 8.24 | 4928.3 | 1.63 | 3.5 | 11.6 | |
| n | 48 | 48 | 48 | 48 | 45 | 45 | 45 | |
|
| ||||||||
| 102 dpc P36 | 79.9 | 7084 | 88.5 | 11.3 | 0.89 | 0.6 | na | |
Bursting patterns were also evident from the time histograms of spike discharge records. Figure 8 shows the variation coefficient values for the spike time histograms (VCTH values) of non-entrained SGC neurons. One can gain an appreciation for how bursting varied across SGC cells from Figure 8. VCTH values for sampled (filled circles) and simulated (open triangles) data showed striking differences in distributions. More pronounced bursting is associated with larger VCTH values. Those SGC neurons with the lowest VC values for sampled data were cells with very low discharge rates and relatively few spikes. The mean values for sampled and simulated data were substantially different whether the analysis time bins were based on the ECG period or ventilation period (see VCTH ECG and VCTH vent, p < 0.001, see Table 2). The means for the pooled VCTHs (ECG and ventilation) for sampled data were: VCTH ECG&vent = 8.2 +/− 8.9(49), and for simulated data: VCTH ECG&vent = 1.2 +/− 0.4 (49). These remarkable differences further demonstrated the non-stochastic nature of spontaneous SGC bursting discharge patterns for the group of neurons as a whole.
Figure 8.
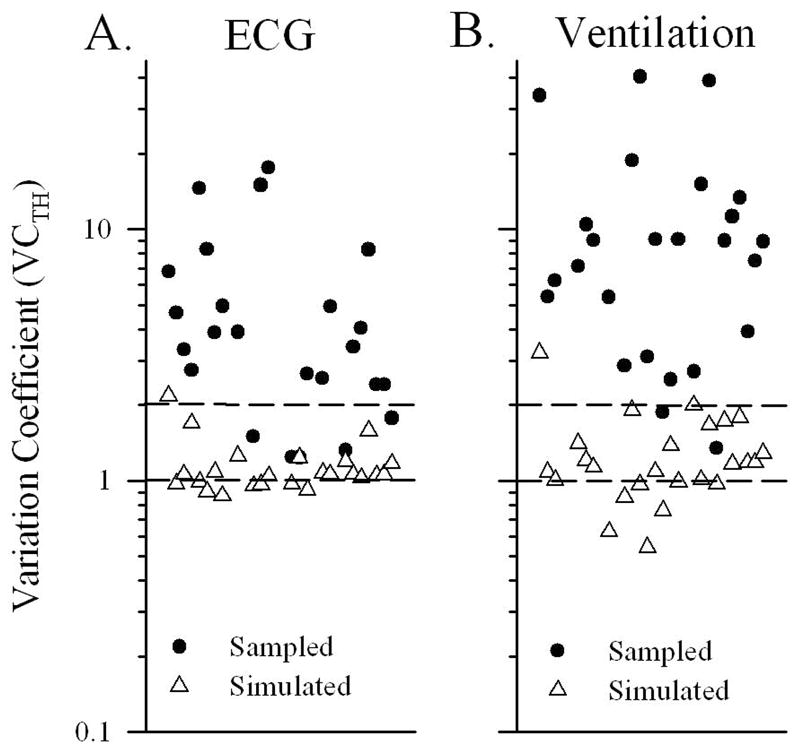
Shown are distributions of variation coefficient values (VCTH) for spike time histograms. VCTH values for sampled data (filled circles) and simulated data (open triangles) are illustrated for non-entrained cells of neonates. Panel A values were calculated using a time bin width equal to the ECG period (Panel A, VCTH ECG). Panel B values were calculated for the same spike data but using a time bin equal to the ventilation period (Panel B; VCTH vent). VCTH values for sampled data were greater than 1.0 and most were well above 2.0. In contrast VCTH values for simulated data generally are below 2.0 and have values approaching 1.0. Mean values for sampled and simulated data were significantly different (p < 0.001). The high values of VCTH reflect bursting spike discharge patterns. Summary mean values and statistics are presented in Table 2.
Burst Rates
Generally, the period of time between recurring bursts was not constant for a given cell, but rather it varied considerably throughout long records. The ganglion cell sg15014D shown in Figure 5B provides a good example of such variation. Burst rate ranged from 0.3 to 23.4 bursts/min for the cells of the spontaneous group. The mean rate was 4.3 +/− 5.0(36). The distribution of burst rates across cells is shown in Figure 9. For most cells (92%), burst rates were less than 11 bursts/min and the majority of these were less than 5 bursts/min. There was no evidence of a systematic increase in burst rate with age in the kitten.
Figure 9.
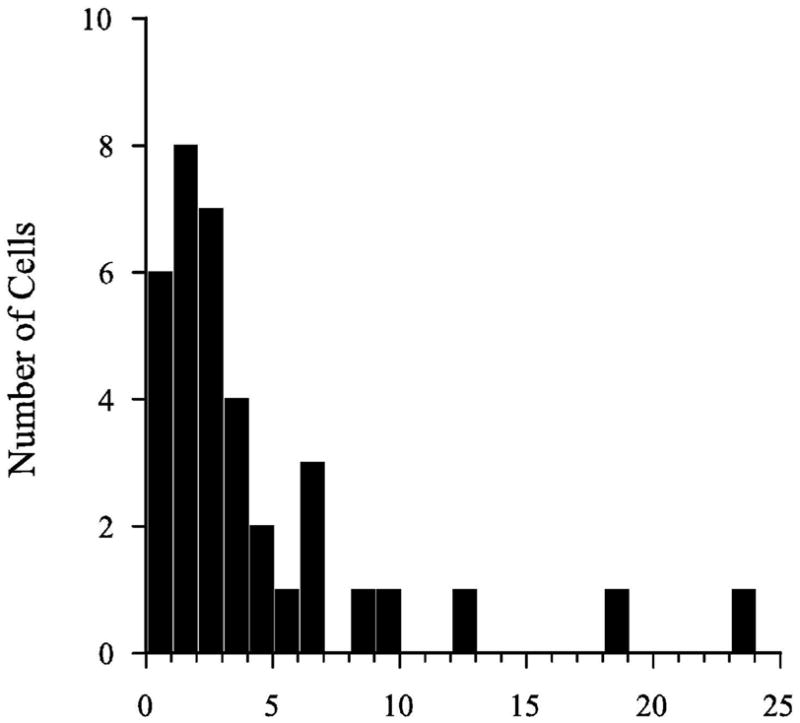
Burst rate histogram for spontaneous discharge activity of neonatal SGCs. Burst rates between 0.3 and 25 burst per minute were observed. The number of cells found at each rate (bin width 1 burst/minute) are represented.
Discussion
The results of the present study show that spontaneous discharge activity in SGCs of pre-hearing kittens is dominated by repeating bursts of neural discharge interspersed with periods of low activity. This rhythmic bursting discharge activity occurs despite overall low discharge rates. The pattern of activity is fundamentally different than the tonic quasi-Poisson spontaneous activity found in mature SGCs. Bursting patterns occurred in the absence of sound stimulation and were independent of potential stimuli associated with cardiac and ventilation cycles. With the possible exception of being slightly less regular in burst-to-burst period, the recurrent bursting was similar to that reported for ganglion cells in the pre-hearing bird (Jones et al. 2001). Burst rates for pre-hearing chicken embryos ranged from 1 to 54 bursts/min with only one cell producing a rate above 30 [means: through stage 39 => 9.8 burst/min, through stage 43 => 35 bursts/min] Based on the average inter-burst interval reported, Gummer and Mark (1994) apparently observed burst rates on the order of 7.5 to 95 bursts/min. The range of burst rates in the kitten (i.e., ~0.3 to 23) overlapped the lower end of those reported for the chicken and wallaby. We did not see a systematic increase in burst rate with age in the kitten as seen in the bird (Jones et al. 2001).
The spontaneous discharge rates of SGC of early neonates reported here and elsewhere (P2, e.g., Carlier et al. 1975; Romand 1984; Walsh and McGee 1987) were very low and it is reasonable to question whether such low discharge rates would be effective in influencing synaptic refinements in higher order auditory projections. There is evidence in neonates however, that central postsynaptic neurons of auditory projections exhibit unusual substantial and prolonged responses to single presynaptic spike discharges, and respond even more dramatically to bursts of such activity (Kotak and Sanes 1995). Thus, neonatal central circuits may be predisposed to respond to isolated spikes and bursting patterns present in neonatal SGC neurons.
Distinguishing the roles of spontaneous and driven rhythmic activity in neonatal kittens
Stimulus-driven rhythmic responses of auditory nerve fibers have been reported during the first postnatal week in kittens (Carlier et al. 1975; Walsh and Mcgee 1986; Walsh and McGee 1988; Pujol 1972). This sound evoked activity should be distinguished from the spontaneous rhythmic patterns shown here for two reasons. First, given the high thresholds of auditory fibers to sound (>90 dB SPL), it is unlikely that external acoustic stimuli play any significant role in driving activity patterns before P10. Second, even if sound levels were sufficient to activate cells during this period, one might expect external stimuli to interfere with the normal endogenous spontaneous rhythms. Hypothetically this could degrade rather than contribute to activity-dependent processes underlying refinements and segregation centrally.
Implications of the current findings for auditory development
There are at least two important questions to address. First, what mechanisms give rise to the bursting rhythms in SGCs and second, what possible role does such activity play in development?
Bursting mechanism
We have argued previously that in the absence of sound stimuli the discharge patterns of SGCs in pre-hearing animals as well as in the mature animal likely arise endogenously from within the cochlear neuroepithelium (Jones et al. 2001; Jones and Jones 2000; Jones et al. 2006). Our hypothesis is that SGC discharge patterns depend on the release of excitatory neurotransmitter from hair cells at afferent synapses. Therefore, the hair cell is seen as the primary source of excitation for spontaneous SGC bursting activity. This hypothesis is consistent with long held ideas about spontaneous ganglion cell discharge in mature animals and is supported by considerable evidence (e.g., Adrian 1943; Annoni et al. 1984; Flock and Russel 1976; Harris and Flock 1967; Furukawa and Ishii 1967; Furukawa et al. 1972; Harris and Flock 1967; Hudspeth 1986; Ishii et al. 1971; Katz 1969; Rossi et al. 1977; Schessel et al. 1991; Siegel 1992; Siegel and Dallos 1986; Glowatzki and Fuchs 2002). However in the mature animal, excitation is a relatively steady stochastic process. Given the non-stochastic bursting characteristics of SGC activity in the pre-hearing animal, we presume that a corresponding non-stochastic excitatory process must exist to generate such activity. Indeed, there is evidence suggesting that the IHC itself could provide the mechanism. During pre-hearing stages, IHCs are capable of generating spontaneous recurrent action potentials [mammals: (Kros et al. 1998; Marcotti et al. 2003b; Marcotti et al. 2003a; Marcotti et al. 2004); birds: (Fuchs and Sokolowski 1990; Fuchs and Evans 1990; Sokolowski and Cunningham 1999)]. Here we propose that spike discharge in the IHC leads to the discharge of SGCs and recurrent IHC spikes form the basis for the bursting patterns observed in the present study. The cochlear neuroepithelium is likely competent to mediate such activity at these ages in that the synaptic apparatus is present, post synaptic glutamate receptors are expressed and they are functional (Sobkowicz et al. 1982; Luo et al. 1995; Knipper et al. 1997; Glowatzki and Fuchs 2002). Moreover, IHC discharge has been shown to trigger exocytosis (Beutner and Moser 2001) as well as excite SGC terminal boutons (Glowatzki and Fuchs 2002). The ability of IHCs to generate spikes is transient, but it exists precisely during neonatal pre-hearing periods and then is lost with the onset of hearing.
Activity-dependent mechanisms, cochleotopic refinement and spontaneous bursting discharge patterns
As outlined in the Introduction, waves of spontaneous rhythmic discharge appear in the retina before the onset of vision. These patterns of activity are thought to serve Hebbian processes (Hebb 1949) operating centrally during the refinement of retinotopic projections (e.g., Katz and Shatz 1996; Ruthazer and Cline 2004). Retinal waves serve to synchronize the discharge of ganglion cells of small focal retinal regions and this process depends critically on local retinal networks (see: Feller 2002). The spatiotemporal pattern of activity is thought to be more important than the mere presence of ganglion cell activity. Indeed, the evidence suggests that central refinement and segregation requires correlated activity arising from spatially localized receptive areas on the retina (McLaughlin et al. 2003c; Ruthazer and Cline 2004; Mrsic-Flogel et al. 2005).
The rhythmic bursting patterns in SGCs of the kitten are reminiscent of retinal discharges. If this SGC activity serves Hebbian cochleotopic refinement processes centrally, then there must be a mechanism that can coordinate the activation of neighboring SGC to produce a correlated discharge. To our knowledge, circuitry like the cellular networks generating retinal waves does not exist in the cochlea. However, there are other unique features of cochlear afferent innervation that can lead to a correlated pattern of discharge in small groups of adjacent SGCs.
Generally in the mature cochlea each radial SGC innervates only one IHC, although each IHC is innervated by a group of 20 to 40 SGCs (Liberman 1982; Liberman 1980; Spoendlin 1969). This anatomical fact ensures that the activity of all SGCs innervating one IHC is strictly dependent upon and thus correlated with activity in the common presynaptic receptor cell. A somewhat less precise but similar configuration is already present at birth in the mammal (Simmons et al. 1991; Perkins and Morest 1975). According to these reports, during the first two neonatal days the vast majority of SGC dendrites branch to innervate two or three adjacent IHCs although occasionally more contacts are seen (up to 8). Thereafter, dendritic branching and multiple IHC contacts decrease abruptly and by P3 over 60% of SGCs innervate a single IHC. By the end of the first neonatal week the adult configuration is in place.
Given the common termination of scores of ganglion cells on a single IHC, each IHC must coordinate the activity of a group of SGCs. At the earliest ages some ganglion cells might be activated by two or more IHC, but this likely resolves quickly to an exclusive functional relationship with one IHC. Since IHCs are capable of regenerative spike discharge and excitation of SGC terminal boutons at these stages (as discussed above), it follows that such discharge would lead to the correlated activity of scores of SGCs. We hypothesize that for each individual SGC recorded in the present study, there were scores of companion SGCs that discharged in a linked coordinated manner. In the presence of repetitive IHC spike discharge, SGCs would exhibit correlated recurrent bursting discharge activity. Ultimately, such correlated activity would be linked to the position occupied by a single IHC in the organ of Corti. This hypothesis simultaneously accounts for the required correlated activity and the strict local cochleotopic organization necessary to drive central Hebbian refinement processes.
An additional mechanism capable of orchestrating correlated activity among IHCs within a small region of the organ of Corti may be required to further refine the spatial organization of higher order cochleotopic groups. Cochlear efferent terminals are known to form transiently on IHCs in the neonate and one possible mechanism is that activity in these efferent terminations could serve to modulate and thus correlate activity among IHCs locally (Goutman et al. 2005; Glowatzki and Fuchs 2000; Walsh and Mcgee 1997). A complete picture of factors contributing to the patterns of activity in IHCs and SGCs has yet to emerge. It is conceivable that correlated activity of IHCs and in turn SGCs also contributes to ear-specific segregation and refinement at levels of the auditory pathway where binaural projections converge. The working hypotheses outlined above remain to be critically tested.
In addition to guiding central refinements, the recurrent IHC spike discharge may be responsible in part for refinement of SGC terminal contacts in the organ of Corti itself. Although, IHCs are clearly capable of sustaining recurrent spike discharges in the neonate, the regulation of such discharge in vivo remains an exciting open question.
The spontaneous bursting patterns reported here for the kitten were similar to patterns found in cochlear ganglion cells of the early pre-hearing chicken embryo (Jones et al. 2001) and both patterns remind us of spontaneous retinal discharges. Despite many differences in the cochleas of birds and mammals, the discharge similarities during pre-hearing periods may reflect shared developmental processes. Whether the working hypothesis proposed here for the mammal applies to the bird is an interesting question and remains to be explored.
The present results are consistent with the hypothesis that spontaneous rhythmic bursting activity in SGC of pre-hearing mammals plays a critical role in the refinement of central cochleotopic projections. Clear from the present study is the fact that these spontaneous discharge patterns are present during the period of final refinement of cochleotopic projections from the cochlea to the cochlear nucleus (Leake et al. 2002). Furthermore the rhythmic bursting discharge of ganglion cells occurs in vivo precisely during the transient pre-hearing period following the onset of repetitive IHC spike discharge in vitro (Kros et al. 1998; Marcotti et al. 2003b; Marcotti et al. 2003a; Marcotti et al. 2004), the appearance of synaptic ribbons and onset of IHC exocytosis (Sobkowicz et al. 1982; Beutner and Moser 2001; Glowatzki and Fuchs 2002) and during the stabilization of terminal contacts of individual SGCs onto single IHCs and reorganization of efferent terminals (Simmons et al. 1991; Perkins and Morest 1975; Goutman et al. 2005; Glowatzki and Fuchs 2000). Finally, given the putative critical role for the IHC in the hypothesis above, it is worth noting that cochleotopic refinements in the cochlear nucleus fail to occur in neonates when IHCs are destroyed at birth by ototoxic drugs (Leake et al. 2006). Such a lesion would, among other things, eliminate normal spontaneous activity in SGCs. Together, these observations suggest both a mechanism for stimulus-independent rhythmic bursting of ganglion cells as well as a possible role for such discharge patterns in guiding the pre-hearing activity-dependent refinement in central auditory relays.
Acknowledgments
We thank Melissa Jensen and Fiona Foley for their excellent assistance.
Grants: Supported by NIH NIDCD 5R01-DC00160 (PAL) and by NIH NIDCD R01-DC02753 (TAJ) and R01-DC005776 (TAJ).
References
- Adrian ED. Discharges from vestibular receptors in the cat. J Physiol (Lond) 1943;101:389–407. doi: 10.1113/jphysiol.1943.sp003995. [DOI] [PMC free article] [PubMed] [Google Scholar]
- Anastasio TJ, Correia MJ, Perachio AA. Spontaneous and driven responses of semicircular canal primary afferents in the unanesthetized pigeon. J Neurophysiol. 1985;54:335–347. doi: 10.1152/jn.1985.54.2.335. [DOI] [PubMed] [Google Scholar]
- Annoni JM, Cochran SL, Precht W. Pharmacology of the vestibular hair cell-afferent fiber synapse in the frog. J Neurosci. 1984;4:2106–2116. doi: 10.1523/JNEUROSCI.04-08-02106.1984. [DOI] [PMC free article] [PubMed] [Google Scholar]
- Batschelet E. Introduction to Mathematics for Life Scientists. Berlin: Springer-Verlag; 1979. pp. 1–643. [Google Scholar]
- Beutner D, Moser T. The presynaptic function of mouse cochlear inner hair cells during development of hearing. J Neurosci. 2001;21:4593–4599. doi: 10.1523/JNEUROSCI.21-13-04593.2001. [DOI] [PMC free article] [PubMed] [Google Scholar]
- Cang J, Renteria RC, Kaneko M, Liu X, Copenhagen DR, Stryker MP. Development of precise maps in visual cortex requires patterned spontaneous activity in the retina. Neuron. 2005;48:797–809. doi: 10.1016/j.neuron.2005.09.015. [DOI] [PMC free article] [PubMed] [Google Scholar]
- Cant N. Structural development of the mammalian auditory pathways. In: Rubel EW, Popper AN, Fay RR, editors. Development of the Auditory System. New York: Springer; 1998. pp. 315–413. [Google Scholar]
- Carlier E, Abonnenc M, Pujol R. Maturation des responses unitaires a la stimulation tonale dans le nerf cochleaire du chaton. J Physiol (Paris) 1975;70:129–138. [PubMed] [Google Scholar]
- Demas J, Sagdullaev BT, Green E, Jaubert-Miazza L, McCall MA, Gregg RG, Wong ROL, Guido W. Failure to maintain eye-specific segregation in nob, a mutant with abnormally patterned retinal activity. Neuron. 2006;50:247–259. doi: 10.1016/j.neuron.2006.03.033. [DOI] [PubMed] [Google Scholar]
- Feller MB. The role of nAChR-mediated spontaneous retinal activity in visual system development. J Neurobiol. 2002;53:556–567. doi: 10.1002/neu.10140. [DOI] [PubMed] [Google Scholar]
- Fitzakerley JL, Mcgee J, Walsh EJ. Paradoxical relationship between frequency selectivity and threshold sensitivity during auditory-nerve fiber development. J Acoust Soc Am. 1998;103:3464–3477. doi: 10.1121/1.423055. [DOI] [PubMed] [Google Scholar]
- Flock A, Russel I. Inhibition by efferent nerve fibres: Action on hair cells and afferent synaptic transmission in the lateral line canal organ of the burbot lota lota. J Physiol. 1976;257:45–62. doi: 10.1113/jphysiol.1976.sp011355. [DOI] [PMC free article] [PubMed] [Google Scholar]
- Fuchs PA, Evans MG. Potassium currents in hair cells isolated from the cochlea of the chick. J Physiol. 1990;429:529–551. doi: 10.1113/jphysiol.1990.sp018271. [DOI] [PMC free article] [PubMed] [Google Scholar]
- Fuchs PA, Sokolowski BHA. The acquisition during development of Ca-activated potassium currents by cochlear hair cells of the chick. Proc Roy Soc Lond B. 1990;241:122–126. doi: 10.1098/rspb.1990.0075. [DOI] [PubMed] [Google Scholar]
- Furukawa T, Ishii Y. Neurophysiological studies on hearing in goldfish. J Neurophysiol. 1967;30:1377–1403. doi: 10.1152/jn.1967.30.6.1377. [DOI] [PubMed] [Google Scholar]
- Furukawa T, Ishii Y, Matsuura S. Synaptic delay and time course of post-synaptic potentials at the junction between hair cells and eighth nerve fibers in the goldfish. Japan J Physiol. 1972;22:617–635. doi: 10.2170/jjphysiol.22.617. [DOI] [PubMed] [Google Scholar]
- Glowatzki E, Fuchs PA. Cholinergic synaptic inhibition of inner hair cells in the neonatal mammalian cochlea. Science. 2000;288:2366–2368. doi: 10.1126/science.288.5475.2366. [DOI] [PubMed] [Google Scholar]
- Glowatzki E, Fuchs PA. Transmitter release at the hair cell ribbon synapse. Nat Neurosci. 2002;5:147–154. doi: 10.1038/nn796. [DOI] [PubMed] [Google Scholar]
- Goldberg JM, Fernandez C. Physiology of peripheral neurons innervating semicircular canals of the squirrel monkey. III. Variations among units in their discharge properties. J Neurophysiol. 1971;34:676–684. doi: 10.1152/jn.1971.34.4.676. [DOI] [PubMed] [Google Scholar]
- Goutman JD, Fuchs PA, Glowatzki E. Facilitating efferent inhibition of inner hair cells in the cochlea of the neonatal rat. J Physiol (Lond) 2005;566:49–59. doi: 10.1113/jphysiol.2005.087460. [DOI] [PMC free article] [PubMed] [Google Scholar]
- Gummer AW, Mark RF. Patterned neural activity in brain stem auditory areas of a prehearing mammal, the tammar wallaby Macropus eugenii. Neuroreport. 1994;5:685–688. doi: 10.1097/00001756-199402000-00006. [DOI] [PubMed] [Google Scholar]
- Harris GG, Flock A. Spontaneous and evoked activity from the xenopus laevis lateral line. In: Cahn PH, editor. Lateral Line Detectors. Bloomington, IN: Indiana University Press; 1967. pp. 135–161. [Google Scholar]
- Hebb DO. The organization of behavior. New York: J. Wiley & Sons; 1949. [Google Scholar]
- Hindges R, McLaughlin T, Genoud N, Henkemeyer M, O’Leary DD. EphB forward signaling controls directional branch extension and arborization required for dorsal-ventral retinotopic mapping. Neuron. 2002;35:475–487. doi: 10.1016/s0896-6273(02)00799-7. [DOI] [PubMed] [Google Scholar]
- Hudspeth AJ. The ionic channels of a vertbrate hair cell. Hear Res. 1986;22:21–27. doi: 10.1016/0378-5955(86)90070-5. [DOI] [PubMed] [Google Scholar]
- Ishii Y, Matsuura S, Furukawa T. Quantal nature of transmission at the synapse between hair cells and eighth nerve fibers. Japan J Physiol. 1971;21:79–89. doi: 10.2170/jjphysiol.21.79. [DOI] [PubMed] [Google Scholar]
- Jones TA, Jones SM. Spontaneous activity in the statoacoustic ganglion of the chicken embryo. J Neurophysiol. 2000;83:1452–1468. doi: 10.1152/jn.2000.83.3.1452. [DOI] [PubMed] [Google Scholar]
- Jones TA, Jones SM, Paggett KC. Primordial rhythmic bursting in embryonic cochlear ganglion cells. J Neurosci. 2001;21:8129–8135. doi: 10.1523/JNEUROSCI.21-20-08129.2001. [DOI] [PMC free article] [PubMed] [Google Scholar]
- Jones TA, Jones SM, Paggett KC. Emergence of hearing in the chicken embryo. J Neurophysiol. 2006;96:128–141. doi: 10.1152/jn.00599.2005. [DOI] [PubMed] [Google Scholar]
- Katz B. The release of neural transmitter substances. Liverpool: University Press; 1969. pp. 1–59. [Google Scholar]
- Katz LC, Shatz CJ. Synaptic activity and the construction of cortical circuits. Science. 1996;274:1133–1138. doi: 10.1126/science.274.5290.1133. [DOI] [PubMed] [Google Scholar]
- Kiang NYS. Discharge patterns of single fibers in the cat’s auditory nerve. Cambridge: MIT Press; 1965. pp. 1–154. [Google Scholar]
- Knipper M, Kopschall I, Rohbock K, Kopke AKE, Bonk I, Zenner HP. Transient expression of NMDA receptors during rearrangement of AMPA-receptor-expressing fibers in the developing inner ear. Cell Tiss Res. 1997;287:23–41. doi: 10.1007/s004410050729. [DOI] [PubMed] [Google Scholar]
- Kotak VC, Sanes DH. Synaptically evoked prolonged depolarizations in the developing auditory system. J Neurophysiol. 1995;74:1611–1620. doi: 10.1152/jn.1995.74.4.1611. [DOI] [PubMed] [Google Scholar]
- Kros CJ, Ruppersberg JP, Rusch A. Expression of a potassium current in inner hair cells during development of hearing in mice. Nature. 1998;394:284. doi: 10.1038/28401. [DOI] [PubMed] [Google Scholar]
- Leake PA, Hradek GT, Chair L, Snyder RL. Neonatal deafness results in degraded topographic specificity of auditory nerve projections to the cochlear nucleus in cats. J Comp Neurol. 2006;497:13–31. doi: 10.1002/cne.20968. [DOI] [PMC free article] [PubMed] [Google Scholar]
- Leake PA, Snyder RL, Hradek GT. Postnatal refinement of auditory nerve projections to the cochlear nucleus in cats. J Comp Neurol. 2002;448:6–27. doi: 10.1002/cne.10176. [DOI] [PMC free article] [PubMed] [Google Scholar]
- Leake PA, Snyder RL, Merzenich MM. Topographic organization of the cochlear spiral ganglion demonstrated by restricted lesions of the anteroventral cochlear nucleus. The Journal of Comparative Neurology. 1992;320:468–478. doi: 10.1002/cne.903200405. [DOI] [PubMed] [Google Scholar]
- Liberman MC. Auditory-nerve response from cats raised in a low-noise chamber. J Acoust Soc Am. 1978;63:442–455. doi: 10.1121/1.381736. [DOI] [PubMed] [Google Scholar]
- Liberman MC. Morphological differences among radial afferent fibers in the cat cochlea: an electon-microscopic study of serial sections. Hear Res. 1980;3:45–63. doi: 10.1016/0378-5955(80)90007-6. [DOI] [PubMed] [Google Scholar]
- Liberman MC. Single-neuron labeling in the cat auditory nerve. Science. 1982;216:1239–1241. doi: 10.1126/science.7079757. [DOI] [PubMed] [Google Scholar]
- Lippe WR. Rhythmic spontaneous activity in the developing avian auditory system. J Neurosci. 1994;14:1486–1495. doi: 10.1523/JNEUROSCI.14-03-01486.1994. [DOI] [PMC free article] [PubMed] [Google Scholar]
- Lippe WR. Relationship between frequency of spontaneous bursting and tonotopic position in the developing avian auditory system. Brain Res. 1995;703:205–213. doi: 10.1016/0006-8993(95)01096-3. [DOI] [PubMed] [Google Scholar]
- Luo L, Brumm D, Ryan AF. Distribution of non-NMDA glutamate receptor mRNAs in the developing rat cochlea. J Comp Neurol. 1995;361:372–382. doi: 10.1002/cne.903610303. [DOI] [PubMed] [Google Scholar]
- Marcotti W, Johnson SL, Holley MC, Kros CJ. Developmental changes in the expression of potassium currents of embryonic, neonatal and mature mouse inner hair cells. J Physiol (Lond) 2003a;548:383–400. doi: 10.1113/jphysiol.2002.034801. [DOI] [PMC free article] [PubMed] [Google Scholar]
- Marcotti W, Johnson SL, Kros CJ. A transiently expressed SK current sustains and modulates action potential activity in immature mouse inner hair cells. J Physiol (Lond) 2004;560:691–708. doi: 10.1113/jphysiol.2004.072868. [DOI] [PMC free article] [PubMed] [Google Scholar]
- Marcotti W, Johnson SL, Rusch A, Kros CJ. Sodium and calcium currents shape action potentials in immature mouse inner hair cells. J Physiol (Lond) 2003b;552:743–761. doi: 10.1113/jphysiol.2003.043612. [DOI] [PMC free article] [PubMed] [Google Scholar]
- McLaughlin T, Hindges R, O’Leary DD. Regulation of axial patterning of the retina and its topographic mapping in the brain. Curr Opin Neurobiol. 2003a;13:57–69. doi: 10.1016/s0959-4388(03)00014-x. [DOI] [PubMed] [Google Scholar]
- McLaughlin T, Hindges R, Yates PA, O’Leary DD. Bifunctional action of ephrin-B1 as a repellent and attractant to control bidirectional branch extension in dorsal-ventral retinotopic mapping. Development. 2003b;130:2407–2418. doi: 10.1242/dev.00467. [DOI] [PubMed] [Google Scholar]
- McLaughlin T, O’leary DDM. Molecular gradients and development of retinotopic maps. Annu Rev Neurosci. 2005;28:327–355. doi: 10.1146/annurev.neuro.28.061604.135714. [DOI] [PubMed] [Google Scholar]
- McLaughlin T, Torborg CL, Feller MB, O’Leary DD. Retinotopic map refinement requires spontaneous retinal waves during a brief critical period of development. Neuron. 2003c;40:1147–1160. doi: 10.1016/s0896-6273(03)00790-6. [DOI] [PubMed] [Google Scholar]
- Mrsic-Flogel TD, Hofer SB, Creutzfeldt C, Cloez-Tayarani I, Changeux JP, Bonhoeffer T, Hubener M. Altered map of visual space in the superior colliculus of mice lacking early retinal waves. The Journal of Neuroscience. 2005;25:6921–6928. doi: 10.1523/JNEUROSCI.1555-05.2005. [DOI] [PMC free article] [PubMed] [Google Scholar]
- O’Leary DD, McLaughlin T. Mechanisms of retinotopic map development: Ephs, ephrins, and spontaneous correlated retinal activity. Prog Brain Res. 2005;147:43–65. doi: 10.1016/S0079-6123(04)47005-8. [DOI] [PubMed] [Google Scholar]
- Perkel DH, Gernstein GL, Moore GP. Neuronal spike trains and stochastic point processes I.: The single spike train. Biophys J. 1967;7:391–418. doi: 10.1016/S0006-3495(67)86596-2. [DOI] [PMC free article] [PubMed] [Google Scholar]
- Perkins RE, Morest DK. A study of cochlear innervation patterns in cats and rats with the Golgi method and Nomarski optics. J Comp Neurol. 1975;163:129–158. doi: 10.1002/cne.901630202. [DOI] [PubMed] [Google Scholar]
- Pujol R. Development of tone-burst responses along the auditory pathway in the cat. Acta Otolaryngol (Stockh) 1972;74:383–391. doi: 10.3109/00016487209128467. [DOI] [PubMed] [Google Scholar]
- Romand R. Functional properties of auditory-nerve fibers during postnatal development in the kitten. Exp Brain Res. 1984;56:395–402. doi: 10.1007/BF00237980. [DOI] [PubMed] [Google Scholar]
- Rossi ML, Valli P, Casella C. Post-synaptic potentials recorded from afferent nerve fibres of the posterior semicircular canal in the frog. Brain Res. 1977;135:67–75. doi: 10.1016/0006-8993(77)91052-6. [DOI] [PubMed] [Google Scholar]
- Rubsamen R, Schafer M. Ontogenesis of auditory fovea representation in the inferior colliculus of the Sri Lankin rufous horseshoe bat, Rhinolophus rouxi. J Comp Physiol A. 1990;167:757–769. doi: 10.1007/BF00189766. [DOI] [PubMed] [Google Scholar]
- Ruthazer ES, Akerman CJ, Cline HT. Control of axon branch dynamics by correlated activity in vivo. Science. 2003;301:66–70. doi: 10.1126/science.1082545. [DOI] [PubMed] [Google Scholar]
- Ruthazer ES, Cline HT. Insights into activity-dependent map formation from the retinotectal system: A middle-of-the-brain perspective. J Neurobiol. 2004;59:134–146. doi: 10.1002/neu.10344. [DOI] [PubMed] [Google Scholar]
- Sanes DH, Walsh EJ. The development of central auditory processing. In: Rubel EW, Popper AN, Fay RR, editors. Development of the Auditory System. New York, NY: Springer-Verlag New York, Inc; 1998. pp. 271–314. [Google Scholar]
- Sato M, Leake PA, Hradek GT. Postnatal development of the organ of corti in cats: A light microscopic morphometric study. Hear Res. 1999;127:1–13. doi: 10.1016/s0378-5955(98)00143-9. [DOI] [PubMed] [Google Scholar]
- Schessel DA, Ginzberg R, Highstein SM. Morphophysiology of synaptic transmission between type I hair cells and vestibular primary afferents. An intracellular study employing horseradish peroxidase in the lizard, Calotes versicolor. Brain Res. 1991;544:1–16. doi: 10.1016/0006-8993(91)90879-z. [DOI] [PubMed] [Google Scholar]
- Siegel JH. Spontaneous synaptic potentials from afferents terminals in the guinea pig cochlea. Hear Res. 1992;59:85–92. doi: 10.1016/0378-5955(92)90105-v. [DOI] [PubMed] [Google Scholar]
- Siegel JH, Dallos P. Spike activity recorded from the organ of Corti. Hear Res. 1986;22:245–248. doi: 10.1016/0378-5955(86)90101-2. [DOI] [PubMed] [Google Scholar]
- Simmons DD, Manson-Gieseke L, Hendrix TW, Morris K, Williams SJ. Postnatal maturation of spiral ganglion neurons: a horseradish peroxidase study. Hear Res. 1991;55:81–91. doi: 10.1016/0378-5955(91)90094-p. [DOI] [PubMed] [Google Scholar]
- Snyder RL, Leake PA. Topography of spiral ganglion projections to cochlear nucleus during postnatal development in cats. J Comp Neurol. 1997;384:293–311. doi: 10.1002/(sici)1096-9861(19970728)384:2<293::aid-cne9>3.0.co;2-x. [DOI] [PubMed] [Google Scholar]
- Snyder RL, Leake PA, Hradek GT. Quantitative analysis of spiral ganglion projections to the cat cochlear nucleus. The Journal of Comparative Neurology. 1997;379:133–149. doi: 10.1002/(sici)1096-9861(19970303)379:1<133::aid-cne9>3.0.co;2-5. [DOI] [PubMed] [Google Scholar]
- Sobkowicz HM, Rose JE, Scott GE, Slapnick SM. Ribbon synapses in the developing intact and cultured organ of corti in the mouse. J Neurosci. 1982;2:942–957. doi: 10.1523/JNEUROSCI.02-07-00942.1982. [DOI] [PMC free article] [PubMed] [Google Scholar]
- Sokolowski BHA, Cunningham AM. Patterns of synaptophysin expression during development of the inner ear in the chick. J Neurobiol. 1999;38:46–64. doi: 10.1002/(sici)1097-4695(199901)38:1<46::aid-neu4>3.0.co;2-s. [DOI] [PubMed] [Google Scholar]
- Spoendlin H. Innervation patterns in the organ of Corti of the cat. Acta Otolaryngol (Stockh) 1969;67:239–254. doi: 10.3109/00016486909125448. [DOI] [PubMed] [Google Scholar]
- Stellwagen D, Shatz CJ. An instructive role for retinal waves in the development of retinogeniculate connectivity. Neuron. 2002;31:357–367. doi: 10.1016/s0896-6273(02)00577-9. [DOI] [PubMed] [Google Scholar]
- Walsh BT, Miller JB, Gacek RR, Kiang NYS. Spontaneous activity in the eighth cranial nerve of the cat. Int J Neurosci. 1972;3:221–236. [Google Scholar]
- Walsh EJ, Mcgee J. The development of function in the auditory periphery. In: Altschuler R, Bobbin R, Hoffman D, editors. Neurobiology of Hearing: The Cochlea. New York: Raven Press; 1986. pp. 247–269. [Google Scholar]
- Walsh EJ, Mcgee J. Does activity in the olivocochlear bundle affect development of the auditory periphery? In: Lewis ER, Long GR, Lyon RF, Narins PM, Steele CR, Hecht-Poinar E, editors. Diversity in auditory mechanics. Singapore: World Scientific; 1997. pp. 376–385. [Google Scholar]
- Walsh EJ, McGee JA. Postnatal development of auditory nerve and cochlear nucleus neuronal responses in kittens. Hear Res. 1987;28:97–116. doi: 10.1016/0378-5955(87)90157-2. [DOI] [PubMed] [Google Scholar]
- Walsh EJ, McGee JA. Rhythmic discharge properties of caudal cochlear nucleus neurons during postnatal development in cats. Hear Res. 1988;36:233–248. doi: 10.1016/0378-5955(88)90065-2. [DOI] [PubMed] [Google Scholar]
- Walsh EJ, Romand R. Functional development of the cochlea and the cochlear nerve. In: Romand R, editor. Development of Auditory and Vestibular Systems 2. New York: Elsevier Science Publishers BV; 1992. pp. 161–219. [Google Scholar]
- Yates PA, Holub AD, McLaughlin T, Sejnowski TJ, O’Leary DD. Computational modeling of retinotopic map development to define contributions of EphA-ephrinA gradients, axon-axon interactions, and patterned activity. J Neurobiol. 2004;59:95–113. doi: 10.1002/neu.10341. [DOI] [PMC free article] [PubMed] [Google Scholar]