

Abstract
Tetrodotoxin-resistant (TTX-R) Na+ channels are 1,000-fold less sensitive to TTX than TTX-sensitive (TTX-S) Na+ channels. On the other hand, TTX-R channels are much more susceptible to external Cd2+ block than TTX-S channels. A cysteine (or serine) residue situated just next to the aspartate residue of the presumable selectivity filter “DEKA” ring of the TTX-R channel has been identified as the key ligand determining the binding affinity of both TTX and Cd2+. In this study we demonstrate that the binding affinity of Cd2+ to the TTX-R channels in neurons from dorsal root ganglia has little intrinsic voltage dependence, but is significantly influenced by the direction of Na+ current flow. In the presence of inward Na+ current, the apparent dissociation constant of Cd2+ (∼200 μM) is ∼9 times smaller than that in the presence of outward Na+ current. The Na+ flow–dependent binding affinity change of Cd2+ block is true no matter whether the direction of Na+ current is secured by asymmetrical chemical gradient (e.g., 150 mM Na+ vs. 150 mM Cs+ on different sides of the membrane, 0 mV) or by asymmetrical electrical gradient (e.g., 150 mM Na+ on both sides of the membrane, −20 mV vs. 20 mV). These findings suggest that Cd2+ is a pore blocker of TTX-R channels with its binding site located in a multiion, single-file region near the external pore mouth. Quantitative analysis of the flow dependence with the flux-coupling equation reveals that at least two Na+ ions coexist with the blocking Cd2+ ion in this pore region in the presence of 150 mM ambient Na+. Thus, the selectivity filter of the TTX-R Na+ channels in dorsal root ganglion neurons might be located in or close to a multiion single-file pore segment connected externally to a wide vestibule, a molecular feature probably shared by other voltage-gated cationic channels, such as some Ca2+ and K+ channels.
Keywords: ion permeation, flux-coupling, selectivity filter, multiion pore, single-file region
INTRODUCTION
Tetrodotoxin (TTX)* is a well-known blocker of voltage-gated Na+ channels. In mammalian central neurons many Na+ channels are selectively inhibited by nanomolar or subnanomolar external TTX. These channels are referred to as TTX-sensitive (TTX-S) channels. However, some other Na+ channels are much less sensitive to TTX, and require hundreds of nanomoles to hundreds of micromoles of TTX to produce the inhibition (TTX-resistant or TTX-R channels; Kleinhaus and Pritchard, 1976; Cohen et al., 1981; Lombet et al., 1982; Roy and Narahashi, 1992). In the nervous system, the dorsal root ganglion neurons contain abundant TTX-R channels (Kostyuk et al., 1981; Roy and Narahashi 1992; Akopian et al., 1996; Rush et al., 1998) which have been implicated to play an important role in the physiology and pathophysiology of pain transmission (Akopian et al., 1999; Kral et al., 1999).
In addition to TTX sensitivity, TTX-R and TTX-S channels are also different in the pore-blocking effect of transitional metal ions such as Cd2+ and Zn2+ (Frelin et al., 1986; Backx et al., 1992; Sheets and Hanck, 1992). In dorsal root ganglion neurons, 5 mM Cd2+ inhibits >85% of TTX-R currents yet inhibits only ∼30% of TTX-S currents (at 0 mV; Roy and Narahashi, 1992). In cardiac myocytes or Purkinje cells, which contain almost only TTX-R channels (the TTX-R channels in heart and in dorsal root ganglion neurons are distinct but closely related molecular clones, for reviews see Goldin et al., 2000; Goldin, 2001), 0.1–0.3 mM Cd2+ caused 50% inhibition of the Na+ current (IC50 = 0.1–0.3 mM; Visentin et al., 1990; Ravindran et al., 1991; Sheets and Hanck, 1992). But the IC50 of Cd2+ block of Na+ current in rat skeletal muscle, which contains almost only TTX-S channels, is 17 mM (Ravindran et al., 1991). It has been shown that one single amino acid at position 374 of the channel protein plays a critical role in both TTX and Cd2+ sensitivity. In TTX-S channels this amino acid is tyrosine (Y374), but in TTX-R channels it is cysteine or serine. TTX-R channels with a point mutation at this position (C374Y) show markedly decreased affinity to Cd2+, but increased affinity to TTX (Satin et al., 1992). Also, mutant (Y374C) TTX-S channels show markedly increased affinity to Cd2+, but decreased affinity to TTX (Backx et al., 1992).
The selectivity filter of the Na+ channel has been implicated to involve the DEKA ring in the pore (highly conserved aspartate, glutamate, lysine, and alanine in domain I, II, III, and IV of the channel protein, respectively), because mutations of the ring would significantly change ionic selectivity (Heinemann et al., 1992b; Favre et al., 1996). Interestingly, the foregoing cysteine residue (C374) is situated next to the aspartate residue in the DEKA ring (D373), and thus the Cd2+ blocking site is probably near or in the DEKA region. This is reminiscent of the case of Ca2+ channels, where Cd2+ is also a potent pore blocker and binds to an “EEEE” ring in the pore (one glutamate residue in each domain of the Ca2+ channel protein, at exactly the corresponding loci of the DEKA ring). This EEEE ring not only binds divalent ions much more tightly than the monovalent ions and thus confers the selectivity for Ca2+ ions (the “selectivity filter” of the channel), but also participates in the buildup of a “set” of contiguous ion binding sites capable of accommodating at least two Ca2+ ions simultaneously (Hess and Tsien, 1984; Kuo and Hess, 1993a,b; Yang et al., 1993, Ellinor et al., 1995).
One might expect a similar molecular design of the pore near the DEKA and the EEEE rings based on the foregoing analogy between Na+ and Ca2+ channels. However, even the multiion nature of the Na+ channel is an unsettled issue. Early 22Na+ flux ratio data (Begenisich and Busath, 1981) and the independence of Na+ channel selectivity of the mole fraction of the permeant ions (Green et al., 1987) would suggest that the Na+ channel is rarely occupied by two or more Na+. But Ravindran et al. (1991) maintained that the conductance–concentration behavior of muscle and heart Na+ channels favors a multiion model of Na+ permeation. The anomalous mole fraction behavior between Na+ and Ca2+ associated with mutations in the DEKA ring (Heinemann et al., 1992b; Teresa Perez-Garcia et al., 1997) also supports the possibility of ion–ion interaction in this pore region. The different blocking effect of internal spermine on Na+ channels in different directions of Na+ current flow also suggests ion–ion (Na+-spermine) interaction and multiion nature of the Na+ channel pore (Huang and Moczydlowski, 2001). Because previous studies on the block of Na+ channels by external Cd2+ or Zn2+ tend to ascribe the apparent voltage dependence of block entirely to the direct effect of membrane field on the blocking ion (e.g., Green et al., 1987; Ravindran et al., 1991; Backx et al., 1992; Sheets and Hanck, 1992), possible roles played by the permeating Na+ ions have remained unexplored. We therefore studied the effect of Na+ flow on Cd2+ block of TTX-R channels in dorsal root ganglion neurons in more detail. We found that the binding affinity of Cd2+ is significantly altered by the direction of Na+ ion flow, and at least 2 Na+ ions may coexist with the blocking Cd2+ ion in the presence of 150 mM ambient Na+. Thus, the pore of the TTX-R Na+ channels in dorsal root ganglion neurons is probably similar to the L-type Ca2+ channel pore in multiion nature and in the existence of a set of single-file ion binding sites located at the external pore mouth.
MATERIALS AND METHODS
Cell Preparation
The dorsal root ganglia in the cervical and lumbar parts of the spinal column of 6–10-d-old Wistar rats were removed and put into Ca2+-free Tyrode's solution (150 mM NaCl, 4 mM KCl, 2 mM MgCl2, and 10 mM HEPES, pH, 7.4), where the debris of nerves and connective tissues were removed from the ganglia. The cleaned ganglia were incubated in the dissociation medium (82 mM Na2SO4, 30 mM K2SO4, 3 mM MgCl2, 10 mM HEPES, pH, 7.4) containing 1.25 mg/ml collagenase type I and 1.2 mg/ml protease type XXIII for 30–40 min. The enzyme action was terminated by washes with enzyme-free dissociation medium. The enzyme-treated ganglia were then triturated in dissociation medium with a fire-polished Pasteur pipette to release single neurons. Small neurons (18–30-μm diameter) with intact cell membrane but without attached satellite cells were picked for electrophysiological studies. Usually the isolated cells were used within 8 h of preparation.
Whole-Cell Recording
The dissociated neurons were put in a recording chamber containing Tyrode's solution (Ca2+-free Tyrode's solution with 2 mM CaCl2 added). Whole-cell voltage clamp recordings were obtained using pipettes pulled from borosilicate micropipettes (OD 1.55–1.60 mm; Hilgenberg, Inc.), fire polished, and coated with Sylgard (Dow-Corning). The pipette resistance was 1.5–2 MΩ when filled with one of the following three internal solutions. The “150 mM Cs+” internal solution was composed of 75 mM CsCl, 75 mM CsF, 3 mM MgCl2, 10 mM HEPES, 5 mM EGTA, pH, 7.4. The “150 mM Na+” and “150 mM Na+ + 150 mM Cs+” internal solutions had the same component except that 75 mM CsCl/75 mM CsF was replaced by 75 mM NaCl/75 mM NaF and 150 mM NaCl/150 mM CsF, respectively. After whole-cell configuration was obtained, the neuron was lifted from the bottom of the recording chamber and moved in front of an array of flow pipes emitting “150 mM Na+,” “150 mM Cs+,” or “150 mM Na+ + 150 mM Cs+” external solutions. The “150 mM Cs+” solution contained 150 mM NaCl, 2 mM MgCl2, 2 mM CaCl2, and 10 mM HEPES, pH, 7.4. The “150 mM Na+” and “150 mM Na+ + 150 mM Cs+” solutions had the same components except that 150 mM CsCl was replaced by 150 mM NaCl and 150 mM NaCl + 150 mM CsCl, respectively. In Fig. 5, C and D , when the cell had to be moved between the “150 mM Na+” and the “150 mM Na+ + 150 mM Cs+” solutions, 150 mM sucrose was specially added to the “150 mM Na+” solution to avoid abrupt osmolarity change and subsequent easy loss of the seal. CdCl2 was dissolved in water to make a 500 mM stock solution, and then added to the external solution for a final concentration of 30–3,000 μM. All external solutions also contained 0.3 μM TTX, 1 μM nimodipine, and 0.5 μM ω-conotoxin MVIIC to block TTX-S Na+ and most Ca2+ currents. The residual Ca2+ currents, chiefly including the T-type Ca2+ currents, did not seem to produce significant contamination because the amplitude of transient Ca2+ currents was generally no larger than 0.2–0.3 nA at −20 mV and was even smaller at more positive test potentials (examined in an external solution composed of 150 mM tetraethylammonium chloride and 2 mM CaCl2; unpublished data). It has been shown that the TTX-R channels in dorsal root ganglion neurons require more positive potentials than TTX-S channels to be activated and inactivated (Roy and Narahashi, 1992; Akopian et al., 1996; Rush et al., 1998). Moreover, the activation and inactivation kinetics at the same voltage (e.g., 0 mV) are both ∼3-fold slower in TTX-R channels than in TTX-S channels (Scholz et al., 1998). These parameters are helpful for the identification of the TTX-R currents. For example, the whole-cell TTX-R currents in rat dorsal root ganglion neurons typically show decaying time constants of ∼9, ∼7, and ∼2 ms at –20, 0, and 30 mV, respectively (Rush et al., 1998; Scholz et al., 1998). Thus, only those neurons in which the Na+ current decayed with the foregoing time constants (allowing a ±15% margin) to a sustained level no larger than 10% of the peak current were included for data analysis. Currents were recorded at room temperature (∼25°C) with an Axoclamp 200A amplifier, filtered at 10 kHz with four-pole Bessel filter, digitized at 20-μs intervals, and stored using a Digidata-1200 analogue/digital interface with the pCLAMP software (Axon Instruments, Inc.). All statistics were given as mean ± standard error of mean.
Figure 5.

The effect of external Na+ and Cs+ on Cd2+ block. (A) The relative currents in the presence of 100–3,000 μM Cd2+ at 40 mV (data from part of Figs. 1 B and 4 A) are replotted here for a better comparison. Because in either case the membrane is strongly depolarized and the internal solution contains 150 mM Na+, the Na+ current is always outward no matter the external solution contains 150 mM Cs+ (white bar, n = 4–7) or 150 mM Na+ (black bar, n = 5–7). There is no definite difference in the inhibitory effect of Cd2+ between the two cases. (B) In symmetrical 150 mM Na+ + 150 mM Cs+, the blocking effect of Cd2+ on inward (−20 mV) and outward (20–60 mV) currents is assessed in a way similar to that in Fig. 4 B. The error bars of the mean relative currents are in general <10% of the mean values and are omitted for clarity (n = 2–9). The lines are best fits for each set of data of the form: relative current = 1/{1 + ([Cd2+]/K app,Cs)}, where K app,Cs stands for the apparent dissociation constant of external Cd2+ when both outward and inward Na+ currents are elicited with symmetrical 150 mM Na+ + 150 mM Cs+ on both sides of the membrane. The K app,Cs from the fits are given in the parentheses in the figure. (C) Similar to the I-V plot in Fig. 3 B, in a dorsal root ganglion neuron the peak inward and outward Na+ currents were recorded in 150 mM external Na+ solution and in 150 mM Na+ + 150 mM Cs+ external solution, respectively, and are plotted against the test pulse voltage. Note that the inhibition of inward currents by the addition of 150 mM external Cs+ is evident, whereas the outward currents are essentially unaffected. Also note that the I-V plots are of very similar shape whether Cs+ is present or not. (D) The relative currents at each different test pulse voltages is defined as the ratio between the peak currents in the presence and absence of 150 mM Cs+ in the experiments in C (n = 4). The inhibition produced by Cs+ is similar in all inward currents (−10 to −40 mV), whereas the outward currents are clearly unaffected by Cs+.
RESULTS
Cd2+ Inhibition of Outward TTX-R Na+ Current in 150 mM Internal and 0 mM External Na+
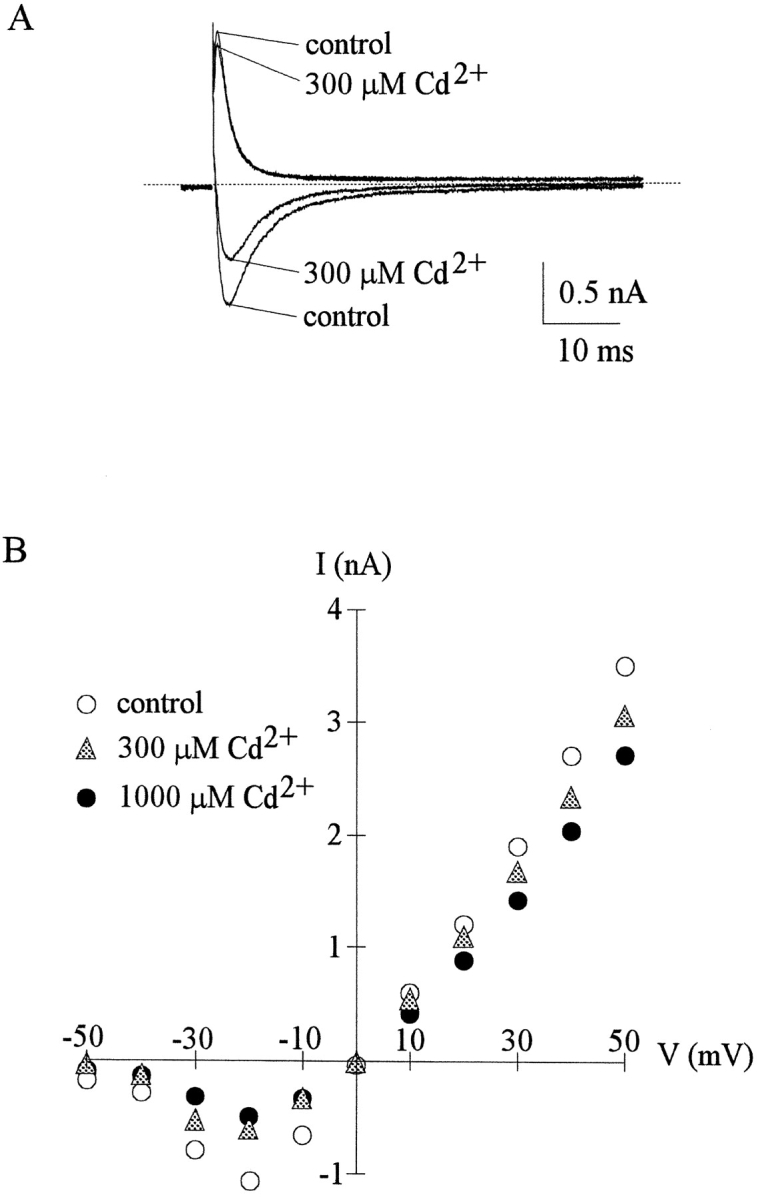
Fig. 1 A shows sample outward TTX-R Na+ currents from a dorsal root ganglion cell. 300 and 1,000 μM external Cd2+ reduces the peak of Na+ currents in a dose-dependent fashion, with no obvious effect on the timing of the peak current or the macroscopic decaying kinetics of the currents. At different membrane potentials from −20 to 40 mV, the relative peak currents in 30–3,000 μM of Cd2+ are plotted in Fig. 1 B. The relative current in a fixed concentration of Cd2+ remains roughly similar between membrane potentials −20 and 40 mV, although there may be a slight tendency for the relative current to become larger at more positive potentials (especially for Cd2+ concentrations 300 μM or higher, where the inhibitory effect is relatively large, so that the forgoing slight tendency is more clear). This finding indicates minimal apparent voltage dependence of Cd2+ block in this experimental configuration. Fig. 1 C plots the relative current against Cd2+ concentration. Each set of data can be reasonably fitted by a one-to-one binding curve. The dissociation constants from the fitting curves are only slightly different between −20 and 40 mV, roughly e-fold increase per ∼230 mV depolarization (Fig. 1 D).
Figure 1.

Outward TTX-R Na+ currents inhibited by external Cd2+. (A) The cell was held at −130 mV and stepped every 4 s to the test pulse (0 mV) for 60 ms. With 150 mM Na+ internal solution and 150 mM Cs+ external solution, outward TTX-R Na+ currents were elicited by depolarization to 0 mV and were inhibited by 300 and 1,000 μM Cd2+. The two control sweeps were obtained before and after Cd2+ inhibition, demonstrating rapid reversibility of the inhibition. The dotted line indicates the zero current level. (B) Inhibition of outward TTX-R Na+ currents by different concentrations (30–3,000 μM, as indicated beside each series of symbols) of Cd2+ at different test pulse voltages. The experimental conditions and pulse protocols were generally similar to that described in A, except that the test pulse was varied from −20 to 40 mV in 20-mV steps (the horizontal axis). The relative current (the vertical axis) at each test pulse potential is defined by normalization of the peak currents in the presence of Cd2+ to the peak current in the control (Cd2+-free) solution (n = 3–9). The inhibition is clearly Cd2+ concentration dependent, yet shows only minimal voltage dependence. (C) The mean relative current in B is plotted against [Cd2+] (the concentration of Cd2+) in semilogarithmic scale. The lines are best fits for each set of data points of the form: relative current = 1/{1 + ([Cd2+]/K app,o)}, where K app,o stands for the apparent dissociation constant of Cd2+ in such an experimental configuration (150 mM Cs+ outside and outward Na+ current). The K app,o from the fits are given in the parentheses in the figure. (D) The K app,o obtained in C are plotted against test pulse voltage in semilogarithmic scale. The line is the best fit to the data points of the form: K app,o = 1480 μM * exp(V/230), where V stands for the test pulse voltage in mV.
Cd2+ Inhibition of Inward TTX-R Na+ Current in 0 mM Internal and 150 mM External Na+
Fig. 2 A shows sample inward TTX-R Na+ currents in the control solution and in the presence of 300–1,000 μM external Cd2+. The blocking effect of Cd2+ on the inward currents is much stronger than that on the outward currents in Fig. 1. At different membrane potentials from −20 to 40 mV, the relative peak currents in 30–3,000 μM of Cd2+ are plotted in Fig. 2 B. Again, the inhibition is clearly Cd2+ concentration dependent, yet not very sensitive to changes of the membrane potential. Most interestingly, one may readily note that over the same voltage range (−20 to 40 mV), 30–3,000 μM Cd2+ produces a much larger inhibitory effect on inward (Fig. 2 B) than on outward (Fig. 1 B) Na+ currents. Fig. 2 C plots the relative current against Cd2+ concentration. Each set of data is again reasonably fitted by a one-to-one binding curve. However, the absolute values of the apparent dissociation constants here are nearly one order of magnitude smaller than those obtained with outward current in the same voltage range (Fig. 1 C). Fig. 2 D further shows that the dissociation constants are only mildly voltage-dependent between −20 and 40 mV in this experimental configuration, with e-fold increase per ∼140 mV of depolarization.
Figure 2.

Inward TTX-R Na+ currents inhibited by external Cd2+. (A) The pulse protocol was essentially the same as that described in the legend to Fig. 1 A. With 150 mM Cs+ internal solution and 150 mM Na+ external solution, inward TTX-R Na+ currents were elicited by depolarization to 0 mV and were inhibited by 300 and 1,000 μM Cd2+. Once more, the two control sweeps were obtained before and after Cd2+ inhibition, demonstrating rapid reversibility of the inhibition. The dotted line indicates the zero current level. (B) Inhibition of inward TTX-R Na+ currents by different concentrations (30–3,000 μM, as indicated beside each series of symbols) of Cd2+ at different test potentials. The pulse protocols and the definition of relative current were the same as those in Fig. 1 B (n = 4–12). Again, the inhibition is dependent on Cd2+ concentration yet shows only very small voltage dependence. (C) The mean relative current in B is plotted against [Cd2+] (the concentration of Cd2+) in semilogarithmic scale. The lines are best fits for each set of data points of the form: relative current = 1/{1 + ([Cd2+]/K app,i)}, where K app,i stands for the apparent dissociation constant of Cd2+ in such an experimental condition (150 mM Cs+ inside and inward Na+ current). The K app,i from the fits are given in the parentheses in the figure. (D) The K app,i obtained in C are plotted against test pulse voltage in semilogarithmic scale. The line is the best fit to the data points of the form: K app,i = 260 μM * exp(V/140), where V stands for the test pulse voltage in mV.
Cd2+ Inhibition of Outward and Inward TTX-R Na+ Currents in 150 mM Internal and External Na+
In the foregoing experiments we have used very different internal and external Na+ concentrations to obtain preponderant outward (150 mM internal Na+ and 0 mM external Na+, Fig. 1) or inward (150 mM external Na+ and 0 mM internal Na+, Fig. 2) Na+ current through TTX-R channels. The very different inhibitory effects of Cd2+ at the same range of test potentials suggest that Cd2+ inhibition of Na+ current is chiefly dependent on the direction of ionic flow rather than on membrane voltage. To confirm that the observed inhibitory effect is indeed ascribable to the direction of Na+ flow but not to the different external and internal solutions used in different experiments, we studied the inhibitory effects of Cd2+ in an experimental condition with equimolar (150 mM) internal and external Na+. Now the effects of external Cd2+ on both inward and outward TTX-R currents could be documented in the same neuron with different test pulse potentials. Fig. 3 A shows sample sweeps at test potentials of −20 and 20 mV, respectively. Fig. 3 B shows representative peak I-V plots in control and in the presence of 300–1,000 μM external Cd2+. The I-V curves are of very similar shape and it is evident that the inhibitory effect on the inward current is significantly larger than that on the outward current.
Figure 3.
Outward and inward TTX-R currents inhibited by external Cd2+. (A) The cell was held at −130 mV and stepped every 4 s to the test pulse at −20 or 20 mV for 60 ms. With equimolar Na+ on both sides of the membrane (150 mM Na+ internal solution and 150 mM Na+ external solution), outward TTX-R Na+ currents were elicited by depolarization to 20 mV and inward TTX-R Na+ currents were elicited by depolarization to −20 mV. The inhibitory effect of 300 μM external Cd2+ is obviously stronger on the inward current than on the outward current. The dotted line indicates the zero current level. (B) In the same cell as that in A, the peak inward and outward Na+ currents were recorded in the control solution and in the presence of 300–1,000 μM Cd2+, and are plotted against the test pulse voltage. For all inward and outward Na+ currents elicited by test pulse of different voltages, the inhibition produced by Cd2+ remains similar for the same direction of current flow, but inhibition of inward currents is always much more manifest than inhibition of outward currents. Note that the current-voltage plots are of very similar shape whether Cd2+ is present or not (e.g., the currents all start to be discernible at the currents at −50 mV, the peak inward currents all appear at −20 mV, and the currents all reverse at ∼0 mV). The similar I-V relationship strongly argues against significant effect of 300–1,000 μM Cd2+ on the surface potential related to channel gating. Also, the almost linear I-V relationship beyond −20 mV further discloses that channel activation is nearly complete at membrane potentials more positive than −20 mV.
Stronger Apparent Voltage Dependence of Cd2+ Inhibition of Inward Na+ Current in 150 mM Internal Na+ than in 150 mM Internal Cs+
Fig. 4 A summarizes the inhibitory effect of external Cd2+ at various potentials with equimolar (150 mM) Na+ on both sides of the membrane. Similar to the findings in Fig. 1 B, the inhibitory effect of external Cd2+ on outward Na+ currents shows at most a very slight voltage dependence and only equivocally becomes weaker with more positive potentials between 10 and 50 mV. In contrast, the inhibitory effect of Cd2+ on the inward currents is obviously weaker with more depolarization between −30 and −10 mV, showing much stronger voltage dependence than that in Fig. 2 B. Fig. 4, B and C, shows the dissociation constants of Cd2+ block in each voltage. In outward Na+ current the voltage dependence here is roughly similar to that observed in Fig. 1 D, whereas in inward Na+ currents the apparent voltage dependence here is much stronger than that in Fig. 2 D. The simplistic fittings for the apparent voltage dependence of the data points in outward currents and those in inward currents in Fig. 4 C are obviously two discontinuous functions and, thus, may not be a rational analysis of the data. We have already seen that the absolute magnitude of the affinity (dissociation constants) of the blocking Cd2+ ion is very much different in different directions of net ionic flow (Figs. 1 and 2). In Fig. 4 C, and in comparison with Fig. 2 D, we further see that even the apparent voltage dependence of Cd2+ block is dependent on not only the direction of net ionic flux, but also the ion species in ambient solutions (and thus the permeating ions in the pore). These findings strongly indicate that Cd2+ block is profoundly influenced by the movement of other permeating ions, rather than by just a simple effect of the transmembrane field. This flux-coupling phenomenon implies that Cd2+ binds to a set of single-file ionic sites in the TTX-R Na+ channel pore where the other permeating ions also bind to. Based on the flux-coupling equation (Hodgkin and Keynes, 1955), a better quantitative treatment of the data in Fig. 4 C could be done with all the data points well described by one continuous function (see discussion).
Figure 4.
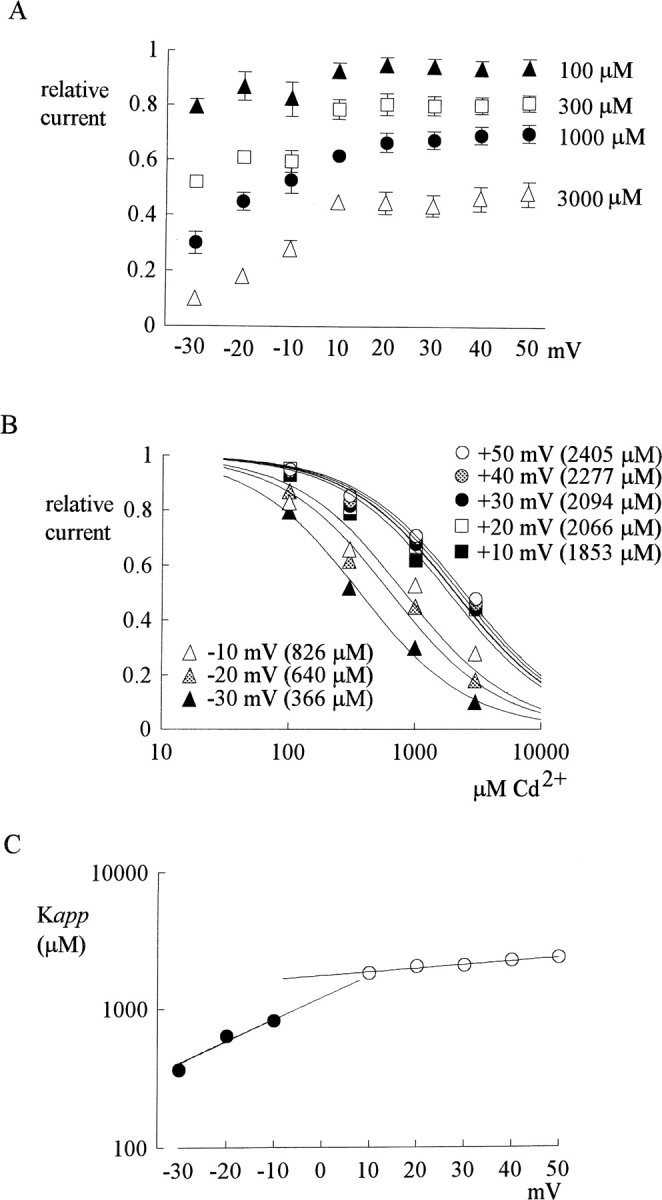
Inhibition of outward and inward TTX-R Na+ currents by different concentrations (100–3,000 μM) of Cd2+ at different test potentials with equimolar (150 mM) Na+ on both sides of the membrane (the same internal and external solutions as those in Fig. 3). (A) The pulse protocols were generally similar to that described in Fig. 1A, except that the test pulse was varied from −30 to 50 mV in 10-mV steps (the horizontal axis). The definition of relative current (the vertical axis) is also the same as that in Fig. 1 A (n = 3–7). The inhibitory effect is Cd2+ concentration dependent, and is more manifest on the inward currents than on the outward currents for every Cd2+ concentration tested. Also, the inhibition shows little voltage dependence when there is outward current, yet shows stronger apparent voltage dependence when there is inward current. (B) Dissociation constants of Cd2+ to the TTX-R channels in the presence of outward or inward Na+ current in symmetrical (150 mM) Na+. The mean relative current in A is plotted against [Cd2+] (the concentration of Cd2+) in semilogarithmic scale. The lines are best fits for each set of data of the form: relative current = 1/{1 + ([Cd2+]/K app)}, where K app stands for the apparent dissociation constant of external Cd2+ when either outward or inward Na+ currents are elicited with symmetrical 150 mM Na+ on both sides of the membrane. The K app from the fits are given in the parentheses in the figure. We did not measure the K app below −30 mV where TTX-R channels are probably far from fully activated (judged from, for example, the I-V plot in Fig. 3 B). Thus, a slight change in surface potential might have a significant effect on channel activation and consequently the amplitude of the current in these negative potentials. (C) The K app obtained in B are plotted against test pulse voltage in semilogarithmic scale. The top line is the best fit to the data points in inward Na+ currents (at test pulses −30 to −10 mV) and is of the form: K app = 1220 μM * exp(V/27), where V stands for the test pulse voltage in mV. The bottom line is the best fit to the data points in outward currents (at test pulses 10–50 mV) and is of the form: K app = 1770 μM * exp(V/165), where V stands for the test pulse voltage in mV. The two fitting lines, however, are obviously discontinuous functions.
Weak Competition between External Na+ and Cd2+ for the Cd2+ Blocking Site
There is very shallow voltage dependence of external Cd2+ block in Figs. 1 and 2, where there is preponderant Na+ efflux and influx, respectively. This would imply a Cd2+ blocking site located very shallowly in the external part of the conduction pathway. If there is indeed a set of ion binding sites at the external pore mouth of the TTX-R channels underlying the flux-coupling phenomenon, it would be desirable to see whether physiological concentrations (∼150 mM) of Na+ could so significantly occupy all of these sites as to affect the binding of Cd2+ from the external solution to the blocking sites. In the presence of 150 mM internal Na+, the dissociation constants in the presence of net outward currents is only slightly smaller in 150 mM external Cs+ (Fig. 1) than in 150 mM external Na+ (Fig. 4). This point is reexamined in Fig. 5 A, which plots the blocking effect of Cd2+ at 40 mV (data from Figs. 1 and 4), where there should be preponderant Na+ efflux and thus roughly the same unbinding rate of the blocking Cd2+ ion in both cases. The blocking effect at 40 mV is roughly similar, or at most only equivocally different, implying either of the two following possibilities. Probably neither 150 mM external Na+ nor 150 mM external Cs+ so significantly occupies all of these externally located ionic sites as to affect the binding rate of Cd2+. Alternatively, 150 mM external Na+ and 150 mM external Cs+ both may significantly occupy all of the ionic sites in this pore region and thus affect the Cd2+ binding rate, but roughly to the same extent. To differentiate between these two possibilities, we repeated the experiments in symmetrical 150 mM Na+ plus 150 mM Cs+ (Fig. 5 B), where the apparent dissociation constant of external Cd2+ is generally similar to those in Fig. 4 B and remains very much flow-dependent. This finding strongly argues against the second possibility given above. We therefore conclude that 150 mM external Na+ (or 150 mM external Cs+) cannot so significantly occupy all sites in this multiion single-file pore region as to remarkably decrease the binding rate of Cd2+. When studying the effect of the additional 150 mM external Cs+, we also noted that external 150 mM Cs+ seems to inhibit the inward but not the outward Na+ current (Fig. 5, C and D). This inhibitory effect probably is not related to changes in surface potential or channel gating, because the I-V plots remain very much the same in shape (see the legend of Fig. 3 B). The similar ∼25% inhibition at −40 to −10 mV, where there are inward currents, and the lack of discernible blocking effect at positive potentials, where there are outward currents, further support that the inhibition is also a flow-dependent block produced by 150 mM Cs+, rather than an effect related to surface potential or gating change. Although 150 mM external Cs+ does not significantly occupy all of these ion binding sites, the flow-dependent blocking effect of 150 mM external Cs+ does suggest interactions between Cs+ and the single-file multiion region at the external pore mouth.
Insignificant Surface Potential Changes and Effect of Millimolar External Ca2+
In Fig. 3 B, we have argued the insignificant effect of 300–1,000 μM Cd2+ on the surface potential related to channel gating. To have a more quantitative measurement of the effect of Cd2+ on surface potential or on the gating machinery of TTX-R Na+ channels, the inactivation curve of the channel is documented in 100–3,000 μM Cd2+. Fig. 6, A and B , show that 100–300 μM Cd2+ does not definitely shift or change the curve. 1,000 μM Cd2+ causes a shift of ∼1.5 mV, and 3,000 μM Cd2+ causes a shift of ∼4 mV. These changes in the inactivation curve, whether they are related to changes in the surface potential or to a direct effect of Cd2+ on the gating machinery of the channel, are so small that correction for such changes seems unnecessary. In all experiments so far we have deliberately included 2 mM Ca2+ and 2 mM Mg2+ in the external solution to minimize possible surface potential changes in the presence of high concentrations of Cd2+. To check for any major effect of the added Ca2+, we repeated some experiments in 5 mM external Ca2+, which probably induces changes in surface potential for a few mV and shift the I-V relationship (e.g., the voltage where the current start to be discernible) to the right in the voltage axis accordingly (unpublished data). Thus, the TTX-R currents are probably far from fully activated at potentials more negative than −20 mV. Similar to the rationales given in the legend of Fig. 4, we therefore did not quantify the inhibitory effect of Cd2+ in 5 mM external Ca2+ at potentials more negative than −20 mV (Fig. 7) . For characterization of Cd2+ block in high external Ca2+ over a wider voltage range, we not only studied the block in symmetrical 150 mM Na+ (Fig. 7 A), but also in 150 mM external Na+ and 150 mM internal Cs+ (Fig. 7 B). The apparent dissociation constants of Cd2+ in both inward and outward currents are very similar to those obtained in 2 mM external Ca2+, and the strong flow dependence is clearly preserved. These findings are consistent with the very high (∼50 mM) previously reported IC50 of Ca2+ or Mg2+ on Na+ currents (Ravindran et al., 1991). The presence of 2 mM external Ca2+ or Mg2+ (which usually has a less remarkable effect on surface potential than Ca2+) is thus unlikely to distort the major findings of this study.
Figure 6.

Insignificant surface potential changes produced by Cd2+. (A) The surface potential changes caused by Cd2+ is examined by shift of the inactivation curve of TTX-R channels. The cell was held at −120 mV and stepped every 2 s to the inactivating pulse (−120 to 10 mV) for 100 ms. The channels which remain available after each inactivating pulse were assessed by the peak currents during the following short test pulse at 40 mV for 20 ms. The fraction available is defined as the normalized peak current (relative to the current evoked with an inactivating pulse at −120 mV) and is plotted against the voltage of the inactivating pulse. Three sets of control data were obtained before, between, and after the two sets of data in 300 and 1,000 μM Cd2+. The lines are fits with a Boltzmann function 1/{1 + exp[(V − Vh)/6.5]}, with Vh values (in mV) of −33.7, −34.1, −36.9, −37.4, and −39.8 for control (1, before Cd2+), 300 μM Cd2+, control (2, between 300 and 1000 μM Cd2+), 1,000 μM Cd2+, and control (3, after 1,000 μM Cd2+), respectively. (B) The shift of inactivation curves assessed by the difference of Vh values in control and in 100–3,000 μM Cd2+. The shift is insignificant with lower concentrations of Cd2+ and is ∼1.5 and ∼4 mV for 1,000 and 3,000 μM Cd2+ (n = 3–4), respectively.
Figure 7.

The effect of high (5 mM) external Ca2+ on Cd2+ block. (A) In symmetrical 150 mM Na+ with 5 mM Ca2+ present in the external solution, the blocking effect of Cd2+ on TTX-R currents is assessed in a way similar to that in Fig. 4 B (n = 2–9). The error bars of the mean relative currents are in general <10% of the mean values and are omitted for clarity. The lines are best fits for each set of data of the form: relative current = 1/{1 + ([Cd2+]/K app,Ca)}, where K app,Ca stands for the apparent dissociation constant of external Cd2+ when both outward and inward Na+ currents are elicited with symmetrical 150 mM Na+ and 5 mM external Ca2+. The K app,Ca from the fits are given in the parentheses in the figure. (B) With 150 mM Na+ and 5 mM Ca2+ present in the external solution and 150 mM Cs+ in the internal solution, the blocking effect of Cd2+ on TTX-R currents is assessed in a way similar to that in Fig. 2 C (n = 3–8). The error bars of the mean relative currents are in general smaller than 10% of the mean values and are omitted for clarity. The lines are best fits for each set of data of the form: relative current = 1/{1 + ([Cd2+]/K app,Cai)}, where K app,Cai stands for the apparent dissociation constant of external Cd2+ when inward Na+ currents are elicited with 150 mM Na+ and 5 mM Ca2+ in the external solution and 150 mM Cs+ in the internal solution. The K app,Cai from the fits are given in the parentheses in the figure.
DISCUSSION
Cd2+ Block of TTX-R Na+ Channel Pore by Binding to a Single-file Multiion Region
We have characterized the inhibitory effect of external Cd2+ on the TTX-R Na+ currents in rat dorsal root ganglion cells. When there is Na+ on one side of the membrane and Cs+ on the other side, the ionic flow through the channel is either preponderantly outward (Fig. 1) or inward (Fig. 2), and in both cases there is little voltage dependence on Cd2+ inhibition. The very shallow voltage dependence is roughly similar to what was observed in Cd2+ block of cardiac Na+ channels (Sheets and Hanck, 1992), and suggests little intrinsic voltage dependence of Cd2+ block. On the other hand, the inhibitory effect of Cd2+ is closely correlated with the direction of Na+ current flow. At −20 to 40 mV, the dissociation constant of Cd2+ is 200–300 μM in the presence of preponderant Na+ influx (Fig. 2 D), consistent with what was reported before with similar experimental configurations (Visentin et al., 1990; Ravindran et al., 1991; Sheets and Hanck, 1992). In contrast, the dissociation constant of Cd2+ is nearly one order of magnitude larger in the presence of preponderant Na+ efflux at exactly the same voltage range (Fig. 1 D). The different apparent voltage dependence of Cd2+ block in inward currents in Figs. 2 and 4, as we have pointed out in the results section, also substantiates the flux-coupling phenomenon and thus significant interactions between movements of the blocking Cd2+ ion and the coexisting Na+ ions. Thus, Cd2+ probably binds to a set of single-file ion binding sites at or near the external mouth of the pore, where Na+ and even Cs+ ions also bind to. The affinity between Na+ and the sites in this pore region, however, is not high (150 mM external Na+ does not seem to saturate or significantly occupy all sites in this region; Fig. 5, A and B). The low affinity of Na+ to this pore region may partly explain why some previous studies (e.g., Green et al., 1987; Sheets and Hanck, 1992) fail to observe significant flow dependence of Cd2+ or Zn2+ block of Na+ channels. The symmetrical 20–30 mM Na+ used in those studies could be too low to have enough occupancy of this pore region to produce vivid flux-coupling effect. Also, batrachotoxin (BTX) was used to prolong single channel openings in some studies (Green et al., 1987; Ravindran et al., 1991). Because BTX might alter the cation binding sites in the Na+ channel pore (Khodorov, 1985; Green et al., 1987), features of single-file multiion permeation may be altered in the presence of BTX.
Cd2+ as a Permeant Blocker with its Direction of Exit Determined by Na+ Flow
If external Cd2+ binds to the TTX-R channel pore, it would be interesting to consider whether the blocking Cd2+ can only exit back to the external side, or it could also exit to the internal side, in which case Cd2+ becomes a “permeant blocker” of the channel. Because the binding rate of Cd2+ is not much different in different experimental conditions (Fig. 5, A and B), the different apparent dissociation constants in different conditions is most likely ascribable to the different unbinding rate (off rate) of the blocking Cd2+ ion. Thus, the small voltage dependence of the dissociation constants in preponderant outward and inward Na+ flow (Figs. 1 D and 2 D) suggests little intrinsic voltage dependence of the exit of the blocking Cd2+ ion. We have been describing the flow as “preponderantly” rather than “exclusively” inward or outward because the permeability ratio between Cs+ and Na+ is small but not exactly negligible (0.016, Chandler and Meves, 1965; <0.013, Hille, 1972). Also, Cs+ currents through Na+ channels (against Na+ ions on the other side of the membrane) can be observed if appropriate electrochemical gradient is applied (unpublished data), and Cs+ may also interact with the set of ion binding sites at the external pore mouth (Fig. 5, C and D). Thus, the ionic flux through the pore should be only mostly but not strictly outward or inward in Figs. 1 and 2. If the movement of the blocking Cd2+ in the single-file region is coupled to (”controlled” by) the movement of Na+ ion, then the overall exit rate of the blocking Cd2+ ion from the region should be a weighted average (weighted according to the relative chances of moving in each direction) of its “absolute” inward and outward exit rates (“absolute” means the exit rate if Cd2+ is absolutely moving in that particular direction). If there were a huge energy barrier for Cd2+ internal to this single-file region and Cd2+ essentially could only exit back to the external side, then the overall unbinding rate of Cd2+ would be the product of the absolute outward exit rate of Cd2+ and the relative tendency of moving outward of the ions in this single-file region. Because the tendency of moving outward versus moving inward of the blocking Cd2+ ion (and the other permeating ions in this single-file region) must be very small, but would increase exponentially as the membrane potential goes more positive in the presence of preponderant inward current (see Eq. 1 below), the overall unbinding rate, and therefore the apparent dissociation constant of Cd2+ with preponderant inward Na+ current in Fig. 2, would have been extremely small yet strongly voltage dependent. This is inconsistent with the findings that the dissociation constants in Fig. 2 lack significant voltage dependence and are ∼9-fold smaller than those in Fig. 1. Thus, the exit of Cd2+ could not be strictly outward. Instead, Cd2+ seems to exit the single-file region either inwardly or outwardly, with the chances of moving in either direction determined by Na+ flow.
Ninefold Slower Inward than Outward Exit of the Blocking Cd2+ Ion
We have argued that differences in the apparent dissociation constants of Cd2+ could signal differences in the unbinding rates of the blocking Cd2+ ion. The dissociation constant of Cd2+ with most preponderant Na+ influx (213 μM at −20 mV, Fig. 2 C) and that with most preponderant Na+ efflux (1,839 μM at 40 mV, Fig. 1 C) together indicate an ∼9-fold difference between the absolute inward and outward exit rates of the blocking Cd2+ ion (assuming complete Na+ flux coupling of Cd2+ movement). This difference would suggest that the internal energy barrier (the barrier internal to the single-file pore region containing the set of ion binding sites) for the “permeating” Cd2+ ion is ∼2.2 RT higher than the external energy barrier based on the reaction rate theory (Zowlinski et al., 1949). The asymmetrical and much slower inward exit rate of the blocking Cd2+ also explains the seemingly different voltage dependence of Cd2+ block on the inward and outward currents in symmetrical 150 mM Na+ (Fig. 4 C), which is otherwise very difficult to envision with a direct effect of transmembrane field on the blocking Cd2+ ion. Because Na+ flux would not be so preponderant in one direction in the vicinity of the reversal potential (0 mV in Fig. 4), the relatively small but not negligible Na+ efflux in net inward current at −10 or −20 mV, along with the ninefold faster absolute outward exit rate of Cd2+, could make the overall Cd2+ unbinding rate much faster than one would have imagined considering only inward exit of the blocking Cd2+ ion. In contrast, the equal amount of “contaminating” Na+ influx in net outward current at 10 or 20 mV will have only slight or even negligible effect because of the much slower absolute inward exit rate of Cd2+ (see below for a more detailed quantitative treatment of this issue). The higher internal barrier for Cd2+ and the flux coupling of Cd2+ movement in this single-file region may also explain why previous studies (e.g., Yamagishi et al., 1997) fail to show block of the pore by 100 μM internal Cd2+, although we have argued that Cd2+ is a permeant blocker. If there are no additional low-affinity (nonblocking) ionic sites located between the internal solution and the externally located single-file Cd2+ blocking sites, the on rate (binding rate) of internal Cd2+ would be ninefold slower than that of equimolar external Cd2+ (at 0 mV). Given the same Cd2+ off rate (unbinding rate) controlled by ionic flux (the bound Cd2+ ion should not know where it comes from), the apparent dissociation constant (which should be the ratio between the off rate and the on rate) of internal Cd2+ in blocking the TTX-R channel would be at least ∼9-fold larger than those of external Cd2+, and thus would be ∼2 mM in inward current and ∼20 mM in outward current. If there are additional internal low-affinity ionic sites also bearing flux coupling or other intense ion–ion interactions, the apparent dissociation constant for the internal Cd2+ will be even larger, especially in inward currents (see the examples in L-type Ca2+ channels; Kuo and Hess, 1993a). Thus, 100 μM internal Cd2+ might be too low a concentration to have a discernible blocking effect on either inward or outward Na+ currents.
At Least Two Na+ Ions in the Single-file Region at the External Pore Mouth
Fig. 4 C shows that a simplistic analysis considering only the direct effect of membrane electrical field on Cd2+ is incapable of describing all of the data points with one function. If Cd2+ affinity is actually directly and closely related to Na+ flux, a quantitative analysis based on flux-coupling considerations may be more appropriate. The original flux-coupling equation (Hodgkin and Keynes, 1955; Hille, 1992) is:
 |
(1) |
where [S,internal] and [S,external] denote concentrations of the internal and external permeant (Na+) ions, respectively. Z and Vrev denote the charge and reversal potential of the permeant ions, respectively. n denotes the number of permeating (Na+) ions in this single-file region. V denotes the membrane potential in mV and F, R, T have their usual meanings (RT/F = 25 mV if T = 25°C. Here we have assumed the single-file nature to be complete to facilitate further analysis and calculation. If the single-file ionic movement is not absolute, the deduced number of ions in this region may be different, but the essence of flux-coupling remains the same). In symmetrical (150 mM, Figs. 3 and 4) Na+ on both sides of the membrane, Eq. 1 is simplified to:
 |
(2) |
We have argued that the direction of Cd2+ exit from this single-file region is “controlled” by the direction of Na+ current flow, and thus the overall exit rate (J) of Cd2+ would be a weighted average of the absolute inward exit rate (Ji) and the absolute outward exit rate (Jo):
 |
(3) |
Because fraction of outward flux = (outward flux)/(outward flux + inward flux), and fraction of inward flux = (inward flux)/(outward flux + inward flux), Eqs. 2 and 3 can be combined and we have:
 |
(4) |
Because of the insignificant effect of 150 mM ambient Na+ on the binding rate of Cd2+ (Fig. 5 A), the dissociation constants at different membrane potentials should be roughly linearly correlated with the exit rates, and Eq. 4 could be rewritten as:
 |
(5) |
where D is the observed dissociation constant, and Do and Di are the apparent dissociation constants when Cd2+ exclusively exits outwardly and inwardly, respectively. Fig. 8 A shows a best fitting curve, using Eq. 5, to the data points from Fig. 4 C, giving Do = 2,400 μM, Di = 260 μM, and n = 2.2. Curves with the same Do and Di yet different n values (n = 1, 2, or 3) are also drawn to demonstrate the different slope with different n values. It is evident that the curves with n = 2 or 3 stay reasonably close to the data points, whereas the curve with n = 1 describe the data poorly. Fig. 8 B shows that Eq. 5 with similar parameters may also describe the data in either preponderant outward or inward Na+ currents in Figs. 1 D and 2 D, where the apparent voltage dependence of the dissociation constants should approximate that at the two boundary conditions (very positive and very negative potential ranges) in Fig. 8 A, and is indeed shallow in both cases. The e-fold increase of K app,o per ∼230 mV of depolarization in Fig. 1 might be close to the “true” voltage dependence of Cd2+ binding affinity, because the blocking Cd2+ coming from outside now exits mostly back to the outside. The Cd2+ binding site thus could be located in the pore at electrical distance ∼0.05 from the outside (Woodhull, 1973). This very superficial location is consistent with the findings that the key amino acid residue responsible for external Cd2+ binding is also a critical residue responsible for the binding of TTX, a much bulkier external pore blocker presumably incapable of going deep into the pore (Backx et al., 1992; Satin et al., 1992; Terlau et al., 1991). We conclude that the blocking Cd2+ probably binds to a single-file multiion region at the external pore mouth. This region may accommodate at least two coexisting Na+ ions (in 150 mM ambient Na+, Fig. 9) and is connected to the bulk solution by a wide vestibule.
Figure 8.

Analysis of the experimental data with flux-coupling equations. (A) The data in Fig. 4 C are analyzed with Eq. 5 (see text). The thick dotted line is the best fit to the data of the form: K app = 2,400 μM * {exp(2.2V/25)/[1+exp(2.2V/25)]} + 260 μM * [1/exp(2.2V/25)], where V stands for the test pulse voltage in mV. The thin solid, thick solid, and thin dashed lines are curves with n values equal to 1, 2, and 3, respectively. It is evident that n = 1 describes the data much more poorly than n = 2 or 3. Because of limitation of the data range (the values below −30 mV cannot be reliably measured; Fig. 4B) and the simplifications made in the derivation of Eq. 5 (e.g., neglect of the small intrinsic voltage dependence of Cd2+ block), we do not mean to have an exact n, Do, and Di values from the fit. Instead, the major purpose is to show that the data described previously by two discontinuous functions considering only direct effect of the membrane electrical field on the blocking Cd2+ ion can actually be well described by one single equation based on the flux-coupling concepts. Also, it seems safe to say that more than 1, or at least 2, Na+ ions coexist with the blocking Cd2+ ion in this single-file region of the pore. (B) The same data points in Figs. 1 D (K app,o) and 2 D (K app,i) are put in the same plot and are described by an equation modified from Eqs. 1 and 5: D (K app,o or K app,i) = {R*exp(2V/25)/[1+R*exp(2V/25)]}*Do + {1/[1+R*exp(2V/25)]}*Di, where R equals to the square of the permeability ratio between Na+ and Cs+ (or between Cs+ and Na+, determined by the experimental configuration). For external Cs+ and internal Na+ (black symbols, the K app,o in Fig. 1 D), the R values are either 2,000 (solid line) or 200 (dashed line), and the Do and Di values are 1,800 and 200 μM, respectively. For internal Cs+ and external Na+ (white symbols, the K app,i in Fig. 2 D), as a first approximation R becomes inverses of the previous values and are either 0.0005 (solid line) or 0.005 (dashed line), whereas the Do and Di values are 2,100 and 230 μM, respectively. These Do and Di values are arbitrarily assigned to fit the data, because the apparent voltage dependence of the data points is simply too shallow to allow any purposeful fits. The slightly smaller Do and Di values than those in A probably partly reflecting the slightly enhanced Cd2+ binding rate because of the even weaker competition for the binding site by Cs+ than by Na+. The ∼9-fold difference between Do and Di, however, is deliberately kept unchanged. It is evident from the plot that the most important results from A (an ∼9-fold larger Do than Di, and an n value of ∼2–3) could also successfully describe the data in Figs. 1 and 2 over a wide range of permeability ratio between Na+ and Cs+.
Figure 9.

A schematic diagram illustrating the major findings of this study. The cysteine or serine residue (a circle containing the letters C/S in the diagram) in the pore loop of domain I is the major ligand responsible for the poor binding affinity of TTX (mismatch of the shape of the binding counterparts). On the other hand, this residue, probably along with residues of the DEKA ring (equivalent to the EEEE ring in Ca2+ channels) and other unidentified residues, makes up a set of ion binding sites at the external pore mouth (electrical distance ∼0.05 from outside). It is a “set” of ion binding sites because the free energy of an ion (e.g., Na+) is roughly equal at any of these sites (although the absolute level of free energy may differ with different number or species of ions in the set), and these sites are not separated by any significant energy barriers for that particular ion. The ions therefore could move “freely” among these sites (if they are vacant), constituting the biophysical basis of flux-coupling effect. When one site is already occupied by an ion, presumably no other ion can pass the bound ion (single-file ionic flow), constituting the anatomical basis of flux-coupling effect. In the presence of 150 mM symmetrical Na+, there are probably at least two Na+ ions coexisting with the blocking Cd2+ ion in this multi-ion region. The TTX-R Na+ channel therefore should be able to accommodate at least three ions simultaneously. When there is essentially “strictly” outward Na+ current (Fig. 1 C or the right-end condition of the fitting curve in Fig. 8 A), unbinding of the blocking Cd2+ is almost always back to the external solution and as a first approximation the apparent dissociation constant of ∼1,839–2,400 μM in these situations may represent a “true” equilibrium constant. If the electrochemical zero free energy is set at 1 M ionic concentration, the ∼1,839–2,400 μM dissociation constant would be translated into a binding site with an energy well of ∼6 RT for Cd2+. On the other hand, the apparent dissociation constant of Cd2+ in “strictly” inward Na+ current is ∼9-fold smaller, or ∼213–260 μM (Fig. 2 C or the left-end condition of the fitting curve in Fig. 8 A). This is not a true equilibrium constant because Cd2+ comes from the outside yet exits to the inside. The energy barrier internal to the set of ionic sites thus must be ∼2.2 RT higher than the external energy barrier, making an ∼9-fold slower intrinsic inward exit rate and consequently an ∼9-fold smaller apparent dissociation constant. The peak of this internal energy barrier is separate from the Cd2+ binding by very small electrical dependence, because the dissociation constants in preponderant inward current show only minimal voltage dependence (Fig. 2 D). The free energy level of Na+ in the set is less clear, and is thus drawn with dotted lines. A rough estimate shows that these energy wells for Na+ should be much shallower than those for Cd2+, probably not deeper than ∼2 RT. This is because 150 mM external Na+ does not so significantly occupy all the sites as to prevent the entry of external Cd2+ to this pore region. It should be noted that the estimate of −2 RT applies to the situation that two Na+ ions already exist in this region. The first Na+ ion in this set of binding sites may enjoy an energy well deeper than −2 RT, and loading of subsequent Na+ ions is more and more difficult because of ion–ion repulsion. In other words, although we have focused on the flux-coupling effect, which explains the data reasonably well and may indeed be the major consequence of ion–ion interaction happening in this set of ionic sites, other subtle interactions such as ion–ion repulsion due to electrostatic repelling force or ligand competition could still exist in this multi-ion region and worth further exploration.
Comparison with the Ca2+ and K+ Channels
In L-type Ca2+ channels the carboxylate groups (e.g., glutamate residues, Kuo and Hess, 1993a,b; Yang et al., 1993; Ellinor et al., 1995) are responsible for the binding of Cd2+ with very high affinity (micromolar dissociation constants), whereas in TTX-R channels sulfhydryl or hydroxyl groups (e.g., cysteine or serine residues, Backx et al., 1992; Heinemann et al., 1992a, Akopian et al., 1996) are probably involved in the binding of Cd2+ with lower affinity (submillimolar to millimolar dissociation constants). Despite these differences, there are striking similarities in the pore structure around the Cd2+ binding site between Ca2+ and TTX-R Na+ channels. In both channels, Cd2+ binds to a single-file region at the external pore mouth, which contains a set of ionic sites capable of accommodating at least two permeating ions simultaneously, and more or less involving the “selectivity filter” of the channel (the EEEE and the DEKA rings for Ca2+ and Na+ channels, respectively). This is consistent with the finding that mutation of many amino acid residues in the vicinity of each of the DEKA residues into cysteine would enhance the blocking effect of Cd2+ on Na+ channels, suggesting extended loop structure and thus capability of accommodating multiple ions near the DEKA region of the pore (Chiamvimonvat et al., 1996; Yamagishi et al., 1997). In this regard, one may also note that there seems to be multiion occupancy with significant interaction between permeating K+ ions at the external pore mouth of an inward rectifier K+ channel (Shieh et al., 1999). Moreover, Miller (1996) has proposed that the narrow single-file selectivity region of some K+ channels may be connected to the bulk solutions by a wide vestibule, because in some K+ channels the selectivity determining deep-pore residues are accessible to large peptide blockers or polar thiols from the external or internal side of the membrane (Pascual et al., 1995; Naranjo and Miller, 1996). It would be interesting to see whether such a multiion region at the external pore mouth is a more general functional design shared by different cationic channels.
Acknowledgments
This work was supported by grant NSC-90-2320-B-002-154 from the National Science Council, Taiwan. Chi-Pan Hsieh is a recipient of the MD Ph.D./DDS Ph.D. predoctoral fellowship RE90M003 from the National Health Research Institute, Taiwan.
Footnotes
Abbreviations used in this paper: BTX, batrachotoxin; TTX, tetrodotoxin.
References
- Akopian, A.N., L. Sivilotti, and J.N. Wood. 1996. A tetrodotoxin-resistant voltage-gated sodium channel expressed by sensory neurons. Nature. 379:257–262. [DOI] [PubMed] [Google Scholar]
- Akopian, A.N., V. Souslova, S. England, K. Okuse, N. Ogata, J. Ure, A. Smith, B.J. Kerr, S.B. McMahon, S. Boyce, et al. 1999. The tetrodotoxin-resistant sodium channel SNS has a specialized function in pain pathways. Nat. Neurosci. 2:541–548. [DOI] [PubMed] [Google Scholar]
- Backx, P.H., D.T. Yue, J.H. Lawrence, E. Marban, and G.F. Tomaselli. 1992. Molecular localization of an ion binding site within the pore of mammalian sodium channels. Science. 257:248–251. [DOI] [PubMed] [Google Scholar]
- Begenisich, T., and D. Busath. 1981. Sodium flux ratio in voltage-clamped squid giant axons. J. Gen. Physiol. 77:489–502. [DOI] [PMC free article] [PubMed] [Google Scholar]
- Chandler, W.K., and H. Meves. 1965. Voltage-clamp experiments on internally perfused giant axons. J. Physiol. 180:821–836. [DOI] [PMC free article] [PubMed] [Google Scholar]
- Chiamvimonvat, N., M.T. Perez-Garcia, R. Ranjan, E. Marban, and G.F. Tomaselli. 1996. Depth asymmetries of the pore-lining segments of the Na+ channel revealed by cysteine mutagenesis. Neuron. 16:1037–1047. [DOI] [PubMed] [Google Scholar]
- Cohen, C.J., B.P. Bean, T.J. Colatski, and R.W. Tsien. 1981. Tetrodotoxin block of Na+ channels in rabbit cardiac Purkinje fibers. Nature. 278:265–269. [Google Scholar]
- Ellinor, P.T., J. Yang, W.A. Sather, J. Zhang, and R.W. Tsien. 1995. Ca2+ channel selectivity at a single locus for high-affinity Ca2+ interactions. Neuron. 15:1121–1132. [DOI] [PubMed] [Google Scholar]
- Favre, I., E. Moczydlowski, and L. Schild. 1996. On the structural basis for ionic selectivity among Na+, K+, and Ca2+ in the voltage-gated Na+ channel. Biophys. J. 71:3110–3125. [DOI] [PMC free article] [PubMed] [Google Scholar]
- Frelin, C., C. Cognard, P. Vigne, and M. Lazdunski. 1986. Tetrodotoxin-sensitive and tetrodotoxin-resistant Na+ channels differ in their sensitivity to Cd2+ and Zn2+. Eur. J. Pharmacol. 122:245–250. [DOI] [PubMed] [Google Scholar]
- Goldin, A.L. 2001. Resurgence of sodium channel research. Annu. Rev. Physiol. 63:871–894. [DOI] [PubMed] [Google Scholar]
- Goldin, A.L., R.L. Barchi, J.H. Caldwell, F. Hofmann, J.R. Howe, J.C. Hunter, G.G. Kallen, G. Mandel, M.H. Meisler, Y.B. Netter, et al. 2000. Nomenclature of voltage-gated sodium channels. Neuron. 28:365–368. [DOI] [PubMed] [Google Scholar]
- Green, W.N., L.B. Weiss, and O.S. Andersen. 1987. Batrachotoxin-modified sodium channels in planar lipid bilayers: ion permeation and block. J. Gen. Physiol. 89:841–872. [DOI] [PMC free article] [PubMed] [Google Scholar]
- Heinemann, S.H., H. Terlau, and K. Imoto. 1992. a. Molecular basis for pharmacological differences between brain and cardiac sodium channels. Pflugers Arch. 422:90–92. [DOI] [PubMed] [Google Scholar]
- Heinemann, S.H., H. Terlau, W. Stuhmer, K. Imoto, and S. Numa. 1992. b. Calcium channel characteristics conferred on the sodium channel by single mutations. Nature. 356:441–443. [DOI] [PubMed] [Google Scholar]
- Hess, P., and R.W. Tsien. 1984. Mechanisms of ion permeation through calcium channels. Nature. 309:453–456. [DOI] [PubMed] [Google Scholar]
- Hille, B. 1972. The permeability of the Na+ channel to metal cations in myelinated nerve. J. Gen. Physiol. 59:637–658. [DOI] [PMC free article] [PubMed] [Google Scholar]
- Hille, B. 1992. Ionic Channels of Excitable Membranes. Sinauer Associates, Sunderland, MA. 607 pp.
- Hodgkin, A.L., and R.D. Keynes. 1955. The potassium permeability of a giant nerve fiber. J. Physiol. 128:61–88. [DOI] [PMC free article] [PubMed] [Google Scholar]
- Huang, C.-J., and E. Moczydlowski. 2001. Cytoplasmic polyamines as permeant blockers and modulators of the voltage-gated sodium channels. Biophys. J. 80:1262–1279. [DOI] [PMC free article] [PubMed] [Google Scholar]
- Khodorov, B.I. 1985. Batrachotoxin as a tool to study voltage-sensitive sodium channels of excitable membranes. Prog. Biophys. Mol. Biol. 45:57–148. [DOI] [PubMed] [Google Scholar]
- Kleinhaus, A.L., and J.W. Pritchard. 1976. Sodium-dependent tetrodotoxin-resistant action potentials in leech neurons. Brain Res. 102:368–373. [DOI] [PubMed] [Google Scholar]
- Kostyuk, P.G., N.S. Veselovsky, and A.Y. Tsyndrenco. 1981. Ionic currents in the somatic membrane of rat dorsal root ganglion neurons-I. Sodium current. Neuroscience. 6:2423–2430. [DOI] [PubMed] [Google Scholar]
- Kral, M.G., Z. Xiong, and R.E. Study. 1999. Alteration of Na+ current in dorsal root ganglion neurons from rats with a painful neuropathy. Pain. 81:15–24. [DOI] [PubMed] [Google Scholar]
- Kuo, C.-C., and P. Hess. 1993. a. Ion permeation through the L-type Ca2+ channel in rat phaeochromocytoma cells: two sets of ion binding sites in the pore. J. Physiol. 466:629–655. [PMC free article] [PubMed] [Google Scholar]
- Kuo, C.-C., and P. Hess. 1993. b. Characterization of the high-affinity Ca2+ binding sites in the L-type Ca2+ channel pore in rat phaeochromocytoma cells. J. Physiol. 466:657–682. [PMC free article] [PubMed] [Google Scholar]
- Lombet, A., C. Frelin, J.F. Renaud, and M. Lazdunski. 1982. Na+ channels with binding sites of high and low affinity for tetrodotoxin in different excitable and nonexcitable cells. Eur. J. Biochem. 124:199–203. [DOI] [PubMed] [Google Scholar]
- Miller, C. 1996. The long pore gets molecular. J. Gen. Physiol. 107:445–447. [DOI] [PMC free article] [PubMed] [Google Scholar]
- Naranjo, D., and C. Miller. 1996. A strongly interacting pair of residues on the contact surface of charybdotoxin and a Shaker K+ channel. Neuron. 16:123–130. [DOI] [PubMed] [Google Scholar]
- Pascual, J.M., C.C. Shieh, G.E. Kirsch, and A.M. Brown. 1995. K+ channel pore structure revealed by reporter cysteines at inner and outer surfaces. Neuron. 14:1055–1063. [DOI] [PubMed] [Google Scholar]
- Ravindran, A., L. Schild, and E. Moczydlowski. 1991. Divalent cation selectivity for external block of voltage-dependent Na+ channels prolonged by Batrachotoxin: Zn2+ induces discrete substates in cardiac Na+ channels. J. Gen. Physiol. 97:89–115. [DOI] [PMC free article] [PubMed] [Google Scholar]
- Roy, M.L., and T. Narahashi. 1992. Differential properties of tetrodotoxin-sensitive and tetrodotoxin-resistant sodium channels in rat dorsal root ganglion neurons. J. Neurosci. 12:2104–2111. [DOI] [PMC free article] [PubMed] [Google Scholar]
- Rush, A.M., M.E. Brau, A.A. Elliott, and J.R. Elliott. 1998. Electrophysiological properties of sodium current subtypes in small cells from adult rat dorsal root ganglia. J. Physiol. 511:771–789. [DOI] [PMC free article] [PubMed] [Google Scholar]
- Satin, J., J.W. Kyle, M. Chen, P. Bell, L.L. Cribbs, H.A. Fozzard, and R.B. Rogart. 1992. A mutant of TTX-resistant cardiac sodium channels with TTX-sensitive properties. Science. 256:1202–1205. [DOI] [PubMed] [Google Scholar]
- Scholz, A., N. Kuboyama, G. Hempelmann, and W. Vogel. 1998. Complex blockade of TTX-resistant Na+ currents by lidocaine and bupivacaine reduce firing frequency in dorsal root ganglion neurons. J. Neurophysiol. 79:1746–1754. [DOI] [PubMed] [Google Scholar]
- Sheets, M.F., and D.A. Hanck. 1992. Mechanisms of extracellular divalent and trivalent cation block of the sodium current in canine cardiac Purkinje cells. J. Physiol. 454:299–320. [DOI] [PMC free article] [PubMed] [Google Scholar]
- Shieh, R.-C., J.-C. Chang, and C.-C. Kuo. 1999. K+ binding sites and interactions between permeating K+ ions at the external pore mouth of an inward rectifier K+ channel (Kir2.1). J. Biol. Chem. 274:17424–17430. [DOI] [PubMed] [Google Scholar]
- Teresa Perez-Garcia, M., N. Chiamvimonvat, R. Ranjan, J.R. Balser, G.F. Tomaselli, and E. Marban. 1997. Mechanisms of sodium/calcium selectivity in sodium channels probed by cysteine mutagenesis and sulfhydryl modification. Biophys. J. 72:989–996. [DOI] [PMC free article] [PubMed] [Google Scholar]
- Terlau, H., S.H. Heinemann, W. Stuhmer, M. Pusch, F. Conti, K. Imoto, and S. Numa. 1991. Mapping the site of block by tetrodotoxin and saxitoxin of sodium channel II. FEBS Lett. 293:93–96. [DOI] [PubMed] [Google Scholar]
- Visentin, S., A. Zaza, A. Ferroni, C. Tromba, and C. DiFrancesco. 1990. Sodium current block caused by group IIb cations in calf Purkinje fibers and in guinea-pig ventricular myocytes. Pflugers Arch. 417:213–222. [DOI] [PubMed] [Google Scholar]
- Woodhull, A.M. 1973. Ionic blockage of sodium channels in nerve. J. Gen. Physiol. 61:687–708. [DOI] [PMC free article] [PubMed] [Google Scholar]
- Yamagishi, T., M. Janecki, E. Marban, and G.F. Tomaselli. 1997. Topology of the P segments in the sodium channel pore revealed by cysteine mutagenesis. Biophys. J. 73:195–204. [DOI] [PMC free article] [PubMed] [Google Scholar]
- Yang, J., P.T. Ellinor, W.A. Sather, J.-F. Zhang, and R.W. Tsien. 1993. Molecular determinants of Ca2+ selectivity and ion permeation in L-type Ca2+ channels. Nature. 366:158–161. [DOI] [PubMed] [Google Scholar]
- Zowlinski, B.J., H. Eyring, and C.E. Reese. 1949. Diffusion and membrane permeability. I. J. Physiol. Colloid Chem. 53:1426–1453. [Google Scholar]