

Abstract
Deposition of a fluorophoric material, known as lipofuscin, in retinal pigment epithelium cells has been speculated to be one of the biomarkers of age-related macular degeneration. One of the fluorophores of lipofuscin has been characterized as A2E, a pyridinium bisretinoid. Its cationic nature along with two hydrophobic retinal chains suggests that it can disrupt the membrane integrity by its detergent-like activity and can thus cause cellular damage. With this notion, we studied in detail the interaction between A2E and the model membranes of different lipid compositions using fluorescence steady-state and fluorescence anisotropy measurements. A transition from vesicular to micellar structure occurred upon incorporation of A2E into the lipid bilayer. However, the A2E concentration at which this transition occurred depends on the lipid composition. A lipid mixture containing 10% phosphatidylserine (PS) (close to disc membrane PS content) behaved similarly to a lipid mixture having no PS. In contrast, vesicles containing 20% PS showed significantly different behavior. Membrane solubilization by A2E was also confirmed by vesicle leakage experiments. A2E also showed significant activity in liposome-mediated gene transfection. A lipid formulation containing 40% A2E and a helper lipid showed plasmid DNA transfection efficiency comparable to commercially available transfection reagents with no evidence of cytotoxicity. These results contribute to understanding the mechanism underlying the A2E-induced cellular dysfunction.
Keywords: lipofuscin, cellular dysfunction, lipid vesicles, fluorescence studies, membrane solubilization
INTRODUCTION
Age-related macular degeneration (AMD)* (for review see Penfold et al., 2001) is the leading cause of blindness or severe visual impairment in the elderly population in industrialized nations (Evans, 2001). The morphological changes associated with retinal pigment epithelium (RPE) cells upon aging are generally believed to contribute to the pathogenesis of AMD. Little is known about the etiology and molecular pathophysiology of AMD. As a result, effective treatment options are limited and consist mainly of laser photocoagulation therapy. The most characteristic feature of aging in the RPE is the progressive cellular accumulation of lipofuscin. The deposition of this autofluorescent material could occur as a consequence of the role of RPE cells in phagocytosing packets of disc membrane that are shed by photoreceptor cells as part of the renewal process. Eldred and Lasky (1993) pooled lipofuscin from a large number of aged human eyes and identified one of the major blue-absorbing and orange-red–emitting fluorophores to be a bis-Schiff base adduct. Sakai et al. (1996) established the correct structure of the emissive species to be a bis-substituted pyridinium ring, known as A2E. Later Parish et al. (1998) isolated another fluorophore from RPE lipofuscin which is a double bond isomer of A2E (named as iso-A2E) (Fig. 1) and showed in in vitro studies that they exist in a photoequilibrium of 4 (A2E):1 (iso-A2E). Liu et al. (2000) have provided strong evidence from electronspray ionization and fast atom bombardment tandem mass spectroscopy that A2-PE, a phosphatidylpyridium bisretinoid, forms within the photoreceptor outer segment membrane and is a precursor of A2E, which is subsequently generated by phosphate hydrolysis of A2-PE. This hypothesis was corroborated by Mata et al. (2000) by identifying three critical intermediates in the biosynthesis of A2E in ocular tissues from abcr−/− mice and humans with ABCR-mediated recessive macular degeneration.
Figure 1.

Structures of A2E and iso-A2E.
The availability of the biomimetic synthesis of A2E (Parish et al., 1998) in reasonably good yield has triggered several investigations on the effects of A2E on cellular function. Two possible modes of action of A2E have been suggested. First, due to its amphiphilic nature, A2E could act as a detergent and thus disrupt the membrane integrity (Eldred and Lasky, 1993; Eldred, 1995; Sparrow et al., 1999). Second, A2E could be phototoxic to the cells. It has been demonstrated that blue-light photoexcitation of A2E-enriched human RPE cells can initiate a cell death program, executed by a proteolytic caspase cascade and regulated by Bcl-2 (Sparrow et al., 2000; Sparrow and Cai, 2001). Another report has shown that A2E, but not iso-A2E, inhibits cytochrome c oxidase, detaches proapoptotic proteins from mitochondria, and induces apoptosis in mammalian RPE cells (Suter et al., 2000). However, in the dark, the inhibition of cytochrome c oxidase could be overcome by cardiolipin or other acidic phospholipids. With illumination, A2E causes persistent modifications of the enzyme and can no longer be abrogated by cardiolipin (Shaban et al., 2001). Whatever the mechanistic pathway is, the extent of cellular damage is found to be dependent on the A2E concentration and is only observed if A2E is present above a critical concentration.
Although phototoxicity is mostly highlighted as the main outcome of the consequences of A2E deposition in the RPE cells, and the generation of singlet oxygen has been established for solvent extracts of lipofuscin (Rozanowska et al., 1995, 1998; Wassell et al., 1999), the ability of A2E to photogenerate such species has not been proven. Moreover, Davies et al. (2001), in a recent study, have observed cellular damage upon exposing to blue light cultured RPE cells which had been fed isolated lipofuscin granules, though the cellular concentration of A2E was 100-fold below that needed to cause phototoxicity. In an attempt to resolve this issue, Lamb et al. (2001) have recently performed a systematic examination of the primary photochemical processes of A2E in solution using steady-state and time-resolved spectroscopic techniques. Interestingly, this study demonstrated that A2E is inefficient in activating oxygen in solution and thus disproves the idea that A2E could be a major phototoxic component of ocular lipofuscin.
In this report, we begin to address the question of whether A2E has detergent-like properties that might damage cellular membranes. Does A2E cause membrane solubilization and if so, above which concentration? Does this process depend on the membrane lipid composition? The cationic nature of A2E suggests that A2E may interact differently with the model membranes containing anionic phospholipids. We performed a detailed investigation of membrane–A2E interaction in various model membranes as well as with a membrane composition very similar to disc membrane, DOPC:DOPE:DOPS (0.45:0.45:0.1), by steady-state fluorescence and fluorescence anisotropy methods. We also performed transmission electron microscopy and leakage experiments using a Tb3+/DPA assay. Our results suggest that A2E gets inserted in the membrane bilayer and solubilizes it above a certain concentration that depends on the bilayer composition. Interestingly, A2E was also found to be efficient in gene transfection, and in the presence of helper lipid could be used as a liposome-mediated gene transfer agent.
MATERIALS AND METHODS
Materials
Chloroform stock solutions of 1,2-dioleoyl-sn-glycero-3-phosphocholine (DOPC), 1,2-dioleoyl-sn-glycero-3-phosphoethanolamine (DOPE), and 1,2-dioleoyl-sn-glycero-3-[phospho-L-serine] (sodium salt) (DOPS) were purchased from Avanti Polar Lipids, Inc. and used without further purification. Ethanolamine, all-trans-retinal, L-histidine, pyridine-2,6-dicarboxylic acid (DPA), and N-[tris(hydroxymethyl)methyl]-2-aminoethanesulfonic acid (TES) were purchased from Sigma-Aldrich. 1,6-Diphenyl-1,3,5-hexatriene (DPH) and terbium chloride were purchased from Sigma-Aldrich. D2O “100%” was from Cambridge Isotope Labs. Commercially available transfection reagents Lipofectamine® were obtained from GIBCO BRL. All other reagents were of the highest quality available. The luciferase and β-galactosidase assay kits were obtained from Promega.
Synthesis of A2E
A2E was synthesized and purified using a published procedure (Parish et al., 1998). In brief, a mixture of all-trans-retinal (2.3 equivalents) and ethanolamine (1 equivalent) in ethanol (EtOH) was stirred in the presence of acetic acid (1 equivalent) at room temperature in the dark for 2.5 d. After the mixture was concentrated in vacuo, the residue was purified by silica gel column chromatography. The crude A2E (mixture of A2E and iso-A2E) isolated from the column was characterized by routine spectroscopic techniques (e.g., HPLC, NMR, and low resolution fast atom bombardment [LR FAB]-MS). In addition to the molecular ion peak at 593 in LR FAB–MS, additional minor peaks at 608, 625, and 641 were also observed. Since A2E was synthesized through a biomimetic approach and iso-A2E was found in an eye extracted in the dark (suggesting that A2E-iso-A2E photoisomerization takes place in vivo) we did not attempt to purify this mixture. Instead, we used this mixture to make a stock solution in ethanol (concentration 6.3 mM), which was used for all the spectroscopic studies.
Vesicle Preparation
Unilamellar vesicles were prepared by the extrusion method. Appropriate quantities of chloroform stocks of phospholipid were dried under vacuum overnight and suspended in the appropriate buffer above the lipid order/disorder phase transition. For the steady-state fluorescence experiments and electron microscopy studies, lipids were suspended in 1 mM Tris-HCl buffer, pH 7.1. For Tb/DPA leakage experiments, vesicles were prepared in buffer containing 185 mM NaCl, 3.7 mM L-His, 3.7 mM TES, 20 mM CaCl2, 2.0 mM EDTA, 7.5 mM TbCl3, and 75 mM DPA, pH 7.4. The hydrated lipid film was then vortexed for 15–20 s followed by sonication using a bath sonicator for 1 h. This lipid dispersion was then extruded 17 times through a 50-nm polycarbonate membrane to obtain small unilamellar vesicles (SUVs). SUVs having a 50 nm diameter were used for most of the experiments except leakage experiments. For leakage experiments, multilamellar vesicles (MLVs) or large unilamellar vesicles (LUVs) having a diameter of 100 nm were prepared and then passed through Micro Bio-Spin P-30 columns (Bio-Rad) or Pharmacia columns loaded with Sephadex G-50 (equilibriated with probe-free buffer) to remove the untrapped probe-containing buffer.
Fluorescence Spectroscopy
Fluorescence measurements were performed at 25°C on a Spex Fluorolog 3-11 τ3 spectrofluorometer equipped with a 450 W Xenon arc lamp. For steady-state experiments, a lipid concentration of 0.5 mM was used. A2E stock solution was added gradually to the vesicular solution in the cuvette to reach a particular A2E concentration. Samples were excited at 400 nm and the emission spectra in the range 470–700 nm were recorded. The excitation and emmision slit widths were 1.5 and 5 nm, respectively. For anisotropy measurements of A2E, lipid concentrations were 0.1 and 0.25 mM and the excitation and emission wavelengths were fixed at 400 and 552 nm, respectively. Anisotropy was measured ∼3 min after the addition of A2E. For DPH anisotropy experiments, 1 μl of DPH solution (6 × 10⁻⁶ M) was first injected in the lipid dispersion (0.1 mM) to obtain a final DPH concentration of 1.5 × 10⁻⁸ M and then A2E was added gradually. An excitation wavelength of 360 nm and an emission wavelength of 430 nm was used. All anisotropy values are means of five trials.
Transmission Electron Micrograph
To visualize the change in morphology of the vesicles upon treatment with A2E, we examined the vesicular suspension (5 × 10⁻⁴ M) of DOPC:DOPE:DOPS (45:45:10) using electron microscopy. Phosphotungstic acid was used as the staining agent. To the same vesicular solution, 50 and 300 μM of A2E were added separately and one drop of such mixture was tested. Electron microscopy was performed on a JEOL JEM-100CX II electron micrograph and all the micrographs were visualized at the same magnification (135,000×).
Leakage Assay
The Tb/DPA leakage assay was done based on a reported procedure (Haque et al., 2001). Leakage of contents was followed using vesicles containing coencapsulated 7.5 mM TbCl3 and 75 mM DPA. When leakage of contents occurred, a drop in fluorescence was observed due to the fluorescence quenching of Tb3+ by water (Wilschut et al., 1980). Tb3+ is released from complexation with DPA when the trapped compartment was diluted into the external compartment. Vesicular samples were excited at 278 nm and the emission intensity was monitored at 545 nm. Required amount of vesicular solution was injected in the buffer to reach a lipid concentration of 0.1 mM. Buffer contained 185 mM NaCl, 3.7 mM L-His, 3.7 mM TES, 20 mM CaCl2, and 2.0 mM EDTA, pH 7.4. The fluorescence intensity of the coencapsulated Tb/DPA vesicles was taken as representing 0% leakage of the trapped contents. Different volumes of A2E stock solution were added to the cuvette to reach the indicated A2E concentration and fluorescence intensity at 545 nm was measured at each point. Percent leakage was calculated according to the equation: [ΔF (0 μM A2E) − ΔF (x μM A2E)]/[ΔF (0 μM A2E)], where ΔF is the decrease in Tb/DPA fluorescence upon addition of A2E.
Transfection Experiments
Plasmid pGL3-control vector (Promega) containing the luciferase reporter gene under the control of the SV40 promoter vector and pSV-β-galactosidase control vector containing β-galactosidase gene under the control of the SV-40 early promoter and enhancer were amplified in Escherichia coli (DH5α) and purified using the Qiagen Maxi Prep Plasmid Purification protocol. A general procedure for a typical transfection was as follows. COS-1 cells were seeded in 12-well tissue culture plates the day before transfection in order to be ∼80% confluent the next day. Cells were cultured in Dulbecco's Modified Eagle medium (DMEM) with GlutaMAX™ supplemented with 10% FCS. Cells were maintained at 37°C in a humidified 5% CO2/95% air containing atmosphere. First, DOPE–A2E complex was formed at the desired compositions (0% A2E to 80% A2E in DOPE). Plasmid DNA (0.7 μg) and the DOPE–A2E complex (8–10 μg) were each diluted to 50 and 33 μL, respectively, in DMEM without FCS. After 15 min of incubation of DNA in DMEM, the solution containing DOPE–A2E complex was added to the DNA solution and the resulting solution was gently mixed and incubated for 15 min at room temperature to allow the lipid–DNA complex formation. Then, the volume of the transfection mixture was adjusted to 400 μl and was added to the cells (0.4 ml/well) from which the growth media was removed. After 3.5–4 h of incubation at 37°C, 0.4 ml DMEM media containing 20% FCS was added to each well. After 24 h of incubation, the growth media from the cells were removed and they were fed with DMEM containing 10% FCS. Cells were incubated for another 24 h and then monitored for the transient expression of the luciferase gene or β-galactosidase gene. Control transfections were performed using commercially available transfection reagent, lipopolyamine Lipofectamine® (DOSPA/DOPE) at a concentration of 2 μg/well and 8 μg/well. Luciferase/β-galactosidase activities were assayed 48 h posttransfection according to the manufacturer's instructions. Luciferase assay substrate (100 μL) was added to 20 μl of cell extract at room temperature. A scintillation counter (Beckman Coulter; LS 6500 Scintillation System) was used for photon counting. Protein concentrations were measured by Bradford's method using bovine serum albumin as a standard. β-Galactosidase assay was performed in 96-well plate and read by a plate reader (PE Applied Biosystems Spectromax 250). Cell extract (10 μL) was diluted to 50 μl before the assay buffer was added. Since the results from luciferase assay and the β-galactosidase assay are essentially the same, only β-galactosidase assay results are described here. Cells were analyzed for cytotoxicity 48 h posttransfection using Promega's nonradioactive cell proliferation assay. It is based on the cellular conversion of a tetrazolium salt into a formazan product which absorbs at 570 nm. A PerkinElmer Lambda 800 UV/VIS Spectrometer was used to read the samples. All the values were compared with their controls (transfected versus nontransfected).
RESULTS
Structural Analysis of A2E
Wedge-shaped amphiphilic structures of A2E and iso-A2E are suggested by a positively charged pyridinium ring connected to two hydrophobic retinal chains (Fig. 1). These compounds are likely to aggregate upon dispersion in water and could exert detergent-like activity when incorporated in the membrane bilayer. Like docosahexaenoic acid, they have two bulky retinal chains and will occupy a relatively large cross-sectional area. This type of hydrophobic chain disposition generally prefers the inverted hexagonal phase over the lamellar phase. However, the nature of interactions of A2E and iso-A2E with lipid bilayers are not expected to be grossly different. Since A2E-iso-A2E photoisomerization is believed to take place in vivo, we used a mixture of these two chromophores for all our spectroscopic studies.
Steady-State Fluorescence Studies
It was reported previously that the emission maximum of A2E was dependent on the nature of the solvent, with n-BuCl giving a λmax of 585 nm in comparison with the red-shifted λmax values observed in methanol (600 nm) and PBS (610 nm) (Sparrow et al., 1999). However, a detailed study of A2E fluorescence properties has not been reported. We recorded the λmax of A2E in different solvents. A λmax of 544 nm was obtained in hexane, whereas that recorded in water was 600 nm. A blue shift of ∼60 nm was observed in a nonpolar solvent compared with a polar media. This spectacular shift in λmax suggested that one could follow the interaction between lipid bilayer and A2E and detect any transition in the bilayer structure using fluorescence spectroscopy. As a first step, we determined the critical aggregation concentration (cac) of A2E, which is found to be ∼300 μM in deionized water (Fig. 2) . We also checked λmax values of A2E (∼15 μM) in various micellar systems (e.g., in zwitterionic 3-[(3-cholamidopropyl)dimethylammonio]-1-propanesulfonate [CHAPS] micelles, λmax ∼580 nm; in nonionic Triton X-100 micelles, λmax ∼560 nm; and in anionic sodium dodecylsulfate [SDS] micelles, λmax ∼574 nm).
Figure 2.

Critical aggregation concentration of A2E. The critical aggregation concentration of A2E was determined by fluorescence steady-state measurement at 25°C. Different amounts of A2E stock solution were injected in water to reach a particular concentration of A2E. The sample was excited at 400 nm and the fluorescence intensity at each fluorescence emission maximum was plotted against the concentration of A2E.
Incorporation of A2E in dimyristoylphosphatidylcholine (DMPC) vesicles (500 μM) showed that A2E experiences a hydrophobic environment (λmax 554 nm) when present in low concentration (∼15 μM), and the λmax shifts gradually to higher wavelength with the progressive addition of A2E (unpublished data), suggesting water intrusion in the membrane (increase in polarity) and gradual disruption of the vesicular structure. Inspired by this result, we then tested a series of dioleoyl based lipids alone or their mixtures at different proportions. Fig. 3 A summarizes the results. The λmax displayed a red shift from ∼553 to 585–590 nm as A2E was gradually added to the vesicular solutions (500 μM) of DOPC, DOPE, a 1:1 mixture of DOPC and DOPE (designated as PC50PE50), and a 45:45:10 mixture of DOPC, DOPE, and DOPS (designated as PC45PE45PS10), which is the closest membrane composition of the disc membrane. Interestingly, such behavior was not observed in the case of DOPS vesicles. A λmax shift of only 18 nm (from 556 to 574 nm) was observed and the λmax value remained almost constant after 200 μM of A2E concentration.
Figure 3.

Effect of lipid composition on the fluorescence properties of A2E. The change in the fluorescence emission maximum (A) and the fluorescence intensity (B) upon addition of A2E to the model membranes of DOPC, DOPE, DOPS, DOPC:DOPE (1:1), DOPC:DOPE:DOPS (0.45:0.45:0.1), and DOPC:DOPE:DOPS (0.4:0.4:0.2) was plotted against the A2E concentration. In all the cases, lipid concentration was 500 μM. Different amounts of A2E solution were injected to the aqueous dispersions to reach a particular concentration of A2E. The excitation wavelength was 400 nm and all the measurements were done at 25°C.
We also plotted the fluorescence intensity versus the A2E concentration from the above mentioned experiments. As can be seen in Fig. 3 B, the fluorescence intensity increased sharply as the concentration of A2E increased until 200 μM of A2E concentration in case of all the vesicular solutions (500 μM), but then displayed a steady decrease in the intensity. However, the increase in the fluorescence intensity was much higher in the cases of PC40PE40PS20 and DOPS vesicles compared with those of DOPC, DOPE, PC50PE50, and PC45PE45PS10 vesicles.
Steady-State Fluorescence Anisotropy Studies
Fluorescence anisotropy measurements have been used extensively to estimate the internal viscosities of membranes and to evaluate the effect of lipid composition upon the membrane phase transition temperature. Considering its structure, it occurred to us that A2E should be an excellent probe for fluorescence anisotropy studies and we could extract useful information about how it interacts with the lipid bilayer. Using this technique, we determined the critical aggregation concentration of A2E (Fig. 4) , which was similar to the value that obtained from the steady-state fluorescence studies. An anisotropy value of 0.17 was observed in the micellar state of A2E. Then, we incorporated different amounts of A2E in various lipid bilayers (100 μM) and studied the concentration of A2E versus the fluorescence anisotropy profile. As can be seen in Fig. 5 , with the increase in the concentration of A2E added to the lipid vesicles (100 μM), a steep rise in the anisotropy value was observed in case of all the vesicles. However, there was a subtle difference in their interaction with A2E depending on the membrane composition. In case of PC50PE50, PC45PE45PS10 and PC40PE40PS20 vesicles, the anisotropy reached a maximum value of ∼0.24 and then sharply decreased to a steady value of ∼0.16, which coincided with the value observed for the A2E micelles in the buffer. The decrease in anisotropy was also accompanied by a visual change of the solution—it turned hazy. The A2E concentration at which the maximum anisotropy was reached, was 50 μM for PC50PE50 and PC45PE45PS10 vesicles and 50–80 μM for PC40PE40PS20 vesicles. DOPE vesicles maintained a constant value of ∼0.16 once the concentration of A2E reached ∼25 μM. In case of DOPS vesicles, an anisotropy value of 0.2 was reached at an A2E concentration of 35 μM and remained unchanged until ∼250 μM.
Figure 4.

Critical aggregation concentration of A2E by fluorescence anisotropy experiments. Change in fluorescence anisotropy of A2E upon addition of A2E to the buffer (1 mM Tris-HCl, pH 7.1) at 25°C was plotted as a function of A2E concentration.
Figure 5.

Effect of lipid composition on the fluorescence anisotropy of A2E. The change in fluorescence anisotropy of A2E upon addition of A2E to the model membranes of DOPE, DOPS, DOPC:DOPE (1:1), DOPC:DOPE:DOPS (0.45:0.45:0.1), and DOPC:DOPE:DOPS (0.4:0.4:0.2) at 25°C was plotted as a function of A2E concentration. The liposomal concentration was 100 μM in all the cases. Results are one of the three experiments conducted under the same conditions.
Steady-State Fluorescence Anisotropy Studies Using DPH as the Probe
The information we obtained from the measurement of A2E anisotropy in different lipid vesicles prompted us to carry out similar experiments in the presence of a membrane probe, DPH. DPH, a rod-like molecule, when incorporated in the lipid bilayer spontaneously partitions into the hydrophobic long chain region of the bilayer and senses the fluidity of the membrane interior. Lipid vesicle (100 μM) doped with 1.5 × 10⁻⁸ M DPH was used for this study. Before addition of any A2E, DPH anisotropy was measured. Then the A2E concentration was gradually increased and at each point, the mobility of DPH was followed. Fig. 6 A shows the change in fluorescence anisotropy of DPH incorporated in various lipid compositions (100 μM) as a function of A2E concentration. As can be seen, the movement of DPH in the membrane bilayer depended largely on the lipid composition. In general, upon incorporation of A2E, the anisotropy of DPH increased and reached a maximum value except with DOPS vesicles. The maxima and the corresponding A2E concentrations are different for different vesicular systems: 0.12, 0.18, 0.22, and 0.28 for DOPE, PC50PE50, PC45PE45PS10, and PC40PE40PS20 lipid vesicles at A2E concentrations of ∼25, 15, 45, and 80 μM, respectively. As observed in the previous experiment, then a steep decrease in the mobility of DPH was encountered, though this decrease was different for different lipid vesicles. In DOPS vesicles, the DPH anisotropy reached a steady value of ∼0.2 at an A2E concentration of 60 μM and remained constant until 500 μM concentration.
Figure 6.

Effect of lipid composition on the fluorescence anisotropy of DPH. The change in fluorescence anisotropy of DPH upon addition of A2E to the model membranes of DOPE, DOPS, DOPC:DOPE (1:1), DOPC:DOPE:DOPS (0.45:0.45:0.1), and DOPC:DOPE:DOPS (0.4:0.4:0.2) at 25°C was shown as a function of A2E concentration. The liposomal concentration was 100 μM (A) and 250 μM (B). The concentration of DPH in the liposomal solution was 1.5 × 10⁻⁸ M. DPH solution was injected in the membrane dispersion just before the experiment followed by gradual addition of A2E solution to reach a particular concentration of A2E.
Similar experiments were performed at another lipid concentration, 250 μM. As is evident from the Fig. 6 B, although an essentially comparable trend was observed, the maximum anisotropy sensed by DPH and the A2E concentration at which the sudden change in the vesicle micropolarity occurred varied quite dramatically. We summarize here the maxima and the corresponding A2E concentrations: 0.16 for DOPE at an A2E concentration of ∼35 μM, 0.28 for PC50PE50 at an A2E concentration of ∼35 μM, 0.24–0.25 for PC45PE45PS10 at an A2E concentration range of 60–105 μM, and 0.26–0.3 for PC40PE40PS20 at an A2E concentration range of 60–230 μM.
Electron Microscopy to Monitor the Change in Vesicular Morphology
Lipid vesicles of PC45PE45PS10 were chosen for this study. Fig. 7 A shows the vesicles from a 5 × 10⁻⁴ M lipid dispersion, prepared as described in experimental procedures. Although some of the vesicles have a collapsed appearance, an influence of the staining procedure cannot be excluded. Fig. 7, B and C, show the micrographs of the same vesicular solution in the presence of 50 μM (below cac) and 300 μM (above cac) concentrations of A2E, respectively. The addition of A2E reduced the number of the vesicles and at above the critical aggregation concentration, it changed the vesicular appearance noticeably.
Figure 7.


Morphological change in lipid vesicles upon addition of A2E. Transmission electron micrographs of (A) 500 μM DOPC:DOPE:DOPS (0.45:0.45:0.1) lipid vesicles alone, (B) the same in the presence of 50 μM A2E, and (C) in the presence of 300 μM A2E. Some of the vesicles have a collapsed appearance and are possibly shrunk during the staining procedure. Bars, 100 nm.
Leakage of Vesicular Contents
Tb/DPA encapsulated LUVs (diameter 100 nm) were employed for this study. Fig. 8 A shows the extent of content leakage for LUVs (100 μM) of different lipid compositions as a function of A2E concentration. There was no significant difference in the leakage profiles, with 60% leakage occurring at 20 μM A2E concentration in case of DOPC vesicles and 80% leakage occurring at the same A2E concentration in the cases of PC50PE50, PC45PE45PS10, and PC40PE40PS20 vesicles. However, multilamellar vesicles (100 μM) behaved quite differently in this respect (Fig. 8 B). An A2E concentration of ∼80 μM was required to have 80% leakage of the vesicular contents. Leakage rates were also found to be slightly dependent on the total lipid concentration.
Figure 8.
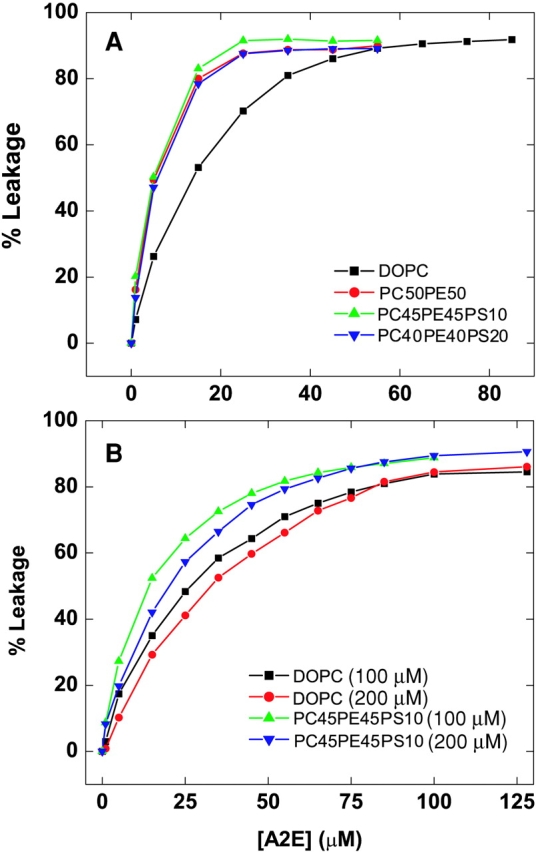
Leakage of vesicular contents by A2E. A2E-induced leakage of SUVs (A) and MLVs (B) from lipid vesicles of DOPC, DOPC:DOPE (1:1), DOPC:DOPE:DOPS (0.45:0.45:0.1), and DOPC:DOPE:DOPS (0.4:0.4:0.2) at 25°C is shown as a function of the A2E concentration. Vesicle leakage was monitored using the Tb/DPA assay. Tb/DPA coencapsulated lipid vesicles (10 mM) were diluted to 0.1 mM lipid in the buffer, 185 mM NaCl, 3.7 mM L-His, 3.7 mM TES, 20 mM CaCl2, and 2.0 mM EDTA, pH 7.4, and used for the measurements.
Transfection Ability of Various DOPE/A2E Formulations
The molecular structure of A2E, along with the observation by 31P NMR spectroscopy that the nonlamellar hexagonal membrane phase is favored when different volumes of A2E were added to the lipid vesicles of PC45PE45PS10 (unpublished data), inspired us to explore the capability of A2E as transfection agent, alone or doped in DOPE. Recently, to establish the correlation between the different lipid structures and transfection efficiency, cationic lipid–DNA complexes have been studied by the quantitative technique of synchrotron X-ray diffraction (Safinya, 2001). These studies established that more transfectant DOPE-containing complexes in mammalian cell culture exhibit the inverted hexagonal (Hc II) phase, rather than the multilamellar (Lc α) phase found in DOPC-containing complexes. In addition, there are several reports that suggest the potentiation of transfection by appending a hydroxyethyl moiety, as present in A2E (Felgner et al., 1994; Okayama et al., 1997). Stable liposomes of DOPE were prepared as described in the experimental section and passed through polycarbonate membranes of pore diameter 50 nm.
DOPE–A2E complexes of various compositions were made by adding different volumes of A2E stock solution to the DOPE dispersion and allowed to incubate at room temperature for 10 min. To find out the most effective formulations, transfections with identical amounts of DNA (0.7 μg) and lipid (8–10 μg) but varying the mole ratios of A2E in DOPE were performed. A2E was most effective at a 40:60 mixture of DOPE/A2E mole ratio composition (Fig. 9) , though 30:70, 50:50, and 60:40 mixtures of DOPE/A2E were also quite efficient in transfection. A2E alone was completely inactive for the transfection process. Under the same conditions, experiments were also performed with a commercially available transfection reagent Lipofectamine and the transfection efficiency of 40:60 DOPE:A2E mixture is found to be comparable to that of Lipofectamine. No significant change in transfection efficiency was observed when lipid amount per well was increased to 20 and 30 μg. However, transfection efficiency decreased ∼3.6 times when lipid amount per well was decreased to 4.5 μg. There was hardly any change in the transfection efficiency when DNA amount was varied from 0.4–2.5 μg per well. Cell viability assays demonstrated that there was no significant cytotoxicity associated with A2E at any of the concentrations or conditions used.
Figure 9.

A2E as a transfection agent. Transfection efficiencies of A2E with the helper lipid, DOPE, in various compositions were presented. pSV-β-galactosidase control DNA was used for this study. Concentration of DNA = 0.7 μg/well and that of the given lipid formulation was ∼8–10 μg/well. Data are expressed as β-galactosidase activity and compared against lipofectamine.
DISCUSSION
The unique lipid composition of the retinal rod outer segment (ROS) disc membranes has been proven to be crucial in the regulation of visual signal transduction pathway. The three major phospholipids in ROS membranes are phosphatidylcholine (PC), phosphatidylethanolamine (PE), and phosphatidylserine (PS) at a molar ratio of ∼4:4:1 and the average cholesterol content is ∼10 mol% (Fliesler and Anderson, 1983; Albert et al., 1996). These membranes deviate significantly from other cell membranes in their fatty acid composition. From 20 to 50% of all fatty acids in the phospholipids are docosahexaenoic acid (22:6) (DHA), a long-chain, highly unsaturated ϖ3 fatty acid. The triggering event for the visual process centers on the metarhodopsin I (MI) to metarhodopsin (MII) conformational transition which has been shown to be modulated by the properties of the membrane bilayer (Brown, 1994), including its fluidity and the curvature free energy of the membrane lipid water interface. Since A2E is an amphiphilic molecule and can thus get inserted into the lipid bilayer, it is important to look into its interaction with model membranes that mimic the ROS disc membrane composition. Moreover, A2E being cationic in nature, it could have some specific interaction with negatively charged PS lipids, which adopt an asymmetric transbilayer distribution in disc membranes in the dark (Hessel et al., 2000, 2001). So, in order to explore these questions, we have studied in detail the detergent properties of A2E and its behavior in model membranes.
We have first employed fluorescence steady-state measurements to investigate the effect of A2E incorpotation in model membranes. As can be interpreted from the Fig. 3 A, media polarity experienced by A2E was gradually enhanced as λmax values red shifted to ∼585 nm (the same λmax value was obtained when A2E was incorporated in zwitterionic CHAPS micelles) with the increase in A2E concentration for all the vesicular systems (500 μM) except negatively charged DOPS vesicles. This suggests the gradual penetration of water and decreased lipid packing in the vesicle outer leaflets and can be explained by a transition from vesicular structure to micellar structure. As an increased number of A2E molecules get inserted in the bilayer, vesicles get saturated with A2E, which causes the rupture of the vesicular structure and the formation of mixed micelles of A2E and the lipid component. A model that is generally used to describe lipid vesicle–micelle transitions is characterized by at least three stages of solubilization: (a) binding of detergents to the lipid membranes, (b) rupture of the detergent saturated vesicles resulting in the formation of mixed micelles in equilibrium with vesicles, and (c) a region where all lipids are solubilized in mixed micelles. However, the intermediate structure between vesicles and micelles is still a matter of controversy. The intermediate could be lamellar sheets, rod-like micelles, or interdigitated organizations.
However, such a transition is not feasible in case of DOPS vesicles because of the electrostatic interaction between A2E and negatively charged PS. Instead, A2E presumably causes the vesicular fusion, thereby increasing the vesicular size and thus the λmax value remains unchanged. It appears that PC40PE40PS20 vesicles follow a trend similar to that of DOPS vesicles until 500 μM A2E concentration, but then vesicles collapsed to micellar structures. However, vesicles containing 10% PS behave closely to those with the lipid composition having no PS. Thus, these results not only unravel the mechanism of membrane disruption by A2E, but also demonstrate that the behavior of 10–15% PS in the lipid mixture of PC and PE is the optimum one that does not have any influence on its membrane properties due to PS–A2E interaction.
The critical concentration of free detergent, which is necessary for lipid vesicle solubilization, is widely believed to be close to the critical aggregation concentration of the detergent. A similar situation was encountered here. As can be seen in Fig. 3 B, a sharp decrease in the fluorescence intensity was observed in the A2E concentration range 200–300 μM in all the cases (close to the critical aggregation concentration of A2E, Fig. 2). We believe that at this A2E concentration, vesicles are saturated with A2E molecules and enter into the transition phase. Lipid/detergent ratio is an important term to determine such a transition point. In case of PC40PE40PS20 and DOPS vesicles, the initial increase in the fluorescence intensity was higher, probably due to the increase in the vesicular size, thereby accommodating a higher number of A2E molecules.
To prove our hypothesis that A2E induces membrane solubilization in lipids containing 10% PS, whereas it initiates vesicular fusion in DOPS vesicles, we performed steady-state fluorescence anisotropy studies. The anisotropies of membrane-bound fluorophores have often been used to estimate the internal viscosities of membranes, since the rotational diffusion of a fluorophore is dependent upon the viscous drag imposed by the medium. Thus, anisotropy experienced by a fluorophore in a vesicular system is always larger compared with that in more dynamic micellar media. As can be seen in Fig. 5, an increase in the A2E anisotropy was observed as A2E started to get incorporated into the vesicles (100 μM). However, different anisotropy profiles were then observed depending on the lipid composition. Except for DOPE and DOPS vesicles, all went through a maximum point in the anisotropy profile. We anticipate that this was the onset of vesicular solubilization process. At the end of this pseudotransition process, anisotropy reached a steady value, which was the same as that observed in A2E micelles (Fig. 4). Interestingly, PS content in the vesicles seems to play a role here. Thus, while the onset of membrane solubilization is observed at 50 μM A2E concentration for PC50PE50 and PC45PE45PS10 vesicles, the same process for PC40PE40PS20 vesicles was encountered only at 80 μM. Such a trend is not observed in DOPS vesicles due to PS–A2E binding, which might hinder the movement of A2E. It is to be noted that since this concentration range is much below the concentration at which fluorescence quenching is seen, the lifetime of the fluorophore can be expected to remain unaffected.
Similar experiments were repeated in the presence of a DPH probe where the anisotropy of DPH was measured. In contrast to A2E, which can sense the interface region of membrane outer leaflet, DPH, being a hydrophobic molecule, gets buried inside the membrane and senses the polarity of the membrane hydrophobic core. Essentially similar behavior was encountered. An increase, followed by a sudden decrease in the DPH anisotropy, and the concentrations at which this pseudotransition occurred, coincided with those observed in the previous experiment. When the same experiment was repeated at a higher lipid concentration (250 μM), a shift in this transition point was observed. Thus, vesicular rupture not only depends on the A2E concentration and the lipid composition, but also on the total lipid/detergent ratio.
We further confirmed this transition process by electron microscopy and leakage experiments. It can be clearly seen in Fig. 7 that the total number of the vesicles decreased as the A2E concentration was increased. However, some aggregate-like structures were still present at 300 μM A2E concentration. Finally, A2E-induced leakage of the vesicular contents confirmed the solubilization of the membrane bilayer (Fig. 8).
At this point, the molecular structure of A2E prompted us to investigate whether A2E could be efficient in gene delivery. Its cone-like molecular shape (small head cross-section and large chain cross-section) may promote negative spontaneous curvature like PE and, thus, when present with PE, it will induce DNA binding to the lipid as well as the formation of a fusogenic nonlamellar structure that would reduce lipid packing, and promote stalk formation and merging of the membrane necessary for membrane destabilization. Our observation that 40% A2E in DOPE is the most efficient composition for DNA transfection supports this notion. Like most other liposome-based gene delivery systems, it showed no cytotoxicity to the cells. The optimum A2E concentration/well was ∼20 μM. An increase in A2E concentration (up to 50 μM) did not improve transfection efficiency any further, though no cytotoxicity was observed 48 h posttransfection. Together with the fact that it is easy to synthesize and thus would be relatively inexpensive, this result is remarkable from the application point of view. Currently, cationic liposome–based nonviral delivery systems offer a great potential for gene transfer both in vivo and in vitro. Such an effort to transfect the RPE cells using cationic liposomes has been successful recently (Abul-Hassan et al., 2000). Moreover, gene transfer to ocular cells is presently a promising approach in the treatment of a variety of retinal disorders (Ali et al., 2000; Acland et al., 2001; Dejneka and Bennett, 2001).
What are the implications of these findings in the pathogenesis of AMD? Though the accumulation of lipofuscin is found in the RPE cells, its formation in the rod outer segments cannot be ruled out. In fact, A2-PE, a precursor of A2E, has been shown to form in photoreceptor outer segments when isolated outer segments were incubated with all-trans-retinal by Liu et al. (2000). The accumulation of A2E was also observed within the degenerating retinas obtained from Royal College of Surgeons (RCS) rats, a blind strain in which the ability of RPE cells to internalize packets of outer segment membrane is severely impaired. The fact that A2-PE formation is favored at neutral pH, together with the detection of all-trans-retinol, but not all-trans-retinal within RPE cell extracts, suggests that its biogenesis occurs within the disc membrane of photoreceptors before internalization by RPE. Mice with a homozygous knockout of the abcr gene, an ATP-binding cassette transporter in rod outer segments, have been not only found to accumulate A2-PE in the rod outer segments, but also dihydro-N-retinylidene-N-retinylphosphatidylethanolamine (named as A2PE-H2), another precursor of A2E, abundantly in the rod outer segments as well as in the RPE cells (Mata et al., 2000, 2001). It has been also demonstrated that A2E can be generated from its precursor A2-PE by enzyme-mediated hydrolysis, while the generation of A2E from A2-PE by acid hydrolysis at pH 5.0–5.5, an acidic environment similar to RPE cell lysosomes was found to occur very slowly. The detection of a phosphodiesterase activity that can convert A2-PE to A2E in outer segments indicates that some portion of the A2-PE may undergo hydrolytic cleavage in the outer segment membrane before internalization by the RPE cells (Ben-Shabat et al., 2002). Eventually, A2E could reach RPE cells by the phagocytosis of shedded disc membrane. However, the hydrolytic cleavage of A2-PE within the RPE cells is not ruled out. Wherever the site of A2E formation is, the evidence presented here could be a feasible way to destruct the cell membrane and thus disrupt RPE cellular function. Membrane solubilization found above a certain A2E concentration is in accord with the finding that A2E becomes detrimental to the cells beyond a critical concentration. Accumulation of A2E is also expected to decrease the membrane fluidity, whereas photoreceptor cell membrane needs to maintain a distinctly high membrane fluidity for normal cell function. A detailed time-resolved spectroscopic study discourages the hypothesis that A2E could be a major phototoxic component of ocular lipofuscin (Lamb et al., 2001). Thus, this report bears importance regarding the molecular pathophysiology of A2E and may shed new light on the mechanistic pathway of diseases associated with excessive lipofuscin accumulation. The death of RPE cells has been also attributed to the blue-light–induced apoptosis performed by A2E deposited in the RPE cells (Sparrow and Cai, 2001). However, a complete scenario for such a pathway is yet to evolve. We are currently in the process of examining such apoptotic pathways.
Acknowledgments
We thank Dr. Karim Fahmy (Albert-Ludwigs-Universitaet Freiburg, Germany) for fruitful discussion, Dr. Eleana C. Sphicas for recording electron micrographs, and Ms. Michele Kirchner and Dr. Michael Schall for recording mass spectra.
This research was supported by Ellison Medical Foundation. T.P. Sakmar is an Associate Investigator of the Howard Hughes Medical Institute and a Senior Scholar of the Ellison Medical Foundation.
Footnotes
Abbreviations used in this paper: AMD, age-related macular degeneration; DOPC, 1,2-dioleoyl-sn-glycero-3-phosphocholine; DOPE, 1,2-dioleoyl-sn-glycero-3-phosphoethanolamine; DOPS, 1,2-dioleoyl-sn-glycero-3-[phospho-L-serine] (sodium salt); DPH, 1,6-diphenyl-1,3,5-hexatriene; LUV, large unilamellar vesicles; ROS, rod outer segment; RPE, retinal pigment epithelium; SUV, small unilamellar vesicle.
References
- Abul-Hassan, K., R. Walmsley, and M. Boulton. 2000. Optimization of non-viral gene transfer to human primary retinal pigment epithelial cells. Curr. Eye Res. 20:361–366. [PubMed] [Google Scholar]
- Acland, G.M., G.D. Aguirre, J. Ray, Q. Zhang, T.S. Aleman, A.V. Cideciyan, S.E. Pearce-Kelling, V. Anand, Y. Zeng, A.M. Maguire, et al. 2001. Gene therapy restores vision in a canine model of childhood blindness. Nat. Genet. 28:92–95. [DOI] [PubMed] [Google Scholar]
- Albert, A.D., J.E. Young, and P.L. Yeagle. 1996. Rhodopsin-cholesterol interactions in bovine rod outer segment disk membranes. Biochim. Biophys. Acta. 1285:47–55. [DOI] [PubMed] [Google Scholar]
- Ali, R.R., G.-M. Sarra, C. Stephens, M. Alwis, J.W.B. Bainbridge, P.M. Munro, S. Fauser, M.B. Reichel, C. Kinnon, D.M. Hunt, et al. 2000. Restoration of photoreceptor ultrastructure and function in retinal degeneration slow mice by gene therapy. Nat. Genet. 25:306–310. [DOI] [PubMed] [Google Scholar]
- Ben-Shabat, S., C.A. Parish, H.R. Vollmer, Y. Itagaki, N. Fishkin, K. Nakanishi, and J.R. Sparrow. 2002. Biosynthetic studies of A2E, a major fluorophore of retinal pigment epithelium lipofuscin. J. Biol. Chem. 277:7183–7190. [DOI] [PubMed] [Google Scholar]
- Brown, M.F. 1994. Modulation of rhodopsin function by properties of the membrane bilayer. Chem. Physiol. Lipids. 73:159–180. [DOI] [PubMed] [Google Scholar]
- Davies, S., M.H. Elliott, E. Floor, T.G. Truscott, M. Zareba, T. Sarna, F.A. Shamsi, and M.E. Boulton. 2001. Photocytotoxicity of lipofuscin in human retinal pigment epithelial cells. Free Radic. Biol. Med. 31:256–265. [DOI] [PubMed] [Google Scholar]
- Dejneka, N.S., and J. Bennett. 2001. Gene therapy and retinitis pigmentosa: advances and future challenges. Bioessays. 23:662–668. [DOI] [PubMed] [Google Scholar]
- Eldred, G.E. 1995. Lipofuscin fluorophore inhibits lysosomal protein degradation and may cause early stages of macular degeneration. Gerontology. 41:15–28. [DOI] [PubMed] [Google Scholar]
- Eldred, G.E., and M.R. Lasky. 1993. Retinal age pigments generated by self-assembling lysosomotropic detergents. Nature. 361:724–726. [DOI] [PubMed] [Google Scholar]
- Evans, J.R. 2001. Risk factors for age-related macular degeneration. Prog. Retin. Eye Res. 20:227–253. [DOI] [PubMed] [Google Scholar]
- Felgner, J.H., R. Kumar, C.N. Sridhar, C.J. Wheeler, Y.J. Tsai, R. Border, P. Ramsay, M. Martin, and P.L. Felgner. 1994. Enhanced gene delivery and mechanism studies with a novel series of cationic lipid formulations. J. Biol. Chem. 269:2550–2561. [PubMed] [Google Scholar]
- Fliesler, S.J., and R.E. Anderson. 1983. Chemistry and metabolism of lipids in the vertebrate retina. Prog. Lipid Res. 22:79–131. [DOI] [PubMed] [Google Scholar]
- Haque, M.E., T.J. McIntosh, and B.R. Lentz. 2001. Influence of lipid composition on physical properties and peg-mediated fusion of curved and uncurved model membrane vesicles: “nature's own” fusogenic lipid bilayer. Biochemistry. 40:4340–4348. [DOI] [PubMed] [Google Scholar]
- Hessel, E., P. Muller, A. Herrmann, and K.P. Hofmann. 2001. Light-induced reorganization of phospholipids in rod disc membranes. J. Biol. Chem. 276:2538–2543. [DOI] [PubMed] [Google Scholar]
- Hessel, E., A. Herrmann, P. Muller, P.P. Schnetkamp, and K.P. Hofmann. 2000. The transbilayer distribution of phospholipids in disc membranes is a dynamic equilibrium evidence for rapid flip and flop movement. Eur. J. Biochem. 267:1473–1483. [DOI] [PubMed] [Google Scholar]
- Lamb, L.E., T. Ye, N.M. Haralampus-Grynaviski, T.R. Williams, A. Pawlak, T. Sarna, and J.D. Simon. 2001. Primary photophysical properties of A2E in solution. J. Physiol. Chem. B. 105:11507–11512. [Google Scholar]
- Liu, J., Y. Itagaki, S. Ben-Shabat, K. Nakanishi, and J.R. Sparrow. 2000. The biosynthesis of A2E, a fluorophore of aging retina, involves the formation of the precursor, A2-PE, in the photoreceptor outer segment membrane. J. Biol. Chem. 275:29354–29360. [DOI] [PubMed] [Google Scholar]
- Mata, N.L., R.T. Tzekov, X. Liu, J. Weng, D.G. Birch, and G.H. Travis. 2001. Delayed dark-adaptation and lipofuscin accumulation in abcr+/− mice: implications for involvement of ABCR in age-related macular degeneration. Invest. Ophthalmol. Vis. Sci. 42:1685–1690. [PubMed] [Google Scholar]
- Mata, N.L., J. Weng, and G.H. Travis. 2000. Biosynthesis of a major lipofuscin fluorophore in mice and humans with ABCR-mediated retinal and macular degeneration. Proc. Natl. Acad. Sci. USA. 97:7154–7159. [DOI] [PMC free article] [PubMed] [Google Scholar]
- Okayama, R., M. Noji, and M. Nakanishi. 1997. Cationic cholesterol with a hydroxyethylamino head group promotes significantly liposome-mediated gene transfection. FEBS Lett. 408:232–234. [DOI] [PubMed] [Google Scholar]
- Parish, C.A., M. Hashimoto, K. Nakanishi, J. Dillon, and J. Sparrow. 1998. Isolation and one-step preparation of A2E and iso-A2E, fluorophores from human retinal pigment epithelium. Proc. Natl. Acad. Sci. USA. 95:14609–14613. [DOI] [PMC free article] [PubMed] [Google Scholar]
- Penfold, P.L., M.C. Madigan, M.C. Gillies, and J.M. Provis. 2001. Immunological and aetiological aspects of macular degeneration. Prog. Retin. Eye Res. 20:385–414. [DOI] [PubMed] [Google Scholar]
- Rozanowska, M., J. Wessels, M.E. Boulton, J.M. Burke, M.A. Rodgers, T.G. Truscott, and T. Sarna. 1998. Blue light-induced singlet oxygen generation by retinal lipofuscin in non-polar media. Free Radic. Biol. Med. 24:1107–1112. [DOI] [PubMed] [Google Scholar]
- Rozanowska, M., J. Jarvis-Evans, W. Korytowski, M.E. Boulton, J.M. Burke, and T. Sarna. 1995. Blue light-induced reactivity of retinal age pigment. In vitro generation of oxygen-reactive species. J. Biol. Chem. 270:18825–18830. [DOI] [PubMed] [Google Scholar]
- Safinya, C.R. 2001. Structures of lipid-DNA complexes: supramolecular assembly and gene delivery. Curr. Opin. Struct. Biol. 11:440–448. [DOI] [PubMed] [Google Scholar]
- Sakai, N., J. Decatur, K. Nakanishi, and G.E. Eldred. 1996. Ocular age pigment “A2-E”: an unprecedented pyridinium bisretinoid. J. Am. Chem. Soc. 119:3619–3620. [Google Scholar]
- Shaban, H., P. Gazzotti, and C. Richter. 2001. Cytochrome c oxidase inhibition by N-retinyl-N-retinylidene ethanolamine, a compound suspected to cause age-related macula degeneration. Arch. Biochem. Biophys. 394:111–116. [DOI] [PubMed] [Google Scholar]
- Sparrow, J.R., and B. Cai. 2001. Blue light-induced apoptosis of A2E-containing RPE: involvement of caspase-3 and protection by Bcl-2. Invest. Ophthalmol. Vis. Sci. 42:1356–1362. [PubMed] [Google Scholar]
- Sparrow, J.R., K. Nakanishi, and C.A. Parish. 2000. The lipofuscin fluorophore A2E mediates blue light-induced damage to retinal pigmented epithelial cells. Invest. Ophthalmol. Vis. Sci. 41:1981–1989. [PubMed] [Google Scholar]
- Sparrow, J.R., C.A. Parish, M. Hashimoto, and K. Nakanishi. 1999. A2E, a lipofuscin fluorophore, in human retinal pigmented epithelial cells in culture. Invest. Ophthalmol. Vis. Sci. 40:2988–2995. [PubMed] [Google Scholar]
- Suter, M., C. Reme, C. Grimm, A. Wenzel, M. Jaattela, P. Esser, N. Kociok, M. Leist, and C. Richter. 2000. Age-related macular degeneration. The lipofusion component N-retinyl-N-retinylidene ethanolamine detaches proapoptotic proteins from mitochondria and induces apoptosis in mammalian retinal pigment epithelial cells. J. Biol. Chem. 275:39625–39630. [DOI] [PubMed] [Google Scholar]
- Wassell, J., S. Davies, W. Bardsley, and M. Boulton. 1999. The photoreactivity of the retinal age pigment lipofuscin. J. Biol. Chem. 274:23828–23832. [DOI] [PubMed] [Google Scholar]
- Wilschut, J., N. Duzgunes, F. Robert, and D. Papahadjopoulos. 1980. Studies on the mechanism of membrane fusion: role of phosphate in promoting calcium ion induced fusion of phospholipid vesicles. Biochemistry. 19:6021–6029. [DOI] [PubMed] [Google Scholar]