

Abstract
NHE3, the apical isoform of the Na+/H+ exchanger, is central to the absorption of salt and water across the intestinal epithelium. We report that treatment of epithelial cells with toxin B of Clostridium difficile, a diarrheal pathogen, causes a pronounced inhibition of NHE3 activity, with little effect on the basolateral NHE1 isoform. Depression of NHE3 activity is accompanied by the translocation of apical exchangers to a subapical endomembrane compartment. Treatment of cells with toxin B increased the fraction of exchangers that were solubilized by nonionic detergents and induced dephosphorylation and extensive redistribution of ezrin. The Rho-kinase inhibitor, Y-27632, also altered the distribution and activity of NHE3. We suggest that inactivation of Rho-family GTPases by clostridial toxin B alters the interaction between NHE3 and the microvillar cytoskeleton, possibly by impairing the ability of ezrin to bridge the exchangers to filamentous actin. Detachment of NHE3 from the actin skeleton would facilitate its internalization, resulting in net disappearance from the apical surface. The consequent inhibition of transport is likely to contribute to the diarrheal effects of C. difficile.
Keywords: Na/H exchange, antiport, pH regulation, Rho, ezrin
INTRODUCTION
The Na+/H+ exchanger (NHE) family consists of eight identified members (NHE1–8). All NHE isoforms are integral membrane proteins that catalyze the electroneutral exchange of alkali cations for H+ and are sensitive to inhibition by amiloride derivatives, albeit to varying degrees (for reviews see Orlowski and Grinstein, 1997; Wakabayashi et al., 1997). While some of the isoforms, like NHE1 and NHE6–8, are ubiquitously distributed, others are expressed only in selected tissues. The subcellular distribution of the isoforms varies as well; although NHE1 is exclusively plasmalemmal, other isoforms, e.g., NHE6–7, are found predominantly in endomembrane organelles. This diverging pattern of distribution suggests that the individual isoforms are engaged in different physiological processes.
NHE3 is expressed in the apical membrane and in subapical endosomes of polarized epithelial cells (Biemesderfer et al., 1993). In the intestine, NHE3 is thought to play a critical role in Na+ absorption and fluid homeostasis. Indeed, agents like cAMP and γ-interferon that inhibit the activity (Weinman et al., 1987; Cano et al., 1993) or reduce the expression of NHE3 (Rocha et al., 2001), respectively, cause diarrhea. Moreover, NHE3 expression was found to be severely depressed in congenital disorders characterized by secretory diarrhea, such as microvillus inclusion disease (Ameen and Salas, 2000). Lastly, and most conclusively, deletion of NHE3 by gene targeting produces diarrhea in mice, despite compensatory increases in other Na+ resorptive systems (Schultheis et al., 1998).
Clostridium difficile is the leading cause of nosocomial enteric infections. In North America alone, over three million people are infected yearly by C. difficile and a large fraction of these suffer from acute diarrhea (for reviews see Kelly and LaMont, 1998; Mylonakis et al., 2001). Despite the prevalence and severity of the infection—3% of the patients undergo fulminant colitis (Kelly and LaMont, 1998)—the mechanism of action of C. difficile is incompletely understood. The bacterium is not invasive and its effects have been attributed largely to two exotoxins: C. difficile toxins A and B (Pothoulakis and Lamont, 2001). These structurally related proteins have a similar receptor-binding domain at their COOH terminus, whereas the catalytically active domain responsible for toxicity resides at the NH2 terminus. Both C. difficile toxins A and B catalyze the glucosylation of a threonine residue on Rho-family GTPases, rendering them inactive (Just et al., 1995a,b). How inhibition of these GTPases relates to colitis and diarrhea, however, has not been resolved.
Since Rho GTPases have been invoked in the regulation of NHE isoforms (Hooley et al., 1996; Tominaga and Barber, 1998; Szaszi et al., 2000), and because NHE3 is intimately involved in the regulation of Na+ and fluid homeostasis in the gastrointestinal tract, we considered the possibility that infection by C. difficile may directly alter the function of this isoform, perhaps contributing to diarrhea. To this end, we tested the effects of C. difficile toxin B (referred to hereafter as TxB) on NHE3 in cultured epithelia. Spectroscopic measurements of cytosolic pH were used to assess NHE activity, while cells stably transfected with epitope-tagged NHE3 were used to visualize the subcellular distribution of the antiporters. Our results revealed that TxB severely depresses Na+/H+ exchange across the apical membrane, due primarily to relocation of NHE3 to an intracellular compartment.
MATERIALS AND METHODS
Materials and Solutions
Nigericin, the acetoxymethyl ester of 2′,7′-bis(carboxyethyl)-5(6)-carboxyfluorescein (BCECF), 1,1′-dioctadecyl-3,3,3′,3′-tetramethylindocarbocyanine perchlorate (DiIC18(3)), Alexa 488–conjugated phalloidin, Alexa 488–conjugated goat anti–mouse antibody, rhodamine-conjugated transferrin, and rhodamine 123 were obtained from Molecular Probes, Inc. C. difficile toxin B (TxB) was from TechLab. Y-27632 was from Calbiochem. Rhodamine-dextran and antiactin antibody were from Sigma-Aldrich. Mouse antihemagglutinin (HA) antibody was from BabCo. Anti–ZO-1 antibody was from Zymed. 125I-labeled sheep IgG was from Amersham Sciences. Cy3-conjugated secondary antibody was from Jackson ImmunoResearch Laboratories, Inc. Goat anti-EEA1 antibody (N19) was from Santa Cruz Biotechnology, Inc. Polyclonal antibodies to ezrin were generated as described earlier (Bretscher, 1989) and used for immunofluorescence at a 1:50 dilution. For Western blotting a monoclonal anti-ezrin from Covance was used (1:1,000 dilution). The antiphospho-ezrin/radixin/moesin (antiphospho-ezrin [Thr567]/radixin [Thr 564]/moesin [Thr 558], referred to hereafter as phospho-ERM) antibody was from Cell Signaling (1:1,000 dilution for immunoblotting and 1:100 dilution for immunofluorescence). Isotonic Na+ medium contained (mM) 140 mM NaCl, 3 mM KCl, 1 mM MgCl2, 1 mM CaCl2, and 20 mM HEPES (pH adjusted to 7.4 with Tris). Isotonic K+-rich medium had the same composition as Na+-rich medium, except that NaCl was replaced by KCl.
Cells
LLC-PK1, BeWo, and OK cells were obtained from the American Type Culture Collection. For surface detection, extraction, and immunoblotting of NHE3, LLC-PK1 cells were stably transfected with wild-type NHE3 containing three tandem copies of the influenza virus HA epitope (YPYDVPDYAS) in the first extracellular loop (between Arg 38 and Phe 39), as described previously (Kurashima et al., 1998). For selection of stable lines, cells were cotransfected with the pCMV plasmid (which contains the aminoglycoside phosphotransferase gene that confers resistance to G418), cloned by limiting dilution in the presence of 500 μg/ml G418, and screened by immunofluorescence for expression of HA-tagged NHE3 (NHE3′38HA3). OK cells were maintained in 1:1 Dulbecco's modified Eagle's medium/nutrient mixture F-12 with 10% FBS in an atmosphere containing 5% CO2. LLC-PK1 cells were kept in the same medium with 500 μg/ml G418. BeWo cells were maintained in Ham's F12 with 10% FBS. Where indicated, LLC-PK1 cells were grown on Costar Transwell inserts (0.4 μm pore size; Corning, Inc.) in 12-well culture plates. Experiments were performed 5 d after the monolayer had reached confluence.
Measurement of Na+/H+ Exchanger Activity
NHE activity was assessed as the rate of Na+-induced intracellular pH (pHi) recovery after an acid load, imposed by prepulsing the cells with NH4Cl. Dual excitation ratio determinations of the fluorescence of BCECF were used to measure pHi in small populations of cells with a Nikon Diaphot TMD inverted microscope coupled to the M Series dual wavelength illumination and recording system from Photon Technologies, Inc., as detailed earlier (Kapus et al., 1994). Briefly, cells grown to confluence on 25-mm glass coverslips were placed into Attofluor cell chambers and mounted on the stage of the microscope. Next they were loaded with 2 μg/ml BCECF acetoxymethyl ester and prepulsed with 40 mM NH4Cl in HEPES-buffered RPMI at 37°C for 10 min for subsequent acid loading (Roos and Boron, 1981). Extracellular dye and NH4Cl were then washed away with Na+-free solution and Na+/H+ exchange was initiated by reintroduction of extracellular Na+. For LLC-PK1 cells, dye leakage was minimized by loading at room temperature. The Na+-induced pHi recovery was monitored under continuous perfusion (≈1.0 ml/min) using a gravity-driven system, as described previously (Hayashi et al., 2002). Where indicated, 100 μM amiloride was added to the perfusate to inhibit NHE1. pHi was calibrated by equilibrating the cells with K+-rich media titrated to defined pH values and containing 10 μg/ml nigericin (Thomas et al., 1979).
Immunofluorescence
For immunostaining, LLC-PK1 cells stably expressing NHE3′38HA3 were plated onto glass coverslips and grown to confluence. For surface staining, the cells were rinsed with PBS and incubated with anti-HA monoclonal antibody (1:1,000 dilution) on ice for 45 min in HEPES-buffered RPMI. After washing with ice-cold PBS, cells were fixed for 20 min with 4% paraformaldehyde (PFA) in PBS. All subsequent steps were at room temperature. The cells were next washed with PBS, incubated with 100 mM glycine in PBS for 10 min and incubated with secondary antibody. To label the total cellular pool of NHE3, cells were first fixed as above, then permeabilized with 0.1% Triton X-100 and blocked with 5% milk in PBS for 30 min, before incubation with the primary and secondary antibodies. Where indicated, both surface and total NHE3 were labeled in the same samples by performing the procedures outlined above sequentially (i.e., labeling the surface NHE3 before permeabilization and relabeling) and using two different secondary antibodies (e.g. Alexa 488–conjugated goat anti–mouse and Cy3-conjugated donkey anti–mouse; both 1:1,000 dilution) to label the surface and total pools, respectively. After final washes, the samples were mounted onto glass slides using Dako medium (Dako Corp.). Cells grown on porous membranes were immunostained while on the Transwell inserts. The filter was then cut out of the insert using a small scalpel blade and mounted between a slide and a coverslip using DAKO mounting medium on both sides.
To identify the compartment where surface NHE3 relocates upon treatment with TxB, cells were first incubated with anti-HA monoclonal antibody (1:1,000) on ice for 45 min and then treated with the toxin, as indicated. The cells were then fixed, permeabilized, and labeled with organelle-specific antibodies, followed by the appropriate secondary antibodies. Early endosomes were identified using goat anti-EEA1 antibody (1:50) (Gaullier et al., 1999). Recycling endosomes were labeled by incubating the cells with 30 μg/ml rhodamine-conjugated transferrin during the last hour of incubation with TxB (Mukherjee et al., 1997, 1999). Late endosomes/lysosomes and the plasma membrane were labeled and visualized in live cells (Mukherjee et al., 1999). The plasmalemma was labeled by incubating the cells with 1 μM 1,1′-dioctadecyl-3,3,3′,3′-tetramethylindocarbocyanine for 10 min before NHE3 labeling and toxin treatment. Late endosomes/lysosomes were labeled by pulsing overnight with 500 μg/ml FITC-conjugated dextran, followed by a labeling of surface NHE3 and addition of TxB for 3 h. In these experiments, the secondary antibody used to detect NHE3 was also added in the cold before toxin treatment. For F-actin staining, cells were washed, fixed, and permeabilized as above, and then incubated with Alexa 488–labeled phalloidin (1:1,000 dilution) for 45 min. After additional washing, the coverslips were mounted on slides.
Cells were visualized by either laser confocal microscopy or deconvolution microscopy. The latter was accomplished using the 100× objective of a Leica DM-IRE2 fluorescence microscope equipped with cooled CCD camera (ORCA-ER), operated from a Macintosh computer using Openlab (Improvision) software. Optical sections of 0.2–0.5 μm (10–20 per cell) were obtained and the images were subjected to deconvolution using Openlab software. Confocal microscopy was performed with a ZEISS LSM510 system.
Disruption and Visualization of Tight Junctions
To disrupt tight junctions, LLC-PK1 cells stably expressing NHE3′38HA3 were incubated in culture medium devoid of added Ca2+ for the indicated period (Vega-Salas et al., 1987). After verifying the effectiveness of the treatment by differential interference contrast (DIC) microscopy (e.g., Fig. 3), the cells were subjected to immunostaining or quantitative assessment of surface NHE3 using radiolabeled antibodies. Alternatively, they were fixed and permeabilized as above, and incubated with anti–ZO-1 antibody (1:200 in PBS for 1 h at room temperature) followed by Cy-3–conjugated secondary antibody.
Figure 3.
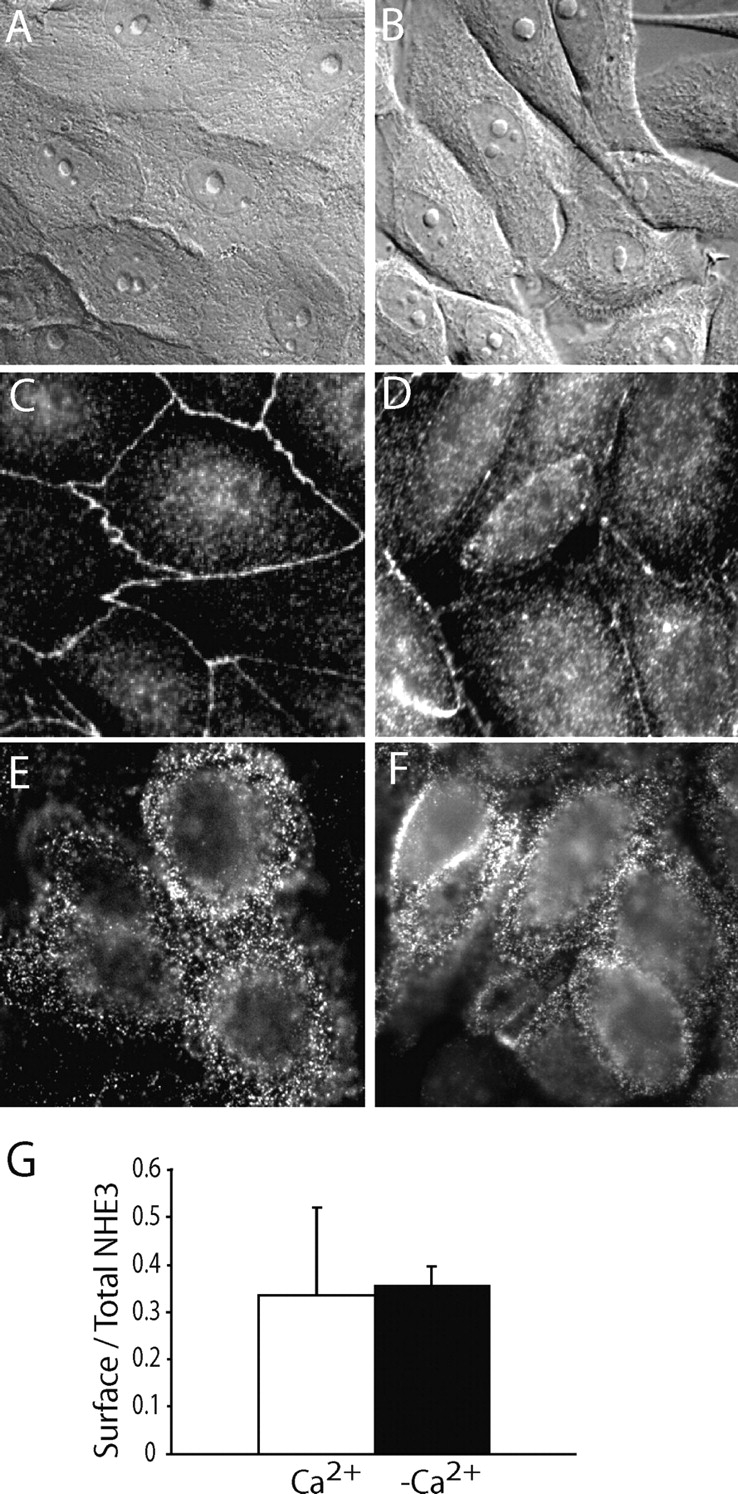
Effect of tight junction disruption on the distribution of NHE3. Confluent LLC-PK1 cells stably expressing NHE3′38HA3 were incubated in either Ca2+-containing (A, C, and E) or Ca2+-free solution (B, D, and F). The cells were then visualized by differential interference contrast (DIC) microscopy (A and B), or fixed and stained for ZO-1 (C and D) or for surface NHE3 (E and F), as described under materials and methods. Images are representative of at least three experiments of each type. (G) Quantification of surface NHE3 in cells preincubated in the presence (+Ca2+) or absence (−Ca2+) of extracellular calcium, using anti-HA primary and 125I-labeled secondary antibody as in Fig. 2. Data are means ± SE of four determinations from two experiments.
Quantification of Surface NHE3
To quantify surface NHE3 expression, LLC-PK1 cells stably expressing NHE3′38HA3 were plated onto six-well plates and grown to confluence. After the specified treatment, the cells were washed with cold PBS, preblocked with 5% sheep serum in PBS for 30 min on ice, and then incubated for 45 min on ice with anti-HA antibody (1:500 to 1:1,000) in HEPES-buffered RPMI medium supplemented with 5% sheep serum. After washing four times to remove unbound antibody, the cells were incubated with 125I-labeled sheep anti–mouse IgG (0.3–0.5 μCi/well) in medium with 10% sheep serum on ice. After 60 min, cells were washed four more times with PBS to remove unbound radioactivity. The bound radiolabeled antibodies were eluted with 1 ml of either 2 M formic acid or 1% SDS, and radioactivity was counted using a gamma-counter (1282 CompuGamma; Amersham Biosciences). Nonspecific binding of the radiolabeled antibodies, assessed by omitting the primary antibody, was subtracted. To determine total NHE3 content the cells were first fixed, permeabilized with 0.1% Triton, and then labeled as above.
Detergent Extraction and Immunoblotting
The detergent solubility of NHE3 was assessed in transfected LLC-PK′-ΝΗΕ3′38HA3 cells cultured in 35-mm dishes and grown to confluence. After the indicated treatment, cells were rinsed twice with cold medium and extracted with 1 ml of ice-cold lysis buffer containing 150 mM NaCl, 25 mM HEPES, 25 mM MES, 0.5 mM EGTA, 8% protease inhibitor mixture (Complete; Roche Molecular Biochemicals), 2 mM pepstatin A, and 0.1% Triton X-100, pH = 7.4. After swirling on ice for 6 min on an orbital shaker (∼0.5 revolutions/s), the supernatant was removed and saved. The adherent material was washed with cold PBS and scraped off with a rubber policeman into 1 ml of PBS containing 0.1% SDS, 8% protease inhibitor mixture, and 2 mM pepstatin A. Protein concentration was measured by the method of Ghosh et al. (1988), spotting samples on a filter and quantified by densitometry. After addition of 5×-concentrated Laemmli sample buffer, samples were subjected to SDS-PAGE and transferred onto nitrocellulose filters. Blots were blocked with 5% milk and exposed to primary antibody, followed by horseradish peroxidase–conjugated secondary antibody. Immunoreactive bands were visualized using enhanced chemiluminescence (ECL; Amersham Biosciences) and quantified by densitometry.
To detect phospho-ERM by immunoblotting cells were rinsed with PBS and lysed using a buffer containing 150 mM NaCl, 25 mM HEPES, 0.5 mM EGTA, 8% protease inhibitor mixture (Complete, Roche Molecular Biochemicals), 2 mM pepstatin A, and 1% Triton X-100, pH 7.4. The lysates were used for protein determination and diluted with twice-concentrated Laemmli sample buffer. Samples were next subjected to SDS-PAGE and transferred onto nitrocellulose filters. Blots were blocked with 2% bovine serum albumin in PBS for 1 h, followed by incubation with anti-phospho-ERM (1:1,000) in 0.2% BSA-PBS overnight at 4°C. After extensive washes, blots were incubated with horseradish peroxidase–conjugated secondary antibody and developed using enhanced chemiluminescence. The blots were stripped and reprobed using antiezrin antibody.
Distribution of Phosphatidylinositol 4,5-bisphosphate (PI(4,5,)P2)
To measure the subcellular distribution of PI(4,5,)P2, LLC-PK1 or OK cells were transfected with pEGFP::PLCδPH (Stauffer et al., 1998) essentially as described (Botelho et al., 2000). After 24–48 h, the cells were mounted on a Leiden chamber and visualized live by confocal microscopy before and after treatment with TxB.
Statistical Analysis
Experimental values are given as the means ± SE of the indicated number of determinations. Significance of differences was assessed using Student's t test.
Online Supplemental Material
Additional experiments are illustrated in two figures available on line (http://www.jgp.org/cgi/content/full/jgp.200308979/DC1) as supplemental material. The methods used for these experiments were similar to those detailed above.
RESULTS
C. difficile Toxin B (TxB) Inhibits Apical NHE3 Activity
To assess the effect of TxB on NHE3, we initially selected the OK epithelial cell line. Unlike most other epithelial lines available, OK cells exclusively express NHE3 (Helmle-Kolb et al., 1990, 1993), greatly simplifying the analysis and interpretation of the data. It is noteworthy that NHE3 distribution and function is thought to be identical in renal and intestinal epithelial cells (Yun et al., 1995). Despite its comparatively large size (270 kD), TxB is capable of entering most mammalian cells, albeit slowly. Fig. 1 illustrates that OK cells are similarly susceptible to the toxin, which altered their F-actin staining pattern. Note that the well-defined stress fibers normally observed at the base of untreated OK cells (Fig. 1 A) are largely eliminated by treatment with TxB (1 μg/ml for 4–6 h; Fig. 1 C). The submembranous actin that lines the junctions between normal cells (Fig. 1 B) is also disrupted by TxB, though the apical microvilli are partially preserved (Fig. 1 D). These changes are similar to those exerted by the toxin in a variety of intestinal and renal cell lines (Hecht et al., 1992; Klussmann et al., 2001).
Figure 1.
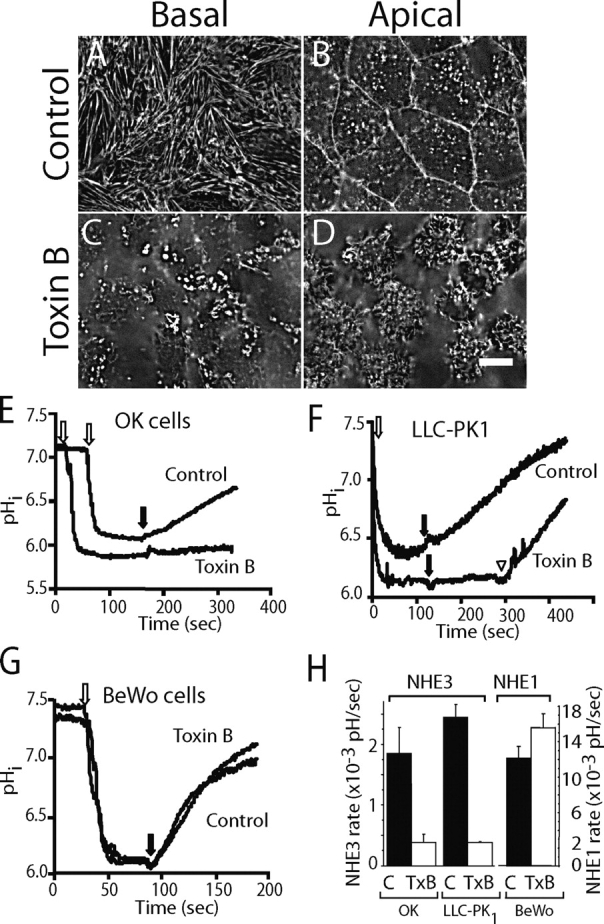
Effect of C. difficile Toxin B (TxB) on actin structure and NHE activity. (A–D) OK cells grown on coverslips were left untreated (A and B) or were treated with 1 μg/ml TxB for 4–6 h (C and D) before fixation. The cells were permeabilized and F-actin visualized using Alexa 488–labeled phalloidin. (A and C) Basal focal plane. (B and D) Apical focal plane. Bar, 10 μm. (E–G) Measurements of intracellular pH (pHi). OK (E), LLC-PK1 (F), and BeWo (G) cells grown on coverslips were loaded with BCECF and NH4Cl as described under materials and methods. Where indicated by the open arrow, acid loading was accomplished by removal of extracellular NH4 using a Na+-free solution. Physiological Na+-containing solution was reintroduced where noted by the black arrows. In F, 100 μM amiloride was present throughout, but was removed from the lower trace where noted by the arrowhead. Where specified, the cells were pretreated with TxB for 4–6 h. pHi was monitored fluorimetrically and calibrated as detailed in materials and methods. (H) Quantification of the rate of NHE3 (left ordinate) and NHE1 (right ordinate) activity. Data for the indicated control or TxB-treated cell types was obtained from experiments like those in E–G. Data are means ± SE of at least four experiments of each kind.
The effect of TxB on NHE3 activity was studied next. Na+/H+ exchange was measured as the rate of Na+-induced recovery of cytosolic pH (pHi) from an acid load. As shown in Fig. 1 E, while the ability of an ammonium prepulse to acidify the cytosol was unaffected, the rate of recovery elicited by reintroduction of Na+ to the medium was greatly diminished by treatment with the toxin. In four experiments, the activity of NHE3 decreased from 0.15 ± 0.01 to 0.02 ± 0.001 pH/min upon treatment with TxB (Fig. 1 H). There was no discernible effect of TxB on the buffering power of the cells. The effect of TxB on NHE3 activity is not unique to OK cells, since a similar disruption of the actin skeleton (Fig. S1) and a comparable inhibition of transport were observed in LLC-PK1 cells (Fig. 1 F). Because these cells express a robust NHE1 activity on their basolateral membranes, the measurements of NHE3 were performed in the presence of 100 μM amiloride. This concentration of the drug virtually eliminates NHE1 activity, while inhibiting NHE3 only marginally (Orlowski, 1993). As in OK cells, TxB markedly depressed NHE3 function (Fig. 1, F and H). It is noteworthy that when amiloride was removed from LLC-PK1 cells treated with TxB, substantial Na+/H+ exchange activity was restored (Fig. 1 F, open arrowhead), suggesting that, unlike NHE3, NHE1 was resistant to the toxin. Accordingly, we found that Na+/H+ exchange in nonepithelial (CHO) cells expressing only NHE1 was unaffected by TxB (not depicted).
While these observations suggest that TxB affects NHE3 but not NHE1, these isoforms are expressed on different membranes of epithelial cells. Thus, it is conceivable that TxB alters differentially the apical versus the basolateral membrane, rather than selectively targeting individual NHE isoforms. This possibility was tested by studying BeWo cells, which are derived from the placenta, an atypical epithelium where NHE1 is located apically (Silva et al., 1997). Treatment of BeWo cells with TxB induced gross alterations of F-actin resembling those seen in OK and LLC-PK1 cells (Fig. S1), confirming the effectiveness of the toxin in the placental cells. However, as shown in Fig. 1, G–H, TxB had no discernible effect on Na+/H+ exchange activity in BeWo cells, which was virtually eliminated by 10 μM HOE694 (unpublished data), confirming mediation by NHE1. Jointly, these observations imply that TxB selectively inhibits NHE3, having little or no effect on NHE1, regardless of the membrane where they reside.
Metabolic Depletion Cannot Account for NHE3 Inhibition by TxB
Long exposures to C. difficile toxin A can cause damage to mitochondria and thereby induce a decrease in cellular ATP content (He et al., 2000). Because optimal NHE3 activity is dependent on the presence of normal levels of ATP (Kapus et al., 1994; Cabado et al., 1996), TxB may have altered the activity of the exchanger indirectly, through metabolic depletion. We therefore assessed the mitochondrial status of cells treated with TxB using rhodamine 123, a lipid-soluble cationic dye often used to monitor the electrical potential across the mitochondrial inner membrane (Scaduto and Grotyohann, 1999). Incubation of OK cells with TxB for 3 h, which suffices to produce a marked inhibition of NHE3, had no discernible effect on the accumulation of rhodamine 123 by mitochondria (unpublished data), arguing against metabolic depletion by uncoupling. Accordingly, the activity of NHE1, which is similarly dependent on ATP (Kapus et al., 1994), was unaffected by TxB, as detailed above. Hence, metabolic depletion cannot account for the inhibition of NHE3 by TxB.
Toxin B Decreases the Density of NHE3 at the Cell Surface
NHE3 activity at the membrane can in principle decline by one of two mechanisms: a decrease in the intrinsic activity of the exchangers or a drop in their number at the membrane. Indeed, NHE3 has been shown to undergo continuous recycling between the plasma membrane and a subcellular vesicular pool (Biemesderfer et al., 1997; D'Souza et al., 1998; Janecki et al., 1998) and redistribution between these pools was suggested to contribute to the regulation of exchange activity (Janecki et al., 1998; Collazo et al., 2000; Hu et al., 2001). We therefore investigated next the effect of TxB on the subcellular distribution of NHE3. To this end we used LLC-PK1 cells stably expressing an epitope-tagged form of NHE3 (NHE3′38HA3). In this construct, the epitope was placed on the first extracellular loop of NHE3 to enable detection of surface-exposed exchangers in intact cells. We developed an immunofluorescence staining protocol that allowed us to separately visualize the plasmalemmal and total (surface plus intracellular) pools of NHE3 in the same cells (see materials and methods for details). Typical results are shown in Fig. 2 . In otherwise untreated cells, a sizable fraction of the NHE3 resides at the cell surface, where it distributes in a punctate pattern reminiscent of microvilli (Fig. 2, A and D). Remarkably, treatment with TxB reduced drastically the plasmalemmal staining of NHE3 (Fig. 2 B). This was not due to degradation of the exchangers, since immunoblotting of lysates of control and TxB-treated cells revealed no significant differences in the total NHE3 content (Fig. 2 F; in four experiments NHE3 density in TxB-treated cells was 126 ± 16% of control). Instead, we believe that disappearance of NHE3 from the surface is attributable to its internalization into endomembrane compartments that are not accessed by externally added antibody. Accordingly, permeabilization of the cells before immunostaining unmasked NHE3, yielding a total staining that was similar to that of control cells (Fig. 2 E). Similar results were obtained whether the cells were grown on glass coverslips (Fig. 2, A–E) or on permeable Transwell filters that favor the epithelial differentiation of the cells (shown as x vs. z scans in Fig. 2, A′–E′). It is noteworthy that the small fraction of exchangers that remained in the membrane after treatment with the toxin were not limited to the apical membrane, but were visualized throughout the cell periphery (Fig. 2 B′), This is the likely consequence of junctional opening and/or increased mobility of NHE3 caused by TxB.
Figure 2.
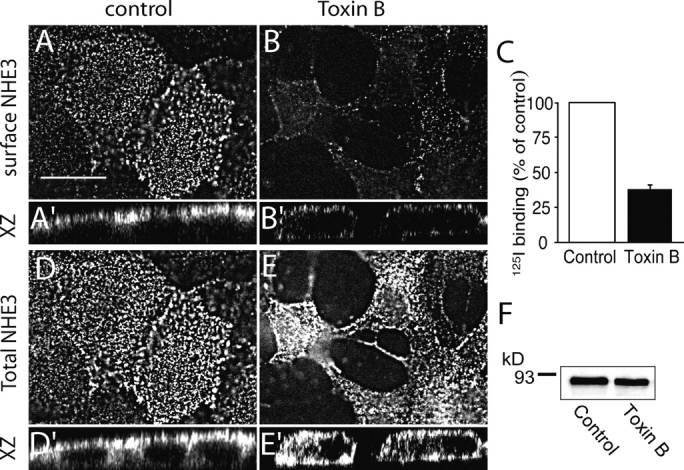
Effect of TxB on the subcellular distribution of NHE3. Confluent LLC-PK1 cells stably expressing NHE3′38HA3 were either left untreated (control), or treated with TxB. (A and B) Top (x/y axis) view of cells grown on coverslips, immunostained for surface NHE3 (exofacial epitope in intact cells). (A′ and B′) perpendicular (z axis) sections of control (A′) and toxin-treated (B′) cells grown on permeable Transwell filters and stained for surface NHE3 as in A and B. (D and E) Top (x/y axis) view of cells grown on coverslips, immunostained for total NHE3 (permeabilized cells). (D′ and E′) Perpendicular (z axis) sections of control (D′) and toxin-treated (E′) cells grown on permeable Transwell filters and stained for total NHE3 as in D and E. Representative of 4–8 similar experiments of each type. Bar, 15 μm. (C) Quantification of surface NHE3 in control and TxB-treated cells. The density of surface exchangers was measured by radiolabeling using anti-HA primary and 125I-labeled secondary antibodies, as detailed in materials and methods, and is expressed relative to controls. Data are means ± SE of six determinations from two experiments, each with duplicate determinations. (F) Detection of total NHE3 content by immunoblotting. The cells were treated with or without TxB, as above and whole-cell lysates were solubilized in Laemmli sample buffer and used for SDS-PAGE and immunoblotting using anti-HA antibodies. Immunoreactive bands were visualized by enhanced chemiluminescence and the radiogram shown is representative of three similar experiments.
A more precise quantitation of the effect of TxB on the surface density of NHE3 was obtained using radiolabeling. For these experiments, the treatment with the toxin was shortened to 2 h, to avoid detachment of the cells from the wells during the repeated media changes required for labeling and washing. Even under these conditions, TxB reduced the surface density of NHE3 by nearly 70% (Fig. 2 C). Jointly, these experiments indicate that TxB-mediated inactivation of Rho GTPases results in a net translocation of plasmalemmal NHE3 to the cell interior, with consequent inhibition of transmembrane Na+/H+ exchange.
We attempted to identify the intracellular compartment where NHE3 is diverted upon treatment of epithelial cells with TxB. To this end, cells treated with the toxin were dual labeled for NHE3 and for well established markers of intracellular organelles (Mukherjee et al., 1997; Raiborg and Stenmark, 2002). Sorting endosomes were identified using EEA1 antibodies, recycling endosomes by prelabeling with transferrin and late endosomes/lysosomes by loading with fluorescent dextran with a defined pulse-chase protocol. Neither one of these compartments coincided with the endomembrane vesicles containing NHE3 (not depicted; see Fig. S2). We conclude that NHE3 translocates to a distinct compartment, possibly specialized subapical endosomes.
Internalization of NHE3 Is Not Due to Disruption of Tight Junctions
Disruption of the tight junctions in some epithelial lines leads to invagination of the apical membrane with formation of a large vacuole (Vega-Salas et al., 1987). Treatment of OK and LLC-PK1 cells with TxB eliminated the perijunctional actin ring (Figs. 1 and 2) and can result in disruption of the junctions (Fig. 2), as had been reported earlier for intestinal cells (Hecht et al., 1992). It was therefore conceivable that internalization of NHE3 was secondary to the opening of tight junctions caused by TxB. This possibility was tested in LLC-PK1 cells by disrupting the junctions using the same Ca2+-depletion protocol reported to generate apical vacuoles in MDCK cells (Vega-Salas et al., 1987). Removal of extracellular Ca2+ for 4–6 h effectively opened the junctional complexes. This was apparent from perusal of the cells by DIC microscopy (Fig. 3, A and B) and was more directly confirmed by staining the cells with antibodies to ZO-1, a component of the junctional complex (Fig. 3, C and D). Having ascertained the effectiveness of the Ca2+ removal protocol, we proceeded to visualize plasmalemmal NHE3 by immunostaining. As shown in Fig. 3 F, NHE3 persisted on the plasma membrane of the cells exposed to Ca2+-free medium, despite extensive opening of the junctions. This was established more quantitatively using the radiolabeling procedure detailed above. In two separate experiments, each performed in duplicate, we found no difference in the surface density of NHE3 between cells with intact and disrupted junctions (Fig. 3 G). These findings imply that the TxB-induced internalization of NHE3 is not merely a consequence of tight junctional opening. Accordingly, the morphology of the endomembrane compartment where NHE3 relocalizes in TxB-treated cells is clearly distinct from that described for the vacuolar apical compartment induced by omission of Ca2+ (Vega-Salas et al., 1987).
Role of Cytoskeletal Interactions in the Retention of NHE3 at the Plasma Membrane
Rho family GTPases, the targets of clostridial toxins, are central to the organization of the actin cytoskeleton. It is therefore reasonable to suspect that alterations in the cytoskeletal anchorage of NHE3 may mediate its internalization after treatment with TxB. Accordingly, we find that in untreated cells, extraction with 0.1% Triton X-100 solubilizes only 24% of the antiporters, as assessed by immunoblotting and densitometry (Fig. 4) . It is noteworthy that the high concentration of Triton X-100 used is expected to solubilize lipid rafts (Brown and Rose, 1992), making them an unlikely mechanism for retention of NHE3 in the pellet. Instead, over half of the antiporters are likely anchored to the detergent-insoluble actin skeleton.
Figure 4.

Effect of TxB on the detergent extractability of NHE3. Confluent LLC-PK1 cells stably expressing NHE3′38HA3 were either left untreated or incubated with TxB as above. After rinsing, the cells were extracted with 1 ml of ice-cold lysis buffer containing 0.1% Triton X-100 for 6 min, as described under materials and methods. The supernatant was removed and saved. The detergent-insoluble fraction remaining on the plate was washed with cold PBS and scraped off with a rubber policeman into 1 ml of 0.1% SDS in PBS. Equal amounts of protein from the soluble and insoluble fractions were subjected to SDS-PAGE, transferred onto nitrocellulose filters and blotted with anti-HA or antiactin antibodies. Immunoreactive bands were visualized by enhanced chemiluminescence and quantified by densitometric scanning. Data are expressed as percent of total and are means ± SE of at least three separate experiments.
Importantly, the fraction of detergent-soluble NHE3 increased greatly (to 61%) when the cells were pretreated with TxB (Fig. 4). This was not attributable to generalized cell disruption, since the total amount of protein solubilized by Triton X-100 increased modestly (from 44% to 57%) after treatment with TxB. Of note, the fraction of soluble actin, assessed by immunoblotting, increased very little with TxB, from 56% to 63% (Fig. 4). Therefore, under the conditions used, the change in cellular F-actin content is subtle and wholesale solubilization cannot account for the prominent changes in NHE3 solubility. We propose instead that Rho-family proteins control the mode of attachment of NHE3 to a relatively stable cytoskeletal structure, possibly microvillar actin filaments.
NHE3 Colocalizes with Ezrin in the Apical Membrane in a TxB-sensitive Manner
NHE3 has been shown to interact with NHERF-1/EBP50, an ezrin-binding protein (Shenolikar and Weinman, 2001). In addition, NHE1 was found to associate directly with ezrin (Tominaga and Barber, 1998), raising the possibility that NHE3 may behave similarly. Because it is well established that actin binds to the COOH terminus of ezrin, the latter may represent (part of) the linkage between NHE3 and the cytoskeleton, and therefore the possible target of TxB. To test this possibility, we compared the localization of plasmalemmal NHE3 to that of ezrin in control and TxB-treated cells. As shown in Fig. 5, A–C , there is a substantial overlap in the distribution of the two proteins in control cells, though the colocalization is not perfect. Quantitative analysis of the degree of colocalization in multiple samples using the Improvision Openlab software yielded an average Pearson coefficient of 0.506, which is highly significant (P < 0.01). The pool of surface NHE3 colocalizes with ezrin better than the total NHE3, as shown in Fig. 5, G–I. This implies that the intracellular pool of NHE3 is not as closely associated with ezrin as the superficial pool.
Figure 5.
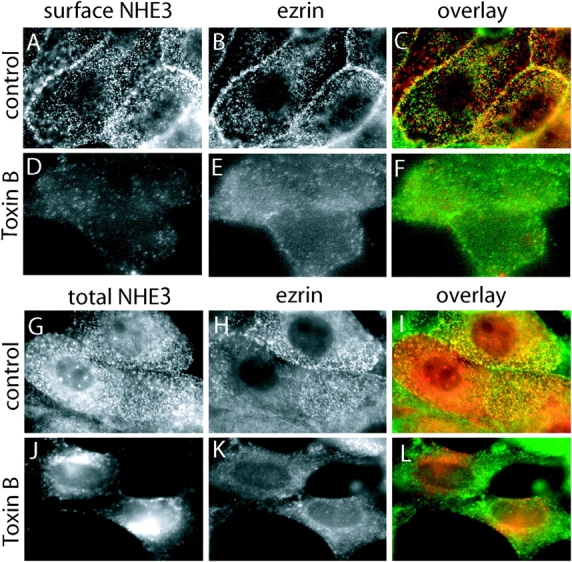
Effect of toxin B on the distribution of NHE3 and ezrin. Confluent LLC-PK1 cells stably expressing NHE3′38HA3 were incubated without (A–C; G–I) or with 2 μg/ml TxB (D–F; J–L) for 3 h at 37°C, respectively. (A–F) After treatment, but before fixation, surface NHE3 was stained with antibodies to HA followed by Cy-3–labeled anti–mouse secondary antibodies, as in Fig. 2. The cells were then fixed, permeabilized, and incubated with antibodies to ezrin (1:100) followed by Alexa 488–coupled secondary antibodies. (G–L) After treatment the cells were fixed, permeabilized, and total NHE3 and ezrin were stained using the antibodies listed above. NHE3 staining is shown in A, D, G, and J and ezrin staining is shown in B, E, H, and K, overlays of the two stains are shown in C, F, I, and L (NHE3 in red; ezrin in green). Images are representative of at least four experiments of each type.
Treatment of TxB, which as before promoted disappearance of plasmalemmal NHE3 (Fig. 5 D), grossly altered the distribution of ezrin (Fig. 5 E). In cells exposed to the toxin, ezrin appeared more diffuse and no longer accumulated on microvillar structures. As a result, the correlation between total NHE3 and ezrin decreased further (Fig. 5 F). These findings are consistent with the notion that TxB may induce the disappearance of NHE3 from the surface membrane by releasing its anchorage to the actin skeleton, which would involve ezrin.
Toxin B Treatment Decreases Membrane-bound PI(4,5,)P2 and Ezrin Phosphorylation
Targeting and stabilization of ezrin at the plasma membrane are promoted by its association with phosphoinositides (Yonemura et al., 2002) and by phosphorylation of its COOH-terminal threonine (Thr 567) (Matsui et al., 1998). Therefore, the displacement of ezrin from the apical membrane induced by TxB may have resulted from dephosphorylation of the phospho-threonine residues and/or from depletion of plasmalemmal PI(4,5,)P2. These alternative mechanisms were considered experimentally. Possible effects of the toxin on PI(4,5,)P2 were evaluated using a chimeric construct consisting of the PH domain of phospholipase Cδ and green fluorescent protein (GFP). In otherwise untreated cells this construct localizes preferentially to the plasma membrane, where most of the PI(4,5,)P2 is known to reside (e.g., Stauffer et al., 1998; Botelho et al., 2000). Similar observations were made in both LLC-PK1 cells (Fig. 6 A) and in OK cells (unpublished data). After treatment with TxB, however, the plasmalemmal accumulation was markedly decreased (Fig. 6 B), indicating that the phosphoinositide had been depleted from the membrane. Similar observations were made in LLC-PK1, OK, and HeLa cells. These findings are consistent with the proposed role of Rho-family GTPases in the control of phosphatidylinositol 4-phosphate 5-kinase activity (Doughman et al., 2003) and could account for the displacement of ezrin from the membrane.
Figure 6.

Effects of toxin B on phosphoinositide distribution and ezrin phosphorylation. (A and B) Effect of TxB on phosphoinositide distribution. LLC-PK1 cells were transfected with PLCδ-PH-GFP as described in materials and methods. After 48 h the cells were incubated without (A) or with 2 μg/ml TxB (B) for 3 h at 37°C. GFP fluorescence was visualized in live cells by confocal microscopy. (C–E) Effect of TxB on ezrin phosphorylation. (C and D) LLC-PK1 cells expressing NHE3′38HA3 were incubated without (C) or with TxB (D) as above. The cells were next fixed, permeabilized, and immunostained using anti–phospho-ERM antibody. (E) LLC-PK1 (left) or OK cells (right) expressing NHE3′38HA3 were treated with or without TxB as above. Whole-cell lysates were then separated by SDS-PAGE on 10% gels and immunoblotted with antibodies to phospho-ERM (top) or total ezrin (bottom). Representative of at least three experiments of each type.
We also tested whether TxB altered the state of ezrin phosphorylation. To this end we used an antibody that detects ezrin only if phosphorylated in position Thr567. In untreated cells phospho-ezrin is readily detected by both immunostaining (Fig. 6 C) and by immunoblotting in both LLC-PK1 and OK cells (Fig. 6 E). The phosphorylated species is abundant on microvilli and near the junctional complexes. Remarkably, exposure to TxB largely depleted phospho-ezrin, without noticeable alteration in the total cellular content of ezrin (Fig. 6 E). Jointly, these observations indicate that TxB displaces ezrin from the apical membrane by the combined effects of PI(4,5,)P2 depletion and dephosphorylation of Thr567, which is critical to stabilize the active form of the protein.
Possible Role of Rho/Rho Kinase in Apical Retention of NHE3
Phosphorylation of the COOH-terminal threonine of ezrin can be catalyzed by Rho kinase (Matsui et al., 1998). Because TxB can inactivate Rho, we investigated the possible role of Rho-activated kinases in the retention of NHE3 at the apical membrane. To this end, we used the inhibitor Y-27632, which antagonizes the function of p160ROCK (ROCK1) and Rho kinase (ROCKII) (Uehata et al., 1997). As illustrated in Fig. 7 , cells treated with 100 μM Y-27632 underwent changes in the distribution of actin that partially resembled those noted in TxB-treated cells: stress fibers were disrupted and the perijunctional actin band disappeared. Note that comparatively long (18 h) treatments with Y-27632 were required to observe this phenotype (see Fig. 7, D and E, and G and H), likely due to the limited permeability of the apical membrane to the drug. Importantly, treatment with Y-27632 also resulted in a marked decrease in the surface expression of NHE3, which was apparent by immunostaining (Fig. 8 A) and also by radiolabeling (Fig. 8 E). As anticipated, the depletion of plasmalemmal NHE3 was accompanied by reduced NHE3 activity, measured as the rate of Na+-induced pH recovery from an acid load in LLC-PK1 cells treated with 100 μM amiloride (Fig. 8 F). As in the case of TxB treatment, disappearance of plasmalemmal exchangers was due to their internalization, which became apparent when cells treated with Y-27632 were permeabilized before immunostaining (Fig. 8 C). Of note, a sizable fraction of the intracellular NHE3 appeared in large aggregated structures (Fig. 8 C, arrowheads).
Figure 7.
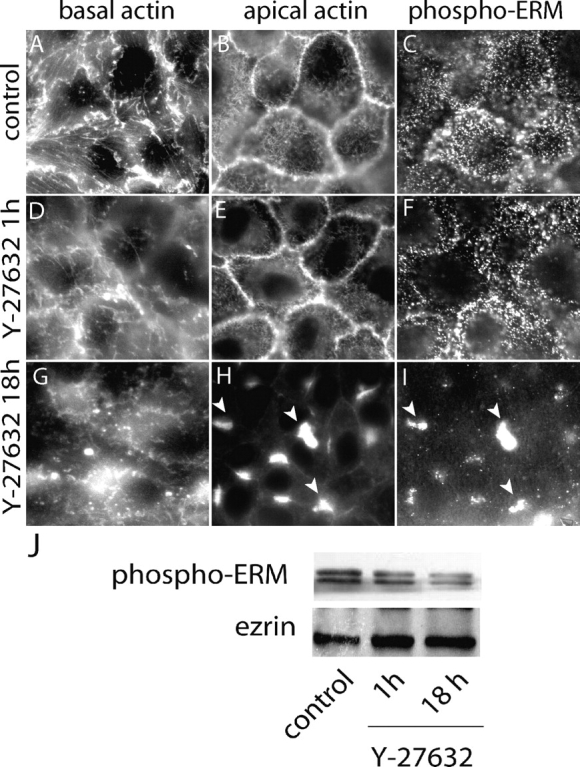
Effects of the Rho-kinase inhibitor Y-27632 on the cytoskeleton. Cells were treated without (control; A–C) or with 100 μM Y-27632 for 1 h (D–F) or 18 h (G–I). The cells were fixed, permeabilized, and stained for F-actin using Alexa 488–conjugated phalloidin (A, B, D, E, G, and H). Phospho-ERM was revealed by immunostaining using a Cy3-labeled secondary antibody (C, F, and I). Samples were analyzed by confocal microscopy and optical slices obtained at the base of the cells (A, D, and G) or near the top (B, C, E, F, H, and I) are shown. Images are representative of four similar experiments. (J) Cells were treated without or with Y-27632 as above. Total cells lysates were extracted and analyzed by SDS-PAGE and immunoblotting with anti-phospho-ERM antibodies (top) followed by stripping of the blots and probing with antiezrin antibodies (bottom). Blot is representative of three similar experiments.
Figure 8.

Effect of Y-27632 on NHE3 distribution and activity. Confluent LLC-PK1 cells stably expressing NHE3′38HA3 were treated with or without 100 μM Y-27632 for 18 h. (A–D) Distribution of NHE3 in cells treated with Y-27632. Surface (A) and total NHE3 (C) and ezrin (B and D) were immunostained as in Fig. 5. (E) Effect of Y-27632 on surface exposure of NHE3. Surface NHE3 was quantified by radiolabeling as in Fig. 2. Data, normalized to the untreated control, are means ± SE of nine determinations. (F) Effect of Y-27632 on NHE3 activity, measured fluorimetrically as described for Fig. 1. The initial rate of transport was calculated from the initial slope of the pHi recovery. Data are means ± SE of five measurements.
An indication of the mechanism underlying the formation of the intracellular NHE3 aggregates was obtained when actin was visualized in these samples. As illustrated in Fig. 7 H, after Y-27632 treatment actin was similarly clustered in aggregates that resembled those found to contain NHE3. The association between these cytoskeletal aggregates and NHE3 was confirmed when samples were double-stained for the antiporter and ezrin. As shown in Fig. 8, B and D, ezrin was also aggregated in cells exposed to Y-27632. In preparations permeabilized before NHE3 staining (Fig. 8, C and D) there was an excellent correspondence between the clusters of antiporters and those of ezrin, suggesting that the molecules coexisted in the same aggregated structures. The Pearson colocalization coefficient in these samples increased to 0.841 (P < 0.01).
It is noteworthy that despite the fact that both TxB and Y-27632 induce internalization of NHE3 their mechanisms of action are not identical. TxB caused extensive dephosphorylation of ezrin and dispersed the protein throughout the cell. In contrast, Y-27632 reduced the level of ezrin phosphorylation only modestly (Fig. 7, I and J) and promoted its clustering in large aggregates that also contained actin (Fig. 7, H and I), suggesting that the linker protein remained in the active, actin-binding configuration. The clustering effects of Y-27632 may reflect the inhibition of myosin function, which is known to be regulated by Rho kinase. Despite their different modes of action, however, both agents redistributed actin and ezrin and prompted the internalization of NHE3. Together, these observations support the notion that NHE3 associates with ezrin and actin in a Rho GTPase-sensitive manner and that this interaction is required for maintenance of a fraction of the exchangers at the apical surface.
DISCUSSION
When expressed heterologously in nonepithelial cells, NHE3 distributes largely to an endomembrane pool, with only ≈10% at the surface membrane (D'Souza et al., 1998). This fraction is considerably smaller than that found on the apical membrane of epithelial cells (e.g. Fig. 2), suggesting that epithelia have specialized mechanisms for the targeting and surface retention of NHE3. Because apical membranes of epithelia have abundant actin-rich microvilli, interaction with microvillar components is a likely candidate. Indeed, direct visualization of the distribution of NHE3 by immunoelectron microscopy revealed that a large fraction of the exchangers are located on the microvillar membrane (Biemesderfer et al., 1998). In accordance with this concept, we found that disruption of the apical actin network of epithelial cells using TxB or Y-27632 resulted in extensive redistribution of NHE3 from the apical membrane to endocytic vesicles. We feel that the net internalization of NHE3 is due primarily to their increased endocytosis, as opposed to reduced exocytosis for two reasons. First, measurements of the mobility and rate of spontaneous recycling of NHE3 in epithelial cells demonstrated that >50% of the apical exchangers are immobile and recycle very poorly, if at all (unpublished data). Second, when the apical membrane was selectively labeled using DiIC18(3) or fluorescently tagged lectins, a considerable increase in net internalization was noted after treatment of the cells with TxB. This elevated uptake of nonselective membrane markers, which was of the same order as seen for NHE3, also indicates that the effects of TxB on internalization are not restricted to the antiporter and affect other apical components as well. In this regard, inhibition of Rho-GTPases with TxB resembles the effect of junctional opening in MDCK cells, where large areas of the apical membrane were found to be internalized into a large vacuole (Vega-Salas et al., 1987). Of note, the activity of Rho-family GTPases in epithelia appears to be modulated by the formation of junctional complexes (Gao et al., 2002; Benais-Pont et al., 2003), suggesting parallels between the two events. Even though we failed to see extensive internalization and formation of large vacuoles in LLC-PK1 cells when their tight junctions were disrupted by omission of calcium (Fig. 3), this may reflect a more discreet effect of this maneuver on the GTPases or the slower development of the response, compared with the faster and more drastic effect of TxB. It will therefore be of interest to analyze the fate of NHE3 at longer times after junctional disruption following calcium depletion.
ERM proteins are thought to be essential for the maintenance of the unique actin architecture of epithelial brush borders (for review see Bretscher et al., 2002). Our data is consistent with the notion that members of the ERM family, likely ezrin, anchor NHE3 to actin bundles at the core of microvilli. Such an interaction could be direct, as suggested for other transmembrane proteins including CD43, CD44, and ICAM-2 (Yonemura et al., 1998), or may be mediated indirectly through interactions with NHERF-1/EBP50 or NHERF-2/E3KARP, previously implicated in the regulation and trafficking of NHE3 (Shenolikar and Weinman, 2001). In this regard, it is noteworthy that while elimination of NHERF-1 by gene disruption induced mistargeting of Npt2, it did not alter the apical location of NHE3 (Shenolikar et al., 2002), implying that this isoform is not essential for proper targeting of the Na+/H+ exchangers. While this may suggest that NHERF-2 may be more important in this role, Weinman et al. (2003) recently reported that NHERF-1, and not NHERF-2, is the isoform that interacts with NHE3, as judged from functional determinations. Thus, it is reasonable to conclude that while NHERF is involved in the regulation of NHE3 activity, it is not directly responsible for its subcellular distribution. A direct interaction with ezrin would provide a simpler explanation to our data. Such an interaction could be in principle mediated by juxtamembrane polycationic sequences like those responsible for the interaction of CD43, CD44, and ICAM with the FERM domain of ezrin (Yonemura et al., 1998). Similar polycationic stretches are found between residues 461–464, 509–514, 602–606, 656–666, and 673–683 of the cytosolic tail of NHE3 from several species (rat sequence positions are listed). In vitro binding and mutagenesis experiments will be required to validate this hypothesis.
The ability of ezrin to interact with ligands via its FERM domain and to associate with actin through its COOH-terminal domain is modulated by Rho-family GTPases (Hirao et al., 1996; Matsui et al., 1998). The observed effects of TxB may therefore have been caused by inhibition of either Rho or Rac. The former can stabilize the uncoiled form of ezrin through phosphorylation of the COOH-terminal threonine residue, an effect mediated by ROCK (Matsui et al., 1998). In fact, direct inhibition of ROCK using Y-27632 resulted in internalization of NHE3 that superficially resembled the effects of TxB. Yet, there were some distinct differences in the appearance of the internalized ezrin and NHE3 after treatment with Y-27632 and with the toxin. In the former case both molecules often appeared in large clusters that were never seen in TxB-treated cells. It was recently reported that while active Rho is needed for association of ERM proteins with the plasma membrane of epithelial cells (Kotani et al., 1997) this occurs without COOH-terminal phosphorylation by ROCK (Matsui et al., 1999). Hence, it is likely that the effect of Y-27632 was indirect, perhaps by alteration of myosin phosphorylation, and that the primary action of Rho-family GTPases in targeting apical ezrin is at the level of phosphoinositide kinases. Both Rho and Rac are capable of activating class I phosphatidylinositol 4-phosphate kinases to yield phosphatidylinositol 4,5-bisphosphate, which can stabilize the uncoiled form of ERM proteins by binding to their FERM (Niggli et al., 1995; Hirao et al., 1996). A TxB-induced reduction in the apical content of phosphatidylinositol 4,5-bisphosphate could in principle explain our observations.
Regardless of its precise mode of action, it is clear that TxB causes a massive internalization of epithelial NHE3, which is accompanied by a drastic drop in the ability of the cells to resorb Na+ and the osmotically obliged water. Because NHE3 is critical to electroneutral NaCl absorption in both the small and large intestine (Gawenis et al., 2002, and references therein), this effect of the toxin may very well contribute to the severe, often deadly diarrhea caused by C. difficile. It is well established that TxB causes a complex phenotype, featuring opening of the junctional complexes, release of proinflammatory cytokines and ultimately apoptosis of infected cells (Pothoulakis, 2000; Pothoulakis and Lamont, 2001), all of which are predicted to affect transepithelial ion and water transport. However, because of the rapid effects reported here, a contribution of the internalization of transporters cannot be discounted, particularly at the early stage of intoxication.
In summary, we have described a novel effect of TxB that may contribute to the understanding of its pathogenesis and have, in the process, revealed a role for Rho-family GTPases in the stabilization of NHE3 at the apical membrane, likely via ERM proteins. These observations raise the possibility that, under physiological circumstances, NHE3 activity may be regulated via Rho GTPases by altering the partition of exchangers between endosomes and the surface membrane.
Supplemental Material
Acknowledgments
This study was supported by the Canadian Institutes of Health Research (CIHR) and the Kidney Foundation of Canada. K. Szaszi was the recipient of CIHR postdoctoral Fellowship. J. Orlowski is an Investigator of the CIHR. S. Grinstein is the current holder of the Pitblado Chair in Cell Biology at The Hospital for Sick Children and is cross-appointed to the Department of Biochemistry, University of Toronto.
Lawrence G. Palmer served as editor.
The online version of this article contains supplemental material.
Abbreviations used in this paper: HA, hemagglutinin; NHE, Na+/H+ exchanger.
References
- Ameen, N.A., and P.J. Salas. 2000. Microvillus inclusion disease: a genetic defect affecting apical membrane protein traffic in intestinal epithelium. Traffic. 1:76–83. [DOI] [PubMed] [Google Scholar]
- Benais-Pont, G., Punn A., C. Flores-Maldonado, J. Eckert, G. Raposo, T.P. Fleming, M.S. Balda and K. Matter. 2003. Identification of a tight junction-associated guanine nucleotide exchange factor that activates Rho and regulates paracellular permeability. J. Cell Biol. 160:729–740. [DOI] [PMC free article] [PubMed] [Google Scholar]
- Biemesderfer, D., B. DeGray, and P.S. Aronson. 1998. Membrane topology of NHE3. Epitopes within the carboxyl-terminal hydrophilic domain are exoplasmic. J. Biol. Chem. 273:12391–12396. [DOI] [PubMed] [Google Scholar]
- Biemesderfer, D., J. Pizzonia, A. Abu-Alfa, M. Exner, R. Reilly, P. Igarashi, and P.S. Aronson. 1993. NHE3: a Na+/H+ exchanger isoform of renal brush border. Am. J. Physiol. 265:F736–F742. [DOI] [PubMed] [Google Scholar]
- Biemesderfer, D., P.A. Rutherford, T. Nagy, J.H. Pizzonia, A.K. Abu-Alfa, and P.S. Aronson. 1997. Monoclonal antibodies for high-resolution localization of NHE3 in adult and neonatal rat kidney. Am. J. Physiol. 273:F289–F299. [DOI] [PubMed] [Google Scholar]
- Botelho, R.J., M. Teruel, R. Dierckman, R. Anderson, A. Wells, J.D. York, T. Meyer, and S. Grinstein. 2000. Localized biphasic changes in phosphatidylinositol-4,5-bisphosphate at sites of phagocytosis. J. Cell Biol. 151:1353–1368. [DOI] [PMC free article] [PubMed] [Google Scholar]
- Bretscher, A. 1989. Rapid phosphorylation and reorganization of ezrin and spectrin accompany morphological changes induced in A-431 cells by epidermal growth factor. J. Cell Biol. 108:921–930. [DOI] [PMC free article] [PubMed] [Google Scholar]
- Bretscher, A., K. Edwards, and R.G. Fehon. 2002. ERM proteins and merlin: integrators at the cell cortex. Nat. Rev. Mol. Cell Biol. 3:586–599. [DOI] [PubMed] [Google Scholar]
- Brown, D.A., and J.K. Rose. 1992. Sorting of GPI-anchored proteins to glycolipid-enriched membrane subdomains during transport to the apical cell surface. Cell. 68:533–544. [DOI] [PubMed] [Google Scholar]
- Cabado, A.G., F.H. Yu, A. Kapus, G. Lukacs, S. Grinstein, and J. Orlowski. 1996. Distinct structural domains confer cAMP sensitivity and ATP dependence to the Na+/H+ exchanger NHE3 isoform. J. Biol. Chem. 271:3590–3599. [DOI] [PubMed] [Google Scholar]
- Cano, A., P. Preisig, and R.J. Alpern. 1993. Cyclic adenosine monophosphate acutely inhibits and chronically stimulates Na/H antiporter in OKP cells. J. Clin. Invest. 92:1632–1638. [DOI] [PMC free article] [PubMed] [Google Scholar]
- Collazo, R., L. Fan, M.C. Hu, H. Zhao, M.R. Wiederkehr, and O.W. Moe. 2000. Acute regulation of Na+/H+ exchanger NHE3 by parathyroid hormone via NHE3 phosphorylation and dynamin-dependent endocytosis. J. Biol. Chem. 275:31601–31608. [DOI] [PubMed] [Google Scholar]
- Doughman, R.L., A.J. Firestone, and R.A. Anderson. 2003. Phosphatidylinositol phosphate kinases put PI4,5P(2) in its place. J. Membr. Biol. 194:77–89. [DOI] [PubMed] [Google Scholar]
- D'Souza, S., A. Garcia-Cabado, F. Yu, K. Teter, G. Lukas, K. Skorecki, H.P. Moore, J. Orlowski, and S. Grinstein. 1998. The epithelial sodium-hydrogen antiporter Na+/H+ exchanger 3 accumulates and is functional in recycling endosomes. J. Biol. Chem. 273:2035–2043. [DOI] [PubMed] [Google Scholar]
- Gao, L., G. Joberty, and I.G. Macara. 2002. Assembly of epithelial tight junctions is negatively regulated by Par6. Curr. Biol. 12:221–225. [DOI] [PubMed] [Google Scholar]
- Gaullier, J.M., A. Simonsen, A. D'Arrigo, B. Bremnes, and H. Stenmark. 1999. FYVE finger proteins as effectors of phosphatidylinositol 3-phosphate. Chem. Phys. Lipids. 98:87–94. [DOI] [PubMed] [Google Scholar]
- Gawenis, L.R., X. Stien, G.E. Shull, P.J. Schultheis, A.L. Woo, N.M. Walker, and L.L. Clarke. 2002. Intestinal NaCl transport in NHE2 and NHE3 knockout mice. Am. J. Physiol. Gastrointest. Liver Physiol. 282:G776–G784. [DOI] [PubMed] [Google Scholar]
- Ghosh, S., S. Gepstein, J.J. Heikkila, and E.B. Dumbroff. 1988. Use of a scanning densitometer or an ELISA plate reader for measurement of nanogram amounts of protein in crude extracts from biological tissues. Anal. Biochem. 169:227–233. [DOI] [PubMed] [Google Scholar]
- Hayashi, H., K. Szaszi, N. Coady-Osberg, J. Orlowski, J.L. Kinsella, and S. Grinstein. 2002. A slow pH-dependent conformational transition underlies a novel mode of activation of the epithelial Na+/H+ exchanger-3 isoform. J. Biol. Chem. 277:11090–11096. [DOI] [PubMed] [Google Scholar]
- He, D., S.J. Hagen, C. Pothoulakis, M. Chen, N.D. Medina, M. Warny, and J.T. LaMont. 2000. Clostridium difficile toxin A causes early damage to mitochondria in cultured cells. Gastroenterology. 119:139–150. [DOI] [PubMed] [Google Scholar]
- Hecht, G., A. Koutsouris, C. Pothoulakis, J.T. LaMont, and J.L. Madara. 1992. Clostridium difficile toxin B disrupts the barrier function of T84 monolayers. Gastroenterology. 102:416–423. [DOI] [PubMed] [Google Scholar]
- Helmle-Kolb, C., L. Counillon, D. Roux, J. Pouyssegur, B. Mrkic, and H. Murer. 1993. Na/H exchange activities in NHE1-transfected OK-cells: cell polarity and regulation. Pflugers Arch. 425:34–40. [DOI] [PubMed] [Google Scholar]
- Helmle-Kolb, C., M.H. Montrose, and H. Murer. 1990. Parathyroid hormone regulation of Na+/H+ exchange in opossum kidney cells: polarity and mechanisms. Pflugers Arch. 416:615–623. [DOI] [PubMed] [Google Scholar]
- Hirao, M., N. Sato, T. Kondo, S. Yonemura, M. Monden, T. Sasaki, Y. Takai, and S. Tsukita. 1996. Regulation mechanism of ERM (ezrin/radixin/moesin) protein/plasma membrane association: possible involvement of phosphatidylinositol turnover and Rho-dependent signaling pathway. J. Cell Biol. 135:37–51. [DOI] [PMC free article] [PubMed] [Google Scholar]
- Hooley, R., C.Y. Yu, M. Symons, and D.L. Barber. 1996. G α 13 stimulates Na+-H+ exchange through distinct Cdc42-dependent and RhoA-dependent pathways. J. Biol. Chem. 271:6152–6158. [DOI] [PubMed] [Google Scholar]
- Hu, M.C., L. Fan, L.A. Crowder, Z. Karim-Jimenez, H. Murer, and O.W. Moe. 2001. Dopamine acutely stimulates Na+/H+ exchanger (NHE3) endocytosis via clathrin-coated vesicles: dependence on protein kinase A-mediated NHE3 phosphorylation. J. Biol. Chem. 276:26906–26915. [DOI] [PubMed] [Google Scholar]
- Janecki, A.J., M.H. Montrose, P. Zimniak, A. Zweibaum, C.M. Tse, S. Khurana, and M. Donowitz. 1998. Subcellular redistribution is involved in acute regulation of the brush border Na+/H+ exchanger isoform 3 in human colon adenocarcinoma cell line Caco-2. Protein kinase C-mediated inhibition of the exchanger. J. Biol. Chem. 273:8790–8798. [DOI] [PubMed] [Google Scholar]
- Just, I., J. Selzer, M. Wilm, C. von Eichel-Streiber, M. Mann, and K. Aktories. 1995. a. Glucosylation of Rho proteins by Clostridium difficile toxin B. Nature. 375:500–503. [DOI] [PubMed] [Google Scholar]
- Just, I., M. Wilm, J. Selzer, G. Rex, C. von Eichel-Streiber, M. Mann, and K. Aktories. 1995. b. The enterotoxin from Clostridium difficile (ToxA) monoglucosylates the Rho proteins. J. Biol. Chem. 270:13932–13936. [DOI] [PubMed] [Google Scholar]
- Kapus, A., S. Grinstein, S. Wasan, R. Kandasamy, and J. Orlowski. 1994. Functional characterization of three isoforms of the Na+/H+ exchanger stably expressed in Chinese hamster ovary cells. ATP dependence, osmotic sensitivity, and role in cell proliferation. J. Biol. Chem. 269:23544–23552. [PubMed] [Google Scholar]
- Kelly, C.P., and J.T. LaMont. 1998. Clostridium difficile infection. Annu. Rev. Med. 49:375–390. [DOI] [PubMed] [Google Scholar]
- Klussmann, E., G. Tamma, D. Lorenz, B. Wiesner, K. Maric, F. Hofmann, K. Aktories, G. Valenti, and W. Rosenthal. 2001. An inhibitory role of Rho in the vasopressin-mediated translocation of aquaporin-2 into cell membranes of renal principal cells. J. Biol. Chem. 276:20451–20457. [DOI] [PubMed] [Google Scholar]
- Kotani, H., K. Takaishi, T. Sasaki, and Y. Takai. 1997. Rho regulates association of both the ERM family and vinculin with the plasma membrane in MDCK cells. Oncogene. 14:1705–1713. [DOI] [PubMed] [Google Scholar]
- Kurashima, K.S.E., G. Lukacs, J. Orlowski, and S. Grinstein. 1998. Endosomal recycling of the Na+/H+ exchanger NHE3 isoform is regulated by the phosphatidylinositol 3-kinase pathway. J. Biol. Chem. 273:20828–20836. [DOI] [PubMed] [Google Scholar]
- Matsui, T., M. Maeda, Y. Doi, S. Yonemura, M. Amano, K. Kaibuchi, and S. Tsukita. 1998. Rho-kinase phosphorylates COOH-terminal threonines of ezrin/radixin/moesin (ERM) proteins and regulates their head-to-tail association. J. Cell Biol. 140:647–657. [DOI] [PMC free article] [PubMed] [Google Scholar]
- Matsui, T., S. Yonemura, and S. Tsukita. 1999. Activation of ERM proteins in vivo by Rho involves phosphatidyl-inositol 4-phosphate 5-kinase and not ROCK kinases. Curr. Biol. 9:1259–1262. [DOI] [PubMed] [Google Scholar]
- Mukherjee, S., R.N. Ghosh, and F.R. Maxfield. 1997. Endocytosis. Physiol. Rev. 77:759–803. [DOI] [PubMed] [Google Scholar]
- Mukherjee, S., T.T. Soe, and F.R. Maxfield. 1999. Endocytic sorting of lipid analogues differing solely in the chemistry of their hydrophobic tails. J. Cell Biol. 144:1271–1284. [DOI] [PMC free article] [PubMed] [Google Scholar]
- Mylonakis, E., E.T. Ryan, and S.B. Calderwood. 2001. Clostridium difficile–associated diarrhea: a review. Arch. Intern. Med. 161:525–533. [DOI] [PubMed] [Google Scholar]
- Niggli, V., C. Andreoli, C. Roy, and P. Mangeat. 1995. Identification of a phosphatidylinositol-4,5-bisphosphate-binding domain in the N-terminal region of ezrin. FEBS Lett. 376:172–176. [DOI] [PubMed] [Google Scholar]
- Orlowski, J. 1993. Heterologous expression and functional properties of amiloride high affinity (NHE-1) and low affinity (NHE-3) isoforms of the rat Na/H exchanger. J. Biol. Chem. 268:16369–16377. [PubMed] [Google Scholar]
- Orlowski, J., and S. Grinstein. 1997. Na+/H+ exchangers of mammalian cells. J. Biol. Chem. 272:22373–22376. [DOI] [PubMed] [Google Scholar]
- Pothoulakis, C. 2000. Effects of Clostridium difficile toxins on epithelial cell barrier. Ann NY Acad Sci. 915:347–356. [DOI] [PubMed] [Google Scholar]
- Pothoulakis, C., and J.T. Lamont. 2001. Microbes and microbial toxins: paradigms for microbial-mucosal interactions II. The integrated response of the intestine to Clostridium difficile toxins. Am. J. Physiol. Gastrointest. Liver Physiol. 280:G178–G183. [DOI] [PubMed] [Google Scholar]
- Raiborg, C., and H. Stenmark. 2002. Hrs and endocytic sorting of ubiquitinated membrane proteins. Cell Struct. Funct. 27:403–408. [DOI] [PubMed] [Google Scholar]
- Rocha, F., M.W. Musch, L. Lishanskiy, C. Bookstein, K. Sugi, Y. Xie, and E.B. Chang. 2001. IFN-gamma downregulates expression of Na+/H+ exchangers NHE2 and NHE3 in rat intestine and human Caco-2/bbe cells. Am. J. Physiol. Cell Physiol. 280:C1224–C1232. [DOI] [PubMed] [Google Scholar]
- Roos, A., and W.F. Boron. 1981. Intracellular pH. Physiol. Rev. 61:296–434. [DOI] [PubMed] [Google Scholar]
- Scaduto, R.C., Jr., and L.W. Grotyohann. 1999. Measurement of mitochondrial membrane potential using fluorescent rhodamine derivatives. Biophys. J. 76:469–477. [DOI] [PMC free article] [PubMed] [Google Scholar]
- Schultheis, P.J., L.L. Clarke, P. Meneton, M.L. Miller, M. Soleimani, L.R. Gawenis, T.M. Riddle, J.J. Duffy, T. Doetschman, T. Wang, et al. 1998. Renal and intestinal absorptive defects in mice lacking the NHE3 Na+/H+ exchanger. Nat. Genet. 19:282–285. [DOI] [PubMed] [Google Scholar]
- Shenolikar, S., J.W. Voltz, C.M. Minkoff, J.B. Wade, and E.J. Weinman. 2002. Targeted disruption of the mouse NHERF-1 gene promotes internalization of proximal tubule sodium-phosphate cotransporter type IIa and renal phosphate wasting. Proc. Natl. Acad. Sci. USA. 99:11470–11475. [DOI] [PMC free article] [PubMed] [Google Scholar]
- Shenolikar, S., and E.J. Weinman. 2001. NHERF: targeting and trafficking membrane proteins. Am. J. Physiol. Renal Physiol. 280:F389–F395. [DOI] [PubMed] [Google Scholar]
- Silva, N.L., H. Wang, C.V. Harris, D. Singh, and L. Fliegel. 1997. Characterization of the Na+/H+ exchanger in human choriocarcinoma (BeWo) cells. Pflugers Arch. 433:792–802. [DOI] [PubMed] [Google Scholar]
- Stauffer, T.P., S. Ahn, and T. Meyer. 1998. Receptor-induced transient reduction in plasma membrane PtdIns(4,5)P2 concentration monitored in living cells. Curr. Biol. 8:343–346. [DOI] [PubMed] [Google Scholar]
- Szaszi, K., K. Kurashima, A. Kapus, A. Paulsen, K. Kaibuchi, S. Grinstein, and J. Orlowski. 2000. RhoA and rho kinase regulate the epithelial Na+/H+ exchanger NHE3. Role of mysoin light chain phosphorylation. J. Biol. Chem. 275:28599–28606. [DOI] [PubMed] [Google Scholar]
- Thomas, J.A., R.N. Buchsbaum, A. Zimniak, and E. Racker. 1979. Intracellular pH measurements in Ehrlich ascites tumor cells utilizing spectroscopic probes generated in situ. Biochemistry. 18:2210–2218. [DOI] [PubMed] [Google Scholar]
- Tominaga, T., and D.L. Barber. 1998. Na-H exchange acts downstream of RhoA to regulate integrin-induced cell adhesion and spreading. Mol. Biol. Cell. 9:2287–2303. [DOI] [PMC free article] [PubMed] [Google Scholar]
- Uehata, M., T. Ishizaki, H. Satoh, T. Ono, T. Kawahara, T. Morishita, H. Tamakawa, K. Yamagami, J. Inui, M. Maekawa, and S. Narumiya. 1997. Calcium sensitization of smooth muscle mediated by a Rho-associated protein kinase in hypertension. Nature. 389:990–994. [DOI] [PubMed] [Google Scholar]
- Vega-Salas, D.E., P.J. Salas, and E. Rodriguez-Boulan. 1987. Modulation of the expression of an apical plasma membrane protein of Madin-Darby canine kidney epithelial cells: cell-cell interactions control the appearance of a novel intracellular storage compartment. J. Cell Biol. 104:1249–1259. [DOI] [PMC free article] [PubMed] [Google Scholar]
- Wakabayashi, S., M. Shigekawa, and J. Pouyssegur. 1997. Molecular physiology of vertebrate Na+/H+ exchangers. Physiol. Rev. 77:51–74. [DOI] [PubMed] [Google Scholar]
- Weinman, E.J., S. Shenolikar, and A.M. Kahn. 1987. cAMP-associated inhibition of Na+/H+ exchanger in rabbit kidney brush-border membranes. Am. J. Physiol. 252:F19–F25. [DOI] [PubMed] [Google Scholar]
- Weinman, E.J., D. Steplock, and S. Shenolikar. 2003. NHERF-1 uniquely transduces the cAMP signals that inhibit sodium-hydrogen exchange in mouse renal apical membranes. FEBS Lett. 536:141–144. [DOI] [PubMed] [Google Scholar]
- Yonemura, S., M. Hirao, Y. Doi, N. Takahashi, T. Kondo, and S. Tsukita. 1998. Ezrin/radixin/moesin (ERM) proteins bind to a positively charged amino acid cluster in the juxta-membrane cytoplasmic domain of CD44, CD43, and ICAM-2. J. Cell Biol. 140:885–895. [DOI] [PMC free article] [PubMed] [Google Scholar]
- Yonemura, S., T. Matsui, and S. Tsukita. 2002. Rho-dependent and -independent activation mechanisms of ezrin/radixin/moesin proteins: an essential role for polyphosphoinositides in vivo. J. Cell Sci. 115:2569–2580. [DOI] [PubMed] [Google Scholar]
- Yun, C.H., C.M. Tse, S.K. Nath, S.A. Levine, and M. Donowitz. 1995. Mammalian Na+/H+ exchanger gene family: structure and function studies. Am. J. Physiol. 269:G1–G11. [DOI] [PubMed] [Google Scholar]
Associated Data
This section collects any data citations, data availability statements, or supplementary materials included in this article.