Abstract
Recently, it was reported that the epithelial Na+ channel (ENaC) is regulated by temperature (Askwith, C.C., C.J. Benson, M.J. Welsh, and P.M. Snyder. 2001. Proc. Natl. Acad. Sci. USA. 98:6459–6463). As these changes of temperature affect membrane lipid order and lipid–protein interactions, we tested the hypothesis that ENaC activity can be modulated by membrane lipid interactions. Two approaches were used to modulate membrane anisotropy, a lipid order–dependent parameter. The nonpharmacological approach used temperature changes, while the pharmacological one used chlorpromazine (CPZ), an agent known to decrease membrane order, and Gd+3. Experiments used Xenopus oocytes expressing human ENaC. Methods of impedance analysis were used to determine whether the effects of changing lipid order indirectly altered ENaC conductance via changes of membrane area. These data were further corroborated with quantitative morphology on micrographs from oocytes membranes studied via electron microscopy. We report biphasic effects of cooling (stimulation followed by inhibition) on hENaC conductance. These effects were relatively slow (minutes) and were delayed from the actual bath temperature changes. Peak stimulation occurred at a calculated Tmax of 15.2. At temperatures below Tmax, ENaC conductance was inhibited with cooling. The effects of temperature on g Na were distinct from those observed on ion channels endogenous to Xenopus oocytes, where the membrane conductance decreased monoexponentially with temperature (t = 6.2°C). Similar effects were also observed in oocytes with reduced intra- and extracellular [Na+], thereby ruling out effects of self or feedback inhibition. Addition of CPZ or the mechanosensitive channel blocker, Gd+3, caused inhibition of ENaC. The effects of Gd+3 were also attributed to its ability to partition into the outer membrane leaflet and to decrease anisotropy. None of the effects of temperature, CPZ, or Gd+3 were accompanied by changes of membrane area, indicating the likely absence of effects on channel trafficking. However, CPZ and Gd+3 altered membrane capacitance in an opposite manner to temperature, consistent with effects on the membrane-dielectric properties. The reversible effects of both Gd+3 and CPZ could also be blocked by cooling and trapping these agents in the rigidified membrane, providing further evidence for their mechanism of action. Our findings demonstrate a novel regulatory mechanism of ENaC.
Keywords: sodium channel, epithelia, Q10, impedance analysis, phase transition
INTRODUCTION
It has long been known that neuronal ion channels are affected by changes of membrane temperature. These actions of temperature are manifested as complex events of varying magnitude on channel activation, inactivation and unitary conductance (Schwarz, 1979; Rodriguez et al., 1998). In all cases, the channel kinetics and conductance exhibited a positive temperature dependency resulting in acceleration and stimulation at higher temperatures. Recently, it was reported that brain epithelial Na+ channel homologues (BNaC) exhibited an inverse temperature sensitivity that resulted in stimulation of channel current with cooling to below ambient temperature (Askwith et al., 2001). Moreover, these investigators observed similar effects with hENaC, where temperature changes down to 6°C were found to stimulate currents in Xenopus oocytes clamped to −60 mV. Thus, it appears that ENaC and its homologues exhibit a unique temperature sensitivity not expected from membrane ion channels.
These effects of temperature may be of little physiological significance to ENaC function in the majority of mammalian tissues where ENaC resides in a controlled 37°C. However, these findings renew interest in the issues of regulation of ENaC by the membrane environment and tension. Although we have demonstrated that channel activity is not sensitive to direct mechanical perturbations of the membrane (Awayda and Subramanyam, 1998), others have recently found effects of flow on ENaC (Satlin et al., 2001). Moreover, ENaC and its homologues are also found to be components of mechanosensitive structures such as baroreceptors (Drummond et al., 1998). Thus, a possibility exists that these observations may be reconciled by effects of the membrane lipid environment on the channel leading to an apparent mechanosensitivity. This has prompted us to examine the issues of effects of membrane order on ENaC activity. While no such previous correlation has been shown for ENaC, it is well know that other ion channels, especially those reconstituted into artificial lipid bilayers, are affected by lipid order, membrane lipid bilayer composition, and lipid bilayer thickness (see Lundbaek and Andersen 1994; Goforth et al., 2003; Lee, 2003).
Besides the controversy surrounding the issue of mechanosensitivity, regulation by membrane lipid environment could also provide cells with an additional physiological modulator of channel activity. Indeed, Pacha and colleagues have recently demonstrated that membrane lipid composition in colonic epithelia can be experimentally modulated by aldosterone and by a low Na+ diet, presumably acting via an endogenous increase of aldosterone levels (Mrnka et al., 2000a,b). The effects of this hormone on membrane lipid composition was further found to be cell-differentiation dependent (Jindrichova et al., 2003). Such findings are also consistent with older literature indicating effects of aldosterone on lipid synthesis and membrane fatty acid composition in the toad bladder (Lien et al., 1975). Furthermore, the effects on lipid turnover and fatty acid synthesis were necessary for the actions of aldosterone on Na+ transport, supporting the conclusion that this increase is secondary to the hormonally induced changes of membrane lipids.
The anomalous effects of temperature on ENaC raise the possibility of global regulation by the membrane lipid environment, especially so since the changes of temperature are thought to alter lipid order, lipid–protein interactions, and constrict the extent of rotational movement of the fatty acids acyl chain. To test this hypothesis, we examined the effects of pharmacological (CPZ) and nonpharmacological (temperature) changes of lipid order on channel activity. Additionally, Gd+3 was used for its purported ability to indiscriminately block many presumed mechanosensitive processes. The ability of these maneuvers to alter lipid order was verified by methods of fluorescence anisotropy. We report that decreasing temperature increased membrane lipid order, while CPZ and surprisingly Gd+3 caused a decrease of membrane order. Consistent with our hypothesis, the effects of temperature on ENaC were essentially opposite to those observed with CPZ and Gd+3. The time course of these changes were also remarkably similar. The changes of conductance occurred in the absence of changes of membrane area, but were accompanied by opposite changes of membrane capacitance and presumably dielectric coefficient, providing a potential biophysical index of changes of membrane order in intact cell membranes. Furthermore, the changes induced by temperature were independent of the extracellular [Na+].
We conclude that our data are consistent with intrinsic effects of lipid order and/or membrane thickness on ENaC unmediated by modulation of the Na+-self inhibition observed at high level of extracellular [Na+]. We propose a physiologically relevant global regulation of ENaC by the membrane lipid bilayer, whereby effects on the membrane lipid environment may provide a potential mechanism by which ENaC can respond to changes of the membrane environment without being mechanosensitive. These findings are unique to ENaC when compared with other ion channels as decreasing lipid movement and/or increasing membrane thickness stimulates channel activity.
MATERIALS AND METHODS
Oocyte Isolation and Injection
Toads were obtained from Xenopus Express and were kept in dechlorinated tap water at 18°C. Conditions for oocyte removal, processing, injection, and cRNA synthesis were as previously described (Awayda and Subramanyam, 1998). Briefly, oocytes were surgically removed, followed by enzymatic defoliculation with collagenase. Oocytes were injected with 1–2 ng cRNA for each of the rat ENaC subunits (α, β, and γ) or 2–4 ng for the corresponding human ones. Recordings were performed 1–4 d postinjection.
Dual Electrode Clamp and Impedance Analysis
Recordings requiring temperature control were performed in a controlled temperature water bath at values between 25°C and 4°C using a dual channel temperature controller and appropriate chamber (Dagan Instruments). All other recordings (e.g., some CPZ and Gd+3 experiments) were performed at room temperature (∼22°C).
All experiments were performed under continuous bath perfusion. Most temperature steps were <5°C. For these smaller changes, the initial step resulted in a near linear change with a slope of ∼4.5°C/min. This was followed by a small overshoot and a return to the desired temperature within ∼2 min. All reported temperatures were the actual bath temperature as measured by a bath thermistor placed downstream of the flow.
Oocytes were clamped to a holding potential of 0 mV and impedance analysis performed as described by Awayda (2000) using a Dagan TEV-200 2-electrode voltage clamp (Dagan Instruments). Briefly, impedance spectroscopy was performed by simultaneously imposing 78 sine waves to the command input of the voltage clamp. Frequencies between 0.1 and 520 kHz were used. The resulting current and voltage records were sampled at 1.64 kHz, Fourier transformed, and used to calculate the impedance, followed by calculation of membrane capacitance Cm and conductance g m. As Cm is known to be frequency independent (Awayda 2000), the impedance was also measured at distinct frequencies that allowed the continuous calculation of capacitance and conductance every 10 s. This procedure was used to analyze the real time effects of temperature on g m and Cm. Values of g m represent the slope conductance in the 0 mV range (near reversal) as the p-p magnitude of the applied signal was <4 mV. Amiloride-sensitive conductance (g Na) was calculated after subtracting the amiloride-insensitive membrane conductance. Amiloride was added at 20 μM at the beginning and end of each experiment.
Analysis of Conductance and the Voltage-activated Currents
Whole-cell currents were recorded in oocytes held at 0 mV and pulsed for varying intervals (800–1,600 ms) from −100 to +40 mV in increments of 20 mV. Amiloride was added at 20 μM at the beginning and end of each experiment. The effect of temperature on the amiloride-insensitive conductance was similar to the effect on the background conductance in control oocytes. As these conductances were similar in magnitude, and as they obey an exponential decay with temperature (see Fig. 3), we were able to extrapolate from the amiloride-insensitive conductance measured at the beginning of each experiment, a predicted value at each experimental temperature. This extrapolation yielded an estimated value at 4°C that was indistinguishable from that actually measured, verifying the appropriateness of this method.
Figure 3.
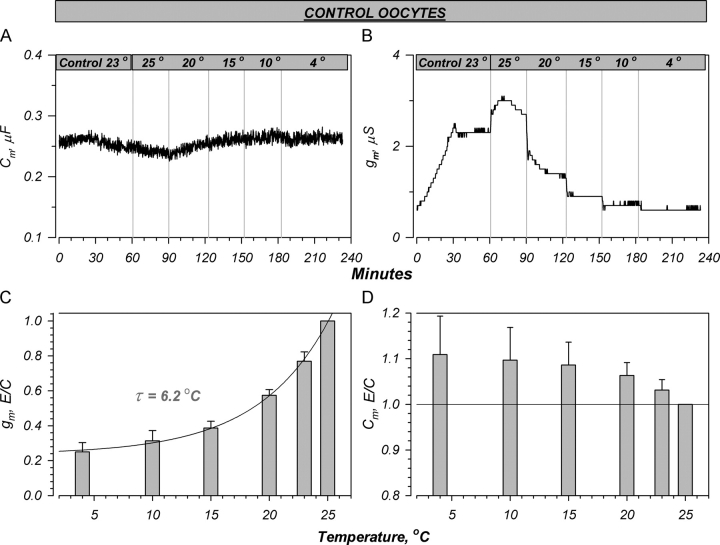
Effects of temperature on control oocytes. (A and B) Representative effects on the capacitance and conductance. Cooling caused a small stimulation of Cm and a rapid decrease of gm. The decrease of conductance was monotonic, in contrast to that observed in hENaC-expressing oocytes. (C and D) Summary of the changes induced by temperature. (C) The decrease of conductance could be fit with a single exponential function with a constant of 6.2°C. (D) The increase of Cm was ∼10% at 15°C, and was similar to that observed with ENaC (Fig. 2). This small increase is unlikely related to trafficking, but rather to the effects of temperature on the membrane dielectric coefficient (see text). Data are normalized to the values at 25°C or control which averaged 2.6 ± 0.5 mS and 0.218 ± 0.012 mF for g m and Cm, respectively. n = 6.
Voltage activation was fit to a single falling exponential as previously described by Awayda (2000) using the nonlinear least squares fitting subroutine in SigmaPlot (Jandel Scientific). Each fit resulted in three parameters: a time constant (t), an initial current (I−100), and a magnitude of the exponential (ΔIV). To normalize for expression levels, a ratio of ΔIV to I−100 was calculated. Linear and nonlinear fits of conductance changes with temperature and calculations of Q10 also used the same software. Negative Q10 are reported for conditions that cause a stimulation with decreased temperature.
By convention inward flow of cations is designated as inward current (negative current), and all voltages are reported with respect to ground or bath.
Solutions and Chemicals
Recording solution osmolarity was maintained at 190 mOsm. Solution composition was: 94 mM NaCl, 2 mM KCl, 1.8 mM CaCl2, 1 mM MgCl2, and 5 mM HEPES, pH 7.45. For the low Na+ solution, 90% of the NaCl was replaced with NMDG-Cl (Awayda and Subramanyam, 1998). Calculations of intracellular Na+ activity was as described by Awayda (1999), and used the nonlinear least squares minimization routine of SigmaPlot to fit the amiloride-sensitive current/voltage relationship to Goldman rectification (Goldman, 1943). Amiloride was a gift from Merck-Sharp & Dohme. GdCl3 and CPZ and all other chemicals were of the highest grade and were obtained from Sigma-Aldrich.
Statistical analysis was performed using Student's t test. Except where noted, all data are summarized as mean and SEM.
Membrane Vesicles and Fluorescence Anisotropy
Oocyte plasma membrane vesicles were prepared as previously described by Awayda et al. (1995). Briefly, 50–100 oocytes were manually homogenized in a ground glass homogenizer in 1 ml of buffer (HB) consisting of 50 mM TRIS, 1 mM EDTA, pH 7.5, and protease inhibitors. The homogenate was layered onto a 20–50% discontinuous sucrose density gradient and spun at 35,000 g for 45 min. The interface layer was collected, diluted 5× with HB + 0.32 M sucrose, and spun at 50,000 g for 30 min. The pellet was collected and resuspended in buffer containing 100 mM KCl, and 20 mM HEPES (pH 7.5). Resuspended membrane vesicles were stored at −80°C until further use.
For anisotropy measurements vesicles were incubated in 10 μM 2-(3-(diphenylhexatrienyl)propanoyl)-1-hexadecanoyl-sn-glycero-3-phosphocholine (DPH-HPC; Molecular Probes) for 3 h in the dark at room temperature. This probe has been shown to localize to the outer leaflet of the phospholipid bilayer (Negrete et al., 1996; Kaiser and London, 1998). Fluorescence polarization measurements of probe-loaded membranes were performed in buffer containing 100 mM KCl, 20 mM HEPES, pH 7.4, on an SLM Aminco Bowman Series 2 fluorometer equipped with stirring and automated prism polarizers. Polarized fluorescence measurements were made continuously every 10 s at excitation and emission wavelengths of 354 and 428 nm, respectively. The ratio of polarized fluorescence was then used to calculate anisotropy by AB2 software (Spectronic Unicam). Briefly, the sample was excited by vertically polarized light, and the vertical and horizontal emitted fluorescence, Ivv and Ivh (see Fig. 8), were used to calculate anisotropy as described by others (Canet et al., 2001; PicoQuant, see http://www.picoquant.com/products/examples/ft100_aniso.pdf). Values of steady-state fluorescence anisotropy reflect the degree of motion exhibited by the fatty acyl chains within the bilayer. These measurements report the degree to which the linear probe has rotated during the lifetime of its excited state. In a more fluid membrane the degree of rotation is higher (anisotropy is lower) because excursions of acyl chains from some initial spatial configuration are greater. Thus, these values can be taken as an index of fluidity and membrane order (see results). Control untreated membranes exhibited values in the range of 0.24–0.28, which were stable over the course of the experiment.
Figure 8.
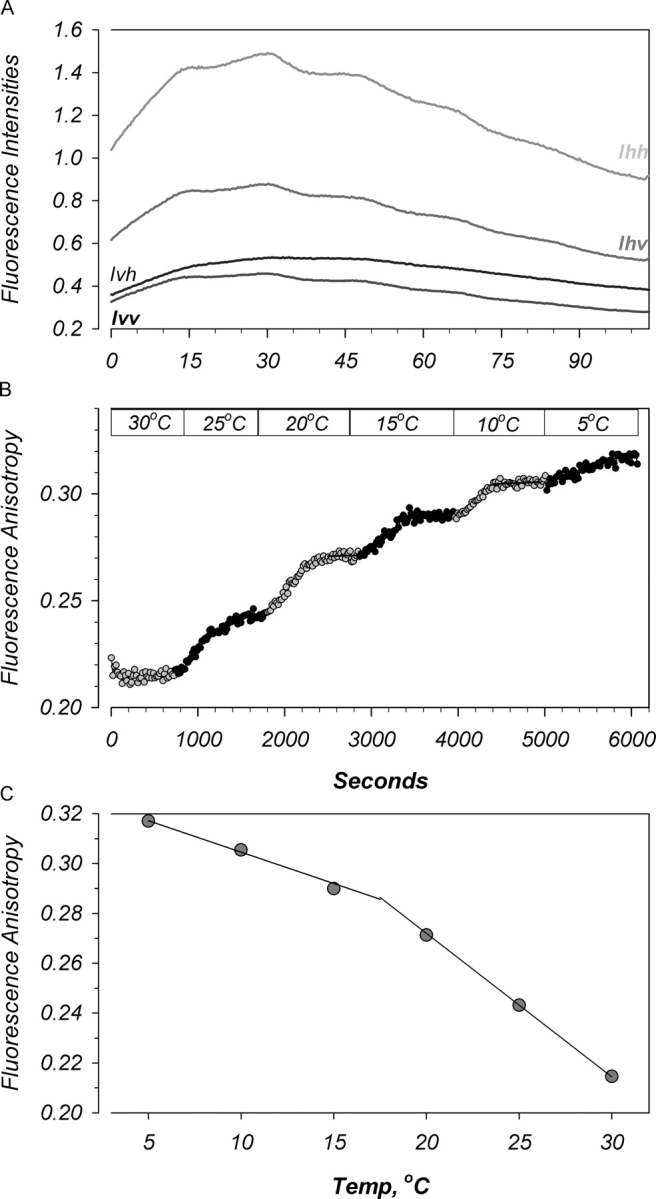
Effects of temperature on oocyte membrane lipids. Oocyte membrane vesicles were isolated as described in materials and methods. (A) DPH-HPC fluorescence in response to decreasing temperature from 30°C to 5°C. Ihv and Ihh correspond to the fluorescent emission intensities in the vertical and horizontal directions in response to horizontal excitation. These are used to calculate an instrument and wavelength correction factor. Ivv and Ivh correspond to the vertical and horizontal emission intensities in response to vertical excitation. These values, along with the correction factor are used to calculate anisotropy. Note the biphasic nature of the effects of temperature on these intensities. (B and C) Calculated anisotropy also revealed biphasic effects of temperature. Data representative of five experiments.
Electron Microscopy and Morphometry
Oocytes were treated for 40 min with appropriate agonists and were subsequently fixed for 1 h in buffer containing 100 mM cacodylic acid, 1 mM CaCl2, 0.5 mM MgCl2, 2% paraformaldehyde, and 0.1% glutaraldehyde. After fixation, samples were washed three times in PBS, then postfixed in aqueous 1% OsO4, 1% K3Fe(CN)6 for 1 h. This was followed by three PBS washes, and the samples were then dehydrated through a graded series of 30–100% ethanol, and 100% propylene oxide, followed by infiltration by a 1:1 mixture of propylene oxide:polybed 812 epoxy resin (Polysciences) for 1 h. After several changes of 100% resin over 24 h, samples were embedded in molds, cured at 37°C overnight, followed by additional hardening at 65°C for 2 d. Ultrathin (60 nm) oocyte sections were collected on copper grids and stained with 2% uranyl acetate in 50% methanol for 10 min, followed by 1% lead citrate for 7 min. Sections were photographed using a JEOL JEM 1210 transmission electron microscope at 80 kV onto electron microscope film (ESTAR thick base; Kodak).
Micrographs were digitally scanned and the two-dimensional membrane surfaces from four images of each condition were traced continuously (i.e., to count membrane infolding and invagination) using Metamorph software. These values were divided by the linear distance (i.e., single dimension) over which the tracings were made and the subsequent ratios referred to as the folding factors (Takahashi et al., 1996). All of the morphometric quantitations were performed in a blinded fashion.
RESULTS
Effects of Temperature on ENaC's Conductance
In initial experiments we observed that oocytes expressing rENaC or hENaC were stimulated when the bath solution is cooled below room temperature (∼22°C). No appreciable differences were observed between the two isoforms, and therefore we focused our attention on hENaC. To better characterize this phenomenon, experiments were initiated in solutions regulated at 23°C. Multiple protocols which spanned 25°C to 4°C were used to randomize the temperature changes and to assure the absence of appreciable drifts.1
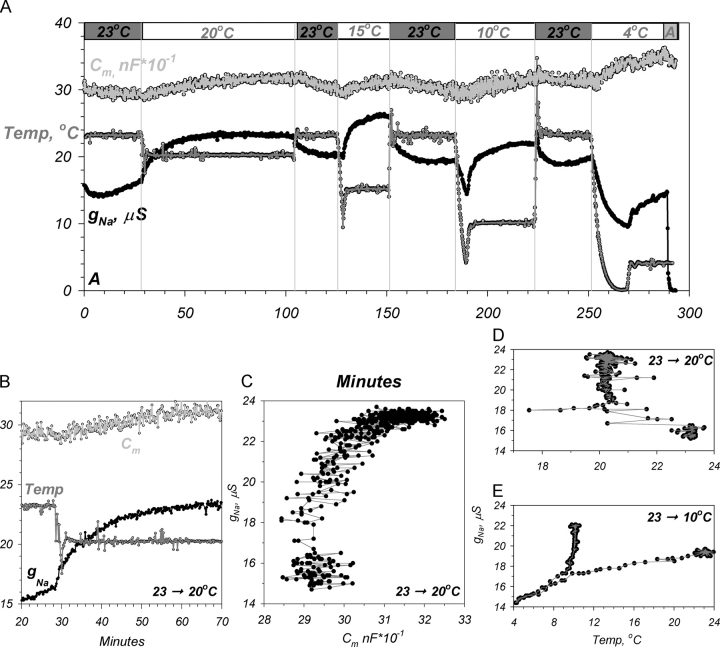
Shown in Fig. 1 is an example of the effects of temperature changes on a hENaC-expressing oocyte. As shown in Fig. 1 A, cooling below 23°C caused a reversible stimulation of the amiloride-sensitive conductance. These changes were accompanied by a small increase of membrane capacitance. The onset of change of conductance coincided with that of membrane capacitance (Fig. 1 B). However, most of the changes of g Na occurred before completions of the changes of Cm. This relationship is further illustrated in the example in Fig. 1 C. While this is only shown for the temperature switch between 23°C and 20°C, it was also observed for other temperature changes, and provided evidence that the stimulation of g Na is unrelated to effects on membrane trafficking (also see morphologic data below).
Figure 1.
Cooling reversibly stimulates hENaC in Xenopus oocytes. Shown is an example of the reversible protocol (see text). (A) Decreasing temperature from 23°C stimulated conductance and capacitance (data corrected for the amiloride-insensitive conductance). (B) Expanded scale of the changes of Cm, g Na, and temperature demonstrating a lag between bath temperature changes and the effects on hENaC. (C) Scatter plot of Cm versus g Na demonstrating that the majority of conductance changes occurred before the bulk changes of Cm. (D) Scatter plot of bath temperature versus g Na demonstrating that the stimulation of g Na lags the temperature changes. (E) Scatter plot demonstrating an initial decrease of g Na if bath temperature was decreased below 10°C. Additional examples using a sequential temperature change (see the protocol in Fig. 3) indicated the absence of a secondary stimulation of g Na at temperatures below ∼15°C.
The effects on g Na lagged the actual bath temperature change (Fig. 1, B and D). Small temperature changes (<5°C) occurred within ∼1 min, followed by a small overshoot and stabilization of the bath temperature within an additional min (∼2 min total to stabilize). Thus, the new value was observed twice during a bath temperature change. At temperatures above ∼12.5°C, the g Na at the initial point exhibited little or no stimulation, indicating delayed effects of temperature. This is consistent with the conclusions from Fig. 1 D, where it appears that the majority of the increase of g Na occurred after temperature stabilization.
It is noteworthy that a delayed stimulation with cooling was consistently observed regardless of the final holding temperature, as long as the initial temperature was near 23°C (e.g., see the temperature change spanning 23°C to 4°C). While it is difficult to ascertain the magnitude of stimulation at these lower temperatures, especially in the face of the expected large changes of the single channel conductance (see discussion), it is evident that a delayed stimulation is still evident at 4°C. This stimulation is not observed when changing bath temperature between 10°C and 4°C (unpublished data). This stimulation is therefore likely the effect of the smaller temperature changes (down to ∼15°C) manifested as a delayed response which is still observable at 4°C; a temperature that is believed to inhibit vesicular trafficking.
An interesting finding shown in Fig. 1 was the observation of an initial inhibition of conductance if the temperature decreased below ∼10°C. This is evident in Fig. 1 E, where a large temperature change that reached below 4°C resulted in an initial decrease of g Na, in sharp contrast to the initial response shown in Fig. 1 D. Similar biphasic effects were also observed if the temperature was changed sequentially from 23°C to 4°C (see the protocol in Fig. 3). Under these conditions, we observed a delayed stimulation of g Na at temperatures down to 15°C. The response of g Na at lower temperatures was rapid and correlated with the changes of temperature.
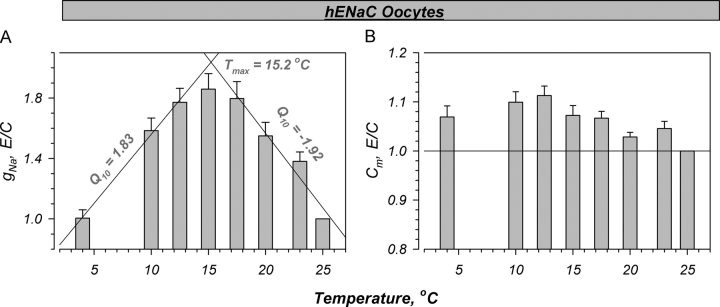
The changes of g Na and Cm in hENaC-expressing oocytes are summarized in Fig. 2. A clear biphasic effect of temperature on g Na is observed in the 25°C to 4°C range. This effect could be approximated by two linear relationships with different sensitivities to temperature, resulting in a Tmax of 15.2°C. In the range of 25°C to 15°C, this relationship results in a Q10 (defined as the change in conductance for a 10°C change of temperature) of −1.92. In the 4°C to 12.5°C range, this results in a Q10 of 1.83. Assuming that the positive Q10 is due to changes of the single-channel conductance, and that this effect is applicable throughout the temperature range, then the value of −1.92 between 25°C and 15°C is underestimated by ∼82%. This leads to a corrected Q10 of approximately −3.5 in the 25°C to 15°C range.
Figure 2.
Summary of the temperature-induced changes in hENaC expressing oocytes. The amiloride-sensitive conductance exhibited a biphasic relationship in response to decreasing temperature. These effects were fit with two linear relationships with slopes of −0.099 and 0.091, leading to a Q10 of −1.92 and 1.83 at high and low temperatures, respectively. These relationships intersected at a temperature of 15.2°C, defined as the maximal temperature or Tmax. A small stimulation of Cm is observed. This stimulation was not different than that observed in control oocytes (see Fig. 3), indicating no specific effects on ENaC-expressing oocytes. Data normalized to the values at 25°C that averaged 11.7 ± 1.6 mS and 0.233 ± 0.013 mF for g Na (amiloride-sensitive component) and Cm, respectively. n = 9.
The effects of bath cooling on Cm were monotonic in nature and much less pronounced (Fig. 2 B). Indeed, Cm increased by ∼10% between 25°C and 12.5°C. No additional consistent changes were observed with further cooling to 4°C. These effects indicate that the observed changes of Cm are unlikely due to membrane trafficking as the changes of capacitance are opposite in direction and somewhat different in time course from those of g Na. Moreover, the effects on Cm were essentially identical to those observed in control oocytes (see below), indicating no correlation with ENaC expression and the direction or magnitude of changes of Cm.
The amiloride-sensitive current measured at the beginning and end of each experiment decreased with temperature. As this is essentially a reflection of the background conductance of the oocyte, we examined the effects of temperature on these conductances. In control oocytes (Fig. 3, A and B), g m decreased as a continuous function of temperature, while Cm exhibited a small increase with cooling as observed in ENaC-expressing ones. In contrast to the effects on hENaC at temperatures above 12.5°C, the changes of g m were essentially immediate and correlated well with the changes of bath temperature.
The changes of g m and Cm in control oocytes between 25°C and 4°C are summarized in Fig. 3, C and D. It is evident from Fig. 3 C that g m decreases monotonically with temperature. This decrease could be fit with an exponential function with a constant in the range of 6°C. This results in a decrease of g m at 4°C to ∼26% of the control values (those measured at 25°C). This results in a Q10 of ∼1.5, a value slightly larger than the 1.2 observed for diffusion in simple aqueous media (Mazzoleni et al., 1986), but nonetheless in the range of the positive Q10 observed with ENaC at temperatures below Tmax.
Decreasing temperature also caused an increase of Cm (Fig. 3 D). However, these effects were much smaller in magnitude than those of g m. As these changes are opposite in direction to those of g m, they rule out the possibility of inhibition of conductance by selective inhibition of membrane exocytosis. These changes of Cm may coincide with a phase transition temperature in amphibian plasma membranes or with direct effects of temperature on the membrane dielectric coefficient and/or membrane thickness (see below).
The above findings indicate that ENaC exhibits an anomalous temperature activation that is in strong contrast to endogenous ion channels expressed in Xenopus oocytes. On the other hand, membrane capacitance changes were similar in all groups of oocytes indicating: (a) effects of temperature on the membrane unrelated to ENaC expression, and (b) changes of ENaC activity unrelated to channel trafficking. Given the findings with chlorpromazine and Gd+3 (see below), and the lack of corroborating morphological or electrophysiological data, we favor the idea that these changes of Cm are related to dielectric coefficient and/or membrane thickness changes, rather than membrane area (see discussion).
Effects at Low [Na+]
Chraibi and Horisberger (2002) have recently reported that ENaC is also activated by decreasing temperature to ∼12°C. Using the currents at −60 mV, these authors have examined the mechanisms of Na+-self inhibition. They report that self inhibition is dependent on the extracellular [Na+], and that this process can be abolished by extracellular protease treatment. Interestingly, they also find that decreasing temperature activates ENaC, and that this activation was dependent on the [Na+]. They interpret their findings in terms of inhibition of self-inhibition at lower temperatures leading to activation of ENaC.
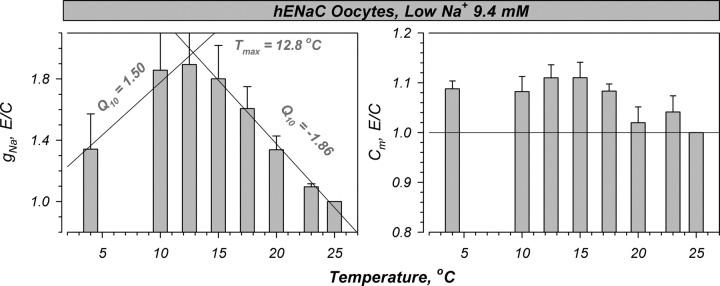
To determine whether our observed effects on conductance and voltage activation are affected by the intracellular/extracellular [Na+], we examined the effects of reducing temperature on oocytes preincubated in low [Na+] recording solution (∼9.4 mM Na+). We have previously demonstrated that overnight incubation in this solution results in an intracellular Na+ activity in the range of 7 mEq (Awayda, 1999). Under low Na+ conditions, the decrease of temperature between 25°C to 4°C also resulted in a biphasic stimulation of ENaC's conductance. These effects are summarized in Fig. 4. Similar values of Q10 and Tmax were observed, indicating little difference in the anomalous activation of ENaC by cooling, thereby ruling out self inhibition as an explanation for these effects.
Figure 4.
Summary of the temperature-induced changes in hENaC expressing oocytes preequilibrated in the low Na+ solution (9.4 mM Na+, Na+ substituted with NMDG). This results in an intracellular Na+ activity in the range of 7 mEq (Awayda, 1999). Under these conditions, similar effects of temperature were observed as in Fig. 2, indicating the lack of effects of intracellular and extracellular [Na+] on the biphasic stimulation of gNa, and the small increase of Cm. The biphasic relationships observed were fit with lines with slopes of −0.081 and 0.069, leading to a Q10 of −1.86 and 1.50 at high and low temperatures, respectively. This resulted in a slightly shifted Tmax of 12.8°C; similar to that observed in high Na+. Data normalized to the values at 25°C which averaged 42.1 ± 11.4 mS and 0.217 ± 0.014 mF for gNa and Cm, respectively. n = 8.
Effects of Temperature on Voltage Activation
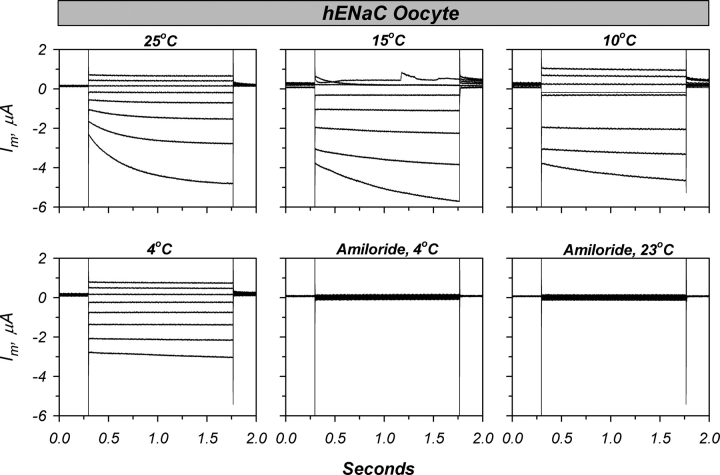
To further ascertain whether the effects of temperature are an intrinsic property of the Na+ channel, we examined the response of voltage activation to altered temperature. This activation is observed when ENaC is subjected to rapid hyperpolarization (−100 mV), and is manifested as an exponential activation of current, which is thought to reflect an intrinsic channel property (Palmer and Frindt, 1996; Awayda, 2000). Thus, effects of temperature on this parameter would provide additional evidence for temperature-induced changes to the channel and/or its membrane environment unrelated to effects on trafficking. Shown in Fig. 5 are representative whole-cell current traces in a hENaC-expressing oocyte. As temperature is decreased down to 4°C, the time constant of the activation (t) is increased. This is accompanied by a biphasic increase of the magnitude of activation (ΔIV).
Figure 5.
Representative effect of temperature on the whole cell currents and voltage activation in a hENaC-expressing oocyte. Oocytes were held at 0 mV and clamped in increments of 20 mV from −100 to +40 mV for a period of ∼1,600 ms. Note the activation of currents at negative voltages at 15°C, followed by inhibition at 4°C. Amiloride was added at the beginning and end of the experiment. Voltage activation was fit as described by Awayda (2000) to the current response to a voltage command of −100 mV (most negative current shown). Note the change in time constant with decreasing temperature, and the increase in the magnitude of activation (ΔIV) at 15°C followed by marked inhibition at 4°C.
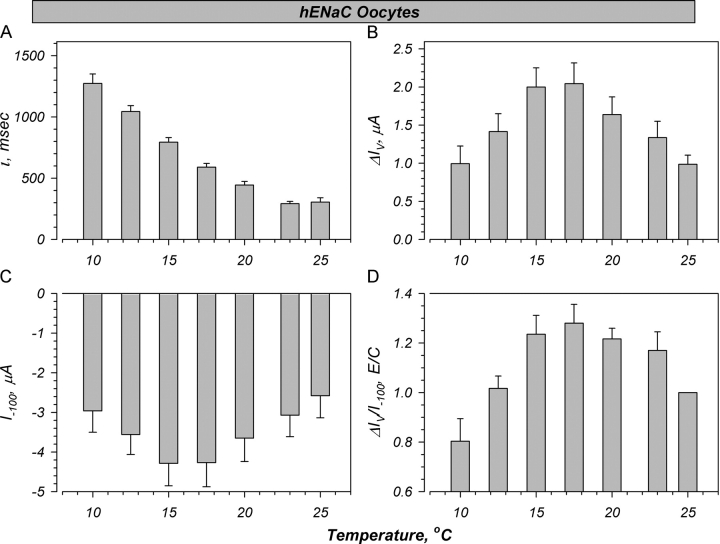
The changes of the voltage-activation kinetics are summarized in Fig. 6. To correct for expression levels (Awayda, 2000), the magnitude of voltage activation is normalized to the initial current at −100 mV (I−100). Moreover, the data at 4°C were not included in the summary as these time constants were prolonged and in many cases extended past the 1,500 ms collection time frame. A change of 25°C to 10°C was accompanied by a greater than fourfold increase in t. This was accompanied by a biphasic increase in ΔIV (Fig. 6 B). This increase was maximal in the 15°C range, consistent with a Tmax of 15.1°C for hENaC conductance (see above, Fig. 2). Similar changes were also observed with I−100 (Fig. 6 C), where the peak increase was observed at ∼15°C. The changes of ΔIV/I−100, while less pronounced, also exhibited a biphasic response with a plateau at ∼15°C. These biphasic changes provide further evidence of inherent stimulation of ENaC with temperature, unrelated to changes of channel trafficking.
Figure 6.
Summary of effects of temperature on voltage activation. Experiments were performed in oocytes bathed in ND94. (A) A large increase of t is observed with decreasing temperature leading to ∼5-fold increase at 10°C. (B) A biphasic stimulation of the magnitude of voltage activation (ΔIV) is observed with a Tmax in the range of that calculated for g Na (see Fig. 2). (C) A similar biphasic stimulation is also observed with the initial current at −100 mV (I−100), and (D) with the ratio of ΔIV to I−100. Values at 4°C were eliminated as the time constants were >1,500 ms and could not be accurately fit from the acquired data points. n = 7.
Potential Mechanism
Our findings indicate clear dissociation between membrane area and Cm, and also rule out channel trafficking as the mechanism of ENaC stimulation. These effects can therefore be explained by effects of temperature on membrane order acting on ENaC. To further test this hypothesis we (a) used morphological measurements of membrane area, and (b) examined the effects of temperature on the plasma membrane order using measurements of fluorescence anisotropy after incorporation of probes that sense lipid order.
Morphological assessment of membrane turnover used electron microscopy–based measurements. Estimates of membrane area were obtained from the degree of membrane infolding as previously described by Takahashi et al. (1996). These measurements were found to resolve small changes of oocyte plasma membrane surface area in response to cAMP stimulation of CFTR, and to correlate well with changes of Cm obtained from time-domain impedance measurements. As shown in the representative examples in Fig. 7, decreasing temperature causes a small decrease of membrane infolding. The decrease between 25°C and 20°C was significant; however, no additional changes were observed at 15°C. These changes are opposite to those observed with Cm and g Na, and support the conclusion that (a) the changes of g Na are not mediated via membrane trafficking and (b) the effects on Cm maybe mediated by effects on the membrane dielectric coefficient and/or bilayer spacing. This is further validated by the effects of pharmacological changes of membrane anisotropy on Cm (see below).
Figure 7.
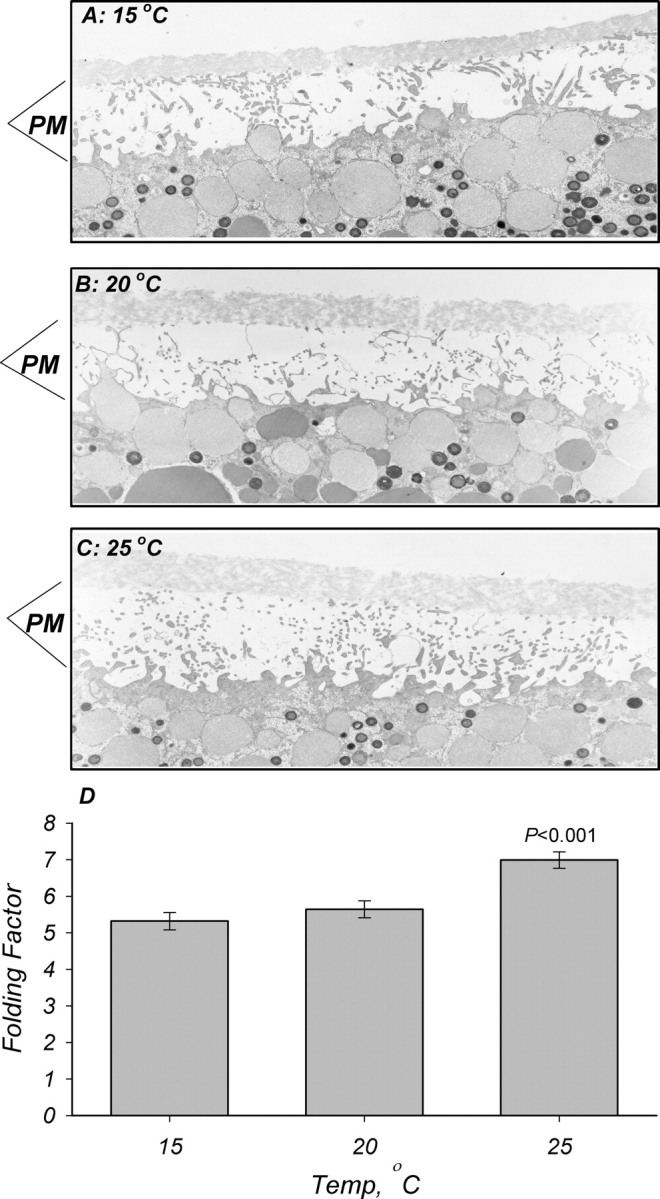
Effects of temperature on oocyte membrane infolding. Oocytes were isolated, fixed, and processed for electron microscopy as described in materials and methods. Representative micrographs of oocytes incubated at 15°C (A), 20°C (B), and 25°C (C) for 30 min. PM denotes plasma membrane and its infolding as observed in cross section. A slightly higher degree of membrane folding is observed in (C). These findings are summarized in (D), and indicate a slightly lower infolding and presumably area in membranes from oocytes incubated at 15°C and 20°C as compared with those at 25°C. These changes are opposite to those expected from the effects on Cm, and indicate that the stimulation observed with ENaC is unrelated to increased membrane area but possibly attributed to dielectric coefficient changes (see text for additional details). n = 4.
To determine whether the anomalous behavior of ENaC coincided with changes of membrane order we used fluorescence anisotropy measurements of oocyte membrane vesicles with lipid order–sensing probes. This parameter is a reflection of the rate of acyl chain movement (“fluidity”) and also the extent of movement or wobble (“order”). In some instances these steady-state measurements are more sensitive to changes of order than fluidity (Kinosita et al., 1981). Shown in Fig. 8 are the effects of temperature on the fluorescence of membranes incubated with DPH-HPC. As expected, probe fluorescence increased with decreasing temperature. However, this effect was biphasic and fluorescence decreased at temperatures below 15–20°C. This is likely a reflection of decreased affinity of the probe for oocyte membranes at those temperatures; a finding that may reflect a shift in membrane properties. This idea is further validated by examining the calculated anisotropy (Fig. 8, B and C), where a small shift in the effect of temperature occurs at ∼15°C. These data are consistent with a potential broad phase transition in isolated oocyte plasma membranes, and provide a correlation indicating an inverse relationship between membrane order and ENaC activity. To further test this hypothesis we used pharmacological changes of membrane order.
Effects of Gd+3 on ENaC
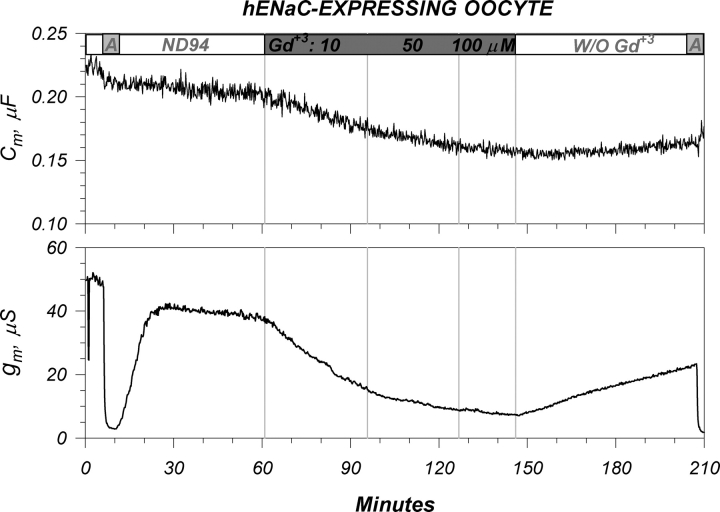
The large cation Gd+3 is known to block the activity of numerous ion channels, many of which are thought to respond to membrane stretch and are designated as mechanosensitive ion channels. Given our interest in the issue of mechanosensitivity of ENaC and the findings of temperature-mediated effects on membrane order, we tested the effects of Gd+3 on ENaC activity. As shown in Fig. 9, Gd+3 caused a slow time-dependent decrease of conductance. An interesting feature was that inhibition was not immediate (decreases were observed up to 90 min), although an amiloride block was observed within seconds. Moreover, a concentration dependency between 10 and 100 μM Gd+3 was not observed, whereby the inhibition with 50 and 100 μM was a continuation of the effect observed with 10 μM. Upon washout, membrane conductance slowly but only partially recovered over the course of >60 min.
Figure 9.
Representative effects of gadolinium on an ENaC-expressing oocyte. (Top) Addition of 10, 50, and 100 μM Gd+3 caused a small and time dependent decrease of Cm. These effects were poorly reversible and were unlikely representative of actual area changes (see text). (Bottom) Effects on membrane conductance. As previously observed, the majority of the conductance is attributed to ENaC and is furthermore amiloride sensitive. Sequential addition of Gd+3 at 10, 50, and 100 μM caused a slow decrease of the amiloride sensitive conductance. The majority of these effects were observed with 10 μM Gd+3 and were time dependent in that very little additional changes were observed by increasing the [Gd+3]. Both effects were only partially reversible within the 1-h washout period. Data representative of nine experiments. See Table I for summary.
Examination of membrane capacitance indicated that Gd+3 also caused a slow, time-dependent decrease of this parameter. The time course of this decrease was similar to that observed with conductance; however, the fractional changes of Cm were smaller than those of g m. The changes of Cm were also poorly reversible. The effects of Gd+3 on conductance were specific to ENaC, as control oocytes exhibited a small, rapid (amiloride-like) decrease of g m (unpublished data). These differences were observed with both the addition and washout of Gd+. On the other hand, the changes of Cm were similar in time course, and slightly larger in magnitude, than those observed in control oocytes. Both groups exhibited poorly reversible changes of Cm upon washout of Gd+3 (see Table I for a summary).
TABLE I.
Effects of Gd+3 on Membrane Capacitance and Conductance
| Baseline | Gd+3 | Washout | |||||
|---|---|---|---|---|---|---|---|
| 0 min | 10 min | 30 min | 60 min | 90 min | 30 min | 60 min | |
| g m/g Na, μs | |||||||
| Control n = 8 |
1.8 ± 0.4 | 1.2 ± 0.1 | 1.2 ± 0.2 | 1.1 ± 0.2 | 1.1 ± 0.2 | 1.3 ± 0.2 | 1.4 ± 0.3 |
| ENac n = 9 |
16.8 ± 3.3 | 15.7 ± 3.0 | 11.6 ± 1.9 | 6.3 ± 0.8 | 4.6 ± 0.6 | 6.5 ± 1.0 | 9.2 ± 1.6 |
| Cm, nF | |||||||
| Control n = 8 |
236 ± 11 | 235 ± 10 | 234 ± 10 | 225 ± 11 | 219 ± 12 | 213 ± 12 | 215 ± 12 |
| ENac n = 9 |
259 ± 12 | 256 ± 12 | 237 ± 10 | 218 ± 10 | 207 ± 10 | 206 ± 11 | 206 ± 10 |
Data are means ± SEM. g m refers to the conductance in control oocytes, while g Na refers to the amiloride-sensitive conductance in ENaC-expressing oocytes.
It is clear from Table I, which examines the effects of Gd+3 on conductance at 10, 30, 60, and 90 min, that a markedly different blocking time course existed in control versus ENaC-expressing oocytes. This was interpreted in support of a different mechanism of action in inhibiting “control” channels versus ENaC. Injection of Gd+3 into the oocyte cytosol produced an effect similar to increasing intracellular Ca2+, leading to activation of endogenous Cl− channels (unpublished data), thus ruling out the possibility of intracellular action of Gd+3 on ENaC. This is not surprising given the expected low permeability of this trivalent cation. However, this finding made it difficult to reconcile the extremely slow time course of inhibition of ENaC. Given the effects of temperature on membrane order, and the finding that Gd+3 (Ermakov et al., 2001) and other lanthanides such as praseodymium (Hill et al., 1999) have been shown to interact with artificial lipid membranes and with erythrocyte membranes (Cheng et al., 1998), we tested the hypothesis that these actions of Gd+3 may also involve changes of membrane order.
Effects of Chlorpromazine on ENaC
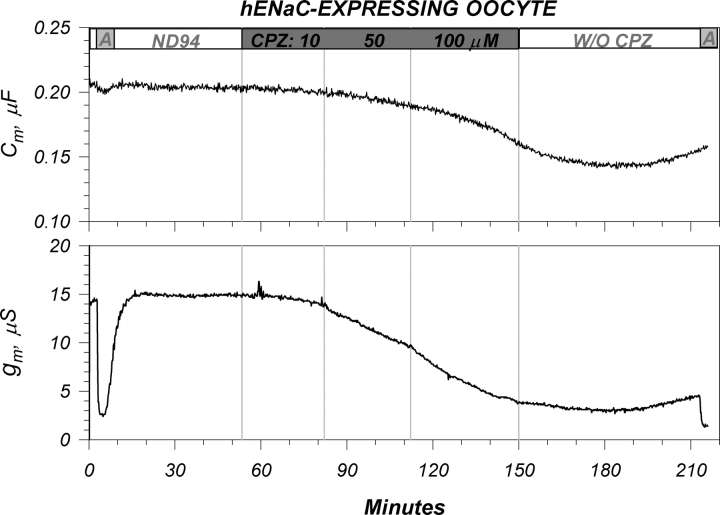
To pharmacologically alter membrane order we used the antipsychotic agent chlorpromazine (CPZ), an agent well known for its effects on this parameter (Oghalai et al., 2000). Shown in Fig. 10 are the effects of 10, 50, and 100 μM CPZ on an ENaC-expressing oocyte. CPZ inhibited both Cm and g m similarly to that observed with Gd+3. These changes were also poorly but partially reversible as observed with Gd+3, and required washout periods >60 min. However, and in contrast to the effects of Gd+3, the effects of CPZ were dose dependent where minimal effects were observed at 10 mM and additional changes are observed after increasing [CPZ] to 50 or 100 μM.
Figure 10.
Representative example of the effects of chlorpromazine on ENaC-expressing oocytes. See Fig. 9 legend for additional details. Addition of CPZ at 10, 50, and 100 μM caused a slow decrease of the amiloride-sensitive conductance. CPZ also caused an accompanying decrease of capacitance. As observed with Gd+3, the changes of g m were larger than those of Cm. These effects were partially reversible upon washout of CPZ. Unlike Gd+3, the majority of the effects of CPZ were not observed until [CPZ] of 50 and 100 μM (see Table II for more details). Data representative of nine experiments.
The changes of Cm were not specific to ENaC-expressing oocytes, as CPZ also caused a decrease of capacitance in control oocytes (unpublished data). This was accompanied by a small decrease of g m. The time course of the changes of Cm were similar to those observed in ENaC-expressing oocytes. Unlike the effects of Gd+3, the time course of the changes of g m in control oocytes also appeared similar to that observed in ENaC-expressing oocytes. The effects on Cm were also partially reversible. These data are summarized in Table II, and indicate that a decrease of membrane anisotropy inhibit ENaC, an idea consistent with the finding that decreasing temperature, which increases anisotropy, stimulated ENaC. Thus, changes of membrane order, irrespective of the stimulus, consistently alter ENaC activity.
TABLE II.
Effects of Chlorpromazine on Membrane Capacitance and Conductance
| Baseline
|
[CPZ]
|
Washout
|
||||
|---|---|---|---|---|---|---|
| 0 | 10 μM | 50 μM | 100 μM | 30 min | 60 min | |
| g m/g Na, μs | ||||||
| Control n = 6 |
3.9 ± 0.7 | 3.0 ± 0.6 | 2.3 ± 0.3 | 1.9 ± 0.4 | 1.6 ± 0.4 | 1.7 ± 0.3 |
| ENac n = 9 |
15.0 ± 2.3 | 15.7 ± 2.4 | 12.1 ± 2.1 | 6.1 ± 1.3 | 4.1 ± 1.0 | 6.3 ± 1.2 |
| Cm, nF | ||||||
| Control n = 6 |
281 ± 7 | 276 ± 6 | 252 ± 8 | 199 ± 15 | 210 ± 8 | 240 ± 9 |
| ENac n = 9 |
285 ± 11 | 286 ± 12 | 258 ± 10 | 203 ± 9 | 196 ± 9 | 220 ± 12 |
Data are means ± SEM. g m refers to the conductance in control oocytes, while g Na refers to the amiloride-sensitive conductance in ENaC-expressing oocytes.
Additional Evidence for Membrane Interaction
The data summarized in Tables I and II indicate an appreciable decrease of Cm in ENaC-expressing oocytes treated with Gd+3 or CPZ. These changes can be interpreted in two ways: (a) effects on membrane area, and (b) effects on the membrane dielectric coefficient and/or thickness unrelated to changes of area. In this case, dielectric coefficient/thickness mediated changes of Cm are consistent with our interpretation of the effects of temperature, and imply interactions with the plasma membrane and inhibition of membrane resident ENaC, or hydrophobic mismatch between the membrane and ENaC leading to a change in the distance between the bilayer leaflets (see discussion).
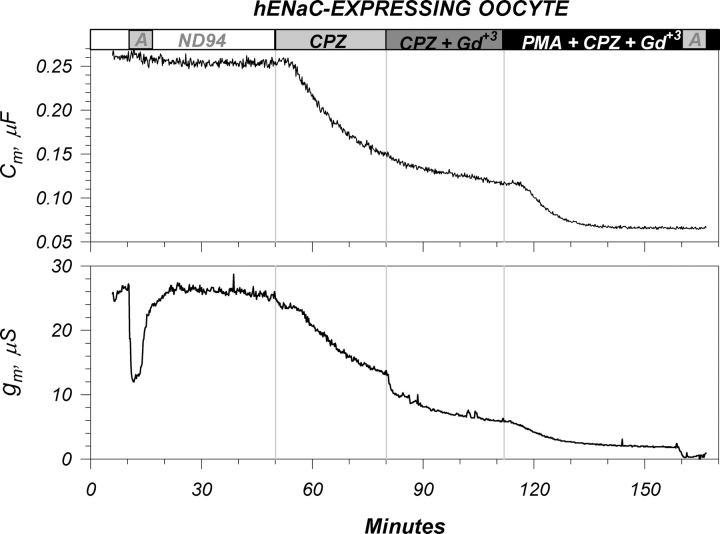
To further rule out effects on membrane area we tested the combined effects of CPZ and Gd+3. As shown in Fig. 11, CPZ decreased Cm and g m. Subsequent addition of Gd+3 resulted in a further decrease of both parameters. In this experiment, Cm decreased to ∼120 nF, a value which is in the range, if not slightly smaller, than that expected from an intact oocyte with a planar plasma membrane with no infolding (Awayda, 2000). To further rule out that this >60% decrease of Cm represented an actual membrane area change, we subsequently added 100 nM PMA. We have previously demonstrated that this phorbol ester inhibits ENaC, in part by a large decrease of membrane area. Moreover, the reduction of surface area with PMA is at, or near, the maximal that could be sustained by an intact membrane and leads to Cm values in the range of 120–140 nF. Thus, it would be expected that a further decrease with PMA to ∼60 nF is not physically possible in an oocyte with an intact plasma membrane, in contrast to that observed in Fig. 11. Moreover, the percentage change of Cm in response to PMA in oocytes pretreated with CPZ and Gd+3 was similar to that observed with PMA alone (Awayda, 2000). These findings indicate that the changes of Cm with CPZ and Gd+3 were unlikely due to actual membrane area changes.
Figure 11.
Potential dielectric changes with Gd+3 and CPZ. Sequential addition of CPZ and Gd+3 caused only small additive changes of Cm, indicating a common mechanism of action. Subsequent addition of PMA further decreased Cm by ∼50%, similar to that previously reported (Awayda, 2000). However, this decrease was smaller than that which is expected from an intact membrane. These findings along with others (see text) indicate effects of CPZ and Gd+3 on the membrane dielectric properties rather than area. Note the rapid small decrease of conductance observed after Gd+3 addition in oocytes pretreated with CPZ. This may indicate facilitation of the action of Gd+3 in membranes where lipid order is already altered by the presence of CPZ. This was similar to the facilitation observed by altering temperature (see Figs. 13 and 14, and discussion). Data representative of five experiments.
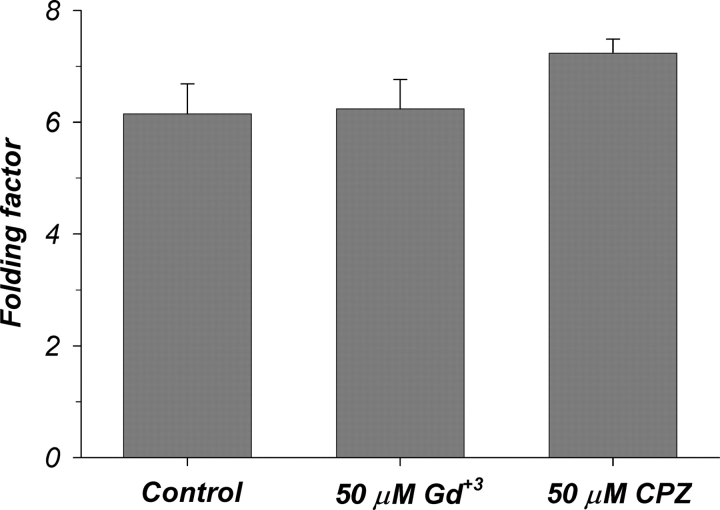
To confirm the absence of dramatic changes of the plasma membrane surface area in response to Gd+3 or CPZ, we used morphometric analyses of images obtained by electron microscopy as described for the effects of temperature. These data are summarized in Fig. 12. Addition of 50 mM Gd+3 or 50 μM CPZ did not result in any significant decrease of membrane infolding, providing more direct evidence for the lack of changes of membrane area. Thus, these data provide compelling evidence in support of the hypothesis of membrane interactions leading to changes of the dielectric properties rather than area.
Figure 12.
Lack of effects of Gd+3 and CPZ on membrane area. Summary of membrane infolding in oocytes treated with 50 μM Gd+3 or 50 μM CPZ (see Fig. 7 for additional details). Note the absence of any decrease of membrane infolding after Gd+3 or CPZ treatment. This further supports the hypothesis that the changes of Cm observed with temperature, Gd+3, and CPZ are unrelated to changes of area, but rather reflect the changes of the membrane dielectric properties.
Given that Gd+3 and CPZ did not alter membrane area, and that the effects of these agents on ENaC did not involve cytoplasmic targets, then the most likely mechanism of action would invoke interactions with the plasma membrane. One likely scenario is interaction with the outer membrane lipids, as recently demonstrated by Cheng et al. (1999) in human erythrocyte membranes, and by Ermakov et al. (2001) in artificial lipid systems. This would be consistent with the changes of the dielectric coefficient, as it is well accepted that this parameter is predominantly a reflection of the membrane lipid dielectric coefficient. In this case, the state of the membrane lipids may affect the partitioning or the effects of these agents. To test this hypothesis we determined whether the effects of Gd+3 or its washout can be modified by cooling the oocytes to below the transition temperature observed in Fig. 8.
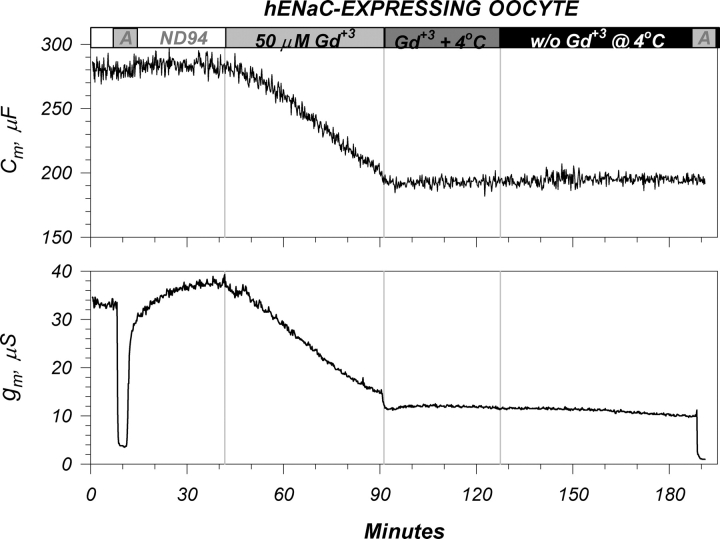
As shown in Fig. 13, a decrease of temperature to 4°C prevented further effects of Gd+3 on either g m or Cm. Moreover, this temperature also prevented the washout effects on g m. These findings indicate that the site of interaction of Gd+3 is the plasma membrane and that these interactions may depend on the mechanical properties of the membrane itself.
Figure 13.
Cooling traps Gd+3 in the membrane. Representative effects of a temperature change on the actions of Gd+3. A decrease of bath temperature to 4°C altered the inhibitory time course of Gd+3. This temperature change also rendered Gd+3 completely irreversible by presumably locking its interaction with the plasma membrane. See text for additional details. Similar effects were also observed at 10°C and with CPZ (not depicted).
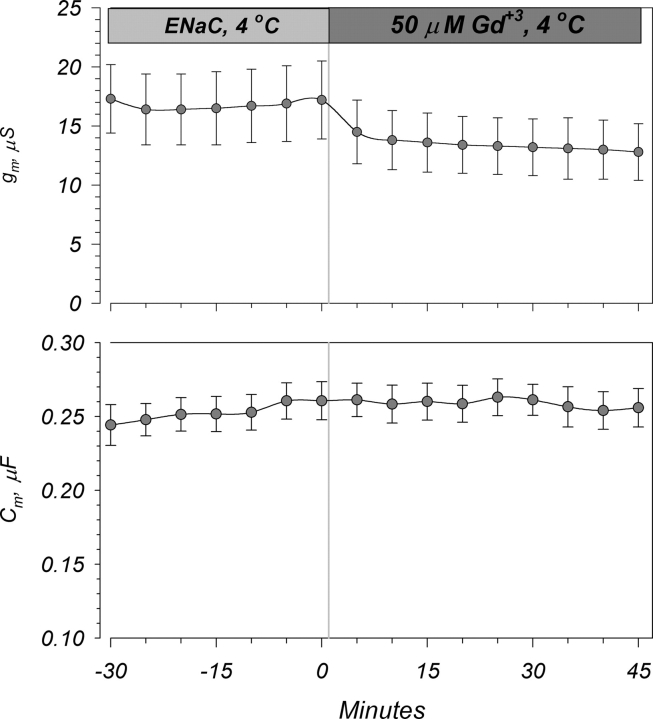
A similar conclusion can be obtained by examining the effects of Gd+3 in oocytes precooled to 4°C. As summarized in Fig. 14, addition of 50 μM Gd+3 to these oocytes resulted in a small but rapid inhibition of g m within the first 5 min. No significant delayed effects were observed up to 45 min. Moreover, the effects of Gd+3 on Cm were completely blocked. These data indicate that the effects of Gd+3 may be biphasic with an initial rapid membrane binding step, followed by a second permeation/partitioning step that occurs much more slowly and may require a membrane above a phase transition temperature (Tm) (see discussion).
Figure 14.
Changes of Gd+3 blocking kinetics at low temperatures. Gd+3 was added to oocytes precooled to 4°C. In these experiments, the inhibitory effects on g m were immediate (within the first 5 min), while the effects on Cm were eliminated. This provides further evidence for interactions between the membrane and Gd+3. n = 7.
Changes of Membrane Order
CPZ and Gd+3 altered g Na and Cm in an opposite manner to that of decreasing temperature. Thus, if these effects were related to the proposed global effects of membrane order, we expected opposite changes of membrane anisotropy. While this is well accepted for CPZ, it was unknown whether Gd+3 would have similar effects. Shown in Fig. 15 A is a representative effect of Gd+3 on membrane anisotropy. Addition of either 50 or 100 μM Gd+3 caused a slow time-dependent decrease of anisotropy, while untreated membranes showed no change. This decrease was similar for both 50 and 100 μM, indicating that the potential partitioning of this agent into the outer lipid membrane is slow and is moreover the rate-limiting step. Addition of Ca2+ at similar concentrations was without effect (unpublished data), indicating that changes of anisotropy were not due to nonspecific multivalent cationic interactions with the membrane. This is interpreted in term of a specific increase of membrane “fluidity” and a decrease “order” or order parameter (see Lee, 1991). This novel finding is consistent with data demonstrating potential effects of Gd+3 on red blood cell membranes and changes of lipid phase transition and protein confirmation subsequent to its binding (Cheng et al., 1998, 1999).
Figure 15.
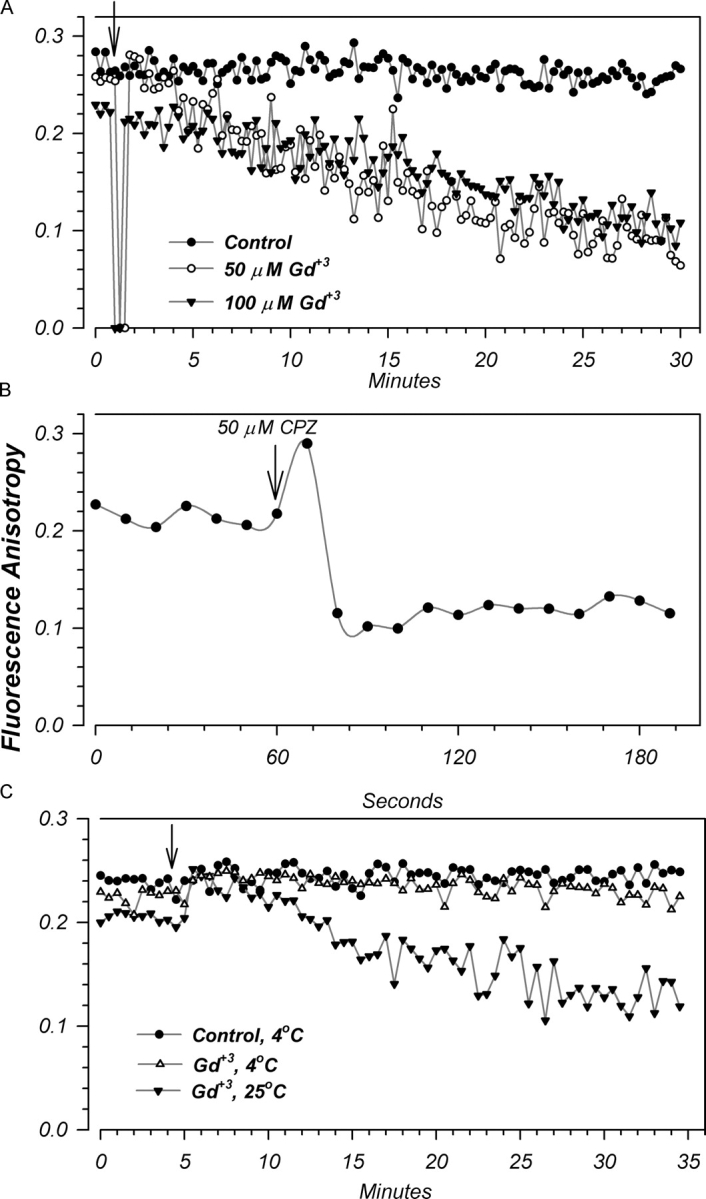
Representative effects of Gd+3 and CPZ on membrane anisotropy. Vesicles were isolated as described in materials and methods. Arrows indicate experimental changes. (A) Addition of Gd+3 caused a slow time-dependent decrease of anisotropy. This decrease was not dose dependent in that similar effects were observed with 50 and 100 μM Gd+3. As these experiments used DPH-HPC, which is an outer leaflet specific probe, these changes reflect effects of Gd+3 on the outer membrane leaflet. Data representative of five experiments. (B) Addition of CPZ caused a decrease of membrane anisotropy with a much faster time course than that observed with Gd+3. Data representative of four experiments. (C) Preincubation of vesicles at 4°C prevented the actions of Gd+3 on membrane anisotropy. These effects are consistent with those observed in Fig. 14 demonstrating the elimination of the effects of Gd+3 on Cm and the altered blocking kinetics of g m, in oocytes precooled to 4°C. These findings are taken as further support of the membrane actions of Gd+3. Data representative of three experiments.
As expected addition of CPZ also decreased membrane anisotropy (Fig. 15 B). Interestingly, these changes were much more rapid than those observed with Gd+3 and are consistent with the observation of dose-dependent effects of CPZ on conductance. Although the fluorescent probe (DPH-HPC) used in the current study reports on changes of membrane properties of the outer leaflet (the most likely site for lipid interactions with Gd+3), it is likely that a lipophilic reagent like CPZ alters the mechanical properties of the entire bilayer. Thus, additional bilayer effects of CPZ may explain its rapid effects on ENaC conductance.
Given the interaction between temperature and Gd+3, we examined the effects of Gd+3 on anisotropy in vesicles precooled to 4°C. As shown in Fig. 15 C, the effects of Gd+3 were essentially eliminated when experiments were performed at 4°C. This finding is consistent with the observation of altered inhibition of g m by Gd+3 at this temperature (see above), and add to the compelling evidence documenting interactions between ENaC and the membrane mediated via potential changes of bilayer mechanical properties, thickness, or order; and the modification of these interactions by temperature, CPZ, and Gd+3.
DISCUSSION
We used the Xenopus oocyte expression system to study the effects of changing membrane order on ENaC activity. This system consists of a single membrane and is better suited to study the regulation of ENaC uncomplicated by effects on other apical and basolateral channels and transporters, as would be the case in polarized epithelial cells. We found an anomalous activation of ENaC at reduced temperatures. This was observed at both high and low [Na+]. The effects of temperature were opposite to those observed with CPZ and Gd+3, two agents found to pharmacologically alter membrane order in an opposite manner to that of temperature. Both pharmacological changes of membrane order, as well as temperature, were found to alter membrane capacitance in the absence of changes to actual area, indicating changes of the membrane dielectric properties. These data provide compelling evidence supporting an intrinsic regulatory mechanism of ENaC by the membrane environment. These data may indicate that changes of the membrane environment and/or the lipid domain where the channel resides may lead to large changes of channel activity and presumably Na+ absorption.
Effects of Temperature on ENaC
Numerous reports have described effects of temperature on a variety of ion channels and membrane transporters. It is well accepted that many channels are affected by temperature with Q10 values larger than those observed from diffusion alone (∼1.2). In many instances channels and transporters exhibit Q10 values similar to those observed in enzymatic processes (>2). While such observations of positive temperature effects on channel activity, gating, and conductance are not surprising, it is unexpected that an ion channel would exhibit a negative temperature coefficient. Indeed, such a concept has only been recently advanced with the observation of negative effects of temperature on ENaC and other members of the Deg/ENaC family (this report; Askwith et al., 2001; Chraibi and Horisberger, 2002), and on the TRP family of ion channels (McKemy et al., 2002; Peier et al., 2002). As the Deg/ENaC and the TRP family of channels do not share any overall homology, and as these effects exhibit markedly different time courses, these findings may reflect fundamental differences in the actions of temperature. Indeed, our data are consistent with such conclusions as we propose global regulation by membrane order unrelated to the direct effects of temperature.
The observed effects of cooling on ENaC are opposite to those exhibited by oocyte endogenous ion channels, where a positive temperature correlation was observed. Moreover, other exogenous ion channels studied in this expression system, such as the L-type Ca2+ channel (Allen and Mikala, 1998), exhibited a positive temperature correlation in contrast to that observed with ENaC. These findings also indicate a specific property of ENaC itself rather than the expression system studied.
Our observed effects on ENaC are not entirely consistent with those previously reported. Askwith et al. (2001) were the first to indicate that ENaC is activated by cold temperature. In the range of 44°C to 6°C, these authors found a monophasic relationship with maximal channel activity at 6°C, and minimal activity at 44°C. Chraibi and Horisberger (2002) also confirmed this observation, but did not offer a detailed description of this process as Na+-self inhibition was the main focus of their work. These authors also examined temperatures between 35°C and ∼12°C, and as such the biphasic relationship we observed may have been missed altogether.
Effects at Low [Na+]
Chraibi and Horisberger (2002) have examined the effects of extracellular [Na+] concentration on the response of ENaC-expressing oocytes to temperature changes. They concluded that cooling to ∼12°C eliminated the Na+-self inhibition. In our studies, reducing the extracellular Na+ was without effects on the anomalous response of g Na to temperature (see Fig. 4). In these experiments, the extra- and intracellular Na+ activities are in the range of 9 and 7 mEq, respectively (Awayda, 1999). These concentrations are known to attenuate (Chraibi and Horisberger, 2002) or eliminate Na+ self-inhibition (Awayda, 1999). A potential explanation for these differences may reside in the fact that our measurements have focused on summarizing the effects of longer (minutes versus seconds) changes of temperature on conductance rather than currents. Our protocol also used lower temperatures than those attempted by Chraibi and Horisberger (2002). Nonetheless, these Chraibi and Horisberger (2003) have recently reported that the rapid effects of temperature are explained by rapid changes of Po. While these findings cannot explain our prolonged effects, they indicate that a 13°C change of temperature results in an ∼50% decrease of conductance—a value similar to the Q10 observed in our experiments at temperatures below 15°C.
Mechanisms of Action
Biological plasma membranes contain a lipid bilayer that exists in a semifluid state. It is believed that the activity of many membrane bound or associated enzymes depends on this state. A well documented example of this is the lipid-dependent enzyme PKC. However, the premise that such a state can affect in a predictable manner the activity of ion channels has not been extensively studied in biological membranes. Nonetheless, such a hypothesis has been tested for channels reconstituted into homogenous artificial lipid bilayers, where it has been demonstrated that changes of bilayer composition affect channel conductance and/or open probability. In artificial channels, e.g., gramacidin and alamethicin, these changes were found to have effects on channel conductance (Frohlich 1979; Lundbaek and Andersen, 1994; Aguilella and Bezrukov, 2001; de Godoy and Cukierman, 2001), as well as open probability (Rudnev et al., 1981). Similar effects were also observed in reconstituted biological channels (Chu et al., 1998; Turnheim et al., 1999; Salvail et al., 2002).
Multiple ideas have been put forth to explain such effects, including changes of surface charge density—providing an explanation for the effects on conductance—and changes of bilayer mechanical properties, including order, surface tension, curvature, and thickness (Lundbaek et al., 1997; Sukharev et al., 1999; Hamill and Martinac, 2001; Goforth et al., 2003; Lee, 2003). While it is possible that other mechanisms can complicate the interpretation in intact biological membranes, it is clear that integral membrane proteins are surrounded by a shell of highly interacting lipid molecules and that changes to the lipid environment alter the channel properties by altering the interaction between these proteins and their lipid shell (for review see Lee, 2003). In many instances this has been referred to as hydrophobic mismatch between the hydrophobic thickness of the channel and that of the lipid bilayer. This mismatch may lead to changes of bilayer thickness (Lundbaek and Andersen, 1994; Goforth et al., 2003) or channel deformation (for review see Lee, 2003).
The changes of anisotropy induced by temperature, Gd+3, and CPZ indicate effects on the rate (fluidity) and extent or degree (order) of motion exhibited by the fatty acyl chains within the bilayer. Lee (1991) and others have presented convincing arguments that exclude fluidity from explaining effects on membrane channels involving partitioning from one pool (conformation) to another. This follows from the principle that fluidity is not a steady-state measurement but rather a reflection of the “rate” of acyl chain movement. Thus, the observed effects are either directly or indirectly attributed to changes of lipid order. It is interesting to note that these changes were accompanied by effects on Cm unrelated to effects on membrane area. These are then interpreted in terms of changes of membrane dielectric coefficient and/or thickness. At present we cannot rule out either possibility, and thus the effects on ENaC may be the result of combination of lipid order disruption leading to changes of dielectric coefficient and hydrophobic mismatch resulting in membrane thickness changes leading to effects on Cm.
The question remains as to how is ENaC activity altered in response to changes of bilayer order or thickness. Recent evidence has indicated that bilayer thickness changes or hydrophobic mismatch can favor the partitioning of some channels into rafts or lipid domains that minimize the free energy difference with the embedded protein (Schroeder et al., 1998; McIntosh et al., 2003). The sorting of model peptides with varying length to lipid raft–like membranes was also found to concentrate peptides with longer hydrophobic length to those raft-like membranes. Interestingly, this process was also found to be temperature dependent (McIntosh et al., 2003). If a similar process affects ENaC distribution, then its sorting to different membrane domains may respond to changes of lipid order in those domains. These changes can then lead to effects on the channel's open probability (Po), as lipid rafts are highly ordered membrane microdomains enriched in cholesterol and sphingolipids (Schroeder et al., 1998). It follows that such association might increase the Po of channels in these rafts, and that changes in the proportion of channels associated with these structures could affect the overall Po of membrane-bound ENaCs. Such spontaneous transition might provide the basis for the presence of multiple channel populations with high and low Po modes (Palmer and Frindt 1996; Awayda and Subramanyam, 1998). In this respect, it is interesting to note that Hill et al. (2002) have recently reported that ENaC resides in lipid rafts. Such a hypothesis could provide a molecular basis of the spontaneous Po and means of physiological regulation of this parameter.
Gd+3 Versus CPZ
We find both differences and similarities between the actions of Gd+3 and CPZ. The overall finding is that the effects of both agents on conductance are not additive. This indicates a common downstream mechanism of inhibition of ENaC. While both agents alter anisotropy, the time course of these changes are different. The effects of Gd+3 are slow and are consistent with the lack of a dose response in the electrophysiological experiments. In contrast, the effects of CPZ are rapid and consistent with a dose-dependent inhibition of g Na. We favor the explanation that these differences are due to differences in the time course of association of these agents with the membrane, and that the resulting inhibition of ENaC is the slowest rate limiting step; a step that may related to ENaC partitioning amongst different membrane pools.
Additional support of the above hypothesis is the observation of altered blocking time course by Gd+3 in oocytes with altered membrane order. Indeed, the changes of ENaC conductance by Gd+3 are rapid in oocytes pretreated with CPZ (see Fig. 11). Similar effects are also observed when membrane order is altered by cooling as shown in Fig. 13, where a change to 4°C caused a rapid inhibition by Gd+3 without any further delayed effects. This was also observed in Fig. 14, where Gd+3 was added to oocytes precooled to 4°C.
Mechanosensitivity Revisited
We have previously demonstrated that ENaC is not directly sensitive to membrane stretch (Awayda and Subramanyam, 1998). However, recent evidence have indicated the potential for indirect mechanosensitivity. These recent findings include evidence for flow sensitivity by Kleyman and colleagues (Satlin et al., 2001), and the presence of ENaC in baroreceptors (Drummond et al., 1998).
The answer to such a discrepancy may reside with the observed effects of changes of bilayer properties. Thus, pressure, flow, or other mechanical stimuli may alter ENaC activity by indirectly altering membrane order or by altering its distribution in membrane domains. Such actions could occur via secondary changes mediated via physiological rigidifying or fluidizing stimuli, which can mimic the effects of temperature, CPZ, or Gd+3 on ENaC leading to changes of activity. In this respect, it is noteworthy that hormones such as aldosterone have been shown to alter membrane lipid composition (Mrnka et al., 2000a,b). Rapid changes of lipid order and potentially membrane composition have been also reported for fast acting hormones such as ADH and its second messenger target cAMP (Kachadorian et al., 1981; Giocondi et al., 1990). The rapidity of these actions (<5 min) rule out genomic effects and are similar to the time course required for pressure or flow sensing if ENaC participated in such processes.
Implications in Essential Hypertension
The roles of ENaC in genetic hypo- and hypertension have been well characterized (see Garty and Palmer, 1997; Rossier et al., 2002). It is well established that channel activity and changes thereof can lead to changes of Na+ and water balance. However, the roles of the distal nephron, and Na+ channels, in particular, in essential hypertension are unknown. Essential hypertension is defined as that with unknown or undetermined origins. It is speculated that such origins may not only involve genetic but also environmental or even dietary factors. It is intuitively expected that any Na+ balance–related hypertension should be accompanied by changes of distal Na+ channel activity and/or function. This follows from the well-established finding that the distal nephron-resident ENaCs are under intrinsic as well as extrinsic regulation. Some of these mechanisms involve self-inhibition and feedback inhibition in response to increased intra- and/or extracellular Na+ concentrations. Therefore, conditions that lead to altered Na+ delivery to the distal nephron should be counteracted by these regulatory mechanisms. Thus, conditions must be permissive in the distal nephron Na+ absorption machinery in order for most of essential hypertension to exist.
How such nongenetic factors alter ENaC's regulation or at least contribute to the muting of these self-regulatory functions is unknown. We speculate that environmental or dietary factors may alter distal nephron Na+ absorption via effects on lipid metabolism and balance leading to changes of membrane lipid composition. This in turn could lead to changes of lipid order and ENaC activity. In this respect it is known that diets high in unsaturated lipids lead to changes of lipid metabolism and potentially membrane lipid composition (for review see Lee, 2003). Moreover, it is also known that membrane lipid composition is also altered in many forms of hypertension (for review see Zicha et al., 1999). It is unclear whether these changes arise form altered blood pressure or contribute to the changes of pressure. However, it is possible, especially given our findings, that such changes could contribute to altered distal nephron Na+ absorption and exacerbate blood pressure regulation via volume expansion.
Conclusions
We demonstrated an interaction between ENaC and the plasma membrane whereby changes of bilayer order positively correlated with ENaC activity. We propose that these effects are the result of an intrinsic response of ENaC to the membrane environment. We demonstrated evidence consistent with such interpretation, although we cannot rule out indirect effects of membrane order on associated kinases or phosphatases. Nonetheless, irrespective of the detailed mechanism, we established for the first time regulation of ENaC by this parameter, a finding that has broad implications in understanding physiological and pathological channel function.
Acknowledgments
We thank Dr. Bernard Rossier (University of Lausanne, Switzerland) and Dr. Mike Welsh (Iowa) for the gift of rat and human ENaC cDNA. We also thank William Wimley (Tulane University) for assistance with the anisotropy measurements. This work was supported by NIH DK55626, and DOD DAMD17-01-1-0431 to M.S. Awayda and by the Smith Kline Beecham Young Investigator grant of the National Kidney Foundation (to W. Hill).
Lawrence G. Palmer served as editor.
Abbreviations used in this paper: CPZ, chlorpromazine; ENaC, epithelial Na+ channel.
Footnotes
It has been our experience that, by clamping to a voltage near the spontaneous open circuit voltage (Voc) of ENaC-expressing oocytes, run down is eliminated. This simple procedure prevents Na+ loading of oocytes and therefore eliminates feedback inhibition due to increases of intracellular [Na+] and osmolarity during the course of an experiment—especially prolonged ones. We have chosen 0 mV as it represents a value close to the median open circuit voltage observed at days 1–3 after ENaC cRNA injection. Our experiments do not exhibit run down over the course of many hours and, indeed, in some experiments we observe a small increase of conductance with time.
References
- Aguilella, V.M., and S.M. Bezrukov. 2001. Alamethicin channel conductance modified by lipid charge. Eur. Biophys. J. 30:233–241. [DOI] [PubMed] [Google Scholar]
- Allen, T.J., and G. Mikala. 1998. Effects of temperature on human L-type cardiac Ca2+ channels expressed in Xenopus oocytes. Pflugers Arch. 436:238–247. [DOI] [PubMed] [Google Scholar]
- Askwith, C.C., C.J. Benson, M.J. Welsh, and P.M. Snyder. 2001. DEG/ENaC ion channels involved in sensory transduction are modulated by cold temperature. Proc. Natl. Acad. Sci. USA. 98:6459–6463. [DOI] [PMC free article] [PubMed] [Google Scholar]
- Awayda, M.S., I.I. Ismailov, B.K. Berdiev, and D.J. Benos. 1995. A cloned renal epithelial Na+-channel protein displays stretch activation in planar lipid bilayers. Am. J. Physiol. 268:C1450–C1459. [DOI] [PubMed] [Google Scholar]
- Awayda, M.S., and M. Subramanyam. 1998. Regulation of the epithelial Na+-channel by membrane tension. J. Gen. Physiol. 112:97–111. [DOI] [PMC free article] [PubMed] [Google Scholar]
- Awayda, M.S. 1999. Regulation of the epithelial Na+ channel by intracellular Na+. Am. J. Physiol. 277:C216–C224. [DOI] [PubMed] [Google Scholar]
- Awayda, M.S. 2000. Specific and non-specific effects of PKC on the epithelial Na+ channel. J. Gen. Physiol. 115:559–570. [DOI] [PMC free article] [PubMed] [Google Scholar]
- Canet, D., K. Doering, C.M. Dobson, and Y. Dupont. 2001. High-sensitivity fluorescence anisotropy detection of protein-folding events: application to lactalbumin. Biophys. J. 80:1996–2003. [DOI] [PMC free article] [PubMed] [Google Scholar]
- Cheng, Y., B. Chen, J. Lu, and K. Wang. 1998. The reaction of lanthanide ions with n-doxyl stearic acids and its utilization for the ESR study on the permeability of lipid-bilayer of erythrocyte membrane to gadolinium ions. J. Inorg. Biochem. 69:1–7. [DOI] [PubMed] [Google Scholar]
- Cheng, Y., H. Yao, H. Lin, J. Lu, R. Li, and K. Wang. 1999. The events relating to lanthanide ions enhanced permeability of human erythrocyte membrane: binding, conformational change, phase transition, perforation and ion transport. Chem. Biol. Interact. 121:267–289. [DOI] [PubMed] [Google Scholar]
- Chu, B., A.M. Dopico, J.R. Lemos, and S.N. Treistman. 1998. Ethanol potentiation of calcium-activated potassium channels reconstituted into planar lipid bilayers. Mol. Pharmacol. 54:397–406. [DOI] [PubMed] [Google Scholar]
- Chraibi, A., and J.D. Horisberger. 2002. Na self inhibition of human epithelial Na channel: temperature dependence and effect of extracellular proteases. J. Gen. Physiol. 120:133–145. [DOI] [PMC free article] [PubMed] [Google Scholar]
- Chraibi, A., and J.D. Horisberger. 2003. Dual effect of temperature on the human epithelial Na+ channel. Pflugers Arch. 447:316–320. [DOI] [PubMed] [Google Scholar]
- de Godoy, C.M., and S. Cukierman. 2001. Modulation of proton transfer in the water wire of dioxolane-linked gramicidin channels by lipid membranes. Biophys. J. 81:1430–1438. [DOI] [PMC free article] [PubMed] [Google Scholar]
- Drummond, H.A., M.P. Price, M.J. Welsh, and F.M. Abboud. 1998. A molecular component of the arterial baroreceptor mechanotransducer. Neuron. 21:1435–1441. [DOI] [PubMed] [Google Scholar]
- Ermakov, Y.A., A.Z. Averbakh, A.I. Yusipovich, and S. Sukharev. 2001. Dipole potentials indicate restructuring of the membrane interface induced by gadolinium and beryllium ions. Biophys. J. 80:1851–1862. [DOI] [PMC free article] [PubMed] [Google Scholar]
- Frohlich, O. 1979. Asymmetry of the gramicidin channel in bilayers of asymmetric lipid composition: I. Single channel conductance. J. Membr. Biol. 48:365–383. [DOI] [PubMed] [Google Scholar]
- Garty, H., and L.G. Palmer. 1997. Epithelial sodium channels: functions, structure, and regulation. Physiol. Rev. 77:359–396. [DOI] [PubMed] [Google Scholar]
- Giocondi, M.C., G. Friedlander, and C. Le Grimellec. 1990. ADH modulates plasma membrane lipid order of living MDCK cells via a cAMP-dependent process. Am. J. Physiol. 259:F95–F103. [DOI] [PubMed] [Google Scholar]
- Goforth, R.L., A.K. Chi, D.V. Greathouse, L.L. Providence, R.E. Koeppe, and O.S. Andersen. 2003. Hydrophobic coupling of lipid bilayer energetics to channel function. J. Gen. Physiol. 121:477–493. [DOI] [PMC free article] [PubMed] [Google Scholar]
- Goldman, D.E. 1943. Potential, impedance, and rectification in membranes. J. Gen. Physiol. 27:37–60. [DOI] [PMC free article] [PubMed] [Google Scholar]
- Hamill, O.P., and B. Martinac. 2001. Molecular basis of mechanotransduction in living cells. Physiol. Rev. 81:685–740. [DOI] [PubMed] [Google Scholar]
- Hill, W.G., R.L. Rivers, and M.L. Zeidel. 1999. Role of leaflet asymmetry in the permeability of model biological membranes to protons, solutes, and gases. J. Gen. Physiol. 114:405–414. [DOI] [PMC free article] [PubMed] [Google Scholar]
- Hill, W.G., B. An, and J.P. Johnson. 2002. Endogenously expressed epithelial sodium channel is present in lipid rafts in A6 cells. J. Biol. Chem. 277:33541–33544. [DOI] [PubMed] [Google Scholar]
- Jindrichova, S., O. Novakova, J. Bryndova, E. Tvrzicka, V. Lisa, F. Novak, and J. Pacha. 2003. Corticosteroid effect on Caco-2 cell lipids depends on cell differentiation. J. Steroid Biochem. Mol. Biol. 87:157–165. [DOI] [PubMed] [Google Scholar]
- Kachadorian, W.A., J. Muller, S. Rudich, and V.A. DiScala. 1981. Relation of ADH effects to altered membrane fluidity in toad urinary bladder. Am. J. Physiol. 240:F63–F69. [DOI] [PubMed] [Google Scholar]
- Kaiser, R.D., and E. London. 1998. Location of diphenylhexatriene (DPH) and its derivatives within membranes: comparison of different fluorescence quenching analyses of membrane depth. Biochemistry. 37:8180–8190. [DOI] [PubMed] [Google Scholar]
- Kinosita, K., R. Kataoka, Y. Kimura, O. Gotoh, and A. Ikegami. 1981. Dynamic structure of biological membranes as probed by 1,6-diphenyl-1,3,5-hexatriene: a nanosecond fluorescence depolarization study. Biochemistry. 20:4270–4277. [DOI] [PubMed] [Google Scholar]
- Lee, A.G. 1991. Lipids and their effects on membrane proteins: evidence against a role for fluidity. Prog. Lipid Res. 30:323–348. [DOI] [PubMed] [Google Scholar]
- Lee, A.G. 2003. Lipid-protein interactions in biological membranes: a structural perspective. Biochim. Biophys. Acta. 1612:1–40. [DOI] [PubMed] [Google Scholar]
- Lien, E.L., D.B. Goodman, and H. Rasmussen. 1975. Effects of an acetyl-coenzyme A carboxylase inhibitor and a sodium-sparing diuretic on aldosterone-stimulated sodium transport, lipid synthesis, and phospholipid fatty acid composition in the toad urinary bladder. Biochemistry. 14:2749–2754. [DOI] [PubMed] [Google Scholar]
- Lundbaek, J.A., and O.S. Andersen. 1994. Lysophospholipids modulate channel function by altering the mechanical properties of lipid bilayers. J. Gen. Physiol. 104:645–673. [DOI] [PMC free article] [PubMed] [Google Scholar]
- Lundbaek, J.A., A.M. Maer, and O.S. Andersen. 1997. Lipid bilayer electrostatic energy, curvature stress, and assembly of gramicidin channels. Biochemistry. 36:5695–5701. [DOI] [PubMed] [Google Scholar]
- Mazzoleni, A.P., B.F. Sisken, and R.L. Kahler. 1986. Conductivity values of tissue culture medium from 20 degrees C to 40 degrees C. Bioelectromagnetics. 7:95–99. [DOI] [PubMed] [Google Scholar]
- McIntosh, T.J., A. Vidal, and S.A. Simon. 2003. Sorting of lipids and transmembrane peptides between detergent-soluble bilayers and detergent-resistant rafts. Biophys. J. 85:1656–1666. [DOI] [PMC free article] [PubMed] [Google Scholar]
- McKemy, D.D., W.M. Neuhausser, and D. Julius. 2002. Identification of a cold receptor reveals a general role for TRP channels in thermosensation. Nature. 416:52–58. [DOI] [PubMed] [Google Scholar]
- Mrnka, L., O. Novakova, F. Novak, E. Tvrzicka, and J. Pacha. 2000. a. Low-salt diet alters the phospholipid composition of rat colonocytes. Physiol. Res. 49:197–205. [PubMed] [Google Scholar]
- Mrnka, L., O. Novakova, F. Novak, E. Tvrzicka, and J. Pacha. 2000. b. Aldosterone alters the phospholipid composition of rat colonocytes. J. Steroid Biochem. Mol. Biol. 73:11–17. [DOI] [PubMed] [Google Scholar]
- Negrete, H.O., R.L. Rivers, A.H. Goughs, M. Colombini, and M.L. Zeidel. 1996. Individual leaflets of a membrane bilayer can independently regulate permeability. J. Biol. Chem. 271:11627–11630. [DOI] [PubMed] [Google Scholar]
- Oghalai, J.S., H.B. Zhao, J.W. Kutz, and W.E. Brownell. 2000. Voltage- and tension-dependent lipid mobility in the outer hair cell plasma membrane. Science. 287:658–661. [DOI] [PMC free article] [PubMed] [Google Scholar]
- Palmer, L.G., and G. Frindt. 1996. Gating of Na channels in the rat cortical collecting tubule: effects of voltage and membrane stretch. J. Gen. Physiol. 107:35–45. [DOI] [PMC free article] [PubMed] [Google Scholar]
- Peier, A.M., A. Moqrich, A.C. Hergarden, A.J. Reeve, D.A. Andersson, G.M. Story, T.J. Earley, I. Dragoni, P. McIntyre, S. Bevan, and A. Patapoutian. 2002. A TRP channel that senses cold stimuli and menthol. Cell. 108:705–715. [DOI] [PubMed] [Google Scholar]
- Rudnev, V.S., L.N. Ermishkin, L.A. Fonina, and Y.G. Rovin. 1981. The dependence of the conductance and lifetime of gramicidin channels on the thickness and tension of lipid bilayers. Biochim. Biophys. Acta. 642:196–202. [DOI] [PubMed] [Google Scholar]
- Rodriguez, B.M., D. Sigg, and F. Bezanilla. 1998. Voltage gating of Shaker K+ channels: the effect of temperature on ionic and gating currents. J. Gen. Physiol. 112:223–242. [DOI] [PMC free article] [PubMed] [Google Scholar]
- Rossier, B.C., S. Pradervand, L. Schild, and E. Hummler. 2002. Epithelial sodium channel and the control of sodium balance: interaction between genetic and environmental factors. Annu. Rev. Physiol. 64:877–897. [DOI] [PubMed] [Google Scholar]
- Salvail, D., M. Cloutier, and E. Rousseau. 2002. Functional reconstitution of an eicosanoid-modulated Cl− channel from bovine tracheal smooth muscle. Am. J. Physiol. Cell Physiol. 282:C567–C577. [DOI] [PubMed] [Google Scholar]
- Satlin, L.M., S. Sheng, C.B. Woda, and T.R. Kleyman. 2001. Epithelial Na+ channels are regulated by flow. Am. J. Physiol. 280:F1010–F1018. [DOI] [PubMed] [Google Scholar]
- Schroeder, R.J., S.N. Ahmed, Y. Zhu, E. London, and D.A. Brown. 1998. Cholesterol and sphingolipid enhance the Triton X-100 insolubility of glycosylphosphatidylinositol-anchored proteins by promoting the formation of detergent-insoluble ordered membrane domains. J. Biol. Chem. 273:1150–1157. [DOI] [PubMed] [Google Scholar]
- Schwarz. 1979. Temperature experiments on nerve and muscle membranes of frogs. Indications for a phase transition. Pflugers Arch. 382:27–34. [DOI] [PubMed] [Google Scholar]
- Sukharev, S.I., W.J. Sigurdson, C. Kung, and F. Sachs. 1999. Energetic and spatial parameters for gating of the bacterial large conductance mechanosensitive channel, MscL. J. Gen. Physiol. 113:525–540. [DOI] [PMC free article] [PubMed] [Google Scholar]
- Takahashi A., S.C. Watkins, M. Howard M, and R.A. Frizzell. 1996. CFTR-dependent membrane insertion is linked to stimulation of the CFTR chloride conductance. Am. J. Physiol. Cell Physiol. 271:C1887–C1894. [DOI] [PubMed] [Google Scholar]
- Turnheim, K., J. Gruber, C. Wachter, and V. Ruiz-Gutierrez. 1999. Membrane phospholipid composition affects function of potassium channels from rabbit colon epithelium. Am. J. Physiol. 277:C83–C90. [DOI] [PubMed] [Google Scholar]
- Zicha, J., J. Kunes, and M.A. Devynck. 1999. Abnormalities of membrane function and lipid metabolism in hypertension: a review. Am. J. Hypertens. 12:315–331. [DOI] [PubMed] [Google Scholar]


