

Abstract
Receptor-mediated modulation of KCNQ channels regulates neuronal excitability. This study concerns the kinetics and mechanism of M1 muscarinic receptor–mediated regulation of the cloned neuronal M channel, KCNQ2/KCNQ3 (Kv7.2/Kv7.3). Receptors, channels, various mutated G-protein subunits, and an optical probe for phosphatidylinositol 4,5-bisphosphate (PIP2) were coexpressed by transfection in tsA-201 cells, and the cells were studied by whole-cell patch clamp and by confocal microscopy. Constitutively active forms of Gαq and Gα11, but not Gα13, caused a loss of the plasma membrane PIP2 and a total tonic inhibition of the KCNQ current. There were no further changes upon addition of the muscarinic agonist oxotremorine-M (oxo-M). Expression of the regulator of G-protein signaling, RGS2, blocked PIP2 hydrolysis and current suppression by muscarinic stimulation, confirming that the Gq family of G-proteins is necessary. Dialysis with the competitive inhibitor GDPβS (1 mM) lengthened the time constant of inhibition sixfold, decreased the suppression of current, and decreased agonist sensitivity. Removal of intracellular Mg2+ slowed both the development and the recovery from muscarinic suppression. When combined with GDPβS, low intracellular Mg2+ nearly eliminated muscarinic inhibition. With nonhydrolyzable GTP analogs, current suppression developed spontaneously and muscarinic inhibition was enhanced. Such spontaneous suppression was antagonized by GDPβS or GTP or by expression of RGS2. These observations were successfully described by a kinetic model representing biochemical steps of the signaling cascade using published rate constants where available. The model supports the following sequence of events for this Gq-coupled signaling: A classical G-protein cycle, including competition for nucleotide-free G-protein by all nucleotide forms and an activation step requiring Mg2+, followed by G-protein–stimulated phospholipase C and hydrolysis of PIP2, and finally PIP2 dissociation from binding sites for inositol lipid on the channels so that KCNQ current was suppressed. Further experiments will be needed to refine some untested assumptions.
Keywords: M-current, M1 muscarinic receptor, phospholipase C, magnesium, PIP2
INTRODUCTION
This paper concerns the kinetics of steps in G-protein signaling to ion channels. The first biochemical experiments on the G-proteins Gs, Go, Gi, and transducin identified a cycle of conformational changes that activates and deactivates G-proteins (Schramm and Selinger, 1984; Birnbaumer et al., 1985; Stryer, 1986; Gilman, 1987; Ross, 1995). These test-tube studies used purified protein components to measure rates of action of GTP and GDP analogs, AlF4 −, and Mg2+ on nucleotide binding, tryptophan fluorescence, and proteolytic susceptibility of the G-protein α-subunit. They identified steps of guanine nucleotide exchange and guanine nucleotide hydrolysis. Similar kinetic steps were subsequently recognized in electrophysiological work on Go-, Gi-, and transducin-dependent pathways of ion channel gating (Sather and Detwiler, 1987; Breitwieser and Szabo, 1988; Pfaffinger, 1988). Using both G-protein–activated inward rectifier K+ channels in heart and cyclic-nucleotide–gated channels in photoreceptors, such early work revealed the physiological kinetics of G-protein signaling in intact cells. In the case of photoreceptors, kinetic models could then be formulated to describe the kinetics of phototransduction (for review see Arshavsky et al., 2002).
Our goal is to carry out a similar biophysical analysis on a signaling pathway that uses G-proteins of the Gq family. Biochemical experiments with purified Gq and its relatives have identified α-subunits of the Gq family as the activators of phospholipase C-βs (PLC-β), the enzymes that cleave the membrane phospholipid phosphatidylinositol 4,5-bisphosphate (PIP2) into diacylglycerol and inositol trisphosphate (IP3) (Sternweis and Smrcka, 1992; Singer et al., 1997). During activation in vitro, Gq steps through a cycle of nucleotide exchange and nucleotide hydrolysis like that of other G-proteins. The kinetics of these steps have been studied with purified components in lipid vesicles (Mukhopadhyay and Ross, 1999); however, less is known about the physiological kinetics in cells (see e.g., Pfaffinger, 1988; Lopez, 1992). Here we have monitored downstream actions of PLC in intact cells as measures of Gq activation while perturbing the system with GTP and GDP analogs, AlF4 −, and Mg2+. As an indicator of PLC activity, we use principally the modulation of an ion channel, but we also use the translocation of a fluorescent reporter protein that is a probe for both a substrate and a product of PLC. With electrophysiology and confocal imaging, we have been able to follow the kinetics of Gq signaling, from which we have begun to formulate a preliminary kinetic model of its time course.
Our main PLC indicator is the voltage-dependent M-current, which can be suppressed by activating M1 muscarinic receptors or other receptors linked to Gq (Brown and Yu, 2000). A role for G-proteins in M-current modulation was recognized early by an irreversible inhibition of the current when compounds known to activate G-proteins, such as guanosine-5′-O-(3-thiotriphosphate) (GTPγS), guanylyl-imidodiphosphate (GppNHp), or AlF4 −, were applied intracellularly with or without muscarinic agonists (Pfaffinger, 1988; Brown et al., 1989). Evidence has accumulated that the G-protein involved belongs to the Gq/11 family (Pfaffinger, 1988; Brown et al., 1989; Caulfield et al., 1994; Jones et al., 1995; Haley et al., 1998; Shapiro et al., 2000). It is likely that different G-protein subtypes of the Gq/11 family participate in the transmitter modulation of M-current depending on the cell, receptor subtype, and species (Simmons and Mather, 1991; Haley et al., 2000).
The primary signal for suppression and recovery of M-current is the G-protein–mediated hydrolysis and depletion of PIP2 in the plasma membrane via activation of PLC, followed by resynthesis of PIP2. Muscarinic inhibition of the M-current is blocked by an inhibitor of PLC, recovery from inhibition requires cytosolic hydrolyzable ATP, and recovery is blocked by inhibitors of phosphatidylinositol (PI) 4-kinase (Suh and Hille, 2002). The M-current can be depressed by depleting PIP2 with antibodies or with polycations, and it can be reactivated by perfusion of PIP2 after suppression by rundown or exposure to agonists of Gq-coupled receptors (Zhang et al., 2003).
The other indicator of PLC activity that we use here is a fluorescent probe that binds to PIP2 in the membrane and to IP3 in the cytoplasm. This protein construct (PH-EGFP), a fusion protein of the PH domain of PLC-δ1 with enhanced green fluorescent protein, can be expressed in cell lines and observed by confocal microscopy in living cells (Stauffer et al., 1998; Varnai and Balla, 1998). In resting cells, with PIP2 in the plasma membrane and no cytoplasmic IP3, the PH-EGFP protein binds to the inner leaflet of the plasma membrane, with little elsewhere in the cell. After PLC has been activated, the probe migrates into the cytoplasm both because of the loss of membrane PIP2 and because of the generation of cytoplasmic IP3 when PLC is active (Stauffer et al., 1998; Hirose et al., 1999; Xu et al., 2003; unpublished data).
MATERIALS AND METHODS
Cells for Electrophysiology
We express the M-current from its KCNQ2/KCNQ3 (Kv7.2/Kv7.3) channel subunits in a cell line together with M1 receptors. Plasmids encoding the channel subunits, KCNQ2 (EMBL/GenBank/DDBJ accession no. AF110020) and KCNQ3 (EMBL/GenBank/DDBJ accession no. AF091247), provided by David McKinnon (State University of New York, Stony Brook, NY), were subcloned into the pcDNA3 expression plasmid (Invitrogen). A plasmid containing mouse M1 muscarinic receptor was provided by Neil Nathanson (University of Washington, Seattle, WA). Plasmids with cloned human RGS2 and constitutively active forms of human Gαq (Q209L), human Gα11 (Q209L), and human Gα13 (Q226L) were obtained from the Guthrie Research Institute. The plasmids encoding KCNQ2 and KCNQ3 subunits, the muscarinic M1 receptor, and sometimes the Gα-subunits were transiently cotransfected into human tsA-201 cells (tsA; derived from HEK293 cells) using lipofectamine 2000 (Life Technologies), together with cDNA-encoding green fluorescent protein (GFP) as a marker for successfully transfected cells (Shapiro et al., 2000). The 2-ml transfection medium usually contained 0.1 μg of GFP cDNA and 1 μg of each of the other cDNAs. The next day, the cells were plated onto poly-l-lysine–coated coverslip chips, and fluorescent cells were studied within 2 d in electrophysiological experiments.
Confocal Imaging
For the fluorescence measurements of PLC activation, we used a fluorescent indicator of PIP2 and IP3. The tsA cells were cotransfected with 0.25 μg cDNA for PHPLC-δ1-EGFP (PH-EGFP) (gift of Tobias Meyer, Stanford), 1 μg cDNA for M1 receptors, and 2 μg cDNA for Gα-subunits, if used, then transferred to poly-l-lysine–coated glass coverslips. 1 or 2 d after transfection, the coverslips were mounted in a perfusion chamber designed for a Leica TCS NT inverted confocal microscope. Live cells were imaged using a 63× water objective at 23°C. Control images were obtained for 1 min before drug application. The agonist oxo-M (10 μM) was applied by gravity feed. Images were processed with Metamorph (UIC) and Igor Pro (WaveMetrics) to obtain the time course of the average fluorescence intensity F in a cytoplasmic region normalized to the average intensity for 30 s before agonist application F o (F/F o). In one control experiment, confocal immunocytochemistry was used with fixed cells and anti-KCNQ2 and -KCNQ3 antibodies to ascertain trafficking of KCNQ channel subunits, as described (Roche et al., 2002). The cells were observed with a BioRad MRC 600 microscope.
Current Recording and Analysis
The whole-cell configuration of the patch-clamp technique was used to voltage-clamp and dialyze cells at 22–25°C. Electrodes pulled from glass micropipette tubes (VWR Scientific) had resistances of 1.3–2.5 MΩ. The whole-cell access resistance was 2–4 MΩ, and series-resistance error was compensated >60%. Fast and slow capacitances were compensated before the applied test-pulse sequences. When measuring the rates of induction and recovery from muscarinic inhibition of the current, we applied test and control solutions rapidly to the 100-μl chamber (flow rate of 1.5 ml/min) in the vicinity of the recorded cell. Tests using junction-potential measurements on an open pipette showed that solutions changed with a mean exponential time constant of 2.4 s, and the change began with a 4–8 s delay after the command that switches the valve. Thus, there is an uncertainty of at least 4 s about the time of beginning (but not the duration) of the agonist exposure. In the figures, the bar representing solution change is usually drawn 8 s after the electronic command occurred. In separate experiments, we estimated the dialysis time for substances included in the whole-cell pipette by measuring the time course of fluorescence rise of cells after breakthrough with a pipette containing the fluorescent dye, indo-1. For indo-1 (M.W. = 645) the diffusion had an exponential time constant, τ ∼120 s. As GDP and GTP analogues have similar molecular weights (460–540), we assumed that they also exchange into the cell with the same time constant as indo-1.
Currents were monitored by holding the cell at −20 mV and applying a 500-ms hyperpolarizing step to −60 mV every 4 s. For brevity, we will call the current from expressed KCNQ2 and KCNQ3 subunits, KCNQ current. The amplitude of the KCNQ current usually was defined as the outward current at the −20-mV holding potential sensitive to block by 30 μM of the channel blocker linopirdine. Time courses give the KCNQ current plotted every 4 s, except where noted. The agonist oxo-M was always applied at 10 μM unless noted. In most experiments with pipette solutions containing nucleotide analogs, we waited >300 s after breakthrough before applying oxo-M to allow time for the dialysis of the analogues into the cytoplasm.
Solutions and Materials
The external Ringer's solution used for current recording and confocal observations contained (in mM): 160 NaCl, 2.5 KCl, 2 CaCl2, 1 MgCl2, 10 HEPES, and 8 glucose, adjusted to pH 7.4 with NaOH. The standard pipette solution contained (in mM): 175 KCl, 5 MgCl2, 5 HEPES, 0.1 1,2-bis(2-aminophenoxy)ethane N,N,N′,N′-tetraacetic acid (BAPTA), 3 Na2ATP, and 0.1 Na3GTP, titrated to pH 7.4 with KOH (free [Mg2+] estimated as 2.1 mM, WinMaxc program v2.05, www.stanford.edu/~cpatton/maxc.html). Variations on this solution are noted in text. The “Mg2+-free” pipette solution had 1 mM EDTA and no added Mg2+, corresponding to an estimated free [Mg2+] of 14 nM, assuming a 10 μM Mg2+ contamination. Pipette solutions said to contain 100 μM AlF4 − had 100 μM AlCl3 and 10 mM NaF. Reagents were obtained as follows: oxotremorine methiodide (oxo-M) (Research Biochemicals); BAPTA (Molecular Probes); Dulbecco's minimum essential medium, fetal bovine serum, lipofectamine 2000, and penicillin/streptomycin (Life Technologies); ATP, GTP, guanosine-5′-O-(2-thiodiphosphate) (GDPβS), GppNHp, GTPγS, GDP, linopirdine, adenosine-5′-O-(2-thiodiphosphate) (ADPβS), AlCl3, NaF, and atropine (Sigma-Aldrich).
Data Analysis
Data acquisition and analysis used Pulse/Pulse Fit 8.11 software in combination with an EPC-9 patch-clamp amplifier (HEKA). Further data processing and statistical analysis were performed with Excel (Microsoft) and Igor Pro. Time constants were measured by exponential fits. All quantitative data are expressed as mean ± SEM and the number of observations is shown in parentheses in the histograms. Comparison between two groups was analyzed using Student's unpaired t test, and differences were considered significant at a level P < 0.05.
Kinetic Modeling
When the experiments were finished, we sought to represent the results in a self-consistent kinetic model. Like Xu et al. (2003), who simulated cellular breakdown of PIP2, we used the Virtual Cell environment of the National Resource for Cell Analysis and Modeling, University of Connecticut Health Center (http://www.nrcam.uchc.edu). In this JAVA-based simulation environment, components and their reactions are added through a graphical interface, initial conditions are stated, and the ordinary differential equations are generated and integrated automatically in time by a variable time-step, fifth-order, Runge-Kutta-Fehlberg routine. The working model with control values of rate constants and initial conditions is available at that web page for public use and modification.
RESULTS
Gq Couples to PIP2 Hydrolysis and KCNQ Current Inhibition in tsA Cells
In our expression system, the exogenously expressed M1 receptors should couple to endogenous G-proteins of the Gq family, which would activate endogenous PLC. We have shown in this system that M1 receptor–coupled cleavage of PIP2 suppresses the KCNQ K+ current of exogenously expressed KCNQ2/KCNQ3 channels and evokes intracellular Ca2+ release by an IP3-dependent pathway (Shapiro et al., 2000; Suh and Hille, 2002). We start by confirming that PLC is coupled to Gq in these cells.
TsA cells were transfected with the PH-EGFP probe and M1 receptors, with or without constitutively active, mutant forms of G-protein α subunits. As expected, the PH-EGFP probe, which has affinity for membrane PIP2 and cytoplasmic IP3, was concentrated mainly at the cell surface in unstimulated control cells (circumferential dark regions in top left panel of Fig. 1 A). Bath application of oxo-M led to a rapid translocation (time constant, τ = ∼13 s) of the fluorescent probe from the membrane to the cytoplasm (Fig. 1, A and B). This translocation was slowly reversed after removal of oxo-M, recovering on average by 63% in ∼100 s (Fig. 1 B). However, when cells were cotransfected with a constitutively active Gαq subunit (Gαq*), most of the PH-EGFP probe was already found in the cytoplasm in resting cells, and additional incubation with oxo-M did not change the distribution of fluorescence (Fig. 1, A and B). Similarly, transfection with a constitutively active mutant of another Gq family protein, Gα11*, induced a cytoplasmic distribution of PH-EGFP in resting cells, and there was no further movement of the probe with oxo-M. As a control, transfection with constitutively active Gα13* did not displace PH-EGFP from the membrane or prevent the translocation seen with oxo-M (although the induced translocation was weaker). These data indicate that exogenous Gαq* and Gα11*, but not Gα13*, can couple to PLC to activate potent PIP2 hydrolysis in tsA cells.
Figure 1.

Constitutively active Gq proteins and RGS2 alter PIP2 hydrolysis in transfected tsA cells. (A) Fluorescence images of the PH-EGFP probe in control and oxo-M–stimulated cells shown in negative contrast (fluorescence is dark). Cells were transfected with PH-EGFP with or without (None) a constitutively active Gαq (Gαq*), Gα11 (Gα11*), or Gα13 (Gα13*), and translocation of the probe was monitored by confocal microscopy. Images in the right column were taken 60 s into a 180-s application of 10 μM Oxo-M to the bath. Black circles in the top panels represent cytoplasmic areas selected for calculation of mean fluorescence intensity F. The cell nucleus is made evident by the oxo-M treatment in the top and bottom panels where there is transiently more probe in the cytoplasm than in the nucleus. One can see that the cytoplasm is a narrow, irregular strip around a large nucleus. Probe molecules in the cytoplasm can enter the nucleus slowly and have already equilibrated in the middle two panels where constitutive PLC activation has occurred for hours. (B) Summary time course of cytoplasmic fluorescence ratios (F/F o) upon addition of oxo-M (bar and dashed box), as in A. Mean ± SEM for images taken every 5 s. (C) Fluorescence of PH-EGFP in cells transfected with RGS2. Cells were cotransfected with PH-EGFP and RGS2, and images were taken as in A. (D) Summary time course of cytoplasmic fluorescence ratios.
Signaling via G-proteins can be depressed by protein regulators of G-protein signaling, RGS proteins. They bind to the activated Gα subunit and reduce signaling (Hollinger and Hepler, 2002). One RGS protein, RGS2, is selective for the Gq family and interferes specifically with receptor signaling mediated by Gαq (Heximer et al., 1997, 1999; Bernstein et al., 2004). We used it here to further document the involvement of Gq in muscarinic signaling in tsA cells. As shown in Fig. 1 C, expressing RGS2 had little effect on the resting localization of PH-EGFP, which was concentrated at the plasma membrane. However, the RGS2-expressing cells showed no translocation of PH-EGFP from the membrane during oxo-M treatment (Fig. 1, C and D). Thus, RGS2 abolishes muscarinic signaling to PLC.
Parallel experiments were done using the KCNQ current as an indicator of PLC activation. The cells were transfected with M1 receptors, KCNQ subunits, and GFP instead of PH-EGFP as a transfection marker. Fig. 2 A, top left, shows a typical time course of KCNQ current as oxo-M is perfused in the bath for 180 s and then removed. The current is nearly fully suppressed within 12 s (sample points are 4 s apart) in oxo-M and recovers over several hundred seconds after oxo-M is removed. In the control cells, current at −20 mV averaged 923 ± 328 pA (n = 10) and was almost completely inhibited by oxo-M stimulation (Fig. 2, A and B). It recovered slowly to 572 ± 256 pA after washout of the agonist. By contrast, in cells expressing constitutively active Gαq*, KCNQ channel activity was essentially absent. The currents were similar to those seen in tsA cells not transfected with KCNQ2/KCNQ3 subunits. One explanation for the lack of KCNQ current in these cells might have been that expression of Gq* prevented the trafficking of KCNQ channels to the cell membrane. This possibility was ruled out by control immunocytochemical experiments using antibodies against KCNQ2 and KCNQ3 proteins. In control cells, immunoreactivity for both antibodies was distributed almost entirely at the cell surface and superpositions showed complete overlap of KCNQ2 and KCNQ3 (Fig. 2 C). In Gq-expressing cells the distribution of immunoreactivity was indistinguishable from that in control cells. KCNQ currents were also absent with expression of Gα11*, but not with Gα13*. However, with Gα13* expression, the action of oxo-M was somewhat slowed and reduced, both as measured by PH-EGFP translocation and by KCNQ current suppression. Likewise, in electrophysiological experiments, RGS2 severely attenuated agonist-induced suppression of KCNQ currents (Fig. 2, D and E). Inhibition by oxo-M was only 16 ± 6% (n = 8). Taken together, these results show that our confocal and electrophysiological indicators of PLC activity do reflect the activity of G-proteins of the Gq family and that Gq* is sufficiently active to abolish KCNQ current and PH-EGFP binding to the plasma membrane.
Figure 2.
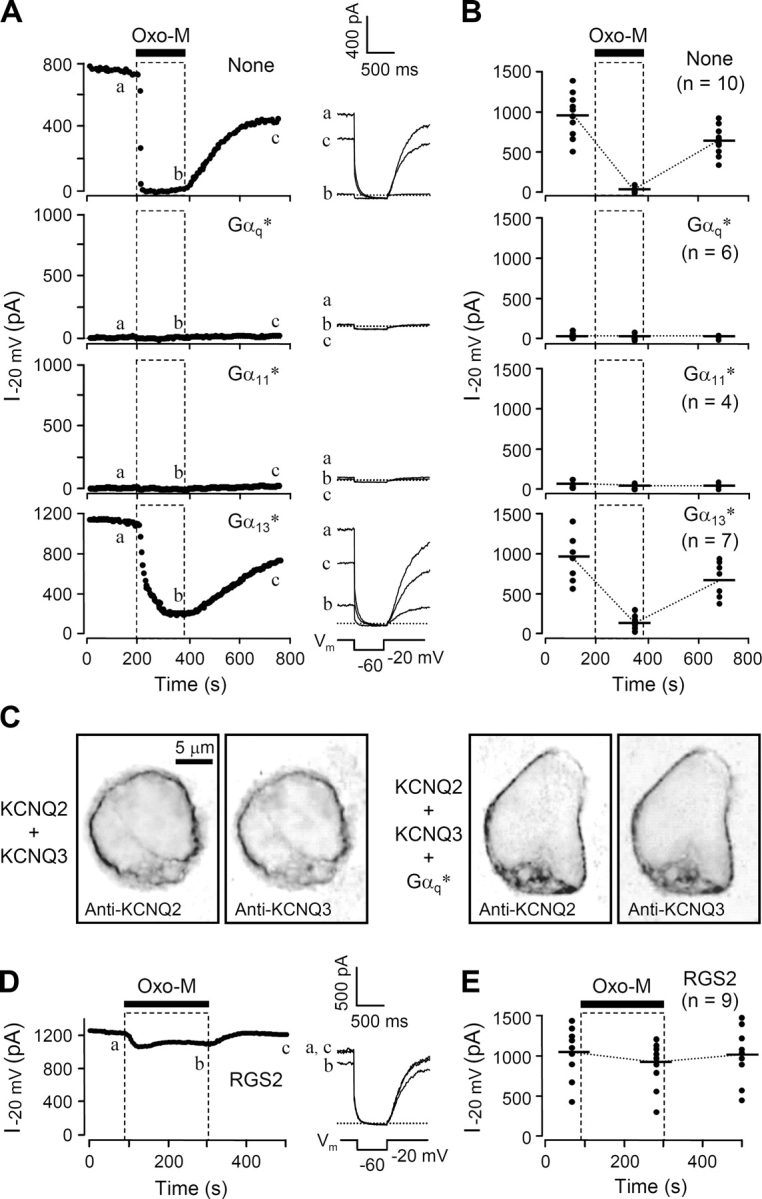
Constitutively active Gq proteins and RGS2 alter KCNQ current. (A) Representative time courses of whole-cell current in cells transfected with M1 muscarinic receptor and KCNQ2/KCNQ3 channel subunits, without (None) or with constitutively active Gα subunits (G*). Oxo-M (10 μM) was bath applied for 3 min, and the current measured at −20 mV every 4 s. The inset shows selected current traces (at times a, b, c) with a dashed line at zero current. (B) Summary of KCNQ current regulation during expression of constitutively active G-proteins. The relative current at the selected time points was measured (symbols) from the indicated number of cells, and the average value is presented as a horizontal bar. (C) Confocal immunocytochemical images of cells stained with anti-KCNQ antibodies. Images are shown in inverted contrast with fluorescence being dark. The four panels show anti-KCNQ2 and -KCNQ3 in control cells and anti-KCNQ2 and -KCNQ3 in cells cotransfected with Gq*, respectively. (D) Representative time course of whole-cell current in RGS2-transfected cells, showing a reduced response to oxo-M. (E) Summary of KCNQ current changes in RGS2-transfected cells.
GDPβS Slows and Reduces Suppression of KCNQ Current
The canonical G-protein activation cycle starts with receptor (R)-catalyzed dissociation of GDP from the G-protein, followed by binding and, eventually, hydrolysis of GTP that regenerates the GDP-bound G-protein (Schramm and Selinger, 1984; Stryer, 1986; Gilman, 1987). This continual recycling can be interrupted if the transient, nucleotide-free form of the G-protein (G) binds other nucleotides or nucleotide analogs, competitively altering the course of activation (simplified in Scheme I):
SCHEME I.

Previous studies on sympathetic ganglion neurons showed that intracellular dialysis of GDPβS slows and decreases receptor-mediated suppression of M-current (Pfaffinger, 1988; Brown et al., 1989), presumably by sequestering Gq in the inactive Gq·GDPβS form. Fig. 3 A illustrates such changes in our system, comparing tsA cells dialyzed with 0.1 mM GTP (control), or 1 mM GDPβS alone, or a mixture of the two. With the standard 0.1 mM GTP in the pipette, steady bath application of oxo-M suppressed the KCNQ current almost completely, with a time constant τ of 7.6 ± 1.7 s (n = 20) (time constants summarized in Fig. 3 B). With 1 mM GDPβS and no GTP in the pipette, the fast component of inhibition was slowed approximately sixfold (τ = 44 ± 6 s; n = 7; P < 0.001 compared with GTP alone) and reached only 81 ± 5% after 5 min of oxo-M. In mixtures of GTP and GDPβS, the slowing was graded with the fraction of GDPβS. On the other hand, addition of GDP, GppNHp, or ADPβS to the pipette without GDPβS did not reduce either the rate or completeness of oxo-M–induced channel inhibition (Fig. 3 B). GDP alone is not expected to support receptor-mediated activation of G-proteins, but we suppose that GDP was phosphorylated to GTP as it entered the cytoplasm in these experiments (see Suh and Hille, 2002).
Figure 3.
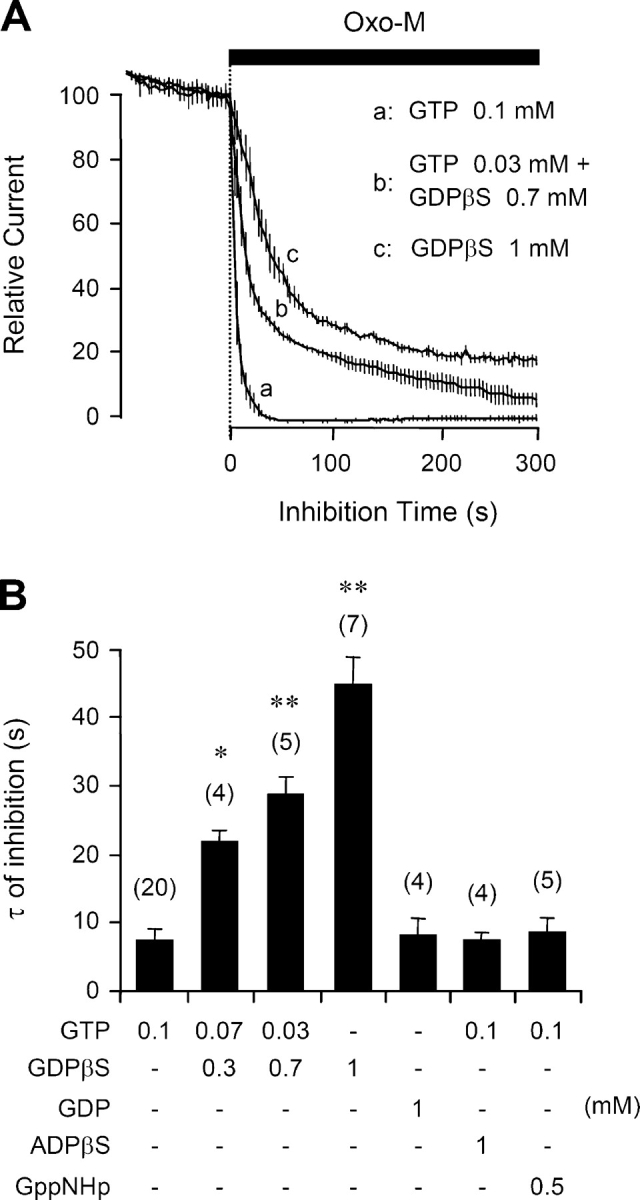
GDPβS decreases muscarinic inhibition of KCNQ current. (A) Muscarinic modulation of KCNQ current with different combinations of GTP and GDPβS in the pipette solution. Oxo-M was applied for 5 min and the current is given as mean ± SEM values relative to the preapplication level (n = 5–20). (B) Summary of the time constants of muscarinic inhibition (τ) with different nucleotide analogues in the pipette solution. *, P < 0.01 and **, P < 0.001, compared with 0.1 mM GTP alone.
Cytoplasmic GDPβS slows all aspects of muscarinic inhibition: onset, turn off, and recovery. In control cells perfused with 0.1 mM GTP, a 4-s exposure to oxo-M suffices to suppress the KCNQ current by 89 ± 5% (n = 4); the suppression reaches a peak within a few seconds after oxo-M is washed off; and the current recovers within a few hundred seconds (Fig. 4 A, top left, open circles). With GDPβS, the same oxo-M treatment gives only 5–15% inhibition (filled circles). Muscarinic inhibition increases in a graded manner with longer oxo-M exposures, and a 40-s exposure is needed for half-maximal inhibition. Unexpectedly, with the shorter oxo-M exposures, the development of current suppression continued long after oxo-M was removed (Fig. 4 A, top). Even for short exposures, the inhibition kept developing with a 40-s time constant after oxo-M is removed (Fig. 4 B, bottom). In GDPβS-treated cells, it appears that the G-protein–signaling pathway is activated only weakly, yet it takes a long time to shut down, and recovery is weak and slow. We argue later that the delayed action can arise because when GDPβS dissociates from the inactive G·GDPβS complex, the free G-protein eventually becomes activated by binding GTP. An alternative interpretation would be that oxo-M takes tens of seconds to dissociate from the receptor. This is unlikely since after 40 s of 10 μM oxo-M, the control trace recovers much faster than the GDPβS trace, crossing it. An additional experiment, using only 0.2 μM oxo-M to mimic the smaller net current suppression seen with GDPβS, also showed rapid recovery (Fig. 4 A).
Figure 4.

GDPβS slows and reduces muscarinic inhibition and recovery of KCNQ current. (A) KCNQ currents during applications of 10 μM oxo-M lasting 4, 40, 80, or 180 s. The control cells (open circles and triangles) have the standard 0.1 mM GTP pipette solution. In each panel, the test cells (filled circles) have 1 mM GDPβS without GTP in the pipette solution. Each trace is a different cell. One extra control trace in the 40-s panel (open triangles) shows the action of 40 s of 0.2 μM oxo-M. (B) Summaries of the maximum amplitude and time constant of muscarinic inhibition of current. Oxo-M was applied for 4, 20, 40, 80, 180, or 300 s to cells dialyzed with the GDPβS-containing pipette solution.
Removing Intracellular Mg2+ Retards and Reduces Suppression of KCNQ Current
Intracellular Mg2+ is necessary for activation of G-proteins. After GDP dissociates from the inactive G-protein and GTP or a GTP analogue binds, Mg2+ promotes a nearly irreversible conformational change to the active state and thereby stabilizes the nucleotide binding to the G-protein (Higashijima et al., 1987a,b). The conformational change includes loss of the Gβγ-subunits. Expanding part of simplified Scheme I gives Scheme II:
SCHEME II.

In addition, Mg2+ is necessary for the subsequent hydrolysis of GTP by the G-protein (Higashijima et al., 1987a). Note that in Scheme II, the first three states of the G-protein refer to the Gαβγ heterotrimer whereas the final active state contains only Gα.
To look for similar roles for Mg2+ in receptor-mediated channel modulation, we dialyzed cells with Mg2+-free or low-Mg2+ pipette solutions and monitored oxo-M–mediated suppression of KCNQ current. As we have seen with the standard pipette solution containing 5 mM total Mg2+ (2.1 mM free), oxo-M normally reduces the current with a 7.6-s time constant. However, eliminating the Mg2+ and including 1 mM EDTA in the pipette slowed muscarinic inhibition fivefold, τ = 38 ± 5 s (P < 0.001 compared with control, n = 13) (Fig. 5 A, left) and delayed its onset. We argue later that the delay and slowing reflect the slowness of the last step in Scheme II in low Mg2+ so that it now takes many tens of seconds on average to activate a G-protein. Fewer active G-protein complexes are formed per unit time and activation of PLC is much reduced and delayed. Despite the slowing of inhibition, the Mg2+-free pipette solution reduced the final extent of inhibition only a little (Fig. 5 B).
Figure 5.

G-protein–mediated inhibition of current requires intracellular Mg2+. (A) Inhibition of currents in cells dialyzed with the 5-mM added Mg2+ pipette solution (open circles) or with EDTA and no added Mg2+ (filled circles). The pipette solutions contained 0.1 mM GTP (left) or 1 mM GDPβS (right). (B) Summary of muscarinic inhibition of the current after dialysis with different combinations of guanine nucleotide analogues and different Mg2+ concentrations. (C) Inhibition of current by a 20-s oxo-M stimulation with Mg2+-containing (control) or Mg2+-free (EDTA) pipette solution. (D) Summary of time constants (τ) for muscarinic inhibition with different Mg2+ and Ca2+ concentrations in the pipette. Oxo-M was applied for 20 s. The Mg2+ values given are the added amounts; the free Mg2+ for these solutions is given in the text.
Although the molecular mechanisms of action are different, the effects of Mg2+-free pipette solutions on the rate and amount of current suppression resembled those of GDPβS. They each delay one of the sequential steps toward the formation of the final active form of Gq after receptor activation. Interestingly, when the Mg2+-free condition and GDPβS dialysis were combined, oxo-M no longer inhibited KCNQ current (Fig. 5 A, right, and B).
The pipette Mg2+ concentration also affected recovery of KCNQ current after short oxo-M exposure (Fig. 5 C). With the standard Mg2+-containing pipette solution, 20 s of oxo-M treatment suppressed current rapidly, and then the current recovered on average to a level of ∼70% (n = 7) of the preagonist value by 7 min after washout of the oxo-M (see also Suh and Hille, 2002). However, when the intracellular Mg2+ was absent there was no recovery after washout of oxo-M. In these experiments, as with GDPβS, the onset of inhibition was delayed, the time course of inhibition (τ = 46 ± 8 s, n = 5) was slowed, and suppression of current continued to develop long after oxo-M was removed. We interpret the prolonged action and the lack of recovery to a combination of slowed synthesis of PIP2 (Porter et al., 1988) and a slowed GTPase rate (Higashijima et al., 1987b) that prolongs the active state of a small population of Gq.
In the experiments of Fig. 5, A–C, the free Mg2+ in the pipette was reduced to the low nanomolar range by adding EDTA. Intermediate reductions could be obtained without EDTA by adding less than the standard 5 mM Mg2+ to the solution. Here ATP is the principal Mg2+ buffer. The first four solutions in Fig. 5 D have 5, 2, 1, and 0.3 mM added Mg2+ and 2,100, 110, 31, and 7 μM free Mg2+. With 110 μM free Mg2+, the time course and magnitude of oxo-M inhibition were nearly normal, but recovery was already somewhat reduced, whereas, with 7 μM free Mg2+, the inhibition was appreciably slowed (Fig. 5 D), the magnitude was still nearly normal, but recovery was nearly absent.
GTP Analogues and AlF4 − Can Activate Gq Spontaneously
G-proteins can be activated slowly without receptor stimulation by exposure to poorly hydrolyzable GTP analogues (GTPγS, GppNHp) or to AlF4 −. After spontaneous dissociation of GDP from the G-protein, the poorly hydrolyzable analogues can react with free G as in Schemes I and II to capture the G-protein in a stable active form. On the other hand, AlF4 − reacts directly with and requires the GDP-bound form to occupy the site for the γ phosphate of GTP (Bigay et al., 1987; Sondek et al., 1994; Scheme III):
SCHEME III.

We measured the apparent rates of these reactions by including 0.1 mM of the GTP analogues or of AlF4 − in the pipette, without GTP (Fig. 6 A, left). In each case, the current gradually became completely suppressed over 100–800 s (note differing time scales) without any applied agonist. When fitted with single exponentials, spontaneous suppression developed with time constants τ = 63 ± 4 s (n = 6) for AlF4 −, 98 ± 7 s (n = 6) for GTPγS, and 346 ± 29 s (n = 5) for GppNHp. AlF4 − is the fastest, presumably because it does not require GDP dissociation (Scheme III). GppNHp is the slowest, indicating that it reacts more slowly with nucleotide-free G-protein than GTPγS does (or forms a less efficacious active form). Addition of equimolar GTP together with the GTP analogue to the pipette slows and attenuates the action of GTPγS and GppNHp strongly (Fig. 6 A, right). The slowing is graded with the ratio of GTP analogue to GTP (Fig. 6 B), reflecting a competition for nucleotide-free G as expressed in Scheme I. The action of AlF4 − is not slowed by GTP, confirming that it does not compete for free G with GTP as in Scheme III.
Figure 6.

Agonist-independent inhibition of KCNQ current with G-protein activators. (A) Spontaneous rundown of KCNQ current with 0.1 mM of a nonhydrolyzable GTP analogue, GTPγS or GppNHp, or with 0.1 mM AlF4 − in the pipette solution (n = 4–7). For the left panels there was no added GTP in the pipette solution. For the right panels there was 0.1 mM GTP. The records start (t = 0) ∼20 s after breakthrough. (B) The spontaneous rate of inhibition (initial slope) depends on the ratio of GTPγS to GTP. The midpoint of the curve is at a ratio of 3.6. (C) The spontaneous inhibition rate depends on the concentration of GTPγS in the pipette (no added GTP) (n = 4–7).
The recordings in Fig. 6 began ∼20 s after the moment of breakthrough to the whole-cell configuration. In evaluating them, we need to consider that, during the first minutes, the concentration of the reagents dialyzing from the pipette is gradually increasing in the cytoplasm (τ = ∼120 s for GTPγS or GppNHp) and any endogenous nucleotide is leaving. The slowness of this diffusional exchange might have delayed the initial reaction with GTPγS or AlF4 −, but it probably did not affect GppNHp, which is intrinsically slower to react. One check was to repeat the GTPγS experiments with different pipette concentrations of GTPγS (Fig. 6 C). Indeed, the rate of suppression of KCNQ current was slower for 0.05 mM GTPγS and faster for 0.3 and 1 mM GTPγS (Fig. 6 C).
In agreement with Schemes I and II, the spontaneous suppression of KCNQ current with GTPγS is slowed by including either GDPβS-containing or Mg2+-free solutions in the pipette (Fig. 7, A and B). Also in agreement with predictions, the spontaneous action of AlF4 − is not slowed by GDPβS, although it is slowed by Mg2+-free pipette solutions.
Figure 7.

Spontaneous current rundown with G-protein activators is retarded by GDPβS and by Mg2+-free pipette solutions. (A) GDPβS blocks agonist-independent channel inhibition by nonhydrolyzable GTP analogs. Cells were dialyzed with 1 mM GDPβS plus 0.1 mM GTPγS, GppNHp, or AlF4 − (solid lines with error bars show mean ± SEM current; n = 5–8). Solid line (lowest line) shows the current inhibition without GDPβS taken from Fig. 7 A, and the dashed line (highest line) shows the control rundown when there is 0.1 mM GTP and no GTP analogue or AlF4 − in the pipette. (B) Removal of intracellular Mg2+ (EDTA) slows the GTPγS- and AlF4 −-mediated inhibition. The pipette solution contains 1 mM EDTA and 0.85 mM CaCl2 (lines with error bars are mean ± SEM current; n = 5). Bottom line is a representative trace with 5 mM Mg2+ and no EDTA in the pipette.
Nucleotide Analogues Can Diminish or Potentiate Muscarinic Action
Dissociation of GDP, the first step of Schemes I and II, is catalyzed by activated receptors. The subsequent capture of the nucleotide-free G-protein by GTP and Mg2+ then increases the fraction of active G-proteins and hence the physiological output of muscarinic signaling. By trapping G-proteins in an inactive form, GDPβS diminishes the receptor-evoked physiological output, and by forming an active G-protein that is long lasting, poorly hydrolyzable GTP analogues augment the physiological output. In these ways, nucleotide analogues should shift the effective dose–response curve for the oxo-M–induced suppression of KCNQ current. Since AlF4 − reacts with the GDP form of G-proteins in an agonist-independent manner, its effect on the dose–response curve would be different.
To determine agonist dose–response curves, we measured the ability of various concentrations of oxo-M to reduce KCNQ current when some of the GTP in the pipette was replaced by other analogs. Consider, for example, the three traces for addition of 0.1 μM oxo-M in Fig. 8 A. With GTP in the pipette (top), 0.1 μM oxo-M gives almost 50% reduction of KCNQ current. As expected, GDPβS (middle) decreased the apparent potency of 0.1 μM oxo-M in comparison to GTP, whereas GTPγS (bottom) enhanced it greatly. Fig. 8 B shows the resulting dose–response curves for current inhibition measured after 3 min in agonist. The EC50 values for channel inhibition differ by more than two orders of magnitude: 1.1 μM, 103 nM, and 5 nM for GDPβS/GTP, GTP, and GTPγS/GTP in the pipette solution. In each case, the rate of current suppression fell as the oxo-M concentration was decreased (Fig. 8, C and D). As in Fig. 3, the initial inhibition rate was greatly slowed when GDPβS was present in the pipette, whereas it was not changed with GTPγS. Additional experiments showed that the effective dose–response relation also could be shifted to the left by GppNHp in the pipette solution (to 76 nM with 0.05 mM GppNHp + 0.05 GTP), but not by AlF4 − (102 nM with 0.01 mM AlF4 − + 0.1 mM GTP). Overall, these results emphasize the mechanistic differences of the G-protein reaction with AlF4 − as compared with the reactions with GTP, GTPγS, or GppNHp. They also reemphasize that the EC50 of the dose–response curve for physiological outputs is not a direct measure of receptor occupancy for a G-protein–coupled receptor. The EC50 is the bottom line of a long cascade of events and can be altered over orders of magnitude by agents that may have little effect on receptor occupancy.
Figure 8.

Nucleotide analogues shift the dose–response relationship for muscarinic inhibition of current. (A) Typical time courses of muscarinic inhibition of KCNQ current by different oxo-M concentrations when the pipette contains GTP or GTP plus a nucleotide analogue as marked. (B) Dose–response relations for inhibition after 180 s in various concentrations of oxo-M (n = 3–10). (C) The time constant for oxo-M inhibition depends on the oxo-M concentration and the presence of nucleotide analogues (n = 3–10). (D) The time constant for oxo-M inhibition does not depend on the GTPγS/GTP ratio, which was changed by including concentrations of 0/100, 50/50, and 80/20 μM, respectively (n = 5–6).
RGS2 Blocks G-protein–coupled Inhibition of KCNQ Current
Expression of RGS2 had profound effects on current modulation. It prevented the spontaneous suppression of KCNQ current that normally develops in cells dialyzed with the G-protein activators GTPγS or AlF4 − (Fig. 9 A). In addition, RGS2 potently attenuated the receptor-mediated suppression of current in cells dialyzed with GTPγS, even allowing some recovery (Fig. 9 B). These results indicate that G-proteins of the Gq family (the targets of RGS2) are required for the actions of GTPγS and AlF4 − here.
Figure 9.

RGS2 blocks spontaneous inhibition by GTPγS and AlF4 −, forms of inhibition that are not governed by GTP hydrolysis. (A) Time course of current in RGS2-expressing cells dialyzed with 0.1 mM GTPγS or AlF4 − (solid lines and error bars show mean ± SEM; n = 5–7). The lower, solid line is the average spontaneous inhibition in cells not expressing RGS2. (B) Time course of current inhibition by oxo-M in cells dialyzed with 0.02 mM GTP plus 0.08 mM GTPγS in the pipette solution. Oxo-M was applied twice for 20 s. Top panel is a cell not transfected with RGS2, and lower panel is a cell transfected with RGS2.
A Working Model for Gq Coupling to KCNQ Current Inhibition
The putative signaling pathway from M1 muscarinic receptors to KCNQ current modulation is complex, and the perturbations we have made could affect several intermediate steps. It therefore seemed worthwhile to test our understanding by an explicit kinetic model incorporating all of the postulated steps (Fig. 10). We wanted to see how far the full range of our observations could be explained by assembling simple concepts and kinetic measurements from the literature into a larger model. We consider this model a first approximation to be refined by future experiments. It has three conceptual components: First, the G-protein cycle of Gq and several side reactions with nucleotide analogues determine the number of active G-proteins. Then, phosphoinositide synthesis and breakdown determine PIP2 levels. Finally, the PIP2 level in the membrane governs the KCNQ current amplitude.
Figure 10.

Kinetic model used to simulate muscarinic modulation of KCNQ current. The model comprises a G-protein cycle (top), PI metabolism (below), and interaction of PIP2 with KCNQ channels (bottom). Most steps in the model have conventional first-order or second-order chemical kinetics with rate constants summarized in Table I. Further details are given in the . The rate constant k 40 is defined for the GTPase reaction from right to left, and all other rate constants (e.g., k 10, k 20, k 30) are for reactions going from left to right. The reverse reactions, if they are present (see direction of arrowheads) take a negative sign, e.g., k −10, k −20. The model indicates dissociation of Gβγ from Gα during the Mg2+ binding step (step 30) and reassociation of Gβγ in the GTPase step (step 40) in lumped reactions. However, here we have ignored Gβγ as a species and do not keep track of its concentration. Therefore, none of the steps is kinetically affected by a “concentration” of Gβγ.
Before examining the model, we summarize what it can do. It was able to reproduce the following phenomena qualitatively: the time course of inhibition and recovery of KCNQ current during oxo-M exposure; spontaneous inhibition by GTP analogs; the competition among nucleotide analogues such that GDPβS slows and diminishes all modes of G-protein activation, except AlF4 −, and GTP opposes spontaneous inhibition by GppNHp; the shift of the dose–response curve by GDPβS and GTPγS; and the slowing of all modes of activation by Mg2+. Another valuable result was that formulating the model made apparent that the rates of many essential intermediate steps are not independently characterized in the literature. It allowed us to recognize the gaps in our knowledge.
Formulating the Model and Choice of Rate Constants
The full G-protein cycle is described in the top part of Fig. 10. The reactions are those in Schemes I, II, and III, and the rate constants are given in Table I. The literature provides biochemical measurements that suggest constraints on appropriate values for resting and stimulated cells. Nevertheless, many individual rate constants have not been studied, and in several cases our model constrains them very little. Frequently, the value chosen is tightly linked to values of other parameters, so that groups of parameters scale together. If one of them is fixed, then several others fall into place. Better values will await additional measurements. We did not use an automatic fitting program, so the parameter values are chosen by trial-and-error. We assumed that similar reactions should have similar rate constants.
TABLE I.
Model Rate Constants for tsA Cells at 23°C
| Step number | Mnemonic | Forward rate constant | Reverse rate constant |
|---|---|---|---|
| 01 | PI4K | 0.0004 μM−1 s−1 × ATPsat(1000) × (0.2 + 0.8 × Mgsat(20)) | NA |
| 02 | PIP5K | 0.06 μM−1 s−1 × ATPsat(300) × (0.2 + 0.8 × Mgsat(20)) | NA |
| 03 | PLC | 4.8 s−1 × (f Gactive + 0.00075) | NA |
| 04 | IP3Pase | 0.06 s−1 | NA |
| 05 | PIP2Pase | 0.005 s−1 × Mgsat(20) | NA |
| 06 | PIP2bind | 0.00045 d−1 s−1 | 0.25 s−1 |
| 10 | GDPdiss | 0.5 s−1 × (Oxosat(8) + 0.002) | NA |
| 14 | AlF4on | 0.0000007 μM−1 s−1 | 0.005 s−1 |
| 20 | GTPon | 0.45 μM−1 s−1 | 0.08 s−1 |
| 21 | GDPβSon | 0.28 μM−1 s−1 × (1 + 20 × Oxosat(8)) | 0.1 s−1 × (1 + 20 × Oxosat(8)) |
| 22 | GTPγSon | 0.006 μM−1 s−1 | 0.005 s−1 |
| 23 | GppNHpon | 0.00048 μM−1 s−1 | 0.005 s−1 |
| 30 | Mgon | 0.003 μM−1 s−1 | NA |
| 32 | Mgon | 0.002 μM−1 s−1 | NA |
| 33 | Mgon | 0.002 μM−1 s−1 | NA |
| 34 | Mgon | 0.002 μM−1 s−1 | NA |
| 40 | GTPase | 1.8 s−1 × Mgsat(10) | NA |
The values are given in the micromolar-micrometer-seconds units of Virtual Cell. The functions Oxosat(x), Mgsat(x), and ATPsat(x) are simple saturation functions of oxo-M, Mg2+, or ATP concentration, with an equilibrium dissociation constant x (in μM). Under our “physiological” conditions Mgsat(20) is about 0.99, ATPsat(300) is 0.91, and ATPsat(1000) is 0.75. The function f Gactive is (G·GTP·Mg2+ + G·GTPγS·Mg2+ + G·GppNHp·Mg2+ + G·GDP·AlF4 −·Mg2+)/200. d−1, reciprocal density = (molecules per square micrometer)−1.
The initial dissociation of GDP from G·GDP, step 10, is catalyzed by receptor (R) occupancy. This is represented as k 10 × (OxoSat + 0.002), where OxoSat is a simple saturation function for oxo-M binding to M1 receptors (Koxo = 8 μM), and 0.002 represents a minute basal activity of this step in resting cells (possibly constitutive receptor activity). In the absence of agonist, this spontaneous dissociation of GDP should be fast enough to allow GTPγS to turn off KCNQ current in ∼100 s. The kinetics of step 10 assumes instantaneous equilibration of agonist with M1 receptors, ignoring time dependence of agonist association and dissociation. Since dissociation of oxo-M from receptors probably takes <1 s, these events would be too fast to resolve with our solution exchange system. The quench-flow biochemical measurements of Mukhopadhyay and Ross (1999) give rates measured for the GTPase cycle of Gq with maximal M1 muscarinic stimulation and in the presence of PLC in a vesicle assay with purified proteins. In their work, the maximal steady-state rate of breakdown of GTP during full receptor activation (all around the cycle) is 0.4 moles GTP s−1 per mole Gq, and the individual rate constants equivalent to our k 10, k 20, and k 40 are 0.8 s−1, 5.3 × 10⁴ M−1 s−1, and 5.3 s−1 (all corrected to 23°C using a Q 10 of 2.5). We chose 0.5 s−1, 4.5 × 10⁵ M−1 s−1, and 1.8 s−1 for the same rate constants. In reconstituted systems, the GTPase activity of Gαq is accelerated almost 2,000-fold by interaction with PLC, i.e., PLC has a potent GTPase acceleratory activity for Gq (Ross, 1995; Biddlecome et al., 1996; Mukhopadhyay and Ross, 1999; Cook et al., 2000). In our model, the GTPase activity of active Gq (step 40) is given a value closer to that for a complex with PLC than for the GTP-bound G-protein alone. Step 30, the reaction of GTP-bound G-protein with Mg2+ was made fast and not rate limiting at 2,100 μM free Mg2+ (k 30 = 3 × 10³ M−1 s−1 here and 1.7 × 10⁴ M−1 s−1 in Higashijima et al., 1987b), but when Mg2+ is lowered to the low micromolar level, that step becomes rate limiting.
The lower part of Fig. 10 shows the second part of the model involving PIP2 synthesis and turnover. Steps 1 and 2 are PI-4-kinase and PIP-5-kinase. Both steps depend on Mg2+ and ATP concentrations, but unlike the model of Xu et al. (2003), we have not included any acceleration of these lipid kinase steps upon receptor activation. PIP2 is recycled back to PIP by PIP2 5-phosphatase, step 5. Step 3, the breakdown of PIP2 by the enzyme PLC, is activated by the active forms of Gq. It is represented by a rate expression that is simply proportional to the fraction of all active G-proteins (f Gactive) plus a small basal PLC activity (k 03 × [f Gactive + 0.00075]). This description ignores potential diffusional steps for occupied receptors to find G-proteins and for active G-proteins to find unoccupied PLC molecules. Our kinetic assumptions would be literally correct if the relevant receptors, G-proteins, and PLC molecules existed and remained in 1:1:1 stoichiometric complexes throughout, a concept that has been suggested for Gq and PLC (Biddlecome et al., 1996).
Finally, the readout of these events comes from KCNQ channels. The model assumes that PIP2 binds reversibly and relatively slowly (seconds) to saturable sites on KCNQ channels, step 6. Each channel has fourfold symmetry and probably binds a minimum of four PIP2 molecules per channel. We chose a power law with an exponent of 1.8 for the activation of the channel by the bound PIP2 (see ).
The level of PIP2 needed to keep KCNQ channels active should not be far below the resting level in the membrane, since the lag before channels begin to close during strong receptor activation is short. Thus, we chose a midpoint for KCNQ activation at 43% of the resting PIP2 level, which meant that KCNQ channels are 72% activated at the resting PIP2 level. The resting PIP2 level should be enough to make several micromolar IP3 if broken down all at once. We used a value of 5,000 μm–2 for PIP2 (McLaughlin et al., 2002; Xu et al., 2003), enough to make 5 μM IP3 in the cytoplasm and nucleus. With a 10 μM oxo-M stimulus, most of the PIP2 should be hydrolyzed by 15 s so that channels close. After agonist action, enough of the PIP2 should be restored in ∼300 s so that channels can reopen. When PIP2 synthesis is stopped (as with wortmannin), PIP2 levels should decay over 15 min (Willars et al., 1998) and KCNQ current should run down in that time (Suh and Hille, 2002). We chose nearly matching resting synthesis and breakdown of PIP2 at a rate that would turn over the entire PIP2 pool with an exponential time constant of 100 s. About half of this turnover goes via a futile cycle of PIP2 5-phosphatase back to PIP. Net replenishment of PIP2 all the way from PI would have a longer time constant (>200 s). If every G-protein could be simultaneously in an active state, the PLC rate would increase 1,330-fold over the basal level and the PIP2 pool would be hydrolyzed with a time constant of 210 ms. With the rate constants chosen and a 0.1 mM GTP solution in the pipette, only 21% of the G-proteins are simultaneously in the active G·GTP·Mg2+ state during a saturating agonist application, and only 13% during application of 10 μM oxo-M.
The Virtual Cell environment used in running the model (see materials and methods) uses a specific set of self-consistent units. Time is in seconds, and distance is in micrometers. Concentrations are in micromolar for cytoplasmic1 and extracellular molecules and in molecules per μm2 for membrane molecules. Translation from cytoplasmic concentrations to membrane concentrations for mixed reactions is done automatically and requires specification of a surface (μm2) to volume (μm3) ratio. The value we used, 0.6 μm−1, is appropriate, e.g., for a round cell of 10 μm diameter or a flattened square box 20 × 20 × 5 μm (with negligible organelle volume) and means that releasing 1,000 molecules μm−2 from the membrane would yield 1.0 μM in the cytoplasm and nucleus.
Results of the Model
We now describe the output of the model, starting with the control responses to oxo-M application. Fig. 11 A shows the modeled activation of Gq by a 5-s instantaneous step of 10 μM oxo-M. At rest, 99.9% of the 200 G-protein molecules per μm2 are in the inactive heterotrimeric G·GDP form. After the agonist step, a pool of active G-proteins develops with a half time of 0.49 s (reaching 26 active molecules per μm2 in the steady-state). In this steady-state, 46 GTP molecules μm−2 are being broken down per second, so 23% of the G-proteins are cycled from G·GDP to G, to G·GTP, to G·GTP·Mg2+, and back to G·GDP each second and 0.23 moles GTP s−1 is broken down per mole of Gq.
Figure 11.

Early events in receptor activation calculated from the model with control conditions. (A) G-proteins. A 5-s instantaneous application of 10 μM oxo-M (dashed lines) rapidly converts a fraction of the resting G·GDP pool (upper solid line, right axis) to the other G-protein forms (free G, G·GTP, and G·GTP·Mg2+, which is labeled Gactive here) (Gx, solid line, left axis). (B) Downstream effects. Time course of decline of inositol lipids PIP and PIP2 (solid lines) and KCNQ current (solid line with symbols at 4-s intervals to simulate experimental recordings) during a 10-s application of oxo-M (dashed lines). All values are normalized. Oxo-M rises and falls with a 2.4-s exponential delay (see ).
Fig. 11 B shows the consequences for PI turnover and KCNQ current. In this panel and in the remaining model figures, the rise and fall of the agonist (dashed lines) are assumed to have exponential time constants of 2.4 s as in our experiments (see materials and methods and ), rather than being instantaneous. After agonist is applied, the PIP2 is rapidly depleted (half time = 2.7 s) because PLC is active. In addition, PIP falls a little because PIP regeneration from PIP2 by PIP2 5-phosphatase slows as PIP2 is depleted. With a resting PIP2 pool of 5,000 μm−2 and an invariant PI 4-kinase producing 18 PIP molecules μm−2 s−1, PIP and PIP2 recover only slowly when agonist is removed. The KCNQ current responds to PIP2 changes nonlinearly and with a delay governed by the kinetics of the reversible phospholipid binding to the activation sites on the channel (step 06). Thus, the minimum of KCNQ current is reached after the minimum of PIP2. The literature contains no kinetic measurements that constrain our choice of rate constants for PIP2 binding. They simply must be fast enough to allow KCNQ current inhibition in ∼8 s.
Fig. 12 shows slowing and blocking of oxo-M action when a GTP-free, GDPβS solution exchanges into the cytoplasm (compare the experiments in Fig. 4 A). In these and subsequent simulations with internal reagents, the simulation included time-varying intracellular concentrations. Nucleotides are assumed to exchange with a 120-s time constant (see materials and methods and ) starting 300 s before the application of oxo-M. In this simulation, intracellular GTP is falling with time as GDPβS is rising. The ability of oxo-M to inhibit KCNQ current declines for both reasons, and with even longer oxo-M application (see Fig. 13 A), KCNQ current is already recovering in the presence of agonist because GTP has been dialyzed away. The model predicts the strong slowing of inhibition by GDPβS, but it does not predict the near lack of recovery, for which we suggest a biochemical explanation in discussion.
Figure 12.

Model calculations of GDPβS antagonizing muscarinic suppression of KCNQ current. The control (solid line with symbols at 4-s intervals) is calculated KCNQ current (left axis) for a 4-s agonist application. All other solid lines are current with 1000 μM GDPβS in the pipette assuming that dialysis started at t = −210 s. Oxo-M (dashed lines and right axis) is applied for 4, 40, 80, or 180 s starting at t = 90 s. Conditions chosen to mimic Fig. 4 A.
Figure 13.

Model calculations of low Mg2+ antagonizing muscarinic suppression of KCNQ current. (A) Breakthrough is at t = −260 s and agonist is applied for 300 s starting at t = 40 s. The four pipette solutions are the standard 5-mM added Mg2+ solution (Control) or Mg2+-free pipette solution (EDTA) with 0.1 mM GTP, or with 1 mM GDPβS. Conditions chosen to mimic Fig. 5 A. (B) Prolongation of G-protein activation in low Mg2+. Agonist is applied for 20 s starting at t = 40 s with control or Mg2+-free (EDTA) pipette solutions. Conditions chosen to mimic Fig. 5 C.
Fig. 13 simulates Mg2+-free intracellular solution (compare the experiments in Fig. 5, A and C). It is clear that the model predicts slowing and depression of agonist action (Fig. 13, A and B) and some continuing development of agonist action well after the agonist has been removed (Fig. 13 B). The low Mg2+ also intensifies the block by GDPβS (Fig. 13 A), but not as completely as was seen experimentally (Fig. 5 A).
Fig. 14 simulates the spontaneous inhibition of KCNQ currents with dialysis of intracellular GTP analogues or AlF4 − (compare the experiments in Fig. 6). Unlike in the experiments, spontaneous inhibition has a sigmoid time course for all three reagents. The figure shows that if 0.1 mM GTP is included in the pipette solution, the action of GppNHp is greatly slowed. As in the experiments, GTP did not affect the action of AlF4 − in the model (unpublished data).
Figure 14.

Model calculations of spontaneous suppression of KCNQ with G-protein activators. Breakthrough is assumed to occur at t = −20 s and traces start at t = −10 s. The pipette solutions contain 0.1 mM AlF4 −, GTPγS, or GppNHp (lower three traces). The top trace shows antagonism of 0.1 mM GppNHp by 0.1 mM GTP. Conditions chosen to mimic Fig. 6.
Fig. 15 gives the predicted dose–response relations for current suppression by oxo-M (compare experiments in Fig. 8 B). Qualitatively, the predicted effects of GDPβS and GTPγS in shifting the dose–response relation are appropriate, although the effects are not quite as large as in the experiments. In these simulations, KCNQ current continued to decline with time throughout the agonist exposure (unpublished data), rather than leveling out as in many traces of Fig. 8 B. In addition, with GTPγS, there was considerable spontaneous inhibition of current developing, so the trace with 1 nM oxo-M showed more total inhibition after 3 min than in the experiments.
Figure 15.

Calculated oxo-M dose–response relations for inhibiting KCNQ current. The pipette solutions contained either GTP alone or GTPγS- or GTPβS-containing mixtures to mimic Fig. 8 B. Time courses of current were calculated from the model during oxo-M application (not depicted) and the fractional inhibition measured after 180 s of oxo-M is plotted as symbols.
DISCUSSION
As others have shown (Ross, 1995), we find that signaling via Gq, can be described by the G-protein cycle of Fig. 10, the classical scheme developed for Gs, Gi/o, and transducin. The extent of activation of the signaling pathway depends on the balance between formation of nucleotide-free G-protein, followed by binding of GTP and Mg2+, versus the hydrolysis of GTP to GDP. Analogues act by competing with GTP for the nucleotide-free form. When cast as a kinetic model, many aspects of the observations are described qualitatively. Others have formulated at least partial models of e.g., visual phototransduction (for review see Arshavsky et al., 2002), inhibition of adenylyl cyclase activation by α2 receptors (Thomsen et al., 1988), and even M-current inhibition (Simmons and Mather, 1992). Of these, the phototransduction models rest on the most detailed in-cell kinetic measurements.
We first consider some details of the receptor/G-protein cycle and then consider PI metabolism and channel modulation. One of the key goals of making models is to uncover points of uncertainty. To indicate such areas, the discussion gives alternative kinetic assumptions that might be evaluated by future deeper experiments.
Muscarinic Receptors and Gq/11
A large body of evidence shows that G-proteins of the Gq/11 class (the classical activators of PLC) mediate muscarinic inhibition of M-current in neurons. This includes experiments with pertussis toxin, N-ethylmaleimide, antisense-generating plasmids, antibodies, knockout mice, and the knowledge that PLC is activated and necessary (Pfaffinger, 1988; Brown et al., 1989; Caulfield et al., 1994; Jones et al., 1995; Haley et al., 1998, 2000; Shapiro et al., 2000; Suh and Hille, 2002; Ford et al., 2003; Zhang et al., 2003). For our tsA cells, we have added mimicry by constitutively active Gαq* and full block by Gq-specific (Heximer et al., 1997, 1999) RGS2. Immunoblotting shows that Gq and G11 are present in superior cervical ganglion neurons (Caulfield et al., 1994).
Our model has neither feedback to receptors that changes their affinity depending on the presence of nucleotides and Mg2+ (Birnbaumer et al., 1985) nor receptor desensitization during long agonist applications. In our experience and in the literature, M1 muscarinic receptors are not as subject to rapid desensitization as, for example, adrenergic receptors or bradykinin receptors (Lameh et al., 1992; Wei et al., 1994; Cruzblanca et al., 1998), and agonist-dependent M1 receptor phosphorylation does not always use the typical G-protein–coupled receptor kinases (Tobin, 1997; Waugh et al., 1999). In experiments on M1-transfected tsA cells, oxo-M is able to elicit intracellular Ca2+ transients repeatedly and during long applications (Shapiro et al., 2000; unpublished data); however, new experiments will be needed to determine the time course and amount of any desensitization in the cells we use.
Our finding that RGS2 blocks the suppression of current by GTPγS and by AlF4 − agrees with biochemical studies on PLC activation by these agents (Hepler et al., 1997). The role originally attributed to RGS proteins was purely to shorten the lifetime of an active G-protein by accelerating the GTP hydrolysis step. However, the newer experiments have shown that RGS2 specifically forms a trimeric complex with the M1 receptor and activated Gq, thus blocking access of effectors (Anger et al., 2004; Bernstein et al., 2004). This additional action accounts for the intensity of the block and the ability to affect actions of GTPase-resistant nucleotides. We did not incorporate RGS proteins in our model as we had no experiments with graded RGS concentrations. However, a simple approach that would fit the data is to have them sequester activated Gq as an inactive complex until the bound GTP is broken down.
GDPβS
GDPβS was developed as an inhibitor of G-protein activation that competed with GTP and GTP analogues for the nucleotide-free form of G-proteins (Eckstein et al., 1979). The probability of capture in the competition for free G is proportional to the concentrations and the on-rate constants (k 20, k 21, k 22, k 24). Like previous investigators (Pfaffinger, 1988; Brown et al., 1989; Lopez and Adams, 1989; Simmons and Mather, 1991, 1992), we found that pipette solutions with a large excess of GDPβS over GTP slow and diminish agonist-induced inhibition of M-current. The GDPβS also prolongs action after the agonist is removed. In frog sympathetic neurons, the block by GDPβS of suppression by agonists was small and grew with repetitive applications of the same agonist (Simmons and Mather, 1991, 1992).
Because 1 mM GDPβS still allowed an 80% inhibition of KCNQ current in Fig. 3, one might think that the effect of the GTP-free GDPβS solution is weak. However, 10 μM oxo-M is a supra-maximal dose of agonist, and the significant strength of GDPβS action should be judged instead by noting that it slowed the rate of suppression of current sixfold (Fig. 3 B), shifted the oxo-M dose–response curve10-fold (Fig. 8 B), and reduced the response to a 4-s oxo-M application by >90% (Fig. 4 A). The slowed onset of inhibition is readily understood as a high probability of capturing free Gq as G·GDPβS instead of as G·GTP. In the model, the G·GDPβS complex forms reversibly and within a few seconds it dissociates to free G again; the competition reoccurs, and once more GDPβS is the likely winner. Eventually, however, GTP and Mg2+ will bind, giving a brief stimulation of PLC, and then the GTP is hydrolyzed to restore the resting form, G·GDP. In this way, formation of Gα·GTP·Mg2+ occurs but is much delayed by cycles of repeated GDPβS binding, so it may occur well after agonist has been removed. Although the model has this delayed activation, the amount is much less than is seen in the experiments. To get significant delayed activation by this mechanism requires that the dissociation rate constant for the G·GDPβS complex be significantly faster than that for the G·GDP complex in agonist-free conditions. Another explanation is given in the next paragraph.
The original description of GDPβS showed that it can be phosphorylated slowly by cellular enzymes to yield GTPβS (Eckstein et al., 1979), and subsequent work suggests that GTPβS acts as a very weak persistent activator (weak “partial agonist”) of G-proteins (Paris and Pouyssegur, 1990; Blank et al., 1991; Paris and Eckstein, 1992). Thus, after some minutes of whole-cell dialysis with GDPβS, some weak persistent activation could develop by formation of GTPβS. We could mimic such an effect by including, e.g., 0.0004 mM GTPγS in our calculations for 1 mM GDPβS. The simulation (unpublished data) gave better agreement with the near lack of recovery after oxo-M inhibition in Fig. 4 A, suggesting that some GTPβS did form (converting <0.1% of the GDPβS) in our experiments.
The original description of GDPβS also showed for the G-protein Gs that, like GDP dissociation from G·GDP, GDPβS dissociation from G·GDPβS is speeded by receptor occupancy (Eckstein et al., 1979). We included a 20-fold speeding of the binding and unbinding reactions for Gq in the model with the affinity for GDPβS not changing; however, this property has not been explored further for any G-protein, so there was little information to constrain our assumptions. If such speeding is correct for GDPβS, one wonders if it would also be found for other nucleotide analogs, at least before the Mg2+-dependent dissociation of Gβγ subunits. In bullfrog neurons where GDPβS gives an accumulating block under repeated agonist application, the G·GDPβS complex might be stable over many seconds even in the presence of agonist. Indeed Simmons and Mather (1992) suggested an irreversible removal of G-proteins from the available pool. The dissociation in our model for tsA cells is too rapid to produce such use dependent depletion.
Agonist-independent Turnover of G Protein
Like previous investigators (Pfaffinger, 1988; Brown et al., 1989; Lopez and Adams, 1989; Lopez, 1992), we found that pipette solutions with GTPγS, GppNHp, or AlF4 − lead to spontaneous suppression of M-current over 100–800 s. Our experiments with different concentrations of GTPγS showed that the analogue concentration is rate limiting, and experiments with added GTP showed that the GTP/analogue ratio is important (see also Breitwieser and Szabo, 1988; Lopez, 1992). The action of the two GTP analogues can also be diminished by adding GDPβS or by removing Mg2+.
The nearly exponential time course of spontaneous current fall observed with GTP analogues (Fig. 6; see also Lopez, 1992) is mimicked only qualitatively by the model, which generates a sigmoid time course instead. To get an exponential fall of current with our model, one would need a small fraction of G-proteins (and hence PLC) to be activated initially, with no subsequent increase in this active fraction. However, in our calculations, the cytoplasmic concentration of, e.g., GTPγS, starts at zero (at t = −20 s) and rises gradually, so that the irreversible formation of active G-proteins occurs at an ever-accelerating predicted rate that is initially very low. For GTPγS and GppNHp, the model has a further lag in onset that comes from the time needed for antagonistic GTP to diffuse out of the cytoplasm. In the calculation, we assumed that GTP concentration decays exponentially to a basal level of 1 μM. By the time that the action of GppNHp develops, the cytoplasmic GTP is nearly gone. Therefore, the on-rate constant chosen for GppNHp depends almost directly on this assumed residual GTP concentration. The higher the residual GTP, the higher the required GppNHp on-rate constant would have been.
The model could be changed to get an early, weak G-protein activation and an exponential time course of spontaneous current decay. One would assume that GTPγS binds much more quickly (1,000×) than here and that the resulting complex is much less potent (∼1%) than a GTP complex in stimulating PLC. However, such a modification goes against the accepted concept that GTPγS is a strong activator of G-proteins.
For GTPγS and GppNHp, the deduced on-rate constants are several orders of magnitude lower than the on-rates of GTP and GDPβS, and the on-rate for GppNHp is very much lower than for GTPγS. These low values suffice in Fig. 14 because there remains little GTP to compete against when the analogues are binding, and because only a few G-proteins need be permanently activated. A 1% activation of PLC suffices to explain the observed slow suppression of KCNQ current. The small amount of activation needed and the observed concentration dependence of the time course for GTPγS action argue against using such time courses as estimates of the absolute rate of dissociation of GDP from G·GDP, as might be tempting to do. In our model, the spontaneous resting rate of GDP dissociation has a time constant of 1,000 s.
We have emphasized the competition for free G embodied in steps 20, 21, 22, 23, and −10. The agreement is qualitative as we did not find a set of rate constants that worked optimally across the full range of conditions studied. Thus, the effect of GDPβS is a little strong in Figs. 12 and 13 and a little weak in Fig. 15, and the antagonistic effect of GTP is fine for the combination of GppNHp with GTP in Fig. 14 but it is too weak in an analogous calculation (unpublished data) for the combination of GTPγS with GTP. We think that some deviations result from not knowing how much GDP or GTP is present in resting cells and how much might remain in the cell during dialysis with GDP- and GTP-free solutions. The model fit could be improved by assuming that resting GTP is lower and that GTP changes less during dialysis with GTP-free solution—for example a resting GTP level of 10 μM and a final GTP level of 2 μM, instead of 50 and 1 μM (see ). We lack information on reverse reactions such as the dissociation of G·nucleotide complexes or the possible dissociation of the Gα·GTP·Mg2+ complex by a mechanism other than the classical GTPase reaction. Alternatively, there may be errors in the assumed reaction topology or kinetic mechanisms.
Magnesium
Magnesium ions can act at many steps of the G-protein cycle and PI metabolism. One enzyme it seems not to stimulate is PLC (Ryu et al., 1987). In agreement with previous reports about G-protein cascades (Birnbaumer et al., 1985; Gilman, 1987; Higashijima et al., 1987a,b), we found that intracellular Mg2+ is needed for onset and termination of G-protein signaling. The effect was large. The literature shows that Mg2+ binds strongly to the GTP forms but not the GDP forms of Gi, Go, and Gs (Sprang, 1997), and it locks binding of GTP to the Gα subunit by promoting the conformational changes of subunit dissociation. Experimentally, with Mg2+ present, there is no measurable dissociation of GTPγS from Go or Gi in 36 min, whereas in the absence of Mg2+, it dissociates in ∼2 min from Go and ∼5 min from Gi (Higashijima et al., 1987b). The crystal structures of GTPγS-bound Gαi, Gαs, and transducin include a single Mg2+ ion coordinated between the β and γ phosphates of GTP and two amino acid hydroxyls of the G-protein (Sprang, 1997). In our kinetic model, the on-rate for Mg2+ to form the G·GTP·Mg2+ complex is 3,000 M−1 s−1. Hence, with the normal 2.1 mM free Mg2+, the reaction would occur in only 150 ms, but with free Mg2+ reduced to 1 μM, it would take 333 s. This is the origin of slowed and delayed muscarinic inhibition in the absence of Mg2+. During this long wait, the nucleotide would dissociate and rebind to the G-protein numerous times, much as was described for GDPβS. At high Mg2+ concentrations, the overall reaction might involve binding of Mg2+ first or direct binding of Mg2+·GTP, rather than a two-step reaction (Birnbaumer et al., 1985).
The absence of Mg2+ also slows recovery from muscarinic inhibition. Several Mg2+-sensitive steps could be implicated. One is the GTPase step of the G·GTP·Mg2+ complex (Higashijima et al., 1987b) and the others are the lipid kinase steps that synthesize PIP2 from PI (Porter et al., 1988). None is as fully characterized as the Mg2+-dependent step of G-protein activation. One problem in much of the literature is that assays are developed to optimize the amounts of ATP, total Mg2+, and other ingredients but do not consider the resulting free Mg2+. In our reading, it is not definitively known whether the GTPase step has Mg2+ dependence in addition to that for initial formation of the G·GTP·Mg2+ substrate. Nevertheless, in our model, steps 30 and 40 both need Mg2+. Step 30 generates the initial Gα·GTP·Mg2+ complex, and step 40 hydrolyzes the GTP. In step 40, the rate of reaction is proportional to a saturation function of Mg2+, as if the Gα·GTP·Mg2+ complex reequilibrates with the ambient Mg2+ before the hydrolysis. As hydrolysis is relatively fast, perhaps such reequilibration has too little time to occur and the saturation function should be deleted. Perhaps instead, the much longer-lived complexes formed in steps 32, 33, or 34 should reequilibrate with the free Mg2+, and, e.g., the intrinsic activity of a Gα·GTPγS complex might change whether the Mg2+ is bound or not. Although the overall model predictions are in the right direction, there are too many unknowns about Mg2+ dependence today to test such ideas well.
PI Metabolism
We take as a given that muscarinic suppression of KCNQ current entails significant depletion of PIP2 in the membrane followed by dissociation of PIP2 from binding sites on the channel. This hypothesis is supported by many recent electrophysiological and pharmacological experiments (Suh and Hille, 2002; Ford et al., 2003; Loussouarn et al., 2003; Zhang et al., 2003). We also suppose that gradual rundown and incomplete recovery of KCNQ current after whole-cell recording starts is in part due to decline and incomplete restoration in PIP2 levels. For example, some of the PI 4-kinase enzyme is soluble (Wong et al., 1997), and during whole-cell recording the available pool of this enzyme might fall as molecules are lost into the recording pipette. However, the recent literature reveals many factors other than PIP2 that affect the amplitude of KCNQ currents, so the full explanation of rundown and incomplete recovery is undoubtedly more complex.
Unfortunately, we cannot adopt ready-made kinetics of PI turnover from the biochemical literature. The difficulties include that: measurements of total lipids from cells do not separate contributions of different lipid pools (both on different membranes and locally on the plasma membrane itself); measurements often determine total amounts better than fluxes through pools; different cell types and compartments have different lipid kinases and phosphatases; isotopic measurements of pool sizes may suffer from changes of specific activity; and in vitro enzymological experiments with purified components rarely involve physiological forms of the lipid substrates in a native membrane.
Finding a range of differing views in the literature, we tentatively chose a simple textbook kinetic scheme. Our linear PI-PIP-PIP2 scheme has no regulation of the lipid-kinase steps other than the requirement for substrates (lipid and ATP) and Mg2+ cofactor, and PI is considered invariant. Up-regulation of lipid kinases during PLC activation needs to be added when its mechanism and properties become better known. Thus, the literature says that Gq-coupled receptor stimulation can potentiate lipid kinases by unknown mechanisms (Yorek et al., 1994; Xu et al., 2003), that cAMP-dependent phosphorylation can turn off PIP 5-kinase (Park et al., 2001), that several ADP-ribosylation-factor (ARF)-dependent pathways can regulate PIP-5-kinase (West et al., 1997; Aikawa and Martin, 2003; Krauss et al., 2003), and that GTPγS can potentiate by activating Rac-1 and RhoA (Tolias and Carpenter, 2000) or ARF6 (Krauss et al., 2003; West et al., 1997). The RhoA pathway is also stimulated by Gα13 and conceivably underlies the changes we saw with constitutively active G13* in Figs. 1 and 2.
In the model, we ignored PI 5-phosphate and the possibility of forming PIP2 from it via a PIP 4-kinase, and we also ignore transfer of PI lipids from other pools by PI transfer proteins. We included one lipid phosphatase, PIP2 5-phosphatase, and did not include a PIP 4-phosphatase. The rates of the 5-phosphatase and of resting PLC were made about equal, giving some recycling but not a preponderance of futile cycling at rest. The activation of PLC was linearly proportional to the sum of active G-protein forms, thus presuming that GTP, GTP analogs, and AlF4 − give equally active G-proteins. We assume that PLC is completely specific for PIP2 and does not hydrolyze PI or PIP. We ignore potential regulation of PLC by Gβγ, cytoplasmic Ca2+, or PIP2 itself. Each of these assumptions might have to be revised.
As a single example, we can compare our calculations to informative measurements made with [3H]inositol of total membrane inositol lipids in the SH-SY5Y cell line (Willars et al., 1998). We have general agreement on the time course of PIP2 decay after muscarinic agonist and after inhibiting PI 4-kinase with wortmannin, as well as on the time course of PIP2 recovery after removing agonist. However, we do not reproduce two of their findings, namely that total PIP falls as fast as PIP2 with agonist and that PIP2 recovers much faster than total PIP after removal of agonist. In addition their measurements showed that 15% of the resting PIP2 is in an agonist-insensitive pool.
There is little information about the rate of association and dissociation of PIP2 from binding sites on membrane proteins or about the number of lipid molecules bound per protein. Our assumption that these reactions equilibrate in a few seconds adds a short delay to the response of KCNQ channels. We were not able to get strong suppression of KCNQ channels without assuming that (local) PIP2 itself is strongly depleted. An extremely cooperative activation of KCNQ channels could make current turn off suddenly as PIP2 was falling, but it would make the dose–response curve for oxo-M too sharp and the time course of suppression by GTP analogues and AlF4 − even more sigmoid. We assume that the PIP2 binding sites do not bind other acidic lipids significantly.
In summary, many features of the coupling from M1 receptors to KCNQ current suppression are rationalized by the classical view of heterotrimeric G-protein cycling and PI turnover. So far as they can be compared, the properties of isolated systems, of this expression system in tsA cells, and of native neurons seem largely comparable. Much of this could be modeled mathematically using rate constants previously measured biochemically. By requiring precise specification, the model has highlighted numerous points of uncertainty that have received less study. Probably the least satisfactory feature of the kinetic measurements is that they involve a single downstream measure (current) that is mechanistically far removed from the input (agonist). We will need to design kinetic measurements that reveal the time course of many of the intermediates to constrain numerous assumptions better.
Acknowledgments
We thank Professors Michael Berridge, R.A. John Challiss, John Hepler, Donald Hilgemann, Philip Majerus, Stefan Nahorski, James Putney, Zvi Sellinger, and Gary Willars for discussions, and Peter Detwiler, James Hurley, Krzysztof Palczewski, and Fred Rieke for reading. Lea Miller and Eric Martinson provided valuable technical assistance.
This work was supported by National Institutes of Health Grants NS08174, NS07332, DA00286, and DA11322.
Olaf S. Andersen served as editor.
APPENDIX
This appendix gives some additional details of the kinetic model. The calculations assumed that before whole-cell dialysis, the tsA cell cytoplasm contained 50 μM GTP, 3 mM ATP, no GDP, and 2.1 mM free Mg2+. Upon dialysis, GTP, GTPγS, GppNHp, and GDPβS began to relax exponentially to their pipette values with a 120-s time constant; AlF4 − relaxed with an 80-s time constant; and free Mg2+ changed immediately. We assumed that dialysis started 300 s before the first agonist application—or 20 s before time zero in Fig. 14, where agonist was not used. For example, in the control curve of Fig. 12 (symbols), where the agonist is applied at 90 s and the pipette contains 100 μM GTP, the cytoplasmic GTP concentration in micromolar is described by the formula, 50 + 50 × (1 − exp(−(t + 210)/120)), where breakthrough is taken as time t = −210 s. Because cytoplasm contains reservoirs of bound Mg2+ and the cell was not in a Mg2+-free bath, we assumed that cellular free Mg2+ never fell below 1 μM in experiments with EDTA rather than to the low nanomolar levels estimated for the pipette solution itself. Similarly, we assumed that cellular GTP fell to 1 μM when the pipette was GTP free. The initial values for PI, PIP, and PIP2 were 200,000, 1,150, and 5,000 molecules μm−2. PI and GDP were held constant at their initial values throughout.
Except for Fig. 11 A, the application and removal of oxo-M was assumed to follow an exponential time course. Thus, during agonist application, which starts at t = 2 in Fig. 10 B, the rise of oxo-M in micromolar was described by 10 × (1 − exp(−(t − 2)/2.4)). We arbitrarily took the density of Gq on the membrane as 200 μm−2. This value has no effect on the calculations since activation of PLC was proportional to the fraction of active G-proteins rather than the number. The fraction of active G-proteins (f Gactive) was taken as (G·GTP· Mg2+ + G·GTPγS·Mg2+ + G·GppNHp·Mg2+ + G·GDP·AlF4 −·Mg2+)/200, which assumes that all four forms have equal intrinsic activity. The density of PIP2 binding sites (on KCNQ channels) was taken as 40 μm−2; the only significant property of this number is that it is several orders of magnitude lower than the resting PIP2 density, so that channels do not deplete the PIP2 pool. To allow some cooperativity for activation of KCNQ current by PIP2, the current varied as a power law (n = 1.8) of the time-varying fractional site occupancy.
Wiebke Hirdes's present address is Institut für Angewandte Physiologie, Universitätsklinikum Hamburg-Eppendorf, Universität Hamburg, D-20246 Hamburg, Germany.
Lisa F. Horowitz's present address is Fred Hutchinson Cancer Research Center, 1100 Fairview Ave N., Seattle, WA 98109.
Abbreviations used in this paper: GppNHp, guanylyl-imidodiphosphate; GTPγS, guanosine-5′-O-(3-thiotriphosphate); IP3, inositol 1,4,5-trisphosphate; oxo-M, oxotremorine-M; PIP2, phosphatidylinositol 4,5-bisphosphate.
Footnotes
The present model has a single intracellular compartment that we often refer to as “cytoplasm.” It represents the cytoplasm and the nucleus lumped together.
References
- Aikawa, Y., and T.F. Martin. 2003. ARF6 regulates a plasma membrane pool of phosphatidylinositol-(4,5)bisphosphate required for regulated exocytosis. J. Cell Biol. 162:647–659. [DOI] [PMC free article] [PubMed] [Google Scholar]
- Anger, T., W. Zhang, and U. Mende. 2004. Differential contribution of GTPase activation and effector antagonism to the inhibitory effect of RGS proteins on Gq-mediated signaling in vivo. J. Biol. Chem. 279:3906–3915. [DOI] [PubMed] [Google Scholar]
- Arshavsky, V.Y., T.D. Lamb, and E.N. Pugh Jr. 2002. G-proteins and phototransduction. Annu. Rev. Physiol. 64:153–187. [DOI] [PubMed] [Google Scholar]
- Bernstein, L.S., S. Ramineni, C. Hague, W. Cladman, P. Chidiac, A.I. Levey, and J.R. Hepler. 2004. RGS2 binds directly and selectively to the M1 muscarinic acetylcholine receptor third intracellular loop to modulate Gq/11α signaling. J. Biol. Chem. 279:21248–21256. [DOI] [PubMed] [Google Scholar]
- Biddlecome, G.H., G. Berstein, and E.M. Ross. 1996. Regulation of phospholipase C-β1 by Gq and m1 muscarinic cholinergic receptor. Steady-state balance of receptor-mediated activation and GTPase-activating protein-promoted deactivation. J. Biol. Chem. 271:7999–8007. [DOI] [PubMed] [Google Scholar]
- Bigay, J., P. Deterre, C. Pfister, and M. Chabre. 1987. Fluoride complexes of aluminium or beryllium act on G-proteins as reversibly bound analogues of the γ-phosphate of GTP. EMBO J. 6:2907–2913. [DOI] [PMC free article] [PubMed] [Google Scholar]
- Birnbaumer, L., J. Codina, R. Mattera, R.A. Cerione, J.D. Hildebrandt, T. Sunyer, F.J. Rojas, M.G. Caron, R.J. Lefkowitz, and R. Iyengar. 1985. Regulation of hormone receptors and adenylyl cyclases by guanine nucleotide binding N proteins. Recent Prog. Horm. Res. 41:41–99. [DOI] [PubMed] [Google Scholar]
- Blank, J.L., A.H. Ross, and J.H. Exton. 1991. Purification and characterization of two G-proteins that activate the β1 isozyme of phosphoinositide-specific phospholipase C. Identification as members of the Gq class. J. Biol. Chem. 266:18206–18216. [PubMed] [Google Scholar]
- Breitwieser, G.E., and G. Szabo. 1988. Mechanism of muscarinic receptor-induced K+ channel activation as revealed by hydrolysis-resistant GTP analogues. J. Gen. Physiol. 91:469–493. [DOI] [PMC free article] [PubMed] [Google Scholar]
- Brown, B.S., and S.P. Yu. 2000. Modulation and genetic identification of the M channel. Prog. Biophys. Mol. Biol. 73:135–166. [DOI] [PubMed] [Google Scholar]
- Brown, D.A., N.V. Marrion, and T.G. Smart. 1989. On the transduction mechanism for muscarine-induced inhibition of M-current in cultured rat sympathetic neurones. J. Physiol. 413:469–488. [DOI] [PMC free article] [PubMed] [Google Scholar]
- Caulfield, M.P., S. Jones, Y. Vallis, N.J. Buckley, G.D. Kim, G. Milligan, and D.A. Brown. 1994. Muscarinic M-current inhibition via Gq/11 and α-adrenoceptor inhibition of Ca2+ current via Go in rat sympathetic neurones. J. Physiol. 477:415–422. [DOI] [PMC free article] [PubMed] [Google Scholar]
- Cook, B., M. Bar-Yaacov, H. Cohen Ben-Ami, R.E. Goldstein, Z. Paroush, Z. Selinger, and B. Minke. 2000. Phospholipase C and termination of G-protein-mediated signalling in vivo. Nat. Cell Biol. 2:296–301. [DOI] [PubMed] [Google Scholar]
- Cruzblanca, H., D.S. Koh, and B. Hille. 1998. Bradykinin inhibits M current via phospholipase C and Ca2+ release from IP3-sensitive Ca2+ stores in rat sympathetic neurons. Proc. Natl. Acad. Sci. USA. 95:7151–7156. [DOI] [PMC free article] [PubMed] [Google Scholar]
- Eckstein, F., D. Cassel, H. Levkovitz, M. Lowe, and Z. Selinger. 1979. Guanosine 5′-O-(2-thiodiphosphate). An inhibitor of adenylate cyclase stimulation by guanine nucleotides and fluoride ions. J. Biol. Chem. 254:9829–9834. [PubMed] [Google Scholar]
- Ford, C.P., P.L. Stemkowski, P.E. Light, and P.A. Smith. 2003. Experiments to test the role of phosphatidylinositol 4,5-bisphosphate in neurotransmitter-induced M-channel closure in bullfrog sympathetic neurons. J. Neurosci. 23:4931–4941. [DOI] [PMC free article] [PubMed] [Google Scholar]
- Gilman, A.G. 1987. G proteins: transducers of receptor-generated signals. Annu. Rev. Biochem. 56:615–649. [DOI] [PubMed] [Google Scholar]
- Haley, J.E., F.C. Abogadie, P. Delmas, M. Dayrell, Y. Vallis, G. Milligan, M.P. Caulfield, D.A. Brown, and N.J. Buckley. 1998. The α subunit of Gq contributes to muscarinic inhibition of the M-type potassium current in sympathetic neurons. J. Neurosci. 18:4521–4531. [DOI] [PMC free article] [PubMed] [Google Scholar]
- Haley, J.E., P. Delmas, S. Offermanns, F.C. Abogadie, M.I. Simon, N.J. Buckley, and D.A. Brown. 2000. Muscarinic inhibition of calcium current and M current in Gαq-deficient mice. J. Neurosci. 20:3973–3979. [DOI] [PMC free article] [PubMed] [Google Scholar]
- Hepler, J.R., D.M. Berman, A.G. Gilman, and T. Kozasa. 1997. RGS4 and GAIP are GTPase-activating proteins for Gqα and block activation of phospholipase C-β by γ-thio-GTP-Gqα. Proc. Natl. Acad. Sci. USA. 94:428–432. [DOI] [PMC free article] [PubMed] [Google Scholar]
- Heximer, S.P., N. Watson, M.E. Linder, K.J. Blumer, and J.R. Hepler. 1997. RGS2/G0S8 is a selective inhibitor of Gqα function. Proc. Natl. Acad. Sci. USA. 94:14389–14393. [DOI] [PMC free article] [PubMed] [Google Scholar]
- Heximer, S.P., S.P. Srinivasa, L.S. Bernstein, J.L. Bernard, M.E. Linder, J.R. Hepler, and K.J. Blumer. 1999. G protein selectivity is a determinant of RGS2 function. J. Biol. Chem. 274:34253–34259. [DOI] [PubMed] [Google Scholar]
- Higashijima, T., K.M. Ferguson, P.C. Sternweis, E.M. Ross, M.D. Smigel, and A.G. Gilman. 1987. a. The effect of activating ligands on the intrinsic fluorescence of guanine nucleotide-binding regulatory proteins. J. Biol. Chem. 262:752–756. [PubMed] [Google Scholar]
- Higashijima, T., K.M. Ferguson, P.C. Sternweis, M.D. Smigel, and A.G. Gilman. 1987. b. Effects of Mg2+ and the βγ-subunit complex on the interactions of guanine nucleotides with G proteins. J. Biol. Chem. 262:762–766. [PubMed] [Google Scholar]
- Hirose, K., S. Kadowaki, M. Tanabe, H. Takeshima, and M. Iino. 1999. Spatiotemporal dynamics of inositol 1,4,5-trisphosphate that underlies complex Ca2+ mobilization patterns. Science. 284:1527–1530. [DOI] [PubMed] [Google Scholar]
- Hollinger, S., and J.R. Hepler. 2002. Cellular regulation of RGS proteins: modulators and integrators of G protein signaling. Pharmacol. Rev. 54:527–559. [DOI] [PubMed] [Google Scholar]
- Jones, S.W., D.A. Brown, G. Milligan, E. Willer, N.J. Buckley, and M.P. Caulfield. 1995. Bradykinin excites rat sympathetic neurons by inhibition of M current through a mechanism involving B2 receptors and Gq/11. Neuron. 14:399–405. [DOI] [PubMed] [Google Scholar]
- Krauss, M., M. Kinuta, M.R. Wenk, P. De Camilli, K. Takei, and V. Haucke. 2003. ARF6 stimulates clathrin/AP-2 recruitment to synaptic membranes by activating phosphatidylinositol phosphate kinase type Iγ. J. Cell Biol. 162:113–124. [DOI] [PMC free article] [PubMed] [Google Scholar]
- Lameh, J., M. Philip, Y.K. Sharma, O. Moro, J. Ramachandran, and W. Sadee. 1992. Hm1 muscarinic cholinergic receptor internalization requires a domain in the third cytoplasmic loop. J. Biol. Chem. 267:13406–13412. [PubMed] [Google Scholar]
- Lopez, H.S. 1992. Kinetics of G protein-mediated modulation of the potassium M-current in bullfrog sympathetic neurons. Neuron. 8:725–736. [DOI] [PubMed] [Google Scholar]
- Lopez, H.S., and P.R. Adams. 1989. A G protein mediates the inhibition of the voltage-dependent potassium M current by muscarine, LHRH, substance P and UTP in bullfrog sympathetic neurons. Eur. J. Neurosci. 1:529–542. [DOI] [PubMed] [Google Scholar]
- Loussouarn, G., K.H. Park, C. Bellocq, I. Baro, F. Charpentier, and D. Escande. 2003. Phosphatidylinositol-4,5-bisphosphate, PIP2, controls KCNQ1/KCNE1 voltage-gated potassium channels: a functional homology between voltage-gated and inward rectifier K+ channels. EMBO J. 22:5412–5421. [DOI] [PMC free article] [PubMed] [Google Scholar]
- McLaughlin, S., J. Wang, A. Gambhir, and D. Murray. 2002. PIP2 and proteins: interactions, organization, and information flow. Annu. Rev. Biophys. Biomol. Struct. 31:151–175. [DOI] [PubMed] [Google Scholar]
- Mukhopadhyay, S., and E.M. Ross. 1999. Rapid GTP binding and hydrolysis by Gq promoted by receptor and GTPase-activating proteins. Proc. Natl. Acad. Sci. USA. 96:9539–9544. [DOI] [PMC free article] [PubMed] [Google Scholar]
- Paris, S., and F. Eckstein. 1992. Activation of G proteins by (Rp) and (Sp) diastereomers of guanosine 5′-[β-thio]triphosphate in hamster fibroblasts. Differential stereospecificity of Gi, Gs and Gp. Biochem. J. 284:327–332. [DOI] [PMC free article] [PubMed] [Google Scholar]
- Paris, S., and J. Pouyssegur. 1990. Guanosine 5′-O-(3-thiotriphosphate) and guanosine 5′-O-(2-thiodiphosphate) activate G proteins and potentiate fibroblast growth factor-induced DNA synthesis in hamster fibroblasts. J. Biol. Chem. 265:11567–11575. [PubMed] [Google Scholar]
- Park, S.J., T. Itoh, and T. Takenawa. 2001. Phosphatidylinositol 4-phosphate 5-kinase type I is regulated through phosphorylation response by extracellular stimuli. J. Biol. Chem. 276:4781–4787. [DOI] [PubMed] [Google Scholar]
- Pfaffinger, P. 1988. Muscarine and t-LHRH suppress M-current by activating an IAP-insensitive G-protein. J. Neurosci. 8:3343–3353. [DOI] [PMC free article] [PubMed] [Google Scholar]
- Porter, F.D., Y.S. Li, and T.F. Deuel. 1988. Purification and characterization of a phosphatidylinositol 4-kinase from bovine uteri. J. Biol. Chem. 263:8989–8995. [PubMed] [Google Scholar]
- Roche, J.P., R. Westenbroek, A.J. Sorom, B. Hille, K. Mackie, and M.S. Shapiro. 2002. Antibodies and a cysteine-modifying reagent show correspondence of M current in neurons to KCNQ2 and KCNQ3 K+ channels. Br. J. Pharmacol. 137:1173–1186. [DOI] [PMC free article] [PubMed] [Google Scholar]
- Ross, E.M. 1995. G protein GTPase-activating proteins: regulation of speed, amplitude, and signaling selectivity. Recent Prog. Horm. Res. 50:207–221. [DOI] [PubMed] [Google Scholar]
- Ryu, S.H., K.S. Cho, K.Y. Lee, P.G. Suh, and S.G. Rhee. 1987. Purification and characterization of two immunologically distinct phosphoinositide-specific phospholipases C from bovine brain. J. Biol. Chem. 262:12511–12518. [PubMed] [Google Scholar]
- Sather, W.A., and P.B. Detwiler. 1987. Intracellular biochemical manipulation of phototransduction in detached rod outer segments. Proc. Natl. Acad. Sci. USA. 84:9290–9294. [DOI] [PMC free article] [PubMed] [Google Scholar]
- Schramm, M., and Z. Selinger. 1984. Message transmission: receptor controlled adenylate cyclase system. Science. 225:1350–1356. [DOI] [PubMed] [Google Scholar]
- Shapiro, M.S., J.P. Roche, E.J. Kaftan, H. Cruzblanca, K. Mackie, and B. Hille. 2000. Reconstitution of muscarinic modulation of the KCNQ2/KCNQ3 K+ channels that underlie the neuronal M current. J. Neurosci. 20:1710–1721. [DOI] [PMC free article] [PubMed] [Google Scholar]
- Simmons, M.A., and R.J. Mather. 1991. Selectivity of the effects of guanosine-5′-O-(2-thiodiphosphate) on agonist inhibition of the M-current in amphibian sympathetic neurons. J. Neurosci. 11:2130–2134. [DOI] [PMC free article] [PubMed] [Google Scholar]
- Simmons, M.A., and R.J. Mather. 1992. Intracellular guanosine-5′-O-(2-thiodiphosphate) alters the dynamics of receptor-mediated responses in bullfrog sympathetic neurons. Mol. Pharmacol. 41:527–534. [PubMed] [Google Scholar]
- Singer, W.D., H.A. Brown, and P.C. Sternweis. 1997. Regulation of eukaryotic phosphatidylinositol-specific phospholipase C and phospholipase D. Annu. Rev. Biochem. 66:475–509. [DOI] [PubMed] [Google Scholar]
- Sondek, J., D.G. Lambright, J.P. Noel, H.E. Hamm, and P.B. Sigler. 1994. GTPase mechanism of G proteins from the 1.7-A crystal structure of transducin α-GDP-AIF4 −. Nature. 372:276–279. [DOI] [PubMed] [Google Scholar]
- Sprang, S.R. 1997. G protein mechanisms: insights from structural analysis. Annu. Rev. Biochem. 66:639–678. [DOI] [PubMed] [Google Scholar]
- Stauffer, T.P., S. Ahn, and T. Meyer. 1998. Receptor-induced transient reduction in plasma membrane PtdIns(4,5)P2 concentration monitored in living cells. Curr. Biol. 8:343–346. [DOI] [PubMed] [Google Scholar]
- Sternweis, P.C., and A.V. Smrcka. 1992. Regulation of phospholipase C by G proteins. Trends Biochem. Sci. 17:502–506. [DOI] [PubMed] [Google Scholar]
- Stryer, L. 1986. Cyclic GMP cascade of vision. Annu. Rev. Neurosci. 9:87–119. [DOI] [PubMed] [Google Scholar]
- Suh, B.C., and B. Hille. 2002. Recovery from muscarinic modulation of M current channels requires phosphatidylinositol 4,5-bisphosphate synthesis. Neuron. 35:507–520. [DOI] [PubMed] [Google Scholar]
- Thomsen, W.J., J.A. Jacquez, and R.R. Neubig. 1988. Inhibition of adenylate cyclase is mediated by the high affinity conformation of the α2-adrenergic receptor. Mol. Pharmacol. 34:814–822. [PubMed] [Google Scholar]
- Tobin, A.B. 1997. Phosphorylation of phospholipase C-coupled receptors. Pharmacol. Ther. 75:135–151. [DOI] [PubMed] [Google Scholar]
- Tolias, K.F., and C.L. Carpenter. 2000. Enzymes involved in the synthesis of PtdIns(4,5)P2 and their regulation: PtdIns kinases and PtdInsP kinases. Biology of Phosphoinositides. S. Cockcroft, editor. Oxford University Press, Oxford. 109–130.
- Varnai, P., and T. Balla. 1998. Visualization of phosphoinositides that bind pleckstrin homology domains: calcium- and agonist-induced dynamic changes and relationship to myo-[3H]inositol-labeled phosphoinositide pools. J. Cell Biol. 143:501–510. [DOI] [PMC free article] [PubMed] [Google Scholar]
- Waugh, M.G., R.A. Challiss, G. Berstein, S.R. Nahorski, and A.B. Tobin. 1999. Agonist-induced desensitization and phosphorylation of m1-muscarinic receptors. Biochem. J. 338:175–183. [PMC free article] [PubMed] [Google Scholar]
- Wei, H.B., H.I. Yamamura, and W.R. Roeske. 1994. Down-regulation and desensitization of the muscarinic M1 and M2 receptors in transfected fibroblast B82 cells. Eur. J. Pharmacol. 268:381–391. [DOI] [PubMed] [Google Scholar]
- West, M.A., N.A. Bright, and M.S. Robinson. 1997. The role of ADP-ribosylation factor and phospholipase D in adaptor recruitment. J. Cell Biol. 138:1239–1254. [DOI] [PMC free article] [PubMed] [Google Scholar]
- Willars, G.B., S.R. Nahorski, and R.A. Challiss. 1998. Differential regulation of muscarinic acetylcholine receptor-sensitive polyphosphoinositide pools and consequences for signaling in human neuroblastoma cells. J. Biol. Chem. 273:5037–5046. [DOI] [PubMed] [Google Scholar]
- Wong, K., R. Meyers, and L.C. Cantley. 1997. Subcellular locations of phosphatidylinositol 4-kinase isoforms. J. Biol. Chem. 272:13236–13241. [DOI] [PubMed] [Google Scholar]
- Xu, C., J. Watras, and L.M. Loew. 2003. Kinetic analysis of receptor-activated phosphoinositide turnover. J. Cell Biol. 161:779–791. [DOI] [PMC free article] [PubMed] [Google Scholar]
- Yorek MA, J.A., J.A. Dunlap., M.R. Stefani, E.P. Davidson, X. Zhu, and J. Eichberg. 1994. Decreased myo-inositol uptake is associated with reduced bradykinin-stimulated phosphatidylinositol synthesis and diacylglycerol content in cultured neuroblastoma cells exposed to L-fucose. J. Neurochem. 62:147–158. [DOI] [PubMed] [Google Scholar]
- Zhang, H., L.C. Craciun, T. Mirshahi, T. Rohacs, C.M. Lopes, T. Jin, and D.E. Logothetis. 2003. PIP2 activates KCNQ channels, and its hydrolysis underlies receptor-mediated inhibition of M currents. Neuron. 37:963–975. [DOI] [PubMed] [Google Scholar]