Abstract
Is the mechanical unraveling of protein domains by atomic force microscopy (AFM) just a technological feat or a true measurement of their unfolding? By engineering a protein made of tandem repeats of identical Ig modules, we were able to get explicit AFM data on the unfolding rate of a single protein domain that can be accurately extrapolated to zero force. We compare this with chemical unfolding rates for untethered modules extrapolated to 0 M denaturant. The unfolding rates obtained by the two methods are the same. Furthermore, the transition state for unfolding appears at the same position on the folding pathway when assessed by either method. These results indicate that mechanical unfolding of a single protein by AFM does indeed reflect the same event that is observed in traditional unfolding experiments. The way is now open for the extensive use of AFM to measure folding reactions at the single-molecule level. Single-molecule AFM recordings have the added advantage that they define the reaction coordinate and expose rare unfolding events that cannot be observed in the absence of chemical denaturants.
Individually folded domains are common building blocks of proteins (1, 2). The native state of proteins is the most stable, and therefore, proteins rarely unfold spontaneously. For example, the unfolding of isolated Ig and fibronectin type III domains is a rare event estimated to occur at a rate of 10−3 to 10−4 s−1, whereas refolding is typically much faster, at rates of ≈1 to 100 s−1 (3–6). Hence, unfolding is typically studied by using chemical denaturation, which forces the domains into various degrees of unfolding. By using protein engineering combined with a variety of spectroscopic techniques such as NMR and fluorescence, it is possible to examine the folding of protein domains after chemical denaturation (3, 7–9). These experimental approaches are widely used and give information about the folding free energy, transition state, and folding landscape.
The atomic force microscope (AFM) is a simple instrument capable of causing the unfolding of a single protein by controlling its length with Å-scale resolution (10, 11). AFM techniques trigger unfolding by applying force to a single protein, which increases the rate of unfolding exponentially, thus making it easily observable without requiring chemical denaturants (10–12). However, despite these developments, single protein recordings by using AFM have remained limited, because when stretching the whole or part of a multimodular protein, it has been impossible to assign experimental observables to individual domains because of their heterogeneity. Furthermore, it is not known whether mechanical unraveling events represent true unfolding events. This has been a point that investigators have tried to address in previous papers (10, 11). However, it has been possible only to say that the unfolding and refolding rates observed and the stability measured have been “in the range” of the results observed for isolated domains of this kind. However, the comparison between mechanical and chemical data has remained uncertain because the range of unfolding and refolding rates of these modules varies by 2 orders of magnitude, and the stability ranges from 2 to 10 kcal/mol (1 cal = 4.18 J) (3–5, 13).
In this work, we use protein engineering to construct tandem repeats of a single protein module and stretch it with AFM to examine its stability and folding kinetics. Tandem repeats are necessary because the mechanical properties of a single module cannot be directly studied by using AFM techniques. A single module will extend only for a short distance and fall into a region where we always observe a large amount of nonspecific interactions between the AFM tip and the substrate (<30 nm). In contrast, tandem repeats of many modules extend well over the region of nonspecific interactions and generate periodical patterns that amplify the features of the individual modules and allow for a high signal-to-noise ratio. We have constructed recombinant proteins composed of direct tandem repeats of Ig module 27 of the I band of human cardiac titin (I27). I27 (89 aa) was chosen because its structure has been determined by using NMR (14), and it has a known stability (13). Furthermore, recent steered molecular dynamics simulations modeled the extension of I27 under an applied force (15). Through the use of a series of AFM extension protocols, we reconstructed the folding pathway of tethered I27s. We compare the AFM results with those obtained on isolated, untethered modules by using standard chemical denaturation techniques. Our results demonstrate that the unfolding rates obtained by the two methods are identical. Furthermore, we find that the transition state for unfolding appears at the same position on the folding trajectory obtained by using AFM and chemical denaturants. These results are surprising and indicate that mechanical unfolding of a single protein by AFM does indeed reflect the same event that is observed in traditional unfolding experiments. Hence, our results open the way for the extensive use of AFM as a tool for the measurement of protein-folding reactions.
MATERIALS AND METHODS
Construction of Poly(I27) Proteins.
Two different recombinant methods were used to synthesize and express direct tandem repeats of I27 monomers, with identical results. The first method is a multiple-step cloning technique based on a previously described strategy (16). First, the I27 domain monomer unit was subcloned after PCR amplification of a human cardiac muscle cDNA clone (10). The 5′ primer contained a BamHI restriction site that permitted in-frame cloning of the monomer into the expression vector pQE30 (Qiagen, Chatsworth, CA). The 3′ primer contained a BglII restriction site, two Cys codons located 3′ to the BglII site and in-frame with the I27 domain, and two in-frame stop codons. The PCR product was cloned into pUC19 linearized with BamHI and SmaI. The 8-domain synthetic gene was then constructed by iterative cloning of monomer into monomer, dimer into dimer, and tetramer into tetramer. The final construct contained eight direct repeats of the I27 domain, an amino-terminal His tag for purification, and two carboxyl-terminal Cys codons used for covalent attachment to the gold-covered coverslips. The full-length construct, I27RS8, results in the following amino acid additions: (i) the amino-terminal sequence is Met-Arg-Gly-Ser-(His)6-Gly-Ser-I27 codons; (ii) the junction between the domains (BamHI-BglII hybrid site) is Arg-Ser; and (iii) the protein terminates in Cys-Cys. The synthetic I27RS8 was cloned in an Escherichia coli recombination-defective strain, Sure-2 (Stratagene), expressed in the M15 strain, and purified by Ni2+-affinity chromatography under nondenaturing conditions. Elution from the resin was with 100 mM imidazole (pH 6.0). In a second strategy, directional DNA concatemerization was done by self-ligation of the sticky ends of the nonpalindromic CTCGGG AvaI restriction site (17, 18). I27 cDNA with flanking AvaI sites was isolated by using PCR. After self-ligation, the concatemers were cloned into a custom-made expression vector. I27GLG12 was expressed in the recombination-defective strain BLR(DE3) (Novagene), purified by Ni2+-affinity chromatography, and kept in PBS/5 mM DTT.
AFM.
Our custom-made single-molecule AFM apparatus, as well as its mode of operation, was as described (11). Calibration of the spring constant of each individual cantilever was done in solution by using the equipartition theorem as described (19). The poly(I27) proteins were kept in PBS buffer at a concentration of 10–100 μg⋅ml−1 and allowed to adsorb onto freshly evaporated gold coverslips.
Cloning and Production of Isolated I27 Domains.
Single domains of I27 were isolated by PCR from the polyprotein clone and subcloned into a modified pRSETA (ref. 5; Invitrogen). Note that both this protein and the protein used for the AFM experiments have two changes to the sequence published for titin; Thr-42 is replaced by Ala, and Ala-78 is replaced by Thr. The protein was expressed at high levels in E. coli strain C41(DE3) (20) (gift of J. Walker, Medical Research Council). The sequence of the purified protein includes a Gly-Ser at the amino terminus and Arg-Ser at the carboxyl terminus to mimic the linker used in the I27RS8 protein.
Equilibrium Denaturation of I27.
The experiments were carried out at 28°C in PBS buffer plus 5 mM DTT. Protein concentration was 1–2 μM. The stability of I27 was determined by using equilibrium guanidinium chloride (GdmCl) denaturation. Unfolding was monitored by change in fluorescence at 320 nm (excitation 280 nm). The data were analyzed as described (3, 21). The free energy for folding in 0 M denaturant  can be calculated (21):
 |
1 |
where [D]50% is the concentration of denaturant where 50% of the protein is denatured and m is the slope of the transition.
Unfolding and Refolding of Isolated I27 Modules.
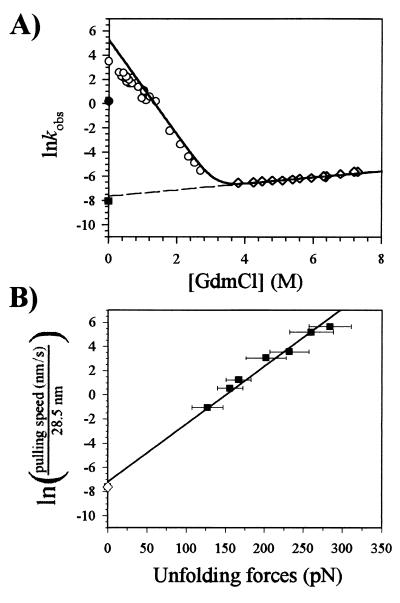
To determine kf, the rate constant for folding, the protein was denatured in GdmCl (in PBS/DTT) and rapidly mixed into refolding buffer (PBS/DTT) in an Applied Photophysics stopped-flow fluorimeter. Folding was followed by the increase in fluorescence on refolding (excitation 280 nm, emission >320 nm). At least four refolding traces were averaged, and the data were fitted by using the program kaleidagraph (Synergy Software, Reading, PA). The data were fitted to a triple-exponential decay, with a major fast phase (70–80% at low [D]) and two minor, slower phases. I27 has three prolines, all-trans in the folded state. It is probable that the slower phases, which show little denaturant dependence, are phases reflecting the refolding of proteins limited by proline isomerization, as has been observed in other proteins, including those with a similar Ig-like fold. Folding in the absence of denaturant was performed by applying a pH shift, from pH 12.4 to pH 7.4. Unfolding was slow, and data were collected for more than 2,000 sec. In this case, unfolding was monitored by loss of fluorescence at 320 nm (excitation 280 nm) after manual mixing in a 1-cm-pathlength cuvette. The data fit well to a single exponential term plus a term to account for baseline drift caused by photolysis. A chevron plot of the data (Fig. 6A) shows the unfolding and folding dependencies on denaturant concentration. The data were fit with a simple two-state kinetic model (Fig. 6A, solid line) given by
 |
where kfH2O=190 s−1, kuH2O = 4.9 × 10⁻⁴ s−1, mkf = −3.9 M−1; and mku = 0.26 M−1.
Figure 6.
(A) Chevron plot of the folding kinetics of isolated I27s. Natural logarithm of unfolding (⋄) and refolding (○) rate constants vs. denaturant concentration. The extrapolation of lnku to 0M denaturant is shown (dashed line). A model of the expected kinetics for a two-state kinetic system is shown (solid line). The refolding and unfolding rate constants from AFM are shown (● and ■, respectively). (B) Plot of pulling rate ÷ 28.5 vs. unfolding force, redrawn from the data shown in Fig. 3. Extrapolation of the AFM data (■) to zero force predicts the spontaneous rate of unfolding of the protein obtained by chemical denaturation (⋄).
RESULTS AND DISCUSSION
Engineering an I27 Polyprotein.
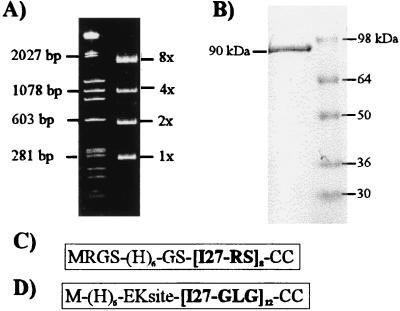
We used recombinant DNA techniques to construct direct tandem repeats of a single Ig domain from titin (see Materials and Methods). One approach adds two new amino acids (Arg and Ser) to the repeating I27 sequence (I27RS8, Fig. 1C). The second method adds a Gly linker plus two new amino acids (Leu and Gly) to the repeating I27 sequence (I27GLG12, Fig. 1D).
Figure 1.
Construction of poly(I27) proteins. (A) Agarose gel stained with ethidium bromide showing the size of the I27–RS multiples (right lane). (B) Coomassie blue staining of the purified I27RS8 protein (≈90 kDa) separated by using SDS/PAGE. (C and D) Summary of the sequence of the I27RS8 and I27GLG12 constructs.
AFM Unfolding of Ig Modules.
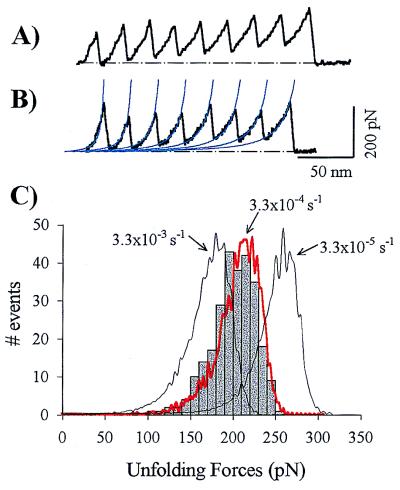
We measured the force-extension relationships for both proteins, I27RS8 and I27GLG12, by using a custom-made single-axis AFM (11). Single proteins were fully extended by retracting the sample holder away from the AFM tip. We measured force-extension curves that showed a sawtooth pattern with as many as 10 peaks for I27GLG12 (Fig. 2A) and 8 peaks for I27RS8 (Fig. 2B). The force peaks were equally spaced by a distance of 24.2 ± 0.82 nm, n = 56, for I27GLG12 and 24.1 ± 0.34 nm, n = 64, for I27RS8, measured at a constant force of 100 pN. The force peaks averaged 204 ± 26 pN (n = 266, eight separate experiments; pulling speed range 0.4–0.6 nm/ms). The force-extension curves of I27GLG12 and I27RS8 are well described by the worm-like-chain model (WLC), which predicts the entropic restoring force generated on the extension of a polymer (10, 11, 22) (Fig. 2B, thin lines). Fits of the WLC to the force-extension curves of I27RS8 gave a persistence length of p = 0.39 ± 0.07 nm (n = 10). The persistence length is a measure of the distance over which the polymer retains memory of a direction. It is significant that the persistence length is of the size of a single amino acid (≈0.4 nm). Consecutive peaks were fitted by the WLC with the same persistence length and a contour-length increment of ΔLc = 28.4 ± 0.3 nm (Fig. 2B, thin lines; n = 16).
Figure 2.
Force–extension relationships for recombinant poly(I27) measured with AFM techniques. (A and B) Stretching of single I27GLG12 (A) or I27RS8 polyproteins (B) give force–extension curves with a sawtooth pattern having equally spaced force peaks. The sawtooth pattern is well described by the WLC equation (continuous lines). (C) Unfolding force frequency histogram for I27RS8. The lines correspond to Monte Carlo simulations of the mean unfolding forces (n = 10,000) of eight domains placed in series by using three different unfolding rate constants, ku0, an unfolding distance, Δxu, of 0.25 nm, and a pulling rate of 0.6 nm/ms.
Stretching either I27GLG12 or I27RS8 resulted in a force-extension curve with peaks that vary randomly in amplitude about a value of ≈200 pN (Fig. 2 A and B). This last result is consistent with the construction of either I27GLG12 or I27RS8, which are made of identical repeats. Hence, the only variations that we expected in the force required to unfold were stochastic. A histogram of force peaks (unfolding force) measured from 266 unfolding events reveals an asymmetrical distribution of events that has a maximum at ≈ 200 pN (Fig. 2C).
Unfolding Is Triggered by a 2.5 Å Extension.
The folding/unfolding of a domain can be modeled as a two-state Markovian process where the rate constants of folding (kf) and unfolding (ku) are determined by the activation energies (ΔG‡) and reaction lengths (Δx). The force-dependent rate constants are given by
 |
 |
where A is the natural frequency of oscillation and Δx is the distance of the reaction length over which the force must be applied to reach the transition state, kB and T are the Boltzmann’s constant and the temperature in Kelvin. Thus, the application of a force on a protein module increases the unfolding rate but decreases the refolding rate.
As individual modules unfold, they relax the force applied to the modules that remain folded and increment the nonlinear (entropic) elasticity of the chain, creating a complex series of events that defies a simple analytical solution. To simulate this complex behavior, we used Monte Carlo techniques (10, 11, 23) and compiled the force required to unfold a domain during the simulated extensions. The kinetic properties of each individual module were those of the two-state model used above. The force applied to the modules was calculated from the WLC model of elasticity and varied depending on the contour length and the total extension of the protein.
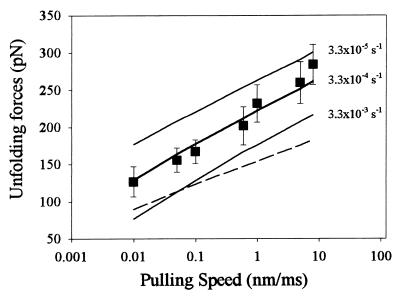
To reproduce the unfolding data of Fig. 2, we assumed that the domains were all identical, with an unfolding rate at zero force ku0 = 3.3 × 10⁻⁴ s−1 and an unfolding distance Δxu = 0.25 nm. The rate of extension was 0.6 nm/ms. Fig. 2C shows the results of the Monte Carlo simulation superimposed on the observed distribution of unfolding forces for I27RS8. An independent estimate of the unfolding rates and distance is obtained by fitting a Monte Carlo simulation to the dependency of the average force of unfolding on the rate of pulling. Experiments in which the polyprotein was pulled at rates varying over the range 0.01–10 nm/ms are shown in Fig. 3. The average force of unfolding is shown to depend on the pulling rate. This dependency is reproduced by a Monte Carlo simulation using ku0 = 3.3 × 10⁻⁴ s−1 and Δxu = 0.25 nm. Thus, by two independent experiments, we find that we reach the transition state for unfolding after an extension of only 2.5 Å and have an unfolding rate constant at zero force of 3.3 × 10⁻⁴ s−1.
Figure 3.
Stretching single I27RS8 proteins at different pulling speeds. Each symbol (■) is the average of (from left to right) 16, 19, 16, 266, 21, 21, and 9 data points. The solid lines correspond to Monte Carlo simulations obtained for three different unfolding rate constants, similar to those shown in Fig. 2. The best fit was obtained with ku0 = 3.3 × 10⁻⁴ s−1 and a Δxu = 0.25 nm. The dashed line corresponds to a Monte Carlo simulation using ku0 = 3.3 × 10⁻⁴ s−1 and a Δxu = 0.35 nm.
Monte Carlo simulations using unfolding rates either 10 times faster or 10 times slower clearly fall well outside of the margin of error of our data and demonstrate the goodness of fit of the chosen parameters. Rief et al. (10, 24) found that a rate of unfolding of 3 × 10⁻⁵ s−1 and a Δxu = 0.3 nm reproduced the rate dependency of the force of unfolding of native titin molecules. However, these parameters fail to describe our data (Figs. 2 and 3). This difference may result from the fact that the native titin protein is composed of a heterogeneous mixture of Ig and fibronectin domains that share a similar fold but diverge widely in their primary sequence and stability (13). Hence, the AFM data obtained from native titin represents a weighted average of Ig and fibronectin type III modules with very different properties and rates mixed together (e.g., see note 13 in ref. 10). In contrast, we report AFM data from a protein engineered to contain identical repeats of a single type of Ig module. Another important experimental difference relates to the length of the proteins being pulled. When pulling native titin, there typically is a long “spacer” segment of unfolded/unknown protein before module-unfolding events are observed (e.g., see Figs. 1 and 5 in ref. 10). This long spacer could be up to several hundred nanometers long and has the effect of reducing the effective pulling rate on the protein. By contrast, our recombinant proteins have a well defined composition and exhibit a short spacer of typically <50 nm.
Figure 5.
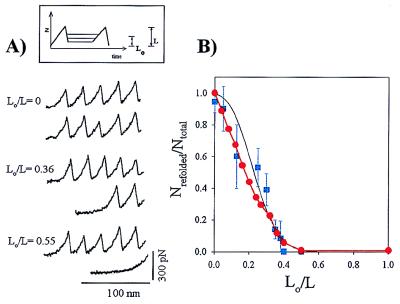
Refolding depends on the degree of relaxation of the I27RS8 protein. (A) A three-step pulse protocol (Inset in A) allows a first extension to completely unfold the I27RS8 protein (upper traces), then the protein is rapidly relaxed to a length L0 for a fixed period of time (5 s). A second extension then allows us to count the number of domains that refold during the relaxation period at that particular length, L0 (bottom traces). (B) Plot of Nrefolded/Ntotal vs. L0/L for 5, 6, 10, 5, 5, 4, 8, 2, 6, and 5 data points obtained from three separate experiments. The black solid line corresponds to the prediction of Eq. 2, using kf0 = 1.2 s−1 and a Δxf = 2.3 nm. ● corresponds to a Monte Carlo simulation of a two-state kinetic model with a folding distance Δxf = 2.3 nm.
Steered molecular dynamic simulations have described the forced unfolding of a β-sandwich module as a sequence of hydrogen bond rupture events (15). Furthermore, recent experiments on a fibronectin type III domain have shown that removal of a very small number of hydrogen bonds significantly accelerates the rate of unfolding (27). The NMR structure of I27 revealed a set of hydrogen bonds linking the β-strands A′G and AB (14). Steered molecular dynamic simulations of the forced unfolding of an I27 module showed that the A′G bonds must first be broken to allow the force to be transmitted through the backbone of the folded polypeptide and cause its unraveling (15). These steered molecular dynamic simulations predicted a force–extension relationship where an extension of 10 Å was necessary to reach the transition state for unfolding, suggesting that the transition state is close to the native form of the I27 protein. This view is qualitatively confirmed by our experiments; however, there is a large discrepancy between the position of the transition state predicted by steered molecular dynamic simulations (see above) and that observed by AFM. Similarly, there is also a large difference between the predicted forces (≈2,000 pN; ref. 15) and the unfolding forces observed by AFM (e.g., Fig. 2). Resolving these discrepancies will be an important step toward elucidating the molecular mechanisms of forced unfolding.
Unfolded Modules Refold Exponentially.
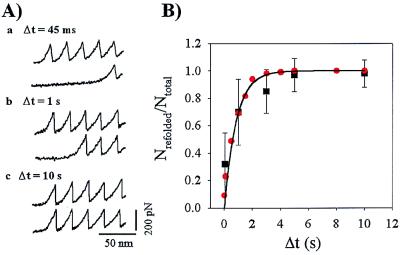
A double pulse experiment designed to measure the folding rate of the I27RS8 modules is illustrated in Fig. 4. A first extension of I27RS8 allows counting of the available folded domains. Because the I27RS8 protein is picked at random and furthermore, because the total extension of the protein is limited to prevent detachment, the number of extended domains is typically less than the maximum (e.g., 4–6 for I27RS8, Fig. 4A). After reaching the extended state, the protein was relaxed to its initial length. After a variable time period, the protein was stretched again, and several force peaks were observed. We interpret these results as an indication that some of the domains unfolded in the first extension of the protein had spontaneously refolded on relaxation. The number of refolded domains counted this way depended exponentially on the amount of time that the protein remained relaxed (Fig. 4B). For a simple two-state model for the folding reaction, when a protein module is relaxed to its original length and there is no applied force, then kf(F) = kf0 ≫ ku(F) = ku0 ≈ 0, resulting in a simple first-order folding reaction, where the folding probability is given by Pƒ(t) = 1 − e−tkf0. This function describes well the folding data of Fig. 4B (solid line), with kf0 = 1.2 s−1.
Figure 4.
(A) Unfolding and refolding cycles of an I27RS8 protein probed with a double-pulse protocol. The protein is first stretched to count the number of domains that unfold, Ntotal, (a–c, upper traces), and then it is relaxed to its initial length. A second extension after a delay, Δt, measures the number of refolded domains, Nrefolded (a–c, lower traces). (B) Plot of the refolded fraction, Nrefolded/Ntotal versus Δt. Each symbol is the average of 53, 17, 20, 8, and 5 data points obtained from six separate experiments. The solid line is a fit of the data to the function Pƒ(t) = 1 − e−tkf0, where kf0 = 1.2 s−1. ●, data from a Monte Carlo simulation of a two-state folding/unfolding kinetic model using a folding rate constant, kf0 = 1.2s−1.
Folding Involves a Contraction by 23 Å.
Determination of the folding distance, Δxf, involves measuring how much the folding rate constant depends on the applied force. To measure the folding distance, we used the double-pulse protocol shown in Fig. 5A. We start by completely unfolding the tandem modules with a first extension. We then rapidly relax the protein to a length L0 and hold it at that length for a fixed amount of time (5 s). A second extension then allows us to count the number of domains that refolded during the 5-s relaxation at that particular length, L0. For any value of L0 > 0, a force is applied to the protein because of the entropic restoring force of the extended polypeptide chain. This entropic force can be estimated by using the WLC model. Hence, the experiment consists of measuring the number of refolded modules for a given pulse interval (e.g., 5 sec) as a function of the resting length L0. Fig. 5 illustrates this experiment. If, after a first extension, the protein is relaxed completely (L0 = 0), a second extension 5 sec later reveals that all of the previously unfolded modules had refolded. However, if the protein is relaxed only partially, the number of refolded modules rapidly decreases. If the protein is relaxed by only ≈50% of its length, no refolding is observed (Fig. 5A). A plot of the folded fraction Nrefolded/Ntotal vs. (L0/L) is shown in Fig. 5B.
Refolding of the I27RS8 protein is well described by a single exponential of the form Nrefolded/Ntotal = 1 − exp(−tkf0), where kf0 = 1.2 s−1 corresponds to the folding rate of the protein in a relaxed state under zero applied force (Fig. 4B). However, in the experiment shown in Fig. 5, the protein is allowed to fold under an applied force that depends on the ratio L0/L. Hence we can write:
 |
2 |
where kf(L0/L) = kf0exp(−F(Lo/L)Δxf/kT). Because during a refolding experiment the contour length, L, is known, we can calculate the force, F(L0/L), that strains the protein at length Lo. We can then calculate Nrefolded/Ntotal (L0/L) for a given Δxf. Fig. 5B (solid line) shows that the experimental data are well described by Nrefolded/Ntotal (L0/L) computed with Δxf = 2.3 nm and kf0 = 1.2 s−1. A Monte Carlo simulation using a refolding rate kf0 = 1.2 s−1 and a refolding distance Δxf = 23 Å accurately predicted the number of folded modules as a function of the time interval between pulses (Fig. 4B) and the number of folded modules as a function of the fractional length at which refolding occurred (Fig. 5B).
Chemical Folding of Untethered Modules.
To verify the validity of the folding parameters determined by single-protein AFM we also studied the folding of isolated modules by using standard chemical denaturation. The equilibrium denaturation of [I27–RS] modules (not shown) was well described by a two-state equilibrium model (21) in which only two states, the folded native state, N, and the denatured state, D, are occupied at equilibrium. The free energy of folding of I27, extrapolated to 0 M GdmCl (Eq. 1) is 7.5 ± 0.3 kcal⋅mol−1. ([D]50% = 3.04 M, m = 2.5 kcal⋅mol−1⋅M−1). These values are close to those reported for the wild-type protein (13).
The kinetics of folding are shown in Fig. 6A. The natural logarithm of the unfolding rate constant shows a small linear dependence on denaturant concentration. The rate constant for unfolding, extrapolated to 0 M denaturant, kuH2O, is 4.9 ± 0.6 × 10⁻⁴ s−1. The refolding data deviate from linearity at GdmCl concentrations <1 M. Linear and polynomial extrapolations of the data in this region give a value for kfH2O of 30 ± 2 sec−1. Direct measurement of kfH2O at 0 M GdmCl by using a pH shift gives a value of kfH2O = 32 sec−1. Both the kf and ku are in the range previously observed for other β-sandwich proteins (3–6, 8, 25–27). The low denaturant dependence of lnku (Fig. 6A) (mku) is unusual for proteins with this fold.
From the kinetic data, it is also possible to deduce the position of the transition state, ‡, on the folding pathway (28). The m value mD−N, the dependence of the free energy change ΔGD−N on denaturant, allows us to judge the relative change in solvent exposure as the protein unfolds from the native state, N, to the denatured state, D (29). Thus, the position of the transition state on the folding coordinate can be determined from the relative values of m‡−N, mD−‡, and mD−N, where mD−N is the equilibrium m value. The values of m‡−N and mD−‡ can be determined from the denaturant dependence of lnku and lnkf, respectively. In our case, m‡−N = RTmku can be determined simply, because lnku has a linear dependence on GdmCl concentration, so that m‡−N/mD−N ≈ 0.1. mD−‡ is harder to determine directly because lnkf deviates from linearity at low GdmCl concentration (see below). However, because mD−N = mD−‡ + m‡−N, then mD−‡/mD−N = 0.9. Hence, the transition state for folding of I27 (‡) is close to the native state in solvent accessibility.
A comparison of equilibrium and kinetic data makes it possible to judge whether folding kinetics follow a two-state kinetic pattern (28). In a two-state system, the ΔG calculated from kinetic data (ΔGkin = −RTlnkf/ku) should be the same as that determined by equilibrium denaturation, when proline isomerization is taken into account (30). Here, ΔGkin = 6.6 kcal⋅mol−1 < ΔGeq = 7.5 kcal⋅mol−1. At low GdmCl concentration (<1 M), there is “roll-over,” indicating deviation from two-state kinetics. The solid line in Fig. 6A shows the values of kobs that would be predicted for a two-state kinetic system using the experimental values for the unfolding rate constant (ku), denaturant dependence of lnku (mku), and the equilibrium value of ΔG and m. A kinetic intermediate is, apparently, populated at low [D]. However, from kinetic data alone, it is not possible to determine whether this is an on- or off-pathway intermediate.
AFM Folding Pathway.
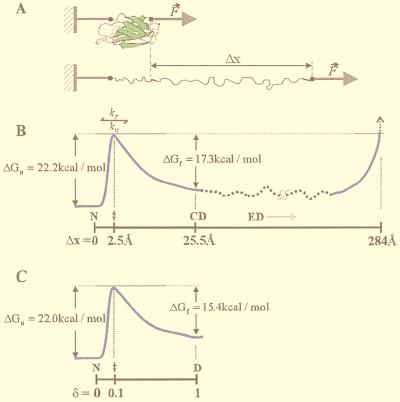
Our AFM results suggest that, after a stretch denaturation, the individual modules of the I27RS8 begin to fold from an extended denatured state where an Ig domain is stretched out by a length of 284 Å (Fig. 7 A and B). If a module is relaxed to zero force after reaching its extended state, it will recoil spontaneously. All polymers tend to attain their most disordered state that corresponds to an end-to-end length R given by <R2> ≈ 2pLc(1 − p/Lc), where Lc is the contour length and p is the persistence length of the polymer (31) (WLC model). A fully extended I27 (Lc = 89 aa × 0.38 nm = 33.82 nm) with a persistence length of p = 0.39 nm is predicted to spontaneously retract to a length of R = 5.1 nm, recoiling a total of 287 Å, which is close to the change in contour length observed on unfolding/refolding captured by AFM (284 Å; see above). On relaxation, the gain in length caused by stretching I27 is reversed by the spontaneous entropic recoiling of the polymer chain. However, the protein cannot spontaneously recoil to its folded length because the polypeptide must first overcome an energy barrier (Fig. 7B). Hence, the polypeptide retracts only until it reaches the condensed denatured state. Folding occurs only after reaching the transition state by a further contraction of 23 Å accompanied by a free energy increase of 17.3 kcal⋅mol−1 (kf0 = 1.2 s−1, 25°C) (Fig. 7B). The native state is then reached by a further contraction by 2.5 Å and a free energy decrease of 22.2 kcal⋅mol−1 (ku0 = 3.3 × 10⁻⁴ s−1, 25°C).
Figure 7.
Comparison of the folding pathway of an Ig domain denatured by an applied force or chemical denaturants. (A) Model of the stretching of a single Ig domain. Under an applied force, an Ig domain unravels, causing an increase in the end-to-end length, Δx. (B) Diagram of the folding pathway for an Ig domain as determined by using AFM. The changes in free energy (ΔG) are plotted vs. the reaction coordinate (end-to-end extension; Δx). Three distinct states are identified: native (N, Δx = 0), condensed denatured (CD, Δx = 25.5Å), and extended denatured (ED, 25.5 < Δx < 284 Å). The transition state, ‡, is located 2.5 Å away from the native state and 23 Å away from the condensed denatured state. (C) The folding pathway determined by using chemical denaturants. The changes in free energy (ΔG) between the native, N, and the denatured, D, state are shown vs. the reaction coordinate characterized by a fractional distance δ, where 0 < δ < 1 and δ‡ = m‡−N/mD−N = 0.1. The putative intermediate is not shown, as its position in the folding coordinate has not been determined.
The Entropic Cost of Tethering.
The folding rate estimated by extrapolating to 0 M denaturant (Fig. 6A; 32 s−1) is significantly larger than that extrapolated to zero force (1.2 s−1). The refolding rate reflects the difference in stability between the denatured state and the transition state for folding. These observations indicate that the free energy difference between the transition state and the unfolded state for a tethered protein module is ≈1.9 kcal⋅mol−1 larger than for the free modules (Fig. 7 B and C). The slower rate of refolding of tethered proteins is likely to result from a restriction in the degrees of freedom of the molecule caused by their attachment to the AFM probe. In addition, when we stretch a protein we reduce its entropy and generate a restoring force. If tethered folding occurs under a very slight entropic restoring force, the measured folding rate could be significantly diminished. For example, a force of only 5 pN reduces the folding rate of an I27 by ≈17 times.
AFM and Chemical Unfolding Pathways Compared.
It is interesting to compare the results of AFM unfolding with the results obtained by chemical unfolding (Fig. 6). The unfolding rate constant extrapolated to 0 M denaturant (Fig. 6A; 4.9 × 10⁻⁴ s−1) is similar to that obtained from the Monte Carlo simulation of the AFM data (3.3 × 10⁻⁴ s−1). We further examine this comparison in Fig. 6B, where we show that the AFM data readily extrapolates to the unfolding rate obtained by chemical denaturation. We consider that if the pulling rate is small enough such that an I27 polyprotein is extended with very little opposing force (F ≈ 0 in Fig. 6B), on average at least one module must be unfolding every time the protein is extended by 28.5 nm. Hence, a plot of pulling rate ÷ 28.5 vs. unfolding force extrapolated to zero force should reveal the spontaneous unfolding rate of the protein. This plot is shown in Fig. 6B, where the unfolding rate obtained by chemical denaturation is shown to be predicted by the AFM data.
The similarity in rate constant between AFM and chemical denaturation indicates that the height of the unfolding energy barrier is similar in both cases (Fig. 7 B and C; ΔGuH2O = 22 kcal⋅mol−1 and ΔGuF=0 = 22.2 kcal⋅mol−1). Our results also suggest that the transition state is very similar for both the AFM and chemically induced unfolding. The transition state for unfolding by AFM is located 2.5 Å away from the native state and 23Å away from the condensed denatured state (Fig. 7B). In chemically induced denaturation, the position of the transition state on the folding coordinate is given by δ = m‡−N/m = 0.1, where δ is the reaction coordinate between the native (δ = 0) and denatured (δ = 1) states (Fig. 7C). If the chemically denatured state is equated to the condensed denatured state induced by stretching, the position of the transition state is similarly placed in either chemically or force denatured proteins (Fig. 7 B and C).
Conclusions.
Single-protein recordings by AFM remained limited, because when stretching a native multimodular protein, it is not possible to assign experimental observables to individual domains because of their heterogeneity. Furthermore, it was not known whether mechanical-unraveling events by AFM represented true unfolding events. Here we have resolved these issues explicitly, opening the way for the extensive use of AFM as a tool for the measurement of protein-folding reactions at the level of single molecules.
Acknowledgments
M.C.V., A.F.O., P.E.M., and J.M.F. are funded by National Institutes of Health R01 grants, S.B.F. and J.C. are funded by the Wellcome Trust, U.K.
ABBREVIATIONS
- AFM
atomic force microscope/microscopy
- I27
human cardiac titin I band module 27
- GdmCl
guanidium chloride
- WLC
worm-like chain model
Footnotes
This paper was submitted directly (Track II) to the Proceedings Office.
References
- 1.Bork P, Downing A K, Kieffer B, Campbell I D. Q Rev Biophys. 1996;29:119–167. doi: 10.1017/s0033583500005783. [DOI] [PubMed] [Google Scholar]
- 2.Bork P, Helm L, Sander C. J Mol Biol. 1994;242:309–320. doi: 10.1006/jmbi.1994.1582. [DOI] [PubMed] [Google Scholar]
- 3.Fong S, Hamill S J, Proctor M, Freund S M V, Benian G M, Clothia C, Bycroft M, Clarke J. J Mol Biol. 1996;264:624–639. doi: 10.1006/jmbi.1996.0665. [DOI] [PubMed] [Google Scholar]
- 4.Plaxco K W, Spitzfaden C, Campbell I D, Dobson C M. Proc Natl Acad Sci USA. 1996;93:10703–10706. doi: 10.1073/pnas.93.20.10703. [DOI] [PMC free article] [PubMed] [Google Scholar]
- 5.Clarke J, Hamill S J, Johnson C M. J Mol Biol. 1997;270:771–778. doi: 10.1006/jmbi.1997.1147. [DOI] [PubMed] [Google Scholar]
- 6.Jackson S E. Fold Des. 1998;3:R81–R91. doi: 10.1016/S1359-0278(98)00033-9. [DOI] [PubMed] [Google Scholar]
- 7.Campbell, I. D. & Downing, A. K. (1998) Nat. Struct. Biol.5 Suppl, 496–499. [DOI] [PubMed]
- 8.Plaxco K W, Spitzfaden C, Campbell I D, Dobson C M. J Mol Biol. 1997;270:763–770. doi: 10.1006/jmbi.1997.1148. [DOI] [PubMed] [Google Scholar]
- 9.Fersht A R. Curr Opin Struct Biol. 1995;5:79–84. doi: 10.1016/0959-440x(95)80012-p. [DOI] [PubMed] [Google Scholar]
- 10.Rief M, Gautel M, Oesterhelt F, Fernandez J M, Gaub H E. Science. 1997;276:1109–1112. doi: 10.1126/science.276.5315.1109. [DOI] [PubMed] [Google Scholar]
- 11.Oberhauser A F, Marszalek P E, Erickson H P, Fernandez J M. Nature (London) 1998;393:181–185. doi: 10.1038/30270. [DOI] [PubMed] [Google Scholar]
- 12.Bell G I. Science. 1978;200:618–627. doi: 10.1126/science.347575. [DOI] [PubMed] [Google Scholar]
- 13.Politou A S, Thomas D J, Pastore A. Biophys J. 1995;69:2601–2610. doi: 10.1016/S0006-3495(95)80131-1. [DOI] [PMC free article] [PubMed] [Google Scholar]
- 14.Improta S, Politou A S, Pastore A. Structure (London) 1996;4:323–337. doi: 10.1016/s0969-2126(96)00036-6. [DOI] [PubMed] [Google Scholar]
- 15.Lu H, Isralewitz B, Krammer A, Vogel V, Schulten K. Biophys J. 1998;75:662–671. doi: 10.1016/S0006-3495(98)77556-3. [DOI] [PMC free article] [PubMed] [Google Scholar]
- 16.Kempe T, Kent S B, Chow F, Peterson S M, Sundquist W I, L’Italien J J, Harbrecht D, Plunkett D, DeLorbe W J. Gene. 1985;39:239–245. doi: 10.1016/0378-1119(85)90318-x. [DOI] [PubMed] [Google Scholar]
- 17.Hartley J L, Gregori T J. Gene. 1981;13:347–353. doi: 10.1016/0378-1119(81)90014-7. [DOI] [PubMed] [Google Scholar]
- 18.Graham G J, Maio J J. BioTechniques. 1992;13:780–789. [PubMed] [Google Scholar]
- 19.Florin E L, Rief M, Lehmann H, Ludwig M, Dornmair C, Moy V T, Gaub H E. Biosens Bioelectron. 1995;10:895–901. [Google Scholar]
- 20.Miroux B, Walker J E. J Mol Biol. 1996;260:289–298. doi: 10.1006/jmbi.1996.0399. [DOI] [PubMed] [Google Scholar]
- 21.Pace C N. Methods Enzymol. 1986;131:266–280. doi: 10.1016/0076-6879(86)31045-0. [DOI] [PubMed] [Google Scholar]
- 22.Marko J F, Siggia E D. Macromolecules. 1995;28:8759–8770. [Google Scholar]
- 23.Kellermayer M S, Smith S B, Granzier H L, Bustamante C. Science. 1997;276:1112–1116. doi: 10.1126/science.276.5315.1112. [DOI] [PubMed] [Google Scholar]
- 24.Rief M, Gautel M, Schemmel A, Gaub H E. Biophys J. 1998;75:3008–3014. doi: 10.1016/S0006-3495(98)77741-0. [DOI] [PMC free article] [PubMed] [Google Scholar]
- 25.Parker M J, Clarke A R. Biochemistry. 1997;36:5786–5794. doi: 10.1021/bi9629283. [DOI] [PubMed] [Google Scholar]
- 26.Spitzfaden C, Grant R P, Mardon H J, Campbell I D. J Mol Biol. 1997;265:565–579. doi: 10.1006/jmbi.1996.0736. [DOI] [PubMed] [Google Scholar]
- 27.Hamill S J, Meekhof A E, Clarke J. Biochemistry. 1998;37:8071–8079. doi: 10.1021/bi9801659. [DOI] [PubMed] [Google Scholar]
- 28.Matouschek A, Fersht A R. Proc Natl Acad Sci USA. 1993;90:7814–7818. doi: 10.1073/pnas.90.16.7814. [DOI] [PMC free article] [PubMed] [Google Scholar]
- 29.Myers J K, Pace C N, Scholtz J M. Protein Sci. 1995;4:2138–2148. doi: 10.1002/pro.5560041020. [DOI] [PMC free article] [PubMed] [Google Scholar]
- 30.Jackson S E, Fersht A R. Biochemistry. 1991;30:10428–10435. doi: 10.1021/bi00107a010. [DOI] [PubMed] [Google Scholar]
- 31.Rivetti C, Walker C, Bustamante C. J Mol Biol. 1998;280:41–49. doi: 10.1006/jmbi.1998.1830. [DOI] [PubMed] [Google Scholar]


