

Abstract
The G72/G30 gene complex (G72 also known as D-amino acid oxidase activator, DAOA) and its chromosomal region 13q32–34 have been linked and associated with both schizophrenia (SCZ) and bipolar disorder (BP) in multiple studies, including our initial association report on BP. However, the inconsistency of associated variants across studies is obvious. Previous meta-analyses had small data sets. The present meta-analysis combined 18 association articles published before April of 2007. There were 19 independent studies of SCZ, with 4304 cases, 5423 controls, and 1384 families, and four independent studies of BP with 1145 cases, 1829 controls, and 174 families. Of 15 single nucleotide polymorphisms (SNPs) analyzed in the 95-kb G72/G30 gene region, M18/rs947267 and M22/rs778293 showed association with SCZ in Asians, and M24/rs1421292 with SCZ in Europeans. The associations of C allele at M18 and A allele at M22 with SCZ in Asians survived conservative Bonferroni correction for multiple testing for 15 markers and subgroup analysis (adjusted P = 0.0000253 for M18; adjusted P = 0.009 for M22). No single maker showed evidence of overall association with BP. These results suggest that G72/G30 may influence susceptibility to schizophrenia with weak effects.
Keywords: G72, G30, D-amino acid oxidase activator (DAOA), single nucleotide polymorphism, schizophrenia, bipolar disorder, meta-analysis, association
1. Introduction
Kraepelin’s dichotomy implies that schizophrenia (SCZ) and bipolar disorder (BP) are two separate disease entities with different underlying etiologies (Kendell, 1987; Kraepelin, 1919). However, SCZ and BP show an overlap in clinical symptoms (including increased suicide risk) (Kravariti et al., 2005; Martinez-Aran et al., 2002; Seidman et al., 2002; Van et al., 1999) as well as in genetic etiology as discussed below.
Twin and adoption studies over much of the 20th century provided consistent evidence for a genetic component that increases susceptibility to each disorder (Shih et al., 2004). Systematic diagnosis of relatives using structured instruments suggests that there is a substantial overlap in co-aggregation of other mood disorders (major depression and schizoaffective disorder) in families with an individual suffering from a core disorder of BP or SCZ (Gershon et al., 1982; Gershon et al., 1988; Maier et al., 1993). This implies shared genetic susceptibility loci for SCZ and BP (Cardno et al., 2002; Farmer et al., 1987; Gershon et al., 1982; Gershon et al., 1988; Kendler et al., 1985; Kendler, 1986; Kendler et al., 1993; Maier et al., 1993).
Recent linkage and association data also suggests overlap in genetic etiology for the two disorders (Craddock et al., 2005; Craddock et al., 2006; Potash, 2006). A meta-analysis of all published whole-genome linkage scans before 2000 implicated two regions (on 13q and 22q) significantly linked to each disorder (Badner and Gershon, 2002). Shortly afterward, the G72/G30 gene complex (G72 is now officially known as D-aminoacid oxidase activator, DAOA) was associated, independently, with each disorder (Chumakov et al., 2002; Hattori et al., 2003). An association has been reported in multiple independent studies (Addington et al., 2004; Chen et al., 2004; Fallin et al., 2005; Hall et al., 2004; Hong et al., 2006; Korostishevsky et al., 2004; Korostishevsky et al., 2006; Ma et al., 2006; Schulze et al., 2005; Schumacher et al., 2004; Wang et al., 2004; Williams et al., 2006; Yue et al., 2006; Yue et al., 2007; Zou et al., 2005). However, several studies did not find association with traditional BP or SCZ phenotype (Bakker et al., 2007; Goldberg et al., 2006; Liu et al., 2006; Mulle et al., 2005; Vilella et al., 2007; Wood et al., 2006). In addition, an obvious inconsistency of allelic association(s) has been observed.
In a meta-analysis using Fisher’s chi-square method (combining P values across studies), Detera-Wadleigh and McMahon (Detera-Wadleigh and McMahon, 2006) reviewed seven G72/G30 association studies in SCZ and three in BD, and found that there were several single nucleotide polymorphisms (SNPs) significantly associated with both SCZ and/or BP. In a recent meta-analysis of 11 studies including 2138 cases, 2228 controls and 463 parent-offspring trios, Li and He (Li and He, 2007) found four markers in the G72/G30 gene region (M12/rs3916965, M15/rs2391191, M23/rs3918342 and M24/rs1421292) significantly associated with SCZ. M12, M15 and M23 showed significant evidence of between-study heterogeneity. No evidence of association is shown in the meta-analysis of G72/G30 data in the SchizophreniaGene Database of Schizophrenia Research Forum (http://www.schizophreniaforum.org/res/sczgene/default.asp), which does not include family-based association data.
Since then, 13 more G72/G30 association studies in SCZ and three more in BP have been published (Bakker et al., 2007; Fallin et al., 2005; Goldberg et al., 2006; Hong et al., 2006; Korostishevsky et al., 2006; Liu et al., 2006; Ma et al., 2006; Nicodemus et al., 2007; Schulze et al., 2005; Vilella et al., 2007; Williams et al., 2006; Wood et al., 2006; Yue et al., 2006; Yue et al., 2007), with inconsistent associated alleles or haplotypes. Here we report an updated meta-analysis to re-evaluate the relationship between variants in the G72/G30 gene region and these two major psychiatric disorders.
2. Methods
2.1. Literature searches
Selection of literature was accomplished by searching the PubMed database of the National Center for Biotechnology Information (NCBI) using the keywords “schizophrenia”, “bipolar disorder”, “G72”, “G30” and “DAOA”. All English literature published before April 12, 2007 was analyzed. All references cited in articles on association analyses, reviews and/or meta-analyses were examined to identify potential additional studies not revealed by searching the PubMed. The association studies in SCZ were also extracted from the SchizophreniaGene Database by searching gene of “DAOA” (http://www.schizophreniaforum.org/res/sczgene/default.asp), which was accessed on April 12, 2007.
2.2. Inclusion Criteria
Studies included in our meta-analysis had to fulfill five criteria: (1) published in a peer-reviewed journal; (2) detailed description of the samples tested (including sample size, ancestry of samples, diagnostic criteria for schizophrenia or bipolar disorder (sub-phenotypes or endo-phenotypes not considered); (3) data published or furnished by correspondence. These data had to contain marker information (marker name or position on chromosome), allele frequency in case and control groups in population-based studies or numbers of transmitted and non-transmitted alleles from heterozygous parents to affected offspring in family-based studies; (4) sample not duplicative of other reports; and (5) there had to be at least three studies reporting results for each marker subjected to meta-analysis.
2.3. Statistical Analyses
We performed allelic meta-analyses on SCZ and BP separately. We excluded SNP reports if they violated the Hardy-Weinberg Equilibrium (HWE) in the controls of population-based studies or in the parents of family-based data.
A single report was considered as containing separate association studies when it included unrelated both case-control and family-based data, analyzed each disorder separately, or if it separately analyzed samples from distinct populations. We integrated population-based and family-based association studies into a single meta-analysis using the method described in detail elsewhere (Cho et al., 2005; Kazeem and Farrall, 2005; Lohmueller et al., 2003). Briefly, counts of alleles in case and control groups in population-based studies were summarized in two-by-two tables. For family-based studies, the number of each transmitted allele from heterozygous parents to affected offspring were treated as the number of occurrence of that allele in cases and considering the controls to be a very large population with equal numbers of each allele (to reflect the expected 50:50 transmission ratio (Lohmueller et al., 2003). The transmitted and non-transmitted risk alleles were summarized in two-by-one tables. For each table, the natural logarithms of odds ratios (ORs) and standard errors (SEs) were calculated based on the allelic data (Kazeem and Farrall, 2005). The “risk” alleles were assigned according to the initial reports (Chumakov et al., 2002; Hattori et al., 2003).
Cochran’s chi-square-based Q-statistic test was applied to assess between-study heterogeneity. Q is distributed approximately as a chi-square statistic with k-1 degrees of freedom (k = number of studies). Overall ORs and their 95% CIs were estimated under both the Mantel-Haenszel’s fixed-effects (MANTEL and HAENSZEL, 1959) and DerSimonian-Laird’s random-effects models (DerSimonian and Laird, 1986). The fixed-effects model assumes all of the studies are estimating the same underlying effect and considers only within-study variation, while the random-effects model assumes between-study heterogeneity attributed to both between-study and within-study variance. The random-effects model is more conservative than the fixed-effects model and produces a wider confidence interval. When there is no evidence of heterogeneity, the random-effects model will give similar results to the fixed-effects model. Significance of overall OR was examined using a Z-test, and the P values were adjusted using Bonferroni correction when there were multiple tests.
For a sensitivity analysis, each individual study was removed in turn from the analysis, and meta-analysis was re-performed. This approach can determine whether a finding in the meta-analysis is due to contribution of a single study.
Evidence for publication bias was assessed using Egger’s regression asymmetry statistics with a funnel plot of natural logarithm of OR (Ln(OR)) against inverse SE in each study (Egger et al., 1997).
The meta-analyses were carried out using the program Meta-analysis with Interactive eXplanations (MIX, version 1.54) (Bax et al., 2006). To detect potential effects of different ancestries (European versus Asian) or study design types (case-control versus family-based), overall ORs and SEs were obtained for each group, then heterogeneity of overall ORs between different ancestries or study designs were assessed using a chi-square test with one degree of freedom, similar to the method introduced by Kazeem and Farrall (Kazeem and Farrall, 2005). A significance level was set at P = 0.05 for all tests with exception of P = 0.1 for the Q-test and Egger’s test.
The Haploview program (version 4.0) (Barrett et al., 2005) was used to assess linkage disequilibrium (LD) between marker pairs and construct haplotype blocks on the genotype data from the 30 Centre d’Etude du Polymorphisme Humain (CEPH) trios in the International HapMap Project (http://www.hapmap.org). We focused on the 95-kb G72/G30 gene region from M12 to M24 (HapMap Data Rel21a/phaseII Jan07, On NCBI B35 assembly, dbSNP b125).
3. Results
3.1. Description of Studies
Several studies were excluded because of sample duplication with another study (Yue et al., 2006), lack of sufficient data even after requesting informative data from the authors (Fallin et al., 2005; Goldberg et al., 2006; Hall et al., 2004; Nicodemus et al., 2007). M12, M15, M23 and M24 were excluded for BP because they were analyzed in only one or two studies (Schulze et al., 2005). After these exclusions, a total of 18 articles were used for meta-analysis. There were 16 articles with 19 independent samples on SCZ, and four studies with four independent samples on BP published between 2002 and April, 2007. These studies are summarized in Table 1. The studies on SCZ include 4304 cases and 5423 controls in case-control studies and 1384 families in family-based studies. The four studies on BP include 1145 cases and 1829 controls in case-control studies and 174 families in our family-based association study. The details of most of the case-control studies in SCZ can also be found in the SchizophreniaGene Database. When the genotypes in the Database (calculated based on assuming them in HWE) are different from the original data provided by the authors, we used the original.
Table 1.
Characteristics of studies included in the meta-analysis
| Study (year) | Disease | Design | Case number | Control number | Ethnicity |
|---|---|---|---|---|---|
| Chumakov et al. (a) (2002) | schizophrenia | Case-control | 213 | 241 | European |
| Chumakov et al. (b) (2002) | schizophrenia | Case-control | 183 | 183 | European |
| Korostishevsky et al. (2004) | schizophrenia | Case-control | 60 | 130 | European |
| Schumacher et al. (a) (2004) | schizophrenia | Case-control | 299 | 300 | European |
| Wang et al. (2004) | schizophrenia | Case-control | 537 | 538 | Asian |
| Ma et al. (a) (2006) | schizophrenia | Case-control | 588 | 588 | Asian |
| Ma et al. (b) (2006) | schizophrenia | Case-control | 183 | 182 | European |
| Wood et al. (2006) | schizophrenia | Case-control | 311 | 291 | European |
| Williams et al. (a) (2006) | schizophrenia | Case-control | 709 | 1416 | European |
| Bakker et al. (2007) | schizophrenia | Case-control | 273 | 580 | European |
| Vilella et al. (2007) | schizophrenia | Case-control | 589 | 615 | European |
| Yue et al. (a) (2007) | schizophrenia | Case-control | 359 | 359 | Asian |
| Addington et al. (2004) | schizophrenia | Family-based | 98 families | Mixed | |
| Mulle et al. (2005) | schizophrenia | Family-based | 159 families | Mixed | |
| Zou et al. (2005) | schizophrenia | Family-based | 233 families | Asian | |
| Korostishevsky et al. (2006) | schizophrenia | Family-based | 223 families | European | |
| Hong et al. (2006) | schizophrenia | Family-based | 216 families | Asian | |
| Liu et al. (2006) | schizophrenia | Family-based | 218 families | Asian | |
| Yue et al. (b) (2007) | schizophrenia | Family-based | 237 families | Asian | |
| Chen et al. (2004) | bipolar disorder | Case-control | 139 | 113 | European |
| Schumacher et al. (b) (2004) | bipolar disorder | Case-control | 300 | 300 | European |
| Williams et al. (b) (2006) | bipolar disorder | Case-control | 706 | 1416 | European |
| Hattori et al. (2003)a | bipolar disorder | Family-based | 174 families | European | |
The data from two family sample sets (Hattori et al) were combined for convenient to statistical analysis.
3.2. Meta-analysis of Studies on Schizophrenia
For all samples combined, seven SNPs revealed significant between-study heterogeneity (P(Q) < 0.1); M18 and M24 showed nominally significant overall association (uncorrected P(Z) < 0.05) (Table 2), which could not survive correction for multiple testing for 15 markers (Bonferroni corrected P > 0.05). No publication bias was found in Egger’s regression analyses.
Table 2.
Meta-analyses of allelic association studies of the G72/G30 gene with psychiatric disorders
| Allele frequencyd |
||||||||
|---|---|---|---|---|---|---|---|---|
| Disease | Marker (risk allele)a | Ancestryb | Studiesc | Case | Control | OR (95% CI)e | P(Z)f | P(Q)g |
| SCZ | M12/rs3916965 (G) | All ethnicities | 8 CC; 4 Fam | 0.527 | 0.549 | 0.96 (0.85–1.07) | 0.46 | 0.002 |
| European | 6 CC; 2 Fam | 0.614 | 0.608 | 1.01 (0.87–1.17) | 0.92 | 0.03 | ||
| Asian | 2 CC; 2 Fam | 0.398 | 0.421 | 0.90 (0.75–1.08) | 0.25 | 0.01 | ||
| M13/rs3916966 (A) | All ethnicities | 3 CC; 3 Fam | 0.595 | 0.579 | 1.08 (0.94–1.23) | 0.27 | 0.66 | |
| European | 3 CC; 1 Fam | 0.595 | 0.579 | 1.08 (0.91–1.28) | 0.40 | 0.40 | ||
| rs1935058 (C) | All ethnicities | 2 CC; 1 Fam | 0.437 | 0.448 | 1.02 (0.83–1.25) | 0.85 | 0.13 | |
| European | 2 CC; 1 Fam | 0.437 | 0.448 | 0.95 (0.85–1.07) | 0.41 | 0.95 | ||
| rs1341402 (T) | European | 3 CC; 1 Fam | 0.656 | 0.700 | 1.04 (0.92–1.17) | 0.53 | 0.86 | |
| M14/rs3916967 (A) | All ethnicities | 7 CC; 5 Fam | 0.506 | 0.525 | 1.00 (0.91–1.10) | 0.98 | 0.05 | |
| European | 5 CC; 5 Fam | 0.602 | 0.608 | 0.98 (0.85–1.14) | 0.83 | 0.08 | ||
| Asian | 2 CC; 2 Fam | 0.382 | 0.391 | 0.98 (0.87–1.09) | 0.7 | 0.32 | ||
| M15/rs2391191 (G) | All ethnicities | 10 CC; 6 Fam | 0.536 | 0.562 | 0.95 (0.86–1.04) | 0.25 | 0.0009 | |
| European | 7 CC; 1 Fam | 0.620 | 0.618 | 0.98 (0.88–1.10) | 0.77 | 0.04 | ||
| Asian | 3 CC; 3 Fam | 0.389 | 0.423 | 0.88 (0.76–1.01) | 0.07 | 0.02 | ||
| M16/rs3918341 (A) | All ethnicities | 2 CC; 2 Fam | 0.606 | 0.567 | 1.09 (0.93–1.28) | 0.27 | 0.89 | |
| European | 2 CC; 2 Fam | 0.606 | 0.567 | 1.12 (0.93–1.34) | 0.23 | 0.82 | ||
| rs1935062 (C) | All ethnicities | 3 CC; 1 Fam | 0.460 | 0.450 | 1.00 (0.83–1.20) | 0.98 | 0.10 | |
| European | 2 CC; 1 Fam | 0.339 | 0.347 | 0.97 (0.76–1.22) | 0.78 | 0.16 | ||
| M18/rs947267 (C) | All ethnicities | 6 CC; 3 Fam | 0.389 | 0.409 | 0.87 (0.77–0.99) | 0.03 | 0.04 | |
| European | 5 CC; 1 Fam | 0.411 | 0.416 | 0.97 (0.87–1.08) | 0.54 | 0.36 | ||
| Asian | 1 CC; 2 Fam | 0.306 | 0.379 | 0.71 (0.62–0.83) | 5.62E-06 | 0.96 | ||
| M19/rs778294 (T) | All ethnicities | 7 CC; 4 Fam | 0.219 | 0.245 | 0.94 (0.85–1.04) | 0.21 | 0.23 | |
| European | 5 CC; 2 Fam | 0.279 | 0.292 | 0.92 (0.82–1.05) | 0.21 | 0.27 | ||
| Asian | 2 CC; 2 Fam | 0.127 | 0.135 | 0.92 (0.76–1.12) | 0.41 | 0.24 | ||
| M20/rs3916970 (A) | All ethnicities | 3 CC; 2 Fam | 0.402 | 0.395 | 1.03 (0.89–1.18) | 0.71 | 0.60 | |
| European | 3 CC; 1 Fam | 0.402 | 0.395 | 1.08 (0.92–1.27) | 0.35 | 0.72 | ||
| M21/rs3916971 (C) | All ethnicities | 3 CC; 3 Fam | 0.616 | 0.569 | 1.12 (0.98–1.28) | 0.09 | 0.90 | |
| European | 3 CC; 2 Fam | 0.616 | 0.569 | 1.16 (0.99–1.36) | 0.06 | 0.80 | ||
| M22/rs778293 (A) | All ethnicities | 8 CC; 4 Fam | 0.609 | 0.616 | 0.99 (0.87–1.13) | 0.89 | 0.0001 | |
| European | 6 CC; 1 Fam | 0.615 | 0.604 | 1.11 (0.94–1.30) | 0.22 | 0.007 | ||
| Asian | 2 CC; 1 Fam | 0.598 | 0.646 | 0.81 (0.72–0.91) | 0.0002 | 0.48 | ||
| M23/rs3918342 (T) | All ethnicities | 9 CC; 3 Fam | 0.476 | 0.486 | 1.01 (0.85–1.19) | 0.95 | < 0.0001 | |
| European | 6 CC; 2 Fam | 0.486 | 0.495 | 1.07 (0.78–1.47) | 0.69 | < 0.0001 | ||
| Asian | 3 CC; 1 Fam | 0.467 | 0.476 | 0.95 (0.85–1.07) | 0.39 | 0.19 | ||
| M24/rs1421292 (T) | All ethnicities | 6 CC; 1 Fam | 0.502 | 0.477 | 1.11 (1.01–1.22) | 0.027 | 0.23 | |
| European | 6 CC; 0 Fam | 0.502 | 0.477 | 1.12 (1.01–1.24) | 0.031 | 0.15 | ||
|
| ||||||||
| BP | M15/rs2391191 (G) | European | 3 CC; 1 Fam | 0.625 | 0.608 | 0.95 (0.75–1.22) | 0.71 | 0.01 |
| M19/rs778294 (T) | European | 2 CC; 1 Fam | 0.295 | 0.291 | 0.83 (0.60–1.16) | 0.28 | 0.004 | |
| rs1341402 (T) | European | 2 CC; 1 Fam | 0.757 | 0.778 | 1.08 (0.78–1.51) | 0.63 | 0.007 | |
| rs1935058 (C) | European | 2 CC; 1 Fam | 0.437 | 0.448 | 1.26 (0.78–2.04) | 0.34 | 0.0002 | |
| rs1935062 (C) | European | 2 CC; 1 Fam | 0.327 | 0.355 | 1.02 (0.60–1.76) | 0.93 | 0.0003 | |
Markers beginning with M were annotated by Chumakov et al. 2002; the risk alleles reported by Chumakov et al or by Hattori et al were in parentheses.
Meta-analyses were performed for all samples, samples of European ancestry, and Asian ancestry, respectively.
Number of Case-Control and Family-based association studies included in the analyses.
Risk alle frequencies based on case-control association data.
Overall Odds Ratios (OR) and their 95% Confidence Intervals (CI) were based on random-effects model.
P(Z), Z test was used to detect the significance of the overall OR. P-values < 0.05 are shown in bold type.
P(Q), Cochran’s Q test was applied to assess between-study heterogeneity. P < 0.10 indicates evidence for significant heterogeneity between studies. SCZ, schizophrenia; BP, bipolar disorder. Note: meta-analyses combined both case-control and family-based data.
In the European samples, the minor allele T at M24 revealed nominally significant association evidence (Table 2); four SNPs showed significant between-study heterogeneity (Table 2). In the Asian samples, the minor allele C of M18 and the major allele A of M22 were significantly associated with disease and showed no evidence for between-study heterogeneity (Table 2). The association remained significant after conservative Bonferroni correction for multiple testing for 15 markers and subgroup analyses (Table 2, adjusted P = 0.0000253 for M18; P = 0.009 for M22). The Forest plots of M18 and M22 analyzed in Asian and M24 in combined samples are shown in Figure 1. M18, M22, and M24 are located in three different haplotype blocks (Supplementary Fig. 1, similar LD structure in the Han Chinese HapMap samples not shown). M12 and M15 revealed significant evidence for between-study heterogeneity but not for association in Asian samples (Table 2).
Fig. 1.
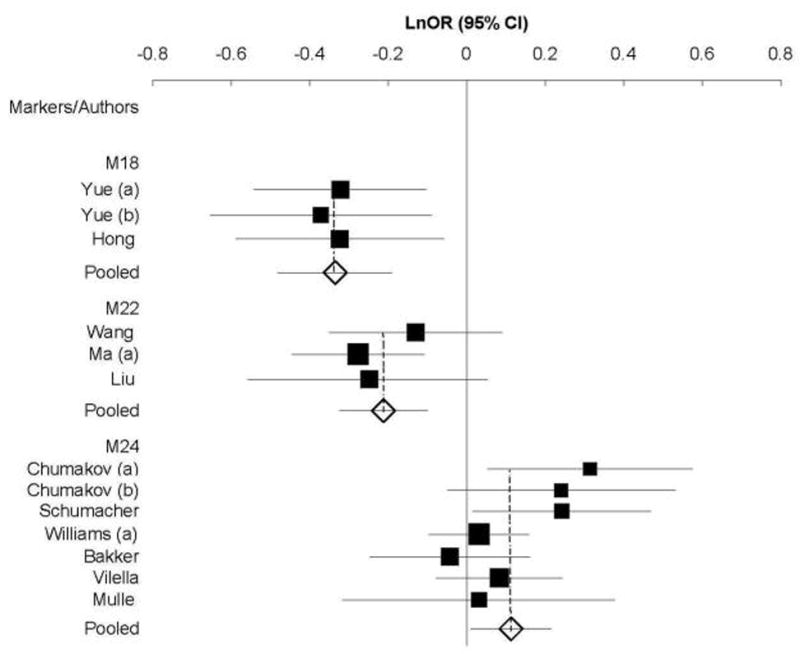
Forest plots of Ln(OR) with 95% CI for each schizophrenia-associated polymorphism in the G72/G30 gene region. Solid squares and horizontal lines indicate the Ln(OR)s and 95% CIs, respectively. The pooled results are shown by the open diamonds. Results of meta-analysis shown here, M18 and M22 in Asians and M24 in Europeans plus a mixed sample, are under the random-effects model.
M18 and M22 showed significant heterogeneity between European and Asian samples (M18: P = 0.001; M22: P = 0.002. Supplementary Table 1). The markers rs1935058 and M18 had significant heterogeneity between study designs (population-based versus family-based) (rs1935058: P = 0.04; M18: P = 0.02. Supplementary Table 1).
3.3. Meta-analysis of Studies on BP
None of the five SNPs analyzed was significantly associated with BP (Table 2). All the five SNPs showed significant evidence for heterogeneity between studies in European samples (Table 2) as well as between study designs (Supplementary Table 1). Egger’s regression analyses showed evidence for publication bias for two markers (M19, P = 0.09; rs1341402, P = 0.005). However, power to detect publication bias is generally low (Macaskill et al., 2001), and is further limited when there are few studies (Egger et al., 1997).
4. Discussion
The findings of association of the G72/G30 gene complex with SCZ and BP in multiple studies have been reviewed as the most promising current associations in both disorders (Craddock et al., 2006; Craddock et al., 2005; Maier et al., 2005). However, the associated alleles or haplotypes at the G72/G30 gene region vary across different studies (Supplementary Table 2), further confirmed by significant heterogeneity between individual studies for a large proportion of the markers in the present meta-analysis (Table 2). The heterogeneity may result from: (1) different ancestries (Asian versus European) and (2) study designs (case-control versus family-based) (Supplementary Table 1); (3) incomplete genotyping rates or genotyping error rates in different studies. However, it is impossible to test this possibility as such data can not be obtained for each study (Munafo et al., 2006); (4) population-specific association. For example, M18 and M22 show an association with SCZ in Asians while M24 is associated with SCZ in Europeans, particularly they are in three different haplotype blocks (Supplementary Fig. 1) and not in LD with each other based on HapMap data, implying multiple susceptibility variants in this region, which could be identified by deep resequencing (Topol and Frazer, 2007). However, rare and uncommon variant association(s) may not have been detectable by analysis of individual SNPs in the reviewed association studies which all focused on common variants; (5) SNPs violating Hardy-Weinberg equilibrium included in some studies, which seems inapplicable to the current meta-analysis as we excluded such studies; (6) phenotype heterogeneity due to sample diagnosis and ascertainment. Endo-phenotype or sub-phenotype analysis has been proposed to make the patients with psychiatric disorders more etiologically homogeneous and thus may help to address the non-replications in genetic association studies (Gottesman and Gould, 2003; Hasler et al., 2006); and (7) gene-gene and gene-environment interactions. However, no evidence on this has yet been published.
We found that two markers (M18 and M22) at the G72/G30 gene region were significantly associated with SCZ in Asian samples, even after conservative Bonferroni correction for multiple testing (15 markers, 2 subgroups and the whole combined sample, thus 45 tests). This association has not been detected in previous meta-analyses (Detera-Wadleigh and McMahon, 2006; Li and He, 2007), and needs to be further confirmed in larger sample because of few studies included and the modest power to detect both allelic association and between-study heterogeneity. For example, we had around 30% power to detect pooled effects of M22 with comparable 1500 cases and 1500 controls in Asians (estimated by Genetic Power Calculation, http://pngu.mgh.harvard.edu/~purcell/gpc/). Interestingly, both the minor allele C at M18 and major allele A at M22 showed a “protective” role in the development of disease (OR < 1). One possibility is that the corresponding alleles (A at M18 and G at M22) may tag two different causative/susceptibility alleles because they are not in LD with each other. The T allele at M24 showed a potential association with SCZ in Europeans or in the combined samples (Table 2), consistent with a previous meta-analysis (Li and He, 2007). No publication bias was found for this SNP (data not shown). But sensitivity analysis identified the original study (Chumakov et al., 2002) with a major contribution to the association (after excluding the original study in Canadians, OR = 1.07; 95% CI: 0.99–1.16, unadjusted P = 0.07). This also needs confirmation in larger samples, due to weak effects of the risk allele (OR = 1.1) and no significant association after correction for multiple testing.
Our meta-analysis of BP data cannot draw a definitive conclusion, because few studies were included, the sample size was modest for each SNP, and significant heterogeneity existed between either individual studies or study designs (Table 2 and Supplementary Table 1).
We did not perform haplotypic meta-analysis of the G72/G30 association data, because of different haplotypes and different individual SNPs tested in different studies (Supplementary Table 2), different statistical methods of haplotype analysis employed, and/or lack of an appropriate meta-analytic method for the haplotype data. We did not meta-analyze the genotypic data either, because (1) genotype data were not available for some studies, even after contacting the authors, (2) a decreased number of studies would decrease the power of meta-analyses of the genotype data, and (3) family-based association data could not be included in the genotypic meta-analysis due to lack of appropriate methods.
In conclusion, the present meta-analysis found significant evidence for associations of M18 and M22 with SCZ in Asians, and suggestive evidence for association of M24 with SCZ in Europeans. Thus, G72/G30 may influence susceptibility to schizophrenia with weak effects.
Supplementary Material
Linkage disequilibrium (LD) plot across the G72/G30 gene region. The LD structure was constructed using the genotype data of the 30 Centre d’Etude du Polymorphisme Humain (CEPH) trios in the International HapMap Project. The horizontal black line depicts the 95-kb genomic region spanning the G72/G30 gene. The 15 single nucleotide polymorphisms (SNPs) included in our meta-analysis and the structure of the G72/G30 gene, with vertical lines indicating exons, are shown above the bar indicating the chromosome 13 genomic location in green and in lavender, respectively. A total of 128 SNPs with minor allele frequency ≥ 0.1 in the region between M12 (rs3916965) and M24 (rs1421292) are shown below the black chromosome line. A linkage disequilibrium plot is shown in the bottom part of the figure based on the measure D’/LOD: each square represents the magnitude of linkage disequilibrium for a single pair of SNPs, with red color indicating linkage disequilibrium that is strong (D' > 0.8) and statistically significant (logarithm of odds >2.0), and white indicating D’ < 0.5. This figure was prepared using the program LocusView 2.0 (T. Petryshen, A. Kirby, M. Ainscow, unpublished software; http://www.broad.mit.edu/mpg/locusview). Genomic positions are in accordance with the National Center for Biotechnology Information build 35 of the human genome assembly 17.
Assessment of heterogeneity between ancestries and between study designs in G72/G30 association studies
aMarkers beginning with M were annotated by Chumakov et al. 2002; the risk alleles reported by Chumakov et al or by Hattori et al were in parentheses. bSignificance test for heterogeneity between European and Asian populations. P-values < 0.05 are in bold type. NA indicates association studies performed only in European samples. cSignificance test for heterogeneity between Case-Control and family-based studies. P-values are in bold type. NA indicates all association studies performed using Case-Control design.
Haplotype blocks in the G72/G30 gene region reported to be associated with SCZ or BP
Studies included in the meta-analysis are described in detail in Table 1 in the text. Haplotypes showing most significant association in individual study are highlighted in boxes, upward and downward arrows indicate the haplotype with the minimum P-value in each study increasing and decreasing disease risk, respectively. Key: M-, SNP ID assigned by Chumakov et al 2002. *, significant allelic association; ns, not significant at P < 0.05; -, global P-value not reported.
Acknowledgments
This work was supported by the National Alliance for Research on Schizophrenia and Depression (NARSAD) Young Investigator Awards (to C Liu and J Shi), Brain Research Foundation at the University of Chicago (to C Liu), and NIH MH065560-02, MH61613-05A1 (to ES Gershon). We are thankful to those authors who kindly provided their raw data or described their data in details upon our request. We thank Dr. Dawei Li at the laboratory of statistical genetics of Rockefeller University, for helping prepare the Forest plot.
Appendix A. Supplementary data
Supplementary data associated with this article is available in the online version, at the Schizophrenia Research website.
Footnotes
Publisher's Disclaimer: This is a PDF file of an unedited manuscript that has been accepted for publication. As a service to our customers we are providing this early version of the manuscript. The manuscript will undergo copyediting, typesetting, and review of the resulting proof before it is published in its final citable form. Please note that during the production process errors may be discovered which could affect the content, and all legal disclaimers that apply to the journal pertain.
Reference List
- Addington AM, Gornick M, Sporn AL, Gogtay N, Greenstein D, Lenane M, Gochman P, Baker N, Balkissoon R, Vakkalanka RK, Weinberger DR, Straub RE, Rapoport JL. Polymorphisms in the 13q33.2 gene G72/G30 are associated with childhood-onset schizophrenia and psychosis not otherwise specified. Biol Psychiatry. 2004;55:976–980. doi: 10.1016/j.biopsych.2004.01.024. [DOI] [PubMed] [Google Scholar]
- Badner JA, Gershon ES. Meta-analysis of whole-genome linkage scans of bipolar disorder and schizophrenia. Mol Psychiatry. 2002;7:405–411. doi: 10.1038/sj.mp.4001012. [DOI] [PubMed] [Google Scholar]
- Bakker SC, Hoogendoorn ML, Hendriks J, Verzijlbergen K, Caron S, Verduijn W, Selten JP, Pearson PL, Kahn RS, Sinke RJ. The PIP5K2A and RGS4 genes are differentially associated with deficit and non-deficit schizophrenia. Genes Brain Behav. 2007;6:113–119. doi: 10.1111/j.1601-183x.2006.00234.x. [DOI] [PubMed] [Google Scholar]
- Barrett JC, Fry B, Maller J, Daly MJ. Haploview: analysis and visualization of LD and haplotype maps. Bioinformatics. 2005;21:263–265. doi: 10.1093/bioinformatics/bth457. [DOI] [PubMed] [Google Scholar]
- Bax L, Yu LM, Ikeda N, Tsuruta H, Moons KG. Development and validation of MIX: comprehensive free software for meta-analysis of causal research data. BMC Med Res Methodol. 2006;6:50. doi: 10.1186/1471-2288-6-50. [DOI] [PMC free article] [PubMed] [Google Scholar]
- Cardno AG, Thomas K, McGuffin P. Clinical variables and genetic loading for schizophrenia: analysis of published Danish adoption study data. Schizophr Bull. 2002;28:393–399. doi: 10.1093/oxfordjournals.schbul.a006948. [DOI] [PubMed] [Google Scholar]
- Chen YS, Akula N, tera-Wadleigh SD, Schulze TG, Thomas J, Potash JB, DePaulo JR, McInnis MG, Cox NJ, McMahon FJ. Findings in an independent sample support an association between bipolar affective disorder and the G72/G30 locus on chromosome 13q33. Mol Psychiatry. 2004;9:87–92. doi: 10.1038/sj.mp.4001453. [DOI] [PubMed] [Google Scholar]
- Cho HJ, Meira-Lima I, Cordeiro Q, Michelon L, Sham P, Vallada H, Collier DA. Population-based and family-based studies on the serotonin transporter gene polymorphisms and bipolar disorder: a systematic review and meta-analysis. Mol Psychiatry. 2005;10:771–781. doi: 10.1038/sj.mp.4001663. [DOI] [PubMed] [Google Scholar]
- Chumakov I, Blumenfeld M, Guerassimenko O, Cavarec L, Palicio M, Abderrahim H, Bougueleret L, Barry C, Tanaka H, La Rosa P, Puech A, Tahri N, Cohen-Akenine A, Delabrosse S, Lissarrague S, Picard FP, Maurice K, Essioux L, Millasseau P, Grel P, Debailleul V, Simon AM, Caterina D, Dufaure I, Malekzadeh K, Belova M, Luan JJ, Bouillot M, Sambucy JL, Primas G, Saumier M, Boubkiri N, Martin-Saumier S, Nasroune M, Peixoto H, Delaye A, Pinchot V, Bastucci M, Guillou S, Chevillon M, Sainz-Fuertes R, Meguenni S, urich-Costa J, Cherif D, Gimalac A, Van Duijn C, Gauvreau D, Ouellette G, Fortier I, Raelson J, Sherbatich T, Riazanskaia N, Rogaev E, Raeymaekers P, Aerssens J, Konings F, Luyten W, Macciardi F, Sham PC, Straub RE, Weinberger DR, Cohen N, Cohen D. Genetic and physiological data implicating the new human gene G72 and the gene for D-amino acid oxidase in schizophrenia. Proc Natl Acad Sci U S A. 2002;99:13675–13680. doi: 10.1073/pnas.182412499. [DOI] [PMC free article] [PubMed] [Google Scholar]
- Craddock N, O’Donovan MC, Owen MJ. The genetics of schizophrenia and bipolar disorder: dissecting psychosis. J Med Genet. 2005;42:193–204. doi: 10.1136/jmg.2005.030718. [DOI] [PMC free article] [PubMed] [Google Scholar]
- Craddock N, O’Donovan MC, Owen MJ. Genes for schizophrenia and bipolar disorder? Implications for psychiatric nosology. Schizophr Bull. 2006;32:9–16. doi: 10.1093/schbul/sbj033. [DOI] [PMC free article] [PubMed] [Google Scholar]
- DerSimonian R, Laird N. Meta-analysis in clinical trials. Control Clin Trials. 1986;7:177–188. doi: 10.1016/0197-2456(86)90046-2. [DOI] [PubMed] [Google Scholar]
- Detera-Wadleigh SD, McMahon FJ. G72/G30 in Schizophrenia and Bipolar Disorder: Review and Meta-analysis. Biol Psychiatry. 2006 doi: 10.1016/j.biopsych.2006.01.019. [DOI] [PubMed] [Google Scholar]
- Egger M, Davey SG, Schneider M, Minder C. Bias in meta-analysis detected by a simple, graphical test. BMJ. 1997;315:629–634. doi: 10.1136/bmj.315.7109.629. [DOI] [PMC free article] [PubMed] [Google Scholar]
- Fallin MD, Lasseter VK, Avramopoulos D, Nicodemus KK, Wolyniec PS, McGrath JA, Steel G, Nestadt G, Liang KY, Huganir RL, Valle D, Pulver AE. Bipolar I disorder and schizophrenia: a 440-single-nucleotide polymorphism screen of 64 candidate genes among Ashkenazi Jewish case-parent trios. Am J Hum Genet. 2005;77:918–936. doi: 10.1086/497703. [DOI] [PMC free article] [PubMed] [Google Scholar]
- Farmer AE, McGuffin P, Gottesman II. Twin concordance for DSM-III schizophrenia. Scrutinizing the validity of the definition. Arch Gen Psychiatry. 1987;44:634–641. doi: 10.1001/archpsyc.1987.01800190054009. [DOI] [PubMed] [Google Scholar]
- Gershon ES, DeLisi LE, Hamovit J, Nurnberger JI, Jr, Maxwell ME, Schreiber J, Dauphinais D, Dingman CW, Guroff JJ. A controlled family study of chronic psychoses. Schizophrenia and schizoaffective disorder. Arch Gen Psychiatry. 1988;45:328–336. doi: 10.1001/archpsyc.1988.01800280038006. [DOI] [PubMed] [Google Scholar]
- Gershon ES, Hamovit J, Guroff JJ, Dibble E, Leckman JF, Sceery W, Targum SD, Nurnberger JI, Jr, Goldin LR, Bunney WE., Jr A family study of schizoaffective, bipolar I, bipolar II, unipolar, and normal control probands. Arch Gen Psychiatry. 1982;39:1157–1167. doi: 10.1001/archpsyc.1982.04290100031006. [DOI] [PubMed] [Google Scholar]
- Goldberg TE, Straub RE, Callicott JH, Hariri A, Mattay VS, Bigelow L, Coppola R, Egan MF, Weinberger DR. The G72/G30 gene complex and cognitive abnormalities in schizophrenia. Neuropsychopharmacology. 2006;31:2022–2032. doi: 10.1038/sj.npp.1301049. [DOI] [PubMed] [Google Scholar]
- Gottesman II, Gould TD. The endophenotype concept in psychiatry: etymology and strategic intentions. Am J Psychiatry. 2003;160:636–645. doi: 10.1176/appi.ajp.160.4.636. [DOI] [PubMed] [Google Scholar]
- Hall D, Gogos JA, Karayiorgou M. The contribution of three strong candidate schizophrenia susceptibility genes in demographically distinct populations. Genes Brain Behav. 2004;3:240–248. doi: 10.1111/j.1601-183X.2004.00078.x. [DOI] [PubMed] [Google Scholar]
- Hasler G, Drevets WC, Gould TD, Gottesman II, Manji HK. Toward constructing an endophenotype strategy for bipolar disorders. Biol Psychiatry. 2006;60:93–105. doi: 10.1016/j.biopsych.2005.11.006. [DOI] [PubMed] [Google Scholar]
- Hattori E, Liu C, Badner JA, Bonner TI, Christian SL, Maheshwari M, tera-Wadleigh SD, Gibbs RA, Gershon ES. Polymorphisms at the G72/G30 gene locus, on 13q33, are associated with bipolar disorder in two independent pedigree series. Am J Hum Genet. 2003;72:1131–1140. doi: 10.1086/374822. [DOI] [PMC free article] [PubMed] [Google Scholar]
- Hong CJ, Hou SJ, Yen FC, Liou YJ, Tsai SJ. Family-based association study between G72/G30 genetic polymorphism and schizophrenia. Neuroreport. 2006;17:1067–1069. doi: 10.1097/01.wnr.0000224763.61959.26. [DOI] [PubMed] [Google Scholar]
- Kazeem GR, Farrall M. Integrating case-control and TDT studies. Ann Hum Genet. 2005;69:329–335. doi: 10.1046/J.1469-1809.2005.00156.x. [DOI] [PubMed] [Google Scholar]
- Kendell RE. Diagnosis and classification of functional psychoses. Br Med Bull. 1987;43:499–513. doi: 10.1093/oxfordjournals.bmb.a072198. [DOI] [PubMed] [Google Scholar]
- Kendler KS. Kraepelin and the differential diagnosis of dementia praecox and manic-depressive insanity. Compr Psychiatry. 1986;27:549–558. doi: 10.1016/0010-440x(86)90059-3. [DOI] [PubMed] [Google Scholar]
- Kendler KS, Masterson CC, Davis KL. Psychiatric illness in first-degree relatives of patients with paranoid psychosis, schizophrenia and medical illness. Br J Psychiatry. 1985;147:524–531. doi: 10.1192/bjp.147.5.524. [DOI] [PubMed] [Google Scholar]
- Kendler KS, McGuire M, Gruenberg AM, O’Hare A, Spellman M, Walsh D. The Roscommon Family Study. IV. Affective illness, anxiety disorders, and alcoholism in relatives. Arch Gen Psychiatry. 1993;50:952–960. doi: 10.1001/archpsyc.1993.01820240036005. [DOI] [PubMed] [Google Scholar]
- Korostishevsky M, Kaganovich M, Cholostoy A, Ashkenazi M, Ratner Y, Dahary D, Bernstein J, ing-Abu-Shach U, Ben-Asher E, Lancet D, Ritsner M, Navon R. Is the G72/G30 locus associated with schizophrenia? single nucleotide polymorphisms, haplotypes, and gene expression analysis. Biol Psychiatry. 2004;56:169–176. doi: 10.1016/j.biopsych.2004.04.006. [DOI] [PubMed] [Google Scholar]
- Korostishevsky M, Kremer I, Kaganovich M, Cholostoy A, Murad I, Muhaheed M, Bannoura I, Rietschel M, Dobrusin M, ing-Abu-Shach U, Belmaker RH, Maier W, Ebstein RP, Navon R. Transmission disequilibrium and haplotype analyses of the G72/G30 locus: Suggestive linkage to schizophrenia in Palestinian Arabs living in the North of Israel. Am J Med Genet B Neuropsychiatr Genet. 2006;141:91–95. doi: 10.1002/ajmg.b.30212. [DOI] [PubMed] [Google Scholar]
- Kraepelin E. Manic-Depressive Insanity and Paranoia. Edinburgh; Livingstone: 1919. [Google Scholar]
- Kravariti E, Dixon T, Frith C, Murray R, McGuire P. Association of symptoms and executive function in schizophrenia and bipolar disorder. Schizophr Res. 2005;74:221–231. doi: 10.1016/j.schres.2004.06.008. [DOI] [PubMed] [Google Scholar]
- Li D, He L. G72/G30 genes and schizophrenia: a systematic meta-analysis of association studies. Genetics. 2007;175:917–922. doi: 10.1534/genetics.106.061796. [DOI] [PMC free article] [PubMed] [Google Scholar]
- Liu YL, Fann CS, Liu CM, Chang CC, Wu JY, Hung SI, Liu SK, Hsieh MH, Hwang TJ, Chan HY, Chen JJ, Faraone SV, Tsuang MT, Chen WJ, Hwu HG. No association of G72 and d-amino acid oxidase genes with schizophrenia. Schizophr Res. 2006;87:15–20. doi: 10.1016/j.schres.2006.06.020. [DOI] [PubMed] [Google Scholar]
- Lohmueller KE, Pearce CL, Pike M, Lander ES, Hirschhorn JN. Meta-analysis of genetic association studies supports a contribution of common variants to susceptibility to common disease. Nat Genet. 2003;33:177–182. doi: 10.1038/ng1071. [DOI] [PubMed] [Google Scholar]
- Ma J, Qin W, Wang XY, Guo TW, Bian L, Duan SW, Li XW, Zou FG, Fang YR, Fang JX, Feng GY, Gu NF, St CD, He L. Further evidence for the association between G72/G30 genes and schizophrenia in two ethnically distinct populations. Mol Psychiatry. 2006 doi: 10.1038/sj.mp.4001788. [DOI] [PubMed] [Google Scholar]
- Macaskill P, Walter SD, Irwig L. A comparison of methods to detect publication bias in meta-analysis. Stat Med. 2001;20:641–654. doi: 10.1002/sim.698. [DOI] [PubMed] [Google Scholar]
- Maier W, Hofgen B, Zobel A, Rietschel M. Genetic models of schizophrenia and bipolar disorder: overlapping inheritance or discrete genotypes? Eur Arch Psychiatry Clin Neurosci. 2005;255:159–166. doi: 10.1007/s00406-005-0583-9. [DOI] [PubMed] [Google Scholar]
- Maier W, Lichtermann D, Minges J, Hallmayer J, Heun R, Benkert O, Levinson DF. Continuity and discontinuity of affective disorders and schizophrenia. Results of a controlled family study. Arch Gen Psychiatry. 1993;50:871–883. doi: 10.1001/archpsyc.1993.01820230041004. [DOI] [PubMed] [Google Scholar]
- MANTEL N, HAENSZEL W. Statistical aspects of the analysis of data from retrospective studies of disease. J Natl Cancer Inst. 1959;22:719–748. [PubMed] [Google Scholar]
- Martinez-Aran A, Penades R, Vieta E, Colom F, Reinares M, Benabarre A, Salamero M, Gasto C. Executive function in patients with remitted bipolar disorder and schizophrenia and its relationship with functional outcome. Psychother Psychosom. 2002;71:39–46. doi: 10.1159/000049342. [DOI] [PubMed] [Google Scholar]
- Mulle JG, Chowdari KV, Nimgaonkar V, Chakravarti A. No evidence for association to the G72/G30 locus in an independent sample of schizophrenia families. Mol Psychiatry. 2005;10:431–433. doi: 10.1038/sj.mp.4001619. [DOI] [PubMed] [Google Scholar]
- Munafo MR, Thiselton DL, Clark TG, Flint J. Association of the NRG1 gene and schizophrenia: a meta-analysis. Mol Psychiatry. 2006;11:539–546. doi: 10.1038/sj.mp.4001817. [DOI] [PubMed] [Google Scholar]
- Nicodemus KK, Kolachana BS, Vakkalanka R, Straub RE, Giegling I, Egan MF, Rujescu D, Weinberger DR. Evidence for statistical epistasis between catechol-O-methyltransferase (COMT) and polymorphisms in RGS4, G72 (DAOA), GRM3, and DISC1: influence on risk of schizophrenia. Hum Genet. 2007;120:889–906. doi: 10.1007/s00439-006-0257-3. [DOI] [PubMed] [Google Scholar]
- Potash JB. Carving chaos: genetics and the classification of mood and psychotic syndromes. Harv Rev Psychiatry. 2006;14:47–63. doi: 10.1080/10673220600655780. [DOI] [PubMed] [Google Scholar]
- Schulze TG, Ohlraun S, Czerski PM, Schumacher J, Kassem L, Deschner M, Gross M, Tullius M, Heidmann V, Kovalenko S, Jamra RA, Becker T, Leszczynska-Rodziewicz A, Hauser J, Illig T, Klopp N, Wellek S, Cichon S, Henn FA, McMahon FJ, Maier W, Propping P, Nothen MM, Rietschel M. Genotype-phenotype studies in bipolar disorder showing association between the DAOA/G30 locus and persecutory delusions: a first step toward a molecular genetic classification of psychiatric phenotypes. Am J Psychiatry. 2005;162:2101–2108. doi: 10.1176/appi.ajp.162.11.2101. [DOI] [PubMed] [Google Scholar]
- Schumacher J, Jamra RA, Freudenberg J, Becker T, Ohlraun S, Otte AC, Tullius M, Kovalenko S, Bogaert AV, Maier W, Rietschel M, Propping P, Nothen MM, Cichon S. Examination of G72 and D-amino-acid oxidase as genetic risk factors for schizophrenia and bipolar affective disorder. Mol Psychiatry. 2004;9:203–207. doi: 10.1038/sj.mp.4001421. [DOI] [PubMed] [Google Scholar]
- Seidman LJ, Kremen WS, Koren D, Faraone SV, Goldstein JM, Tsuang MT. A comparative profile analysis of neuropsychological functioning in patients with schizophrenia and bipolar psychoses. Schizophr Res. 2002;53:31–44. doi: 10.1016/s0920-9964(01)00162-1. [DOI] [PubMed] [Google Scholar]
- Shih RA, Belmonte PL, Zandi PP. A review of the evidence from family, twin and adoption studies for a genetic contribution to adult psychiatric disorders. Int Rev Psychiatry. 2004;16:260–283. doi: 10.1080/09540260400014401. [DOI] [PubMed] [Google Scholar]
- Topol EJ, Frazer KA. The resequencing imperative. Nat Genet. 2007;39:439–440. doi: 10.1038/ng0407-439. [DOI] [PubMed] [Google Scholar]
- Van OJ, Gilvarry C, Bale R, Van HE, Tattan T, White I, Murray R. A comparison of the utility of dimensional and categorical representations of psychosis. UK700 Group. Psychol Med. 1999;29:595–606. doi: 10.1017/s0033291798008162. [DOI] [PubMed] [Google Scholar]
- Vilella E, Costas J, Sanjuan J, Guitart M, De DY, Carracedo A, Martorell L, Valero J, Labad A, De FR, Najera C, Molto MD, Toirac I, Guillamat R, Brunet A, Valles V, Perez L, Leon M, de Fonseca FR, Phillips C, Torres M. Association of schizophrenia with DTNBP1 but not with DAO, DAOA, NRG1 and RGS4 nor their genetic interaction. J Psychiatr Res. 2007 doi: 10.1016/j.jpsychires.2007.02.005. [DOI] [PubMed] [Google Scholar]
- Wang X, He G, Gu N, Yang J, Tang J, Chen Q, Liu X, Shen Y, Qian X, Lin W, Duan Y, Feng G, He L. Association of G72/G30 with schizophrenia in the Chinese population. Biochem Biophys Res Commun. 2004;319:1281–1286. doi: 10.1016/j.bbrc.2004.05.119. [DOI] [PubMed] [Google Scholar]
- Williams NM, Green EK, MacGregor S, Dwyer S, Norton N, Williams H, Raybould R, Grozeva D, Hamshere M, Zammit S, Jones L, Cardno A, Kirov G, Jones I, O’Donovan MC, Owen MJ, Craddock N. Variation at the DAOA/G30 locus influences susceptibility to major mood episodes but not psychosis in schizophrenia and bipolar disorder. Arch Gen Psychiatry. 2006;63:366–373. doi: 10.1001/archpsyc.63.4.366. [DOI] [PubMed] [Google Scholar]
- Wood LS, Pickering EH, Dechairo BM. Significant Support for DAO as a Schizophrenia Susceptibility Locus: Examination of Five Genes Putatively Associated with Schizophrenia. Biol Psychiatry. 2006 doi: 10.1016/j.biopsych.2006.07.005. [DOI] [PubMed] [Google Scholar]
- Yue W, Kang G, Zhang Y, Qu M, Tang F, Han Y, Ruan Y, Lu T, Zhang J, Zhang D. Association of DAOA polymorphisms with schizophrenia and clinical symptoms or therapeutic effects. Neurosci Lett. 2007;416:96–100. doi: 10.1016/j.neulet.2007.01.056. [DOI] [PubMed] [Google Scholar]
- Yue W, Liu Z, Kang G, Yan J, Tang F, Ruan Y, Zhang J, Zhang D. Association of G72/G30 polymorphisms with early-onset and male schizophrenia. Neuroreport. 2006;17:1899–1902. doi: 10.1097/WNR.0b013e3280102ed4. [DOI] [PubMed] [Google Scholar]
- Zou F, Li C, Duan S, Zheng Y, Gu N, Feng G, Xing Y, Shi J, He L. A family-based study of the association between the G72/G30 genes and schizophrenia in the Chinese population. Schizophr Res. 2005;73:257–261. doi: 10.1016/j.schres.2004.01.015. [DOI] [PubMed] [Google Scholar]
Associated Data
This section collects any data citations, data availability statements, or supplementary materials included in this article.
Supplementary Materials
Linkage disequilibrium (LD) plot across the G72/G30 gene region. The LD structure was constructed using the genotype data of the 30 Centre d’Etude du Polymorphisme Humain (CEPH) trios in the International HapMap Project. The horizontal black line depicts the 95-kb genomic region spanning the G72/G30 gene. The 15 single nucleotide polymorphisms (SNPs) included in our meta-analysis and the structure of the G72/G30 gene, with vertical lines indicating exons, are shown above the bar indicating the chromosome 13 genomic location in green and in lavender, respectively. A total of 128 SNPs with minor allele frequency ≥ 0.1 in the region between M12 (rs3916965) and M24 (rs1421292) are shown below the black chromosome line. A linkage disequilibrium plot is shown in the bottom part of the figure based on the measure D’/LOD: each square represents the magnitude of linkage disequilibrium for a single pair of SNPs, with red color indicating linkage disequilibrium that is strong (D' > 0.8) and statistically significant (logarithm of odds >2.0), and white indicating D’ < 0.5. This figure was prepared using the program LocusView 2.0 (T. Petryshen, A. Kirby, M. Ainscow, unpublished software; http://www.broad.mit.edu/mpg/locusview). Genomic positions are in accordance with the National Center for Biotechnology Information build 35 of the human genome assembly 17.
Assessment of heterogeneity between ancestries and between study designs in G72/G30 association studies
aMarkers beginning with M were annotated by Chumakov et al. 2002; the risk alleles reported by Chumakov et al or by Hattori et al were in parentheses. bSignificance test for heterogeneity between European and Asian populations. P-values < 0.05 are in bold type. NA indicates association studies performed only in European samples. cSignificance test for heterogeneity between Case-Control and family-based studies. P-values are in bold type. NA indicates all association studies performed using Case-Control design.
Haplotype blocks in the G72/G30 gene region reported to be associated with SCZ or BP
Studies included in the meta-analysis are described in detail in Table 1 in the text. Haplotypes showing most significant association in individual study are highlighted in boxes, upward and downward arrows indicate the haplotype with the minimum P-value in each study increasing and decreasing disease risk, respectively. Key: M-, SNP ID assigned by Chumakov et al 2002. *, significant allelic association; ns, not significant at P < 0.05; -, global P-value not reported.