

Abstract
Functional analysis of Hepatitis B virus (HBV) core particles has associated a number of biological roles with the C-terminus of the capsid protein. One set of functions require the C-terminus to be on the exterior of the capsid, while others place this domain on the interior. According to the crystal structure of the capsid, this segment is strictly internal to the capsid shell and buried at a protein-protein interface. Using kinetic hydrolysis, a form of protease digestion assayed by SDS-PAGE and mass spectrometry, the structurally and biologically important C-terminal region of HBV capsid protein assembly domain (Cp149, residues 1-149) has been shown to be dynamic in both dimer and capsid forms. HBV is an enveloped virus with a T=4 icosahedral core that is composed of 120 copies of a homodimer capsid protein. Free dimer and assembled capsid forms of the protein are readily hydrolyzed by trypsin and thermolysin, around residues 127-128, indicating that this region is dynamic and exposed to the capsid surface. The measured conformational equilibria have an opposite temperature dependence between free dimer and assembled capsid. This work helps to explain the previously described allosteric regulation of assembly and functional properties of a buried domain. These observations make a critical connection between structure, dynamics, and function: made possible by the first quantitative measurements of conformational equilibria and rates of conversion between protein conformers for a megadalton complex.
Introduction
In solution, many proteins exist as an ensemble of conformations. The population distribution of the ensemble is dependent on the barriers between energy minima on the multidimensional energy landscape of the protein. In recent years, the strong connection between dynamics and function has made the study of protein dynamics a critical research frontier(1-3). The requirement of local conformational plasticity in biological function is well documented for large complexes such as the ribosome(4), nuclear pores(5), and virus particles(6,7). A range of biophysical approaches can be used to describe the energy landscape of a protein (i.e. the distributions of different conformations and the rates of exchange), and this has been done for a number of monomeric proteins(8-10). However, due to technical challenges, detailed mapping is not available for the dynamics of viruses, or any other, megadalton complexes. Enzymatic hydrolysis has a long history as an effective tool for distinguishing between folded and unfolded proteins and in the identification of dynamic regions. Here we demonstrate that when applied rigorously, kinetic hydrolysis allows the determination of conformational equilibria and rate constants for megadalton nucleoprotein structures.
More than 350 million people suffer from chronic infection with Hepatitis B Virus (HBV). It is one of the major contributing factors to hepatocellular carcinoma and cirrhosis. HBV is an enveloped virus with an icosahedral core. The majority of cores are ~350Å in diameter(11) and are comprised of 120 core protein homodimers arranged with T=4 iscosahedral symmetry(12) (Figure 1). The core protein (HBcAg) has 183-amino acids and can be divided into an assembly domain, residues 1-149 (Figure 1C), and a C-terminal 34 amino-acid RNA-binding domain. Only the assembly domain of core protein is required to form the capsid. HBV also produces a variant of the protein (HBeAg) that includes an additional 10 amino acids at the N-terminus but terminates at position 149. The 149-residue construct from residues 1 to 149 (Cp149), lacking the C-terminal domain, forms well-ordered structures(13,14) that are indistinguishable from the cores of native virions(15). The assembly domain dimer (Cp1492) is the basic unit of capsid assembly. It forms spontaneously at translation(16) and requires denaturing concentration of chaotrope to dissociate(17). The structure of the dimer is dominated by the interface between monomers, a four helix bundle which projects 30Å from the plane of the capsid surface (Figure 1A), and is comprised of a helix-turn-helix from each monomer (Figure 1B)(13,14,18,19). It should be noted that all structural models of Cp1492 are based on intact particles. Cp1492 can be expressed as a recombinant protein in Escherichia coli, where it spontaneously forms capsids: these capsids can be dissociated into dimers and reassembled(20). The assembly process of recombinant particles has been well-characterized from both kinetic and thermodynamic standpoints, making HBV one of the best understood model systems for studying virus capsid assembly(17,21-24). Capsid assembly is a function of pH, temperature, and ionic strength(23,24). Assembly models predict that the dimer undergoes a transition between inert and assembly-competent conformations(23). A number of small molecules act as effectors that enhance or inhibit the assembly process(21,25-31). The best understood of these, HAP1, enhances assembly and particle stability, at least in part, by stabilizing the conformation of the C-terminus of the assembly domain(14).
Figure 1.
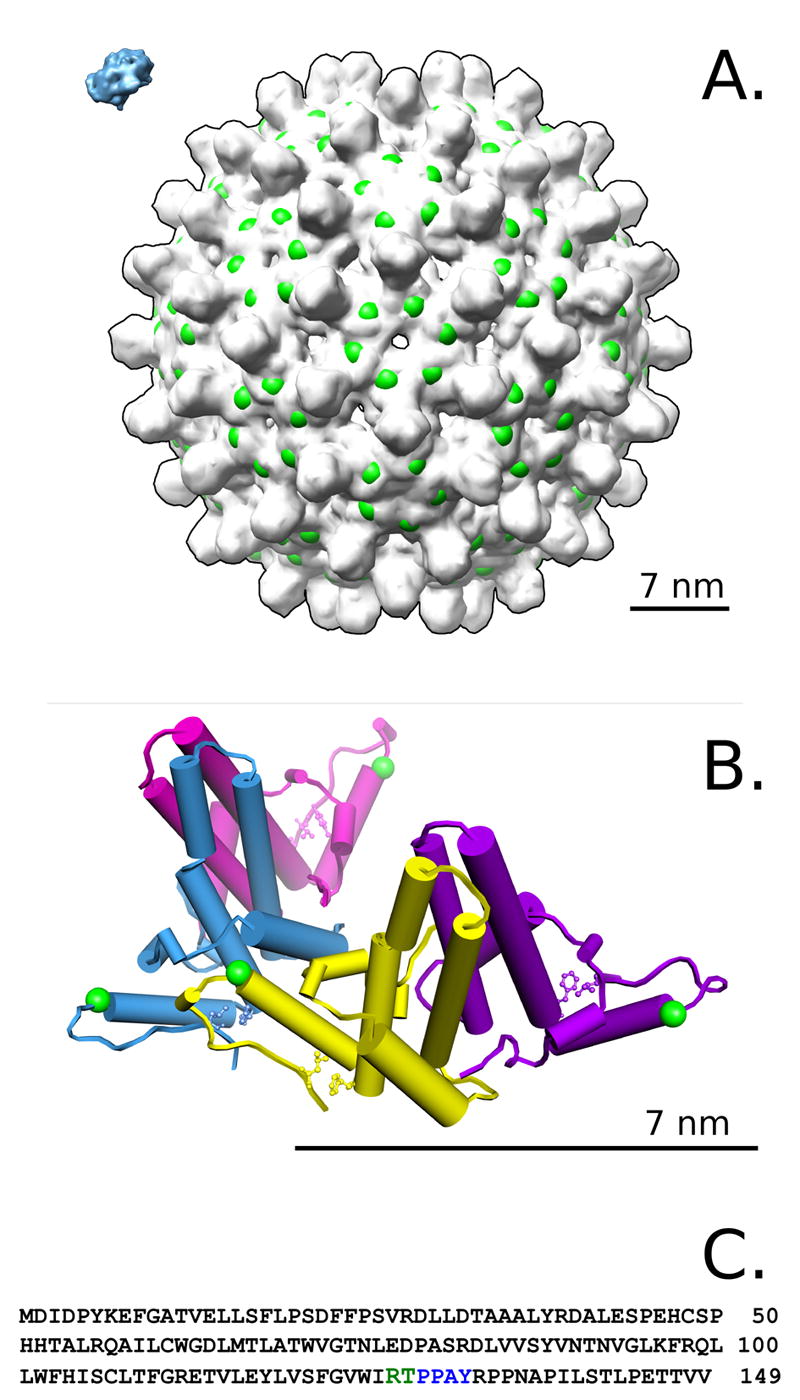
Hepatitis B capsid. A) The HBV capsid has T=4 symmetry and is assembled from 120 copies of Cp149 dimer. A hexamer of dimers surrounds the quasi-sixfold (icosahedral 2 fold) axis. The C-terminus of the protein is located at the five-fold and six-fold symmetry axes, and in all structural models to date the C-terminus of the protein projects inward. A model of trypsin is included for scale (blue, upper left), and the observed cleavage site is indicated with exaggerated scale (green spheres). A scale bar of 7.0 nm is shown in the lower-right for A and B. B) The asymmetric unit from the capsid crystal structure. Each dimer contains two copies of Cp149 which meet together with a 30Å tall helical interface. Contact between dimers occurs in a limited region spatially centered around the end of helix α-5. The cleavage site at residues R127/T128 is indicated by small green spheres, and residue L140 on the C-terminal coil is shown where it meets F110 and Y118 as part of the hydrophobic interactions stabilizing the folded conformation observed in the crystal structure. C) The amino acid sequence for Cp149. The cleavage site is shown in green, and a putative ubiquitin ligase binding site is indicated in green.
Capsid dynamics are likely critical to HBV function. For example, the C-terminal domain has interactions outside the capsid, playing a major role in intracellular trafficking(32), even though in structural models it is within the capsid interior(13,18,19). Phosphorylation of the C-terminal domain is required for nuclear localization(33-36), while loss of phosphorylation correlates with particle secretion(37). It has also been suggested that a PPAY sequence near the C-terminus of the assembly domain is critical for trafficking to the ER(38). These results all suggest that, at least transiently, the C-terminal domain of core protein is exposed on the exterior of the HBV particle. However, the C-terminal domain is also associated with interactions that take place on the capsid interior. Phosphorylation of the C-terminal domain is required for specific packaging of viral RNA(39-41), and the pattern of phosphorylation directly effects reverse transcription, which takes place within the assembled capsid(34,41,42). Together, this data creates a paradox where the C-terminal domain is localized to the capsid interior but is functionally active on the exterior. This can be resolved if the C-terminus is dynamic; however, quantitative evidence has thus far been lacking.
Kinetic hydrolysis is well-suited to the study of stability and dynamics in the context of large complexes such as the HBV particle. In this technique, a protein sample is hydrolyzed using a proteolytic enzyme under carefully controlled conditions. Based upon the well-established theory that proteolysis only occurs in exposed regions lacking well-defined structure(43-46), this technique has long been used to isolate individual domains for structural analysis(47), identify dynamic protein regions(48,49), and more recently as a tool to quantitatively probe the high energy states of proteins(50).
The fundamental kinetic model involves dynamic motion between a protected “native” state and a partially unfolded, “open” conformation which is cleaved by protease at a known rate:
| (1) |
By varying enzyme concentration and quantifying its effect on the overall reaction rate, the equilibrium and rate of transition between closed and open forms of the protein can be assayed. By definition, the protein in the open conformation behaves as an intrinsically-disordered polypeptide and is cleaved by the protease following standard Michaelis-Menten kinetics(50). This gives rise to a simple kinetic model where disappearance of intact protein depends on the concentration of protein in the open conformation, catalytic constants (kcat/KM) and enzyme concentration (Equation 8). Although systematically similar to hydrogen-deuterium exchange (HDX)(51,52), the scale of motion required for detection by proteolytic hydrolysis of folded proteins is much greater. The exact deformation from the protected “native” state will vary depending on local constraints, but a typical motion will involve a substantial displacement and unfolding of any structure within 2-4 amino acids on each side of the cleavage location(44). This large-scale motion is expected to be rare compared to the smaller transitions required for amide proton exchange in HDX. Protein dynamics on the nanometer scale are known to be involved in complex formation(53), viral capsid breathing(49,54-56) and viral docking and entry events(57).
Here we present the first quantitative measurements of conformational equilibria and rates of conversion between conformers for a megadalton complex, the HBV capsid. Our results indicate that the C-terminus of Cp149 is dynamic and transiently exposed on the surface of the capsid, in contrast to its position in crystal and cryo-EM structures. The exposure of this region is highly dependent on the assembly state of the protein as well as the temperature. The enthalpy and entropy of the opening transition for the C-terminus reverse sign as a function of assembly, identifying this region as a thermodynamic molecular switch. These results suggest that regulation of assembly may involve the dynamic motion of the C-terminal region of Cp1492.
Results
Identification of Dynamic Domains
HBV Cp149 has two assembly states: dimer and capsid. Once assembled into a capsid, there is a substantial hysteresis to disassembly, making it possible to conduct separate experiments on dimer and capsid forms under identical solution conditions(17). For proteolytic reactions, capsid and dimer were diluted into reaction buffer conditions immediately prior to the initiation of the reaction, and the reactions never exceeded 4 hours in length. Using nearly identical dilution-based procedures to study disassembly reactions, capsids at similar concentrations remain stable for at least 5 days(17). Size-exclusion chromatography and dynamic light scattering were used to confirm that capsids remained intact throughout the initial phase of digestion, which was defined as the time period with at least 70% remaining uncleaved protein. Capsids were found to be fully stable at this level of cleavage, with no detectable dissociation (Figure 2B). All of the kinetic hydrolysis experiments conducted on assembled capsid were carefully designed to only include data collected before the appearance of degraded particles.
Figure 2.
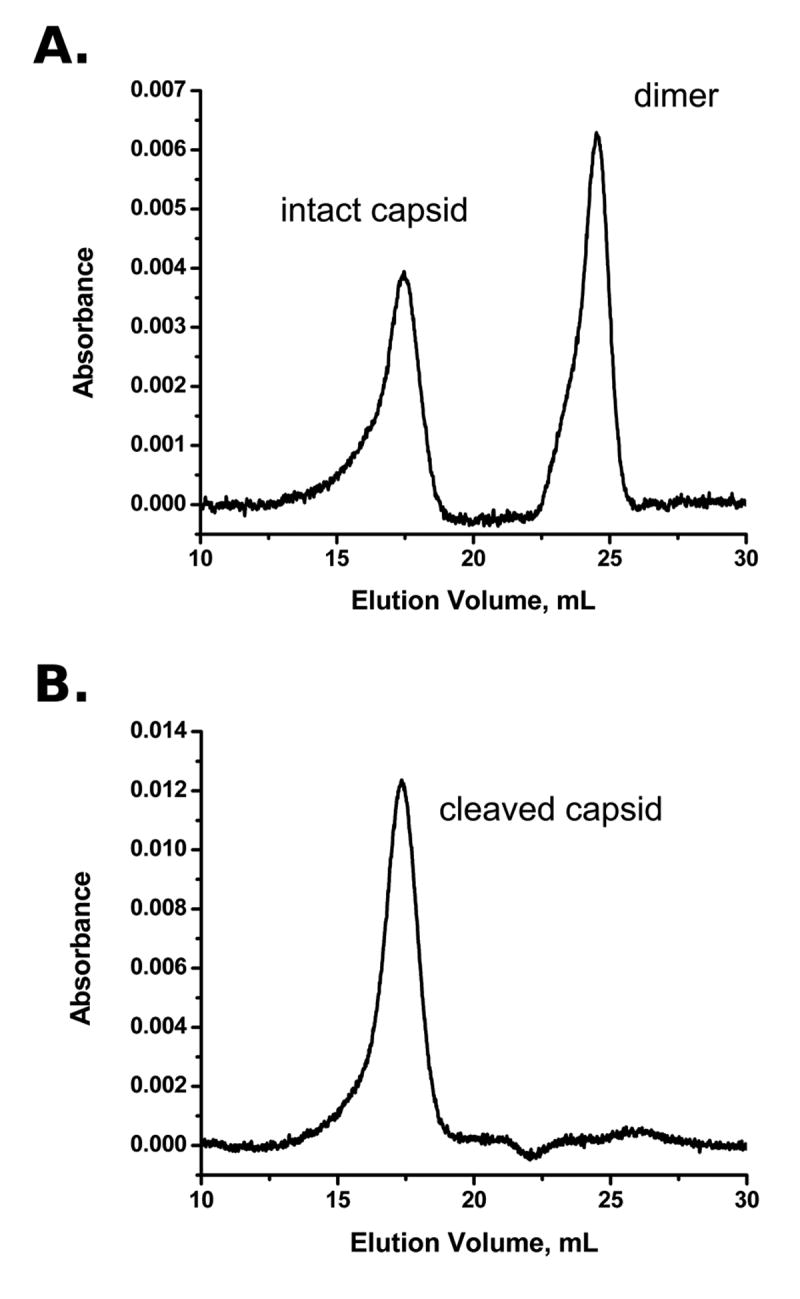
HBV capsid protein maintains integrity during proteolysis. A) A test mixture of capsid and dimer stock separated with size exclusion chromatography, using the same buffer conditions as the proteolysis reactions. B) Purified capsid stock was digested with the standard protocol to the level of 70% remaining uncleaved protein, then run over the size exclusion column. No dimer signal is seen, and the capsid intensity is not significantly diminished. The only background subtraction used for A and B is constant linear correction.
To probe for dynamic regions in the core protein and to investigate the effect of particle assembly on stability and dynamics, we first tested different proteases and analyzed samples from time-course reactions by SDS-PAGE. Both trypsin and thermolysin degrade the intact protein in a measurable progression (Figure 3A, B: black triangles). In the initial reaction phase, both proteases produced a single primary product band approximately 3 kD smaller than the intact protein (Figure 3A, B: gray triangles). A second product band arose after further digestion that was another ~2 kD smaller as judged by SDS-PAGE: this second band has weak intensity (never greater than 10% total composition) and has greatly delayed appearance, especially for assembled capsid. These results indicated that there was a dynamic or unstructured region in the protein and that the initial reaction product was relatively stable. In addition, the same site was accessible to protease in dimer and capsid. Other cleavage products were subsequent to the primary cleavage and evident only after more aggressive proteolysis. These late-stage digestion products showed differing patterns between dimer and capsid (data not shown).
Figure 3.

Hydrolysis of HBV capsid protein monitored with SDS-PAGE. A) The progression of proteolysis in the presence of high concentrations of enzyme (37°, dimer). Trypsin (open arrow), intact Cp149 (black arrow), and the cleavage product (gray arrow) are indicated. Alternating time samples (5 min spacing) are labeled, and first and last lanes are run in duplicate. B) Experiments for determination of observed rate constants (kexp) are restricted to less than 30% cleavage (25°C, capsid). Multiple sampling replicates for each time point are run to estimate quantitation error. C) Quantitation of the bands shown in A. The disappearance of the intact protein (circles) and appearance of product (triangles) follow first order kinetics. D) Gel band intensities from B were fit to an exponential decay to determine rate.
Gel densitometry analysis of proteolytic reactions revealed a consistent first-order exponential decay trend for the parent protein (Figure 3C, circles). Proteolytic cleavage rate constants (kexp) were measured from 19°C to 37°C for both HBV capsid and dimer. The observed rate of digestion for dimer is up to 20-fold faster than capsid, necessitating adjustments to sampling times in order to accurately characterize the first 30% of digestion for both species (Figure 3D, circles). First-order behavior was seen at all temperatures and the change in reaction rate with temperature followed the well-established temperature sensitivity for trypsin(58,59). In the presence of 5.0 μg/ml trypsin at 25°C, the observed rate constant for hydrolysis of dimer is approximately 0.013 min-1, with a half-life of ~53 minutes.
The precise location of proteolytic cleavage was identified using mass spectrometry. Matrix-assisted laser desorption/ionization (MALDI) and electrospray ionization (ESI) were employed to analyze both quenched and online reactions. The only significant peptide product mapped to a C-terminal fragment of Cp149 comprised of residues 128-149 (measured: 2333.263±0.012 Da, predicted: 2333.263 Da). Gels showing the intact protein and primary cleavage product confirm the presence of a species matching the size of amino acids 1-127 of Cp149. For quantitative reactions, no evidence for alternative cleavage sites was found by mass spectrometry. The lack of trypsin cleavage sites within the 128-149 peptide rules out enzymatic competition from the released product. Mass spectrometry and gel-based results are in agreement that, during the initial stages of digestion proteolysis proceeds exclusively via the R127/T128 cleavage (Figure 1C).
Kinetic Model
Based upon the observed first-order kinetics of proteolytic cleavage and the single cleavage product, we adopted the two-state model described in Equation 1 as a working hypothesis for core protein cleavage (for detailed definitions of equations and constants see Methods). Because trypsin requires a region of unfolded amino acids bordering the cleavage location(44), a protein which contains secondary structure or steric protection of a cleavage site will be resistant to proteolysis: this is defined as the ‘closed’ state. Random or concerted motion has the potential to transiently remove this protection in the normal course of a protein’s dynamic behavior in solution. Upon local or global unfolding (deprotection) the cleavage site adopts the ‘open’ state and is exposed to hydrolytic attack. This two-state model has had wide acceptance for a variety of protein systems(50,60-62), and the observed kinetic trends for Cp149 validate the two-state model for this application (or details, see Discussion).
Because trypsin is highly specific in not only the P and P’ sites but also P2-P3’, the pentameric peptide Abz-IRTPP-Tyr(3-NO2) was used as a model substrate to determine the kcleave constant, the intrinsic cleavage constant for an unstructured peptide at a given enzyme concentration, under the exact conditions used with Cp149. This constant contains a kcat/KM component that describes the catalytic efficiency on a specific peptide backbone in the open state (Equation 6). By keeping substrate concentrations sufficiently low, kcleave is linearly dependent on enzyme concentration. Fluorometric assays of trypsin activity with the model peptide were accurate at nanomolar concentration, giving kcat/KM values for all appropriate temperatures (Table 1). The measured KM value of 20μM is well above the substrate concentration in the kinetic proteolytic assays (0.3-300 nM), which validates the first-order simplification of Michaelis-Menten kinetics and justifies the treatment of kcleave in the kinetic model as a constant that scales linearly with enzyme. Kinetic characterization of trypsin using the synthetic peptide revealed no significant decrease in kcat/KM over an 8-hour span, a test for any potential complication from enzyme self proteolysis or other degradation during the course of Cp149 cleavage experiments.
Table 1.
Kinetic and thermodynamic parameters for the IRTPP cleavage site.
| Temperature, °C | 19°C | 25°C | 31°C | 37°C |
|---|---|---|---|---|
| Peptide kcat/KM, min-1M-1 | 7.66±0.23 ×10⁶ | 8.92±0.04 ×10⁶ | 10.6±0.26 ×10⁶ | 12.5±0.46 ×10⁶ |
| Dimer kop, min-1 | 3.53±0.38 ×10⁻³ | 5.08±0.51 ×10⁻³ | 7.60±0.70 ×10⁻³ | 1.19±0.13 ×10⁻² |
| Capsid kop, min-1 | 2.44±0.24 ×10⁻³ | 4.57±0.78 ×10⁻³ | 1.13±0.10 ×10⁻² | 1.29±0.07 ×10⁻² |
| Dimer Kop | 1.33±0.83 ×10⁻² | 7.54±0.26 ×10⁻³ | 6.34±0.80 ×10⁻³ | 2.59±1.03 ×10⁻³ |
| Capsid Kop | 5.12±2.28 ×10⁻³ | 1.78±1.56 ×10⁻³ | 2.90±0.62 ×10⁻³ | 1.24±0.30 ×10⁻² |
| Dimer opening: ΔG°, kJ/mol | 11.59 | 12.11 | 12.79 | 15.35 |
| Capsid opening: ΔG°, kJ/mol | 18.40 | 15.68 | 14.77 | 11.31 |
For both dimer and capsid forms of Cp149, the maximum kexp rate constant observed with high concentrations of protease (Figure 4A) correlated with opening-limited conditions, where the protein is cleaved as soon as it reaches an open state. Under opening-limited conditions, the cleavage rate is equal to the unfolding rate at a given cleavage site (kopen). Under these reaction conditions, the insensitivity of the resulting kopen value to the kcat/KM constant and enzyme concentration makes this an ideal initial screen for dynamic behavior. In order to determine Kop, reaction conditions are shifted to the other extreme, dilute trypsin, such that the trend between the experimental rate constant (kexp) and enzyme concentration becomes linear (“cleavage-limited”, Figure 4B).
Figure 4.

Determination of Kop and kopen from observed rate constants plotted versus trypsin concentration. A) Over a wide range of concentrations the data can be described by a hyperbola. Under opening-limited conditions kexp approaches a fixed limit: these plots are fit to the full kinetic equation (Equation 7), giving Kop and kopen values. Data shown is for dimer at 37°C. B) In cleavage-limiting conditions, plots of kexp are linear with respect to enzyme, with a slope of Kop·kcat/KM. Data shown is for capsid at 37°C.
Unfolding rates and equilibria
Though kexp varies between dimer and capsid by more than 20-fold, kopen is nearly identical between the two forms across the tested temperature range. The temperature dependence of kinetic parameters show a steady increase in the rate of the opening transition between 19°C and 37°C for both capsid and dimer forms of Cp149 (Figure 5A). In order to fully characterize Kop and kopen values for dimer and capsid forms of Cp149, digestion curves (Figure 4A) were generated for temperatures between 19°C and 37°C. When feasible, strict cleavage-limited reactions were also carried out to obtain a greater degree of precision (Figure 4B).
Figure 5.
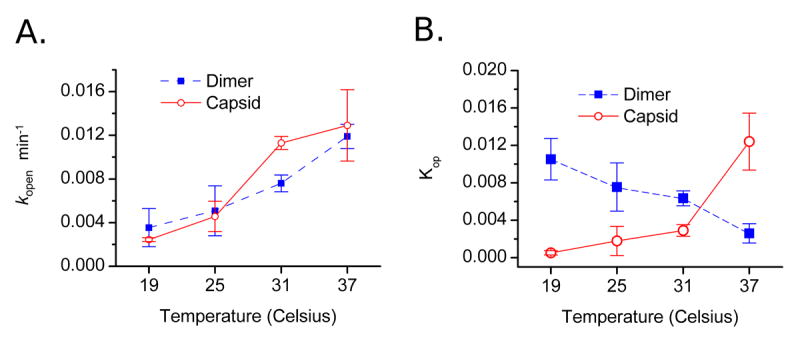
Kinetic and thermodynamic constants of Cp149 motion. A) The rate of deprotection does not differ substantially between dimer and capsid forms of HBV. For both dimer and capsid a gradual increase in the rate of transition between protected and exposed states can be seen with increasing temperature. B) Equilibrium between protected and cleavable states changes with temperature. Measured Kop · (kcat/KM) values are corrected for changes in intrinsic enzymatic activity for each temperature (Table 1), giving the equilibrium constant for deprotection. The capsid (open red circles, solid line) exhibits expected behavior with increasing exposure to enzymatic cleavage as temperature increases. Unassembled dimer (filled blue squares, dashed) is seen to be most exposed to proteolysis at reduced temperatures, while increasing the temperature causes a shift in conformation to a more tightly folded state.
The uniform behavior between dimer and capsid with respect to opening rate is in contrast to the temperature dependence of the opening equilibrium: the equilibrium between open and closed states follows opposite trends for capsid and dimer. For capsid, Kop increases from 19°C to 37°C (the amount of open state changing from 0.05% to 1.24%, Figure 5B). In the dimer, at low temperature (19°C) the region surrounding residues 127/128 is relatively exposed to enzymatic cleavage, with approximately 1.1% of the dimers existing in the open conformation. The equilibrium for dimer shifts toward the closed conformation with increasing temperature, reaching 0.259% at 37°C. Since the opening rates for both capsid and dimer are nearly identical, these differences in exposure equilibrium can be attributed to the closing rate for the C-terminal region.
Thermodynamics
The equilibrium constant for the open-close transition, Kop, shows different behavior for dimer and capsid. Comparing dimer and capsid, values of Kop at a particular temperature differ by up to 2 orders of magnitude, and Kop trends between the two assembly states have opposite temperature dependence (Figure 5B). Van’t Hoff plots of the temperature dependence of the closing transition give an enthalpy of -125.9 kJ/mol and an entropic contribution of -368 J·K-1mol-1 for the closing process in capsids. For dimer Kop decreases with increasing temperature, indicating entropic stabilization of the folded state with ΔH = +54.5 kJ/mol and ΔS = +224 J·K-1mol-1 for closing. These values for dimer have the same trends as parameters calculated from capsid assembly experiments(23) and differ by less than an order of magnitude, suggesting a connection between folding of the C-terminus and the capsid assembly reaction. Based upon the sign changes in enthalpy and entropy of the closing transition for dimer and capsid, the C-terminus of Cp149 has fundamentally different behavior in the two assembly states.
These results show that dimer and capsid forms of Cp149, or the surrounding microenvironments, have heterogeneous dynamic behavior. At 37°C, roughly 1% of capsid protein is in the open conformation, while dimer is almost entirely closed. At 19°C, the properties are reversed. There is also no correlation between the folded state of the C-terminus and the final assembly condition of Cp149: the open structural state observed for Cp149 can be achieved by both dimer and capsid under the appropriate conditions, while the primary difference between dimer and capsid is the opposite temperature dependence of the opening equilibrium.
Discussion
To date kinetic analysis of hydrolysis has been largely relegated to the study of model systems and small monomeric proteins. We have shown here that the energetics behind conformational flexibility, even within supramolecular complexes, can be measured using kinetic hydrolysis. Besides identification of the cleavage site using mass spectrometry, only standard lab equipment is required for these experiments. Preliminary SDS-PAGE and mass spectrometry of HBV Cp149 reaction products showed that proteolysis in both dimer and capsid forms exclusively targets the trypsin site R127/T128. Because the initial proteolytic reaction is focused on a single site, the kinetic analysis is practical and unambiguous. Computational modeling of proteolytic reactions indicates that even a minor secondary cleavage pathway can have a significant impact on the calculated equilibrium and rates(63,64). These concerns make it vital that measurements of dynamic motion based on the disappearance of starting material be the result of a single cleavage pathway. Previously this requirement has been met by limiting the application of kinetic hydrolysis to small proteins that are well folded(61,62,65). Supramolecular complexes can be amenable to the same analyses, provided suitable precautions are met.
The application of kinetic hydrolysis to supramolecular complexes introduces a series of structural concerns. It is possible that structural rearrangements such as dimer dissociation, capsid integrity, or destabilizing cleavages could all affect the measured rates, but these factors were found to be absent under the conditions studied. Capsids are very robust and no detectable dissociation has been observed with the buffer conditions used in these experiments(23). At 37°C, dimer is seen to have a reduced Kop value compared to capsid, ruling out dimer dissociation as an intermediate in the reaction pathway of capsid proteolysis. Dynamic light scattering and size-exclusion chromatography experiments show no general capsid destabilization during the course of the reactions, and by collecting data only on solutions with greater than 70% completely intact protein, destabilization is further minimized. Localized effects as a result of cleavage within the clusters of five or six C-termini at the capsid pores cannot be ruled out, but the loss of the cleavage peptide at the terminus is not expected to reduce steric protection for neighboring dimers. Besides accessibility, the cleavage site stability is maintained as the reaction progresses. The stabilizing hydrophobic cluster consisting of amino acids L140, F110, and Y118 is formed within one dimer, and by restricting data collection to only 30% completion, there is less than 10% likelihood of a second cleavage occurring adjacent to an already-cleaved site.
We find that HBV capsids and core protein dimers are very dynamic compared to the small protein examples known. The exposure of the R127/T128 cleavage site is not a rare process, with equilibrium values ranging between 5×10⁻⁴ and 0.0124. Similar studies of other proteins have found values more than 200-fold lower(50,61,66). It may also be possible that the magnitude of motion required for transition between the folded and protease-accessible states is far greater than that required for biological activity in the native particles, resulting in effectively higher exposure for native interactions. While the measured Kop equilibrium is larger than values observed for other systems, kopen trends are relatively similar(50). This indicates that the high exposure distribution of the C-terminus is maintained by a very slow closing rate. In a biological context, these parameters give an average of three individual monomers per capsid in the open state. Because all reactions are carried out in solution and represent the average for ~2×10¹² individual capsids, it is impossible to say whether the opening transition is independent, or cooperative in the context of a capsid. It is attractive to speculate that several adjacent subunits around a fivefold or quasi-sixfold vertex open at the same time.
Similar to the equilibrium trends, the exposure rates of the cleavage site indicate the dynamic nature of Cp149. The slowest opening transition to a cleavage-accessible state is found for capsid at 19°C, with a rate constant of 3.5 day-1. While this is comparable to values seen for sets of stable amide protons in HDX experiments(67-69), the motions required for the “open” state in hydrogen-exchange are extremely small, sometimes less than an angstrom(52). In contrast, proteolysis requires a substantial region of unfolded backbone(44), and in the case of Cp149, steric constraints from the four-helix turrets increase the required exposure for cleavage. The total translation, between the conformation in the crystal structure to an estimated cleavage-accessible unfolded state, may necessitate as much as a 13Å motion for the R127/T128 pair alone. This large-amplitude motion is sampled on a moderate timescale for even the most strongly-folded conditions studied (19°C, capsid).
The Cp149 C-terminus likely populates an ensemble of conformations in solution. The application of kinetic hydrolysis can only resolve the rate of transition across an arbitrary boundary between protease-protected and accessible conformations. A two-state approximation has been a sufficient and successful model for kinetic hydrolysis studies of other proteins(60,62,65,70,71). Our results reaffirm applicability of a two-state closed/open system to HBV Cp149 dimer and capsid. While there may be subtle complications beyond the two-state behavior, any deviations present are insignificant within the error of the data. The kinetics follow the predicted pattern for a partially-protected peptide backbone: cleavage rates of the dimer are approximately 150-fold slower compared to the unstructured model peptide. However, the observed opening rates (Figure 5A) far exceed predicted values for non-dynamic protein structures(52). The observed rate of digestion also reaches an upper limit in the opening-limited conditions of high enzyme concentration (Figure 4A), indicating that transient interconversion is responsible for the protection effect. This phenomenon has been observed with other known two-state systems(50,70).
Structures containing atomic-level detail of the C-terminus of Cp149 in capsid form, crystallized at ~21°C to 24°C, are available(13,14). These models are in good agreement that residues G112-T142 adopt a defined, folded helix-loop-arm conformation, with L140 wrapping around to meet with residues F110 and Y118 (see Figures 1B and 6A,C). The site of cleavage, R127/T128, is located near the terminus of helix 5 in this helix-loop-arm. The relative size of the protease is shown next to the capsid in Figure 1. Rigid body docking of the crystal structures indicates that substantial unfolding, as described above, must take place to allow the cleavage site to reach the enzyme active site. In this case, the static models from crystallography and cryo-EM are silent to the observed dynamics.
Figure 6.
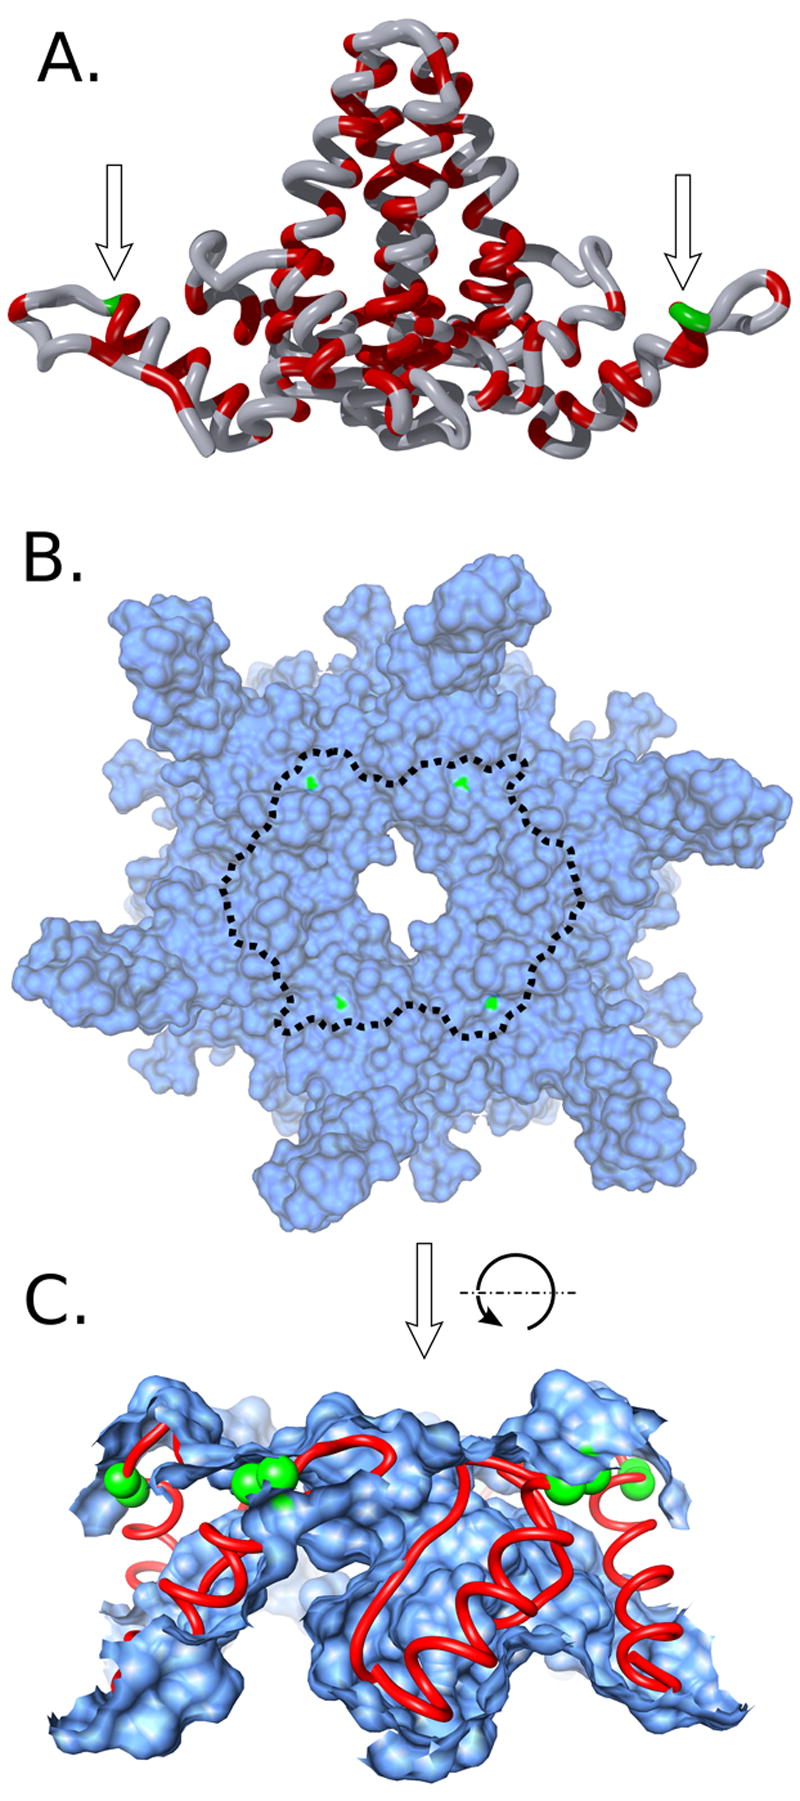
Solution phase dynamics localize to a well ordered helix in the structural model. The structure of HBV Cp149 is shown in dimer and capsid forms (A and B&C respectively: not to scale). A) Dimer: the trypsin cleavage site between residues 127 and 128 is indicated with arrows. Despite the presence of alternative protease sites for trypsin and thermolysin (shown in red), cleavage is restricted to the end of helix 5 (in green). B) Local overhead view of a quasi-sixfold center of symmetry within the assembled capsid. Shown as a solvent-excluded surface, the cleavage sites (green) are barely exposed to solvent. The observed cleavage location (green) is central to the packing interface between dimers at the fivefold and sixfold axes of symmetry in the capsid. The indicated boundary shows the extent of Figure 5C. C) Cutaway of Figure 5B, rotated 90° away from the viewer. Dimers make close contact centered at helix 5 (red chain), preventing access to the cleaved bond (green spheres).
Based on the differences between structural data and our dynamics results, we postulate that free dimer adopts a conformation where the C-terminal domain is loosely held in place by hydrophobic interactions in a manner that is distinct from capsid. In capsids, the cleavage site is dynamic but leaves most hydrophobic contacts intact during breathing modes, which results in the change of sign for the thermodynamic parameters. This model is also consistent with previous studies that have detailed the thermodynamics of capsid formation(23). The temperature dependence of dimer opening also clarifies the role of small molecules such as HAP and Zn2+ in the allosteric regulation of assembly(14,21,27). At 21°C Zn2+ induces trapped assembly while at 37°C it leads to virus-like particles. The HAP molecules strongly enhance assembly and have been shown to pack against the C-terminal helix and arm(14). In the assembled capsid the C-terminal arm is tightly packed into the inter-dimer hydrophobic interfaces(13,14). Our results indicate that the assembled HBV capsid can be described as a thermodynamic balancing act between the intersubunit affinity which promotes assembly and localized opening which allow the C-terminal domain to be dynamic.
The wealth of data available on the behavior of the HBV capsid allows these results to be put into context with respect to the biology of the virus. In vivo, the dynamic behavior of the C-terminus plays a general role in the lifecycle of HBV(72). The construct used for these experiments, with deletion of the C-terminal arginine-rich region, may be thought of as the minimal structure which still retains the features of the native protein(73). By using this variant, which is well studied from the perspective of both assembly and structure, the kinetic hydrolysis measurements can be compared to data which is unavailable for the full-length capsid protein. However, the full-length protein also has behavior which is in agreement with our observations of Cp149. The RNA binding domain, the C-terminus (residues 150-183) of the full-length core protein, is located on the interior of the capsid and directly exposed to the nucleic acid. However, the phosphorylation state is altered during assembly, maturation(32,37,41,42,74,75), and nuclear localization of assembled particles(33,35,36,76). Transient exposure of this domain will allow reaction with kinases, phosphatases, and the nuclear transport machinery. Secretion of mature cores from the cell must take advantage of other host transport machinery, probably including the ubiquitin ligase, Nedd4(38). However, Nedd4 is predicted to bind to a late domain PPAY (residues 129-132, Figure 1C) that is largely buried(38). Our study indicates that PPAY, which is adjacent to the cleavage site, will be transiently exposed. We can reasonably hypothesize that the nucleic acid content of the core will affect the breathing modes that expose the RNA-binding and late domain sequences, providing a mechanism for DNA synthesis to signal the next steps in the virus life cycle.
Conclusion
The use of proteolytic digestion to probe dynamic behavior of proteins is well established and provides an alternative approach to spectroscopic means for obtaining thermodynamic information(45,50,61,62). However, the advantages it provides (simplicity despite structural size and complexity; amenability to varying buffer, pH, and temperature conditions; and sensitivity to large-scale motion) have not been fully explored. We have demonstrated the utility of a quantitative kinetic proteolysis approach to study the 4 MDa Hepatitis B viral capsid. Our findings indicate that the C-terminus is highly dynamic, resulting in transient exposure to the surface of the capsid. Similarly internalized domains in other icosahedral capsids are known to be dynamic and exposed in solution(7,49,55,77,78). The detailed characterization of this motion for the HBV capsid has shown that the dynamics are highly temperature-dependent. In dimer, the opening transition appears to have negative entropy and positive enthalpy, while in capsid the reverse in true. This thermodynamic switch between oligomeric states may help explain the variety of roles observed for the C-terminus, where structural localization is predicted to vary in the course of the HBV lifecycle. The approximate match between energetics of C-terminus “closing” in the dimer and capsid assembly may indicate that folding in this region is part of the pathway for capsid assembly, although further investigation is needed to clarify the role of any intermediates. The measurements of kinetic and thermodynamic parameters made possible with kinetic hydrolysis provide the first mechanistic evidence for dynamic structural behavior within the highly biologically-relevant region of the Hepatitis B core protein.
Materials and Methods
HBV protein preparation
HBV capsids were produced from recombinant Cp1492, expressed in BL21 DE3 E. coli and purified with multiple cycles of size-exclusion chromatography as previously described(79). Capsids are stored in 50mM HEPES pH 7.5, 0.5M NaCl, 2mM DTT, 4°C. Purified capsids were dissociated with 3M urea on ice and isolated with size-exclusion chromatography to produce dimer stock. Storage conditions for dimer were 50mM Na2CO3 pH 9.6, 2mM DTT, 4°C. The stock solutions of Cp149 were regularly checked using FPLC size-exclusion chromatography (100cm Sephacryl 500: GE Healthcare Inc.; Chalfont St. Giles, GBR) with detection at 280nm and dynamic light scattering Brookhaven 90Plus (Brookhaven Instruments Corp.; Holtsville, NY).
Immediately before use, samples were diluted into reaction buffer. Although previous research has shown the robust stability of Cp149 dimers and capsid under the buffer conditions used(17), example reactions were run within a temperature-controlled Brookhaven 90Plus dynamic light scattering instrument to monitor the assembly state during the progress of digestion. DLS was measured at 90° using a 661 diode laser, and correlation functions were fit using a non-negatively constrained least-squares analysis. As the proteolysis progressed, no decrease in the primary signal was observed, nor were there any smaller particles or aggregate material seen. Capsid integrity was also evaluated by size exclusion chromatography with a Superose 6 column (Amersham-Pharmacia, Piscataway, NJ). Buffer conditions were identical to those used for proteolysis reactions (see below), and detection was followed at 280 nm. The experimental results provided additional evidence for the continuing integrity of the capsids (see Results).
Proteolysis reactions
Reaction solutions consisted of 0.5mg/mL HBV protein, 150mM NaCl, 100mM Tris pH 7.5, and variable concentrations of sequencing-grade modified trypsin (Promega Corp.; Fitchburg, WI). All buffers were individually prepared to account for the temperature sensitivity of Tris. Trypsin was stored in frozen aliquots in 1mM HCl: any dilutions were made immediately before use. Each reaction was initiated by addition of an appropriate volume of trypsin and vortexed. A typical experiment consisted of 50-100μL final volume incubated in a thermocycler for the duration of the digestion. Aliquots of 3μL were removed in triplicate from the reaction and immediately diluted into 12μL of gel loading buffer, vortexed, and heated to 100°C for 5 minutes. Following boiling, samples were cooled on ice, briefly centrifuged to collect condensation, vortexed, and stored on ice until use. Prior to gel loading, the frozen samples were simultaneously boiled at 100°C for 5 minutes, cooled to 25°C, centrifuged, vortexed, and maintained at 25°C during gel loading. These additional precautions for sample preparation were used to maximize reproducibility in gel loading. Samples were run on 4-20% gradient and 18% non-gradient SDS polyacrylamide gels (Bio-Rad; Hercules, CA) with Tris-glycine running buffer. Running conditions were 200V and the minimal time required to ensure separation between intact protein and cleaved products, typically 25 minutes. Gels were prepared according to manufacturer’s instructions for staining with colloidal Coomassie or Sypro Ruby (Pierce Biotechnology; Rockford, IL), and scanned with a Typhoon 9410 laser scanner (GE Healthcare Inc.) for Sypro stain and Epson 4180 scanner (Seiko Epson Co; Suwa, JPN) for Coomassie stain.
Preliminary experiments were conducted to ensure that the subset of the hydrolysis progression assayed for quantitative measurements was representative of the overall trend and did not span any discontinuities (Figure 2A and C). To ensure the integrity of the viral capsids, for quantitative reactions all data was collected from time points containing greater than 70% uncleaved protein, as determined by gel densitometry. For each enzyme concentration, sampling times were adjusted as necessary for best coverage of this region. Samples were removed from reactions either as individual time stamps (Figure 2A and C) or in triplicate at each time point (Figure 2B and D). The latter approach allowed an evaluation of sampling and quantitation error.
Densitometry
While it is necessary to limit the extent of digestion when working with a protein complex to insure integrity, this complicates densitometry because the observed differences in band intensities are limited and subtle. By restricting proteolytic cleavage to less than 30% completion, the change in intact protein intensity represents a very small variable range for typical densitometry. In order to maximize the accuracy of the quantitation, several novel methods were employed. Image acquisition is the first step of the processing pipeline which can have an impact on the final result: concerns typically include linearity, sensitivity, and dynamic range(80). However, for quantitation of band intensities which are never more than ±15%, these effects are minimal. In order to test this assumption, gel images were stained with the standard fluorescent stain SYPRO ruby and image acquisition was performed using a Typhoon 9400 laser scanner. Gels were then stained with the colloidal Coomassie stain and imaged with an Epson 4180 flatbed CCD scanner. For the types of gel images used, comparative analysis showed no significant deviation between the two methods. Since acquisition introduces minimal error for homogeneous images, detection and quantitation of gel bands was addressed as the primary source of variability. Image manipulation was performed using lossless operations in Adobe Photoshop CS, followed by analysis using ImageJ (Rasband, U. S. National Institutes of Health, http://rsb.info.nih.gov/ij/) with a manual watershed isolation method and a high-resolution modified version of the GelAnalyzer module. Band intensities were plotted and fit in Origin 7.0 to the first-order equation:
| (2) |
, where It is the measured intact protein at time t, I0 is the intensity at t = 0, and kexp is a first-order rate constant. These precautions made it possible to quantify band intensities to an acceptable degree of precision: the total variability for replicate lanes was typically less than 4% relative standard deviation.
Mass spectrometry
Proteolysis reactions for mass spectrometry analysis were conducted identical to those for gel-based analysis except for termination; in some situations one reaction was simultaneously analyzed with gels and mass spectrometry. Quenching of proteolysis was performed via multiple methods to avoid biasing peptide detection. These included dropping the pH, addition of irreversible trypsin inhibitors such as PMSF, boiling, spotting directly on to a MALDI plate, and direct LCMS injection. For electrospray-based MS analysis sample quantity was varied over four orders of magnitude spanning the typical detection range. Electrospray instrumentation included an Agilent XCT Plus (Agilent Technologies; Santa Clara, CA), Bruker micrOTOF LC (Bruker Daltonik GmbH; Bremen, DEU), and Waters QToF Premier (Waters Corp.; Milford, MA), all interfaced with reverse-phase HPLC (C8 or C18: Phenomenex Inc.; Torrance, CA). MALDI analysis was performed with a variety of sample/matrix ratios and both sinapinic acid and α-Cyano-4-hydroxycinnamic acid, on a Bruker BiFlex III.
Intrinsic rate determination of trypsin cleavage
To determine the activity of trypsin upon the observed cleavage sequence in absence of any structural or steric constraints, the fluorogenic peptide Abz-IRTPP-Tyr(3-NO2) was characterized as a trypsin substrate. While the peptide is intact, the FRET fluorescence-quenching nitrotyrosine residue decreases intrinsic fluorescence of the 2-aminobenzamide (Abz) at the C-terminus. Upon cleavage at the R/T trypsin site, the Abz fluorescence is restored(81). The synthetic peptide was purchase from New England Peptide (Gardner, MA) at >99% pure and used without further purification. Assays were carried out for each temperature under the same conditions as for proteolytic reactions: 150mM NaCl and 100mM Tris pH 7.5. Peptide concentration was varied from 150nM to 75μM in order to generate KM curves. Buffered solutions containing the peptide were preincubated in a temperature-controlled and stirred cuvette with a PerkinElmer LS50B fluorometer (PerkinElmer; Waltham, MA) and reactions were initiated by addition of trypsin to a final concentration of 9.6 to 385nM. Changes in Abz fluorescence were observed with an excitation wavelength of 318 nm and an emission wavelength of 420 nm. Depending on trypsin concentration, analysis was carried out by fitting data to either initial-velocity Michaelis-Menten kinetic models or with an exponential-rise model(82):
| (3) |
Where Ft is the measured fluorescence, F0 is the fluorescence at t = 0, Fmax is fluorescence at t = ∞, and V/K is a pseudo-first-order rate constant. From this exponential-rise model kcat/KM was determined by dividing V/K by the enzyme concentration of the reaction.
Kinetic models of proteolysis
For protein domains that partition between folded and unfolded conformations, the rate of cleavage can be modeled with a two-state equilibrium system:
| (1) |
Under normal conditions without the presence of protease, an equilibrium is established between open and closed forms of the protein, giving
| (4) |
and with: [Closed] + [Open] = [Total],
| (5) |
For typical cases with small values of Kop, Equation 5 simplifies to [Open] = Kop·[Total], removing the denominator term. This simplification can be propagated through derivative equations without excessive error. In the presence of a proteolytic enzyme, the intrinsic cleavage rate constant kcleave can be calculated as
| (6) |
with kcat/KM being the standard catalytic constants for trypsin cleavage of the particular peptide sequence and [E] is the concentration of trypsin. The pseudo-first order simplification of the Michaelis-Menten equation is justified because the measured KM for this sequence was 20μM, which is much greater than the concentration of available HBV cleavage sites. A steady-state simplification of the system in Equation 1 can be used to approximate the observed first-order rate constant kexp as a function of the component constants:
| (7) |
This produces a hyperbolic trend when sufficient quantities of enzyme are used in the digestions. When kcat/KM·[E] ≫ kclose, any protein in the open conformation is immediately cleaved and kexp approaches a maximum limit. This is termed “opening-limited conditions”, and under such situations kexp = kopen. Since in practice it is rarely possible to achieve perfectly enzyme-saturated levels, kopen is typically extrapolated by fitting Equation 7 with nonlinear regression to data collected across a wide range of enzyme concentrations (Figure 3A).
Alternatively, when enzyme concentrations are low enough that cleavage is slow relative to the equilibrium process (kcat/KM·E ≪ kclose ), the concentration of protein in the open conformation remains a function of the remaining total uncleaved protein (Equation 5). By combining Equations 5 and 6, the linear relationship between enzyme and experimental rate constant:
| (8) |
can be modeled for reactions with low concentration of enzyme. This is termed “cleavage-limited conditions”, and data from such reactions can be fit with a linear regression (Figure 3B).
Once Kop values have been obtained, ΔG deprotection is calculated as -RT·ln(Kop). Not to be confused with the energetics of proteolytic cleavage, this thermodynamic parameter is the free energy difference between the open and closed conformation states of the protein.
Acknowledgments
The author’s would like to acknowledge the technical support of Pablo Ceres, Angela Lee, and Jennifer M Johnson and to thank Richard Kriwacki, Kim Hilmer, and Jason Lanman for critical reading of the manuscript. AZ was supported by R56 AI068883. BB acknowledges that the project described was supported by NIH Grant Number P20 RR-020185 from the COBRE Program of the National Center For Research Resources. BB also receives support from the Center for Bio-Inspired Nanomaterials (Office of Naval Research grant #N00014-06-01-1016). The Murdock Charitable Trust for support of the Mass Spectrometry Facility at MSU.
Footnotes
Publisher's Disclaimer: This is a PDF file of an unedited manuscript that has been accepted for publication. As a service to our customers we are providing this early version of the manuscript. The manuscript will undergo copyediting, typesetting, and review of the resulting proof before it is published in its final citable form. Please note that during the production process errors may be discovered which could affect the content, and all legal disclaimers that apply to the journal pertain.
References
- 1.Wales DJ. The energy landscape as a unifying theme in molecular science. Philos Transact A Math Phys Eng Sci. 2005;363:357–375. doi: 10.1098/rsta.2004.1497. discussion 375-357. [DOI] [PubMed] [Google Scholar]
- 2.Eisenmesser EZ, Millet O, Labeikovsky W, Korzhnev DM, Wolf-Watz M, Bosco DA, Skalicky JJ, Kay LE, Kern D. Intrinsic dynamics of an enzyme underlies catalysis. Nature. 2005;438:117–121. doi: 10.1038/nature04105. [DOI] [PubMed] [Google Scholar]
- 3.Vendruscolo M. Determination of conformationally heterogeneous states of proteins. Curr Opin Struct Biol. 2007;17:15–20. doi: 10.1016/j.sbi.2007.01.002. [DOI] [PubMed] [Google Scholar]
- 4.Schuwirth BS, Borovinskaya MA, Hau CW, Zhang W, Vila-Sanjurjo A, Holton JM, Cate JH. Structures of the bacterial ribosome at 3.5 A resolution. Science. 2005;310:827–834. doi: 10.1126/science.1117230. [DOI] [PubMed] [Google Scholar]
- 5.Frey S, Richter RP, Gorlich D. FG-rich repeats of nuclear pore proteins form a three-dimensional meshwork with hydrogel-like properties. Science. 2006;314:815–817. doi: 10.1126/science.1132516. [DOI] [PubMed] [Google Scholar]
- 6.Witz J, Brown F. Structural dynamics, an intrinsic property of viral capsids. Arch Virol. 2001;146:2263–2274. doi: 10.1007/s007050170001. [DOI] [PubMed] [Google Scholar]
- 7.Johnson JE. Virus particle dynamics. Adv Protein Chem. 2003;64:197–218. doi: 10.1016/s0065-3233(03)01005-2. [DOI] [PubMed] [Google Scholar]
- 8.Cremeens ME, Fujisaki H, Zhang Y, Zimmermann J, Sagle LB, Matsuda S, Dawson PE, Straub JE, Romesberg FE. Efforts toward developing direct probes of protein dynamics. J Am Chem Soc. 2006;128:6028–6029. doi: 10.1021/ja061328g. [DOI] [PubMed] [Google Scholar]
- 9.Jarymowycz VA, Stone MJ. Fast time scale dynamics of protein backbones: NMR relaxation methods, applications, and functional consequences. Chem Rev. 2006;106:1624–1671. doi: 10.1021/cr040421p. [DOI] [PubMed] [Google Scholar]
- 10.Tehei M, Daniel R, Zaccai G. Fundamental and biotechnological applications of neutron scattering measurements for macromolecular dynamics. Eur Biophys J. 2006;35:551–558. doi: 10.1007/s00249-006-0082-6. [DOI] [PubMed] [Google Scholar]
- 11.Stannard LM, Hodgkiss M. Morphological irregularities in Dane particle cores. J Gen Virol. 1979;45:509–514. doi: 10.1099/0022-1317-45-2-509. [DOI] [PubMed] [Google Scholar]
- 12.Crowther RA, Kiselev NA, Bottcher B, Berriman JA, Borisova GP, Ose V, Pumpens P. Three-dimensional structure of hepatitis B virus core particles determined by electron cryomicroscopy. Cell. 1994;77:943–950. doi: 10.1016/0092-8674(94)90142-2. [DOI] [PubMed] [Google Scholar]
- 13.Wynne SA, Crowther RA, Leslie AG. The crystal structure of the human hepatitis B virus capsid. Mol Cell. 1999;3:771–780. doi: 10.1016/s1097-2765(01)80009-5. [DOI] [PubMed] [Google Scholar]
- 14.Bourne CR, Finn M, Zlotnick A. Global structural changes in hepatitis B virus capsids induced by the assembly effector HAP1. J Virol. 2006 doi: 10.1128/JVI.00933-06. [DOI] [PMC free article] [PubMed] [Google Scholar]
- 15.Dryden KA, Wieland SF, Whitten-Bauer C, Gerin JL, Chisari FV, Yeager M. Native hepatitis B virions and capsids visualized by electron cryomicroscopy. Mol Cell. 2006;22:843–850. doi: 10.1016/j.molcel.2006.04.025. [DOI] [PubMed] [Google Scholar]
- 16.Zhou S, Standring DN. Hepatitis B virus capsid particles are assembled from core-protein dimer precursors. Proc Natl Acad Sci U S A. 1992;89:10046–10050. doi: 10.1073/pnas.89.21.10046. [DOI] [PMC free article] [PubMed] [Google Scholar]
- 17.Singh S, Zlotnick A. Observed hysteresis of virus capsid disassembly is implicit in kinetic models of assembly. J Biol Chem. 2003;278:18249–18255. doi: 10.1074/jbc.M211408200. [DOI] [PubMed] [Google Scholar]
- 18.Bottcher B, Wynne SA, Crowther RA. Determination of the fold of the core protein of hepatitis B virus by electron cryomicroscopy. Nature. 1997;386:88–91. doi: 10.1038/386088a0. [DOI] [PubMed] [Google Scholar]
- 19.Conway JF, Cheng N, Zlotnick A, Wingfield PT, Stahl SJ, Steven AC. Visualization of a 4-helix bundle in the hepatitis B virus capsid by cryo-electron microscopy. Nature. 1997;386:91–94. doi: 10.1038/386091a0. [DOI] [PubMed] [Google Scholar]
- 20.Wingfield PT, Stahl SJ, Williams RW, Steven AC. Hepatitis core antigen produced in Escherichia coli: subunit composition, conformational analysis, and in vitro capsid assembly. Biochemistry. 1995;34:4919–4932. doi: 10.1021/bi00015a003. [DOI] [PubMed] [Google Scholar]
- 21.Stray SJ, Ceres P, Zlotnick A. Zinc ions trigger conformational change and oligomerization of hepatitis B virus capsid protein. Biochemistry. 2004;43:9989–9998. doi: 10.1021/bi049571k. [DOI] [PubMed] [Google Scholar]
- 22.Ceres P, Stray SJ, Zlotnick A. Hepatitis B virus capsid assembly is enhanced by naturally occurring mutation F97L. J Virol. 2004;78:9538–9543. doi: 10.1128/JVI.78.17.9538-9543.2004. [DOI] [PMC free article] [PubMed] [Google Scholar]
- 23.Ceres P, Zlotnick A. Weak protein-protein interactions are sufficient to drive assembly of hepatitis B virus capsids. Biochemistry. 2002;41:11525–11531. doi: 10.1021/bi0261645. [DOI] [PubMed] [Google Scholar]
- 24.Zlotnick A, Johnson JM, Wingfield PW, Stahl SJ, Endres D. A theoretical model successfully identifies features of hepatitis B virus capsid assembly. Biochemistry. 1999;38:14644–14652. doi: 10.1021/bi991611a. [DOI] [PubMed] [Google Scholar]
- 25.Choi Y, Gyoo Park S, Yoo JH, Jung G. Calcium ions affect the hepatitis B virus core assembly. Virology. 2005;332:454–463. doi: 10.1016/j.virol.2004.11.019. [DOI] [PubMed] [Google Scholar]
- 26.Stray SJ, Zlotnick A. BAY 41-4109 has multiple effects on Hepatitis B virus capsid assembly. J Mol Recognit. 2006 doi: 10.1002/jmr.801. [DOI] [PubMed] [Google Scholar]
- 27.Stray SJ, Bourne CR, Punna S, Lewis WG, Finn MG, Zlotnick A. A heteroaryldihydropyrimidine activates and can misdirect hepatitis B virus capsid assembly. Proc Natl Acad Sci U S A. 2005;102:8138–8143. doi: 10.1073/pnas.0409732102. [DOI] [PMC free article] [PubMed] [Google Scholar]
- 28.Zlotnick A, Ceres P, Singh S, Johnson JM. A small molecule inhibits and misdirects assembly of hepatitis B virus capsids. J Virol. 2002;76:4848–4854. doi: 10.1128/JVI.76.10.4848-4854.2002. [DOI] [PMC free article] [PubMed] [Google Scholar]
- 29.Hacker HJ, Deres K, Mildenberger M, Schroder CH. Antivirals interacting with hepatitis B virus core protein and core mutations may misdirect capsid assembly in a similar fashion. Biochem Pharmacol. 2003;66:2273–2279. doi: 10.1016/j.bcp.2003.08.001. [DOI] [PubMed] [Google Scholar]
- 30.Deres K, Schroder CH, Paessens A, Goldmann S, Hacker HJ, Weber O, Kramer T, Niewohner U, Pleiss U, Stoltefuss J, Graef E, Koletzki D, Masantschek RN, Reimann A, Jaeger R, Gross R, Beckermann B, Schlemmer KH, Haebich D, Rubsamen-Waigmann H. Inhibition of hepatitis B virus replication by drug-induced depletion of nucleocapsids. Science. 2003;299:893–896. doi: 10.1126/science.1077215. [DOI] [PubMed] [Google Scholar]
- 31.Butz K, Denk C, Fitscher B, Crnkovic-Mertens I, Ullmann A, Schroder CH, Hoppe-Seyler F. Peptide aptamers targeting the hepatitis B virus core protein: a new class of molecules with antiviral activity. Oncogene. 2001;20:6579–6586. doi: 10.1038/sj.onc.1204805. [DOI] [PubMed] [Google Scholar]
- 32.Yu M, Summers J. Phosphorylation of the duck hepatitis B virus capsid protein associated with conformational changes in the C terminus. J Virol. 1994;68:2965–2969. doi: 10.1128/jvi.68.5.2965-2969.1994. [DOI] [PMC free article] [PubMed] [Google Scholar]
- 33.Rabe B, Vlachou A, Pante N, Helenius A, Kann M. Nuclear import of hepatitis B virus capsids and release of the viral genome. Proc Natl Acad Sci U S A. 2003;100:9849–9854. doi: 10.1073/pnas.1730940100. [DOI] [PMC free article] [PubMed] [Google Scholar]
- 34.Kock J, Kann M, Putz G, Blum HE, Von Weizsacker F. Central role of a serine phosphorylation site within duck hepatitis B virus core protein for capsid trafficking and genome release. J Biol Chem. 2003;278:28123–28129. doi: 10.1074/jbc.M300064200. [DOI] [PubMed] [Google Scholar]
- 35.Yeh CT, Liaw YF, Ou JH. The arginine-rich domain of hepatitis B virus precore and core proteins contains a signal for nuclear transport. J Virol. 1990;64:6141–6147. doi: 10.1128/jvi.64.12.6141-6147.1990. [DOI] [PMC free article] [PubMed] [Google Scholar]
- 36.Kann M, Sodeik B, Vlachou A, Gerlich WH, Helenius A. Phosphorylation-dependent binding of hepatitis B virus core particles to the nuclear pore complex. J Cell Biol. 1999;145:45–55. doi: 10.1083/jcb.145.1.45. [DOI] [PMC free article] [PubMed] [Google Scholar]
- 37.Perlman DH, Berg EA, O’Connor PB, Costello CE, Hu J. Reverse transcription-associated dephosphorylation of hepadnavirus nucleocapsids. Proc Natl Acad Sci U S A. 2005;102:9020–9025. doi: 10.1073/pnas.0502138102. [DOI] [PMC free article] [PubMed] [Google Scholar]
- 38.Rost M, Mann S, Lambert C, Doring T, Thome N, Prange R. Gamma-adaptin, a novel ubiquitin-interacting adaptor, and Nedd4 ubiquitin ligase control hepatitis B virus maturation. J Biol Chem. 2006;281:29297–29308. doi: 10.1074/jbc.M603517200. [DOI] [PubMed] [Google Scholar]
- 39.Kann M, Gerlich WH. Effect of core protein phosphorylation by protein kinase C on encapsidation of RNA within core particles of hepatitis B virus. J Virol. 1994;68:7993–8000. doi: 10.1128/jvi.68.12.7993-8000.1994. [DOI] [PMC free article] [PubMed] [Google Scholar]
- 40.Lan YT, Li J, Liao W, Ou J. Roles of the three major phosphorylation sites of hepatitis B virus core protein in viral replication. Virology. 1999;259:342–348. doi: 10.1006/viro.1999.9798. [DOI] [PubMed] [Google Scholar]
- 41.Kock J, Nassal M, Deres K, Blum HE, von Weizsacker F. Hepatitis B virus nucleocapsids formed by carboxy-terminally mutated core proteins contain spliced viral genomes but lack full-size DNA. J Virol. 2004;78:13812–13818. doi: 10.1128/JVI.78.24.13812-13818.2004. [DOI] [PMC free article] [PubMed] [Google Scholar]
- 42.Le Pogam S, Chua PK, Newman M, Shih C. Exposure of RNA templates and encapsidation of spliced viral RNA are influenced by the arginine-rich domain of human hepatitis B virus core antigen (HBcAg 165-173) J Virol. 2005;79:1871–1887. doi: 10.1128/JVI.79.3.1871-1887.2005. [DOI] [PMC free article] [PubMed] [Google Scholar]
- 43.Matthyssens GE, Simons G, Kanarek L. Study of the thermal-denaturation mechanism of hen egg-white lysozyme through proteolytic degradation. Eur J Biochem. 1972;26:449–454. doi: 10.1111/j.1432-1033.1972.tb01786.x. [DOI] [PubMed] [Google Scholar]
- 44.Hubbard SJ, Campbell SF, Thornton JM. Molecular recognition. Conformational analysis of limited proteolytic sites and serine proteinase protein inhibitors. J Mol Biol. 1991;220:507–530. doi: 10.1016/0022-2836(91)90027-4. [DOI] [PubMed] [Google Scholar]
- 45.Carey J. A systematic and general proteolytic method for defining structural and functional domains of proteins. Methods Enzymol. 2000;328:499–514. doi: 10.1016/s0076-6879(00)28415-2. [DOI] [PubMed] [Google Scholar]
- 46.Imoto T, Fukuda K, Yagishita K. A study of the native-denatured (N-D) transition in lysozyme I. Detection of the transition by product analyses of protease digests. Biochim Biophys Acta - Protein Structure. 1974;336:264–269. [Google Scholar]
- 47.Polverino de Laureto P, Scaramella E, Frigo M, Wondrich FG, De Filippis V, Zambonin M, Fontana A. Limited proteolysis of bovine alphalactalbumin: isolation and characterization of protein domains. Protein Sci. 1999;8:2290–2303. doi: 10.1110/ps.8.11.2290. [DOI] [PMC free article] [PubMed] [Google Scholar]
- 48.Kheterpal I, Williams A, Murphy C, Bledsoe B, Wetzel R. Structural features of the Abeta amyloid fibril elucidated by limited proteolysis. Biochemistry. 2001;40:11757–11767. doi: 10.1021/bi010805z. [DOI] [PubMed] [Google Scholar]
- 49.Bothner B, Dong XF, Bibbs L, Johnson JE, Siuzdak G. Evidence of viral capsid dynamics using limited proteolysis and mass spectrometry. J Biol Chem. 1998;273:673–676. doi: 10.1074/jbc.273.2.673. [DOI] [PubMed] [Google Scholar]
- 50.Park C, Marqusee S. Probing the high energy states in proteins by proteolysis. J Mol Biol. 2004;343:1467–1476. doi: 10.1016/j.jmb.2004.08.085. [DOI] [PubMed] [Google Scholar]
- 51.Konermann L, Simmons DA. Protein-folding kinetics and mechanisms studied by pulse-labeling and mass spectrometry. Mass Spectrom Rev. 2003;22:1–26. doi: 10.1002/mas.10044. [DOI] [PubMed] [Google Scholar]
- 52.Wales TE, Engen JR. Hydrogen exchange mass spectrometry for the analysis of protein dynamics. Mass Spectrom Rev. 2006;25:158–170. doi: 10.1002/mas.20064. [DOI] [PubMed] [Google Scholar]
- 53.Kriwacki RW, Hengst L, Tennant L, Reed SI, Wright PE. Structural studies of p21Waf1/Cip1/Sdi1 in the free and Cdk2-bound state: conformational disorder mediates binding diversity. Proc Natl Acad Sci U S A. 1996;93:11504–11509. doi: 10.1073/pnas.93.21.11504. [DOI] [PMC free article] [PubMed] [Google Scholar]
- 54.Fricks CE, Hogle JM. Cell-induced conformational change in poliovirus: externalization of the amino terminus of VP1 is responsible for liposome binding. J Virol. 1990;64:1934–1945. doi: 10.1128/jvi.64.5.1934-1945.1990. [DOI] [PMC free article] [PubMed] [Google Scholar]
- 55.Bothner B, Taylor D, Jun B, Lee KK, Siuzdak G, Schultz CP, Johnson JE. Maturation of a tetravirus capsid alters the dynamic properties and creates a metastable complex. Virology. 2005;334:17–27. doi: 10.1016/j.virol.2005.01.017. [DOI] [PubMed] [Google Scholar]
- 56.Speir JA, Bothner B, Qu C, Willits DA, Young MJ, Johnson JE. Enhanced local symmetry interactions globally stabilize a mutant virus capsid that maintains infectivity and capsid dynamics. J Virol. 2006;80:3582–3591. doi: 10.1128/JVI.80.7.3582-3591.2006. [DOI] [PMC free article] [PubMed] [Google Scholar]
- 57.Hogle JM. Poliovirus cell entry: common structural themes in viral cell entry pathways. Annu Rev Microbiol. 2002;56:677–702. doi: 10.1146/annurev.micro.56.012302.160757. [DOI] [PMC free article] [PubMed] [Google Scholar]
- 58.Havlis J, Thomas H, Sebela M, Shevchenko A. Fast-response proteomics by accelerated in-gel digestion of proteins. Anal Chem. 2003;75:1300–1306. doi: 10.1021/ac026136s. [DOI] [PubMed] [Google Scholar]
- 59.Finehout EJ, Cantor JR, Lee KH. Kinetic characterization of sequencing grade modified trypsin. Proteomics. 2005;5:2319–2321. doi: 10.1002/pmic.200401268. [DOI] [PubMed] [Google Scholar]
- 60.Prudova A, Bauman Z, Braun A, Vitvitsky V, Lu SC, Banerjee R. S-adenosylmethionine stabilizes cystathionine beta-synthase and modulates redox capacity. Proc Natl Acad Sci U S A. 2006;103:6489–6494. doi: 10.1073/pnas.0509531103. [DOI] [PMC free article] [PubMed] [Google Scholar]
- 61.Wildes D, Anderson LM, Sabogal A, Marqusee S. Native state energetics of the Src SH2 domain: evidence for a partially structured state in the denatured ensemble. Protein Sci. 2006;15:1769–1779. doi: 10.1110/ps.062136006. [DOI] [PMC free article] [PubMed] [Google Scholar]
- 62.Arnold U, Köditz J, Markert Y, Ulbrich-Hofmann R. Local fluctuations vs global unfolding of proteins investigated by limited proteolysis. Biocatalysis and Biotransformation. 2005;23:159–167. [Google Scholar]
- 63.Vorob’ev MM, Dalgalarrondo M, Chobert JM, Haertle T. Kinetics of beta-casein hydrolysis by wild-type and engineered trypsin. Biopolymers. 2000;54:355–364. doi: 10.1002/1097-0282(20001015)54:5<355::AID-BIP60>3.0.CO;2-H. [DOI] [PubMed] [Google Scholar]
- 64.Schellenberger V, Siegel RA, Rutter WJ. Analysis of enzyme specificity by multiple substrate kinetics. Biochemistry. 1993;32:4344–4348. doi: 10.1021/bi00067a025. [DOI] [PubMed] [Google Scholar]
- 65.Park C, Marqusee S. Pulse proteolysis: a simple method for quantitative determination of protein stability and ligand binding. Nat Methods. 2005;2:207–212. doi: 10.1038/nmeth740. [DOI] [PubMed] [Google Scholar]
- 66.Young TA, Skordalakes E, Marqusee S. Comparison of proteolytic susceptibility in phosphoglycerate kinases from yeast and E. coli: modulation of conformational ensembles without altering structure or stability. J Mol Biol. 2007;368:1438–1447. doi: 10.1016/j.jmb.2007.02.077. [DOI] [PubMed] [Google Scholar]
- 67.Bai Y, Milne JS, Mayne L, Englander SW. Primary structure effects on peptide group hydrogen exchange. Proteins. 1993;17:75–86. doi: 10.1002/prot.340170110. [DOI] [PMC free article] [PubMed] [Google Scholar]
- 68.Sari N, Ruan B, Fisher KE, Alexander PA, Orban J, Bryan PN. Hydrogen-deuterium exchange in free and prodomain-complexed subtilisin. Biochemistry. 2007;46:652–658. doi: 10.1021/bi061601r. [DOI] [PubMed] [Google Scholar]
- 69.Bai Y, Milne JS, Mayne L, Englander SW. Protein stability parameters measured by hydrogen exchange. Proteins. 1994;20:4–14. doi: 10.1002/prot.340200103. [DOI] [PubMed] [Google Scholar]
- 70.Imoto T, Yamada H, Ueda T. Unfolding rates of globular proteins determined by kinetics of proteolysis. J Mol Biol. 1986;190:647–649. doi: 10.1016/0022-2836(86)90250-0. [DOI] [PubMed] [Google Scholar]
- 71.Fontana A, de Laureto PP, Spolaore B, Frare E, Picotti P, Zambonin M. Probing protein structure by limited proteolysis. Acta Biochim Pol. 2004;51:299–321. [PubMed] [Google Scholar]
- 72.Knipe DM, Howley PM, Griffin DE, Lamb RA, Martin MA. Fields Virology. 5. Vol. 2. Lippincott Williams & Wilkins; Hagerstown, MD: 2006. [Google Scholar]
- 73.Zlotnick A, Cheng N, Conway JF, Booy FP, Steven AC, Stahl SJ, Wingfield PT. Dimorphism of hepatitis B virus capsids is strongly influenced by the C-terminus of the capsid protein. Biochemistry. 1996;35:7412–7421. doi: 10.1021/bi9604800. [DOI] [PubMed] [Google Scholar]
- 74.Ganem D, Schneider RJ. Hepadnaviridae: The viruses and their replication. In: Knipe DM, Howley PM, editors. Fields Virology. 4. Lippincott, Williams & Wilkins: Philadelphia; 2001. [Google Scholar]
- 75.Nassal M. The arginine-rich domain of the hepatitis B virus core protein is required for pregenome encapsidation and productive viral positive-strand DNA synthesis but not for virus assembly. J Virol. 1992;66:4107–4116. doi: 10.1128/jvi.66.7.4107-4116.1992. [DOI] [PMC free article] [PubMed] [Google Scholar]
- 76.Yeh CT, Hong LH, Ou JH, Chu CM, Liaw YF. Characterization of nuclear localization of a hepatitis B virus precore protein derivative P22. Arch Virol. 1996;141:425–438. doi: 10.1007/BF01718307. [DOI] [PubMed] [Google Scholar]
- 77.Speir JA, Munshi S, Wang G, Baker TS, Johnson JE. Structures of the native and swollen forms of cowpea chlorotic mottle virus determined by X-ray crystallography and cryo-electron microscopy. Structure. 1995;3:63–78. doi: 10.1016/s0969-2126(01)00135-6. [DOI] [PMC free article] [PubMed] [Google Scholar]
- 78.Lewis JK, Bothner B, Smith TJ, Siuzdak G. Antiviral agent blocks breathing of the common cold virus. Proc Natl Acad Sci U S A. 1998;95:6774–6778. doi: 10.1073/pnas.95.12.6774. [DOI] [PMC free article] [PubMed] [Google Scholar]
- 79.Zlotnick A, Lee A, Bourne CR, Johnson JM, Domanico PL, Stray SJ. In vitro screening for molecules that affect virus capsid assembly (and other protein association reactions) Nat Protoc. 2007;2:490–498. doi: 10.1038/nprot.2007.60. [DOI] [PMC free article] [PubMed] [Google Scholar]
- 80.Bernd J. Practical handbook on image processing for scientific and technical applications. 2. CRC Press; Boca Raton, FL: 2004. [Google Scholar]
- 81.Duus JO, Meldal M, Winkler JR. Fluorescence energy-transfer probes of conformation in peptides: The 2-aminobenzamide/nitrotyrosine pair. Journal Of Physical Chemistry B. 1998;102:6413–6418. [Google Scholar]
- 82.Park C, Kelemen BR, Klink TA, Sweeney RY, Behlke MA, Eubanks SR, Raines RT. Fast, facile, hypersensitive assays for ribonucleolytic activity. Methods Enzymol. 2001;341:81–94. doi: 10.1016/s0076-6879(01)41146-3. [DOI] [PubMed] [Google Scholar]