

Abstract
G protein activation by Gi/Go coupling M2 muscarinic receptors, Gq coupling M3 receptors and Gs coupling β2 adrenergic receptors causes rapid reversible translocation of the G protein γ11 subunit from the plasma membrane to the Golgi complex. Co-translocation of the β1 subunit suggests that γ11 translocates as a βγ complex. Pertussis toxin ADP ribosylation of the αi subunit type or substitution of the C terminal domain of αo with the corresponding region of αs inhibits γ11 translocation demonstrating that α subunit interaction with a receptor and its activation are requirements for the translocation. The rate of γ11 translocation is sensitive to the rate of activation of the G protein α subunit. α subunit types that show high receptor activated rates of guanine nucleotide exchange in vitro support high rates of γ11 translocation compared to α subunit types that have a relatively lower rate of guanine nucleotide exchange. The results suggest that the receptor induced translocation of γ11 is controlled by the rate of cycling of the G protein through active and inactive forms. They also demonstrate that imaging of γ11 translocation can be used as a non-invasive tool to measure the relative activities of wild type or mutant receptor and α subunit types in a live cell.
Keywords: G protein activation, Golgi complex, Translocation, Plasma membrane
1. Introduction
Recently it was shown that M2 muscarinic acetylcholine receptors when stimulated with an agonist induce the rapid translocation of G protein βγ complexes from the plasma membrane of a mammalian cell to the Golgi complex [1]. The translocation is especially pronounced when the βγ complex contains the γ11 G protein subunit type. When the receptor is inactivated with an antagonist, the translocation process is reversed equally rapidly. M2 receptors belong to the class of G protein coupled receptors (GPCRs) that couple mainly to the Gi/Go types of G proteins [2,3]. Apart from the Gi/Go coupling class of receptors, GPCRs can be broadly grouped into two other classes based on the G protein types with which they predominantly interact [4–6]. One class comprises GPCRs that couple to Gq and another of GPCRs that couple to Gs. We examined here whether receptor stimulated γ11 translocation was a general response to all the major classes of receptors in mammalian cells or if it was peculiar to the Gi/Go class of receptors. The translocation of the γ11 was examined by tagging γ11 with a mutant form of the green fluorescent protein, yellow fluorescent protein, YFP (γ11-YFP) as performed before [1]. Imaging methods were used to observe the effect of agonist stimulation of the M3 muscarinic and β2 adrenergic receptor (β2AR) in live Chinese hamster ovary cells (CHO). αq, β1 and γ11-YFP were coexpressed in cells expressing M3 and αs, β1 and γ11-YFP in cells expressing β2AR. We found that both receptors induced translocation of γ11 indicating that the translocation was common to all the major GPCR classes.
The molecular basis of the translocation of the βγ11 complex in response to receptor stimulation is not known. Since it is known that G proteins that constitute α, β and γ subunits are activated by receptors only as heterotrimers [7–9], we examined whether activation of the α subunit is a requirement for initiating γ11 translocation. A chimeric α subunit that hindered G protein interaction with a receptor reduced the extent of translocation of γ11. ADP ribosylation of the α subunit C terminal tail with pertussis toxin (PTX) also prevented translocation of γ11-YFP. These results demonstrated that translocation of the G protein γ11 subunit required the activation of the α subunit by the receptor. Furthermore, the receptor activation properties of α subunit types had an impact on the rate of γ11-YFP translocation. When γ11-YFP translocation was examined in cells coexpressing different α subunit types, there was a direct correlation between the rate of γ11-YFP translocation and the in vitro receptor stimulated guanine nucleotide exchange rate of the α subunit type coexpressed in the cell. These results implied that the rate of βγ11 complex translocation is directly affected by the relative rate at which an α subunit controls cycling of the G protein through its activated and deactivated states.
2. Materials and methods
2.1. Chemicals and expression constructs
All chemicals were purchased from Sigma-Aldrich (St. Louis, Missouri, U.S.A.) unless otherwise noted. PTX was from List Biologicals Labs (Campbell, California, U.S.A.). CHO cells stably expressing the M2 muscarinic receptor or M3 muscarinic receptor have been described before [10]. CHO cells stably expressing β2AR were kindly provided by S.E. Mills, Purdue University [11]. Cells were grown in CHO IIIa medium (Invitrogen, Carlsbad, California, U.S.A.) containing penicillin, streptomycin, glutamine, fungizone and supplements. The media for M2-CHO and M3-CHO cells was supplemented with methotrexate and dialyzed fetal bovine serum. The media for β2-AR-CHO cells was supplemented with G418 and fetal bovine serum. Sera were from Atlanta Biologicals (Lawrenceville, Georgia, U.S.A.). Penicillin, streptomycin, fungizone and glutamine were from the Tissue Culture Support Centre at Washington University (St Louis, Missouri, U.S.A.).
Constructs containing cDNAs encoding αo-CFP (cyan fluorescent protein), αo, αo-CFP, β1, β1-YFP, γ11-YFP and γ11-CFP in pcDNA3.1 vector (Invitrogen) have been described before [1,12]. The galactosyl transferase (gal-T) expressing construct has been described before [1]. αq, αs and the PTX resistant α subunits, αi1R (C351I), αoR (C351I), αi2R (C352I) were acquired from the cDNA Resource Center at University of Missouri (www.cdna.org) (Rolla, Missouri, U.S.A.). CFP and YFP versions were engineered to possess mutations that prevented oligomerization and YFP was also mutated to Citrine which is less susceptible to bleaching [1,12,13]. The PTX resistant mutant, αoR-CFP, was engineered from αo-CFP by replacement of the cysteine at position 351 with isoleucine. αi1R-CFP was constructed from the αi1R cDNA by introducing KpnI and SpeI sites as linkers to insert the cDNA of CFP between residues 91 and 92 of αi1R. αo-sR-CFP was constructed by replacing the nucleotide sequence of the last 11 residues of αo-CFP with the corresponding sequence of αs (IANNLRGCGLY replaced with IQRMHLRQYELL). The nucleotide sequences of constructs carrying αoR-CFP, αi1R-CFP and αo-s-CFP were determined to ensure integrity. αo and β1 cDNAs were expressed using pDEST12.2 (Invitrogen) and all other cDNAs were expressed using pcDNA3.1 (Invitrogen). In both types of expression constructs the cDNAs were under the control of the CMV promoter.
2.2. Imaging
Cells were cultured on glass coverslips and transiently transfected using Lipofectamine 2000 (Invitrogen) with appropriate combinations of different G-protein subunits as described in the text and figure legends. The coverslips were washed with Hank's balanced salt solution (HBSS) and mounted on an RC-30 imaging chamber with an internal volume of 25 μl (Warner Instruments, Hamden, Connecticut, U.S.A.). HBSS with or without agonist/antagonist was delivered to the chamber at a rate of 0.5 ml/min using a programmable automated fluid delivery system (Automate Scientific, San Francisco, California, U.S.A.). The cells were visualized with a 63× oil immersion objective (1.4 N.A.) using a Nikon Eclipse TE2000-U epifluorescence microscope (Melville, New York, U.S.A.). Fields were illuminated with Exfo X-Cite 120 light source (Vanier, Quebec, Canada) containing a halogen lamp with a neutral density filter (12.5% transmittance). Images were recorded at 0.6 s exposures with 4 binning using a Hamamatsu CCD Orca-ER camera (12 bit) (Hamamatsu Photonics K.K., Hamamatsu City, Japan). The shutter, emission and excitation filter wheels were selected with a Sutter Lambda 10-2 Optical Filter Changer (Sutter Instrument Company, Novato, California, U.S.A.) which was controlled by MetaMorph software (Molecular Devices Corporation, Downingtown, Pennsylvania, U.S.A.). Filters were of image registration quality: CFP fluorescence was selected with D436/10 excitation and D465/30 emission filters; YFP fluorescence was selected with D492/18 excitation and D535/30 emission filters. Filters and the polychroic beam splitter (#86006BS) were from Chroma (Rockingham, Vermont, U.S.A.). Cells selected for imaging exhibited similar expression levels of γ11-YFP and when expressed, of α-CFP. Plasma membrane or Golgi regions were selected using MetaMorph utilities [1,12]. The gray scale intensity of γ11-YFP emission in the plasma membrane or Golgi was calculated by averaging the intensities of each pixel in the region of interest and then subtracting the background average intensity outside the cell in the adjacent imaging field.
2.3. Percent γ11-YFP decrease in the plasma membrane
YFP emission from outside the focal plane and that due to scatter from the signal on the plasma membrane as well as Golgi contribute to the background. To improve the signal to noise ratio in Figs. 8–10, the internal background inside the cell was subtracted from the average gray scale intensity of γ11-YFP emission in the plasma membrane. The internal background was determined by identifying the pixel with lowest intensity inside the cell at the image recorded before the addition of the agonist. The percentage of γ11-YFP decrease in the plasma membrane was expressed as the change in YFP emission intensity at each time point relative to that before the addition of the agonist.
Fig. 8.
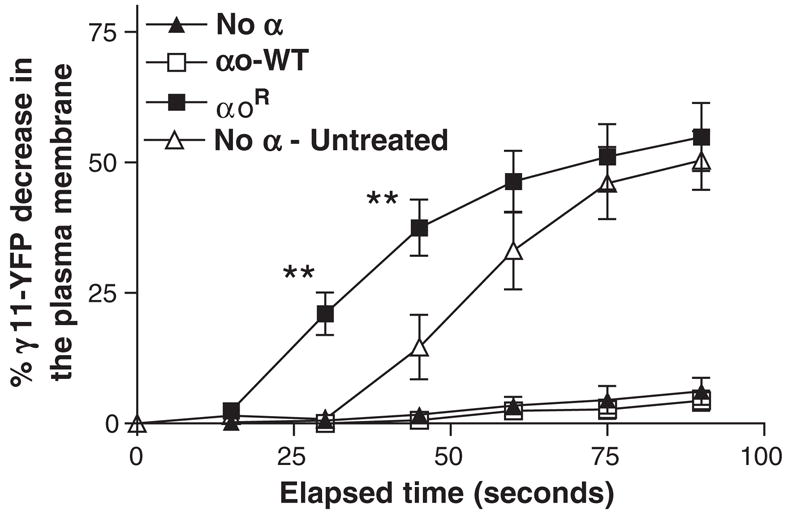
Activation of the G protein α subunit is an absolute requirement for translocation of γ11-YFP. M2-CHO cells coexpressing β1 and γ11-YFP without introduced α subunit (No α), with αo wild type (αo-WT) or PTX resistant αo mutant (αoR) were observed after PTX treatment as described above. Cells without an introduced α subunit were also observed in the absence of PTX treatment as a control (No α — untreated). Agonist introduction was initiated after image acquisition at time zero. The plasma membrane region was selected in the single cell images and the average YFP emission intensity determined using MetaMorph. Percentage decrease in γ11-YFP in the plasma membrane was determined by comparing images before and after agonist addition. Details of image processing and computation of percent decrease in YFP emission intensity on the plasma membrane are in the Methods section. Data in plots correspond to means±SEM of at least four experiments. Differences are significant at time points indicated, **p<0.005.
Fig. 10.

G protein αo and αi subtypes have different abilities to promote γ11-YFP translocation. (A) M2-CHO cells coexpressing β1, γ11-YFP and one of the PTX resistant α subunit types, αoR, αi1R or αi2R subunits were treated with PTX as described earlier. The same cells without any introduced α subunit were imaged as control (No α) after treatment with PTX. Agonist introduction was initiated after the image acquisition at time zero. Significant differences between the translocation responses of cells expressing αoR and αi1R are denoted by asterisks at time points on the plot specific to αo expressing cells. Similarly, asterisks at time points on the plot specific to αi1 expressing cells indicate significant difference in translocation responses between αi1 and αi2 expressing cells. (B) M2-CHO cells coexpressing β1, γ11-YFP and CFP-tagged αoR (αoR-CFP) or αi1R (αi1R-CFP) were PTX treated and observed after agonist introduction as described before. The images were processed and the YFP emission decrease was computed as described in Methods. Cells that had similar CFP emission intensities from both αoR-CFP and αi1R-CFP expressing cells were analyzed to ensure that expression of the two different α subtypes were the same. Significant differences in percent YFP decrease between cells expressing αoR-CFP and αi1R-CFP are indicated at time points. Details of image processing and computation of percent decrease in YFP emission intensity on the plasma membrane are in the Methods section. Data in plots correspond to averages and SEM of at least four experiments (*p<0.05, **p<0.005).
3. Results and discussion
3.1. Gα subunits other than αo support γ11 translocation
Previously it has been shown that when M2 muscarinic receptors are stimulated with an agonist, M2 activation of the αoβ1γ11 complex leads to the translocation of γ11 rapidly from the plasma membrane to the Golgi complex [1]. We repeated these experiments here. CHO cells stably expressing M2 receptors (M2-CHO) were transfected with αo, β1 and γ11-YFP. The cells on a coverslip were mounted on the imaging chamber. Images of the cells were captured sequentially before introduction of the agonist, after its introduction and then subsequently after the introduction of the antagonist, as described in the Methods section. The intensities of the fluorescent signals from the plasma membrane and the Golgi complex of these images were determined as described and plotted. Comparison of the images and the derived plots showed that the fluorescent signal on the plasma membrane decreased rapidly in response to the agonist with a corresponding increase in an internal organelle previously identified as the Golgi complex (Fig. 1A and B). Consequent to antagonist addition the fluorescence intensity decreased with equal rapidity in the Golgi and increased in the plasma membrane. These results confirmed that γ11-YFP translocates out of the plasma membrane after M2 receptor stimulation and translocates back to the plasma membrane after receptor inactivation with an antagonist.
Fig. 1.

M2 receptor activation of Go induces γ11-YFP translocation. (A) Gray scale fluorescence emission images of M2-CHO cells expressing αo-WT, β1 and γ11-YFP which were imaged as described in the Methods section. Images shown correspond from top to bottom with frames 5, 11 and 21 of a representative experiment. Frame 5 corresponds to an image before agonist addition, frame 11 to an image in the presence of agonist and frame 21 in the presence of antagonist following agonist addition. Arrows in images highlight regions on the plasma membrane and the Golgi emitting the YFP signal that show distinct changes after receptor activation or inactivation. (B) Average YFP emission intensity from selected plasma membrane and Golgi regions of single cell images at various time points were determined and plotted. Images were captured every 20 s and the time points at which agonist (100 μM carbachol) or antagonist (1 mM atropine) were introduced are indicated by the arrows. Agonist is denoted Ag and antagonist as Ant. The delay in stimulation is caused by dead volume in the fluid delivery system which was determined to be ~15–30 s using a fluorescent rhodamine tracer. Average gray scale intensities of YFP emission were calculated using MetaMorph. Details are described in the Methods section. Representative of at least four experiments.
Although the M2 muscarinic receptors are capable of activating G proteins containing αo or αi subunit types, the three members of the αi subunit sub-family are quite distinct from αo and share only ~70% homology by identity with αo [6,14–16]. To test whether αi proteins support translocation of γ11-YFP similar to the αo subunit, we examined γ11 translocation in the presence of one of the αi subunit types, αi1. M2-CHO cells were transfected with expression vectors expressing a PTX resistant mutant of αi1R (C351I) [17], β1 and γ11-YFP. The cells were treated with PTX to ADP ribosylate and inactivate endogenous αi subunits. The αo subunit type is also sensitive to PTX but is not expressed in CHO cells [12]. The transfected cells were examined in the imaging system as described earlier. Cells were exposed to the agonist first and subsequently to the antagonist. The resultant images were captured over time (Fig. 2A). γ11-YFP was localized to the plasma membrane before exposure to the agonist. After agonist stimulation γ11-YFP translocated rapidly from the plasma membrane to the Golgi complex (Fig. 2A and B). When the M2 receptor was inactivated with the antagonist, atropine, γ11-YFP translocated back to the plasma membrane from the Golgi complex (Fig. 2A and B). When control M2-CHO cells expressing β1 and γ11-YFP were exposed to PTX without the introduction of an α subunit or with coexpression of αo wild type, they did not show any γ11-YFP translocation in the presence of the agonist (below, Fig. 8). These results showed that the αi1 subtype mediates translocation of γ11-YFP and thus the βγ complex in a manner similar to αo [1].
Fig. 2.

M2 induced αi1 activation leads to γ11-YFP translocation. (A) Images and (B) plots of average YFP emission intensity values from selected plasma membrane and Golgi regions of single cell images. M2-CHO cells expressed αi1R, β1 and γ11-YFP. Transfected cells were treated with 200 μg PTX/ml for 3–5 h to block endogenous G protein αi and imaged as described in Methods and Fig. 1 legend. Arrows in images highlight regions on the plasma membrane and the Golgi emitting the YFP signal that show distinct changes after receptor activation or inactivation. Images were captured every 15 s and the time points at which agonist (1 mM acetylcholine) and antagonist (100 μM atropine) were introduced are indicated by arrows. Representative of at least four experiments.
3.2. Gq coupled and Gs coupled receptors induce γ11 translocation
M2 receptors effectively couple only with the Gi and Go G protein types [2,3]. To examine whether receptors that predominantly couple to Gq can induce translocation of γ11 when activated, we examined the M3 muscarinic receptor effect on translocation of the γ11-YFP. M3 receptors are known to predominantly activate Gq [18]. To examine directly whether the αq subunit can support translocation of γ11, we coexpressed αq, β1 and γ11-YFP in CHO cells stably expressing M3 receptors. The cells were treated with PTX to inhibit endogenous αi subunits thus preventing any likelihood of promiscuous coupling of the endogenous αi to the M3 receptors. The transfected cells were examined in the imaging system as described in the Methods section. When the cells were exposed to acetylcholine, the agonist for M3 receptors, the γ11-YFP rapidly translocated away from the plasma membrane to the Golgi complex (Fig. 3A and B). Exposure to the antagonist leads to the reverse translocation of the γ11-YFP. These results showed that the translocation of γ11 is not specific to Gi/Go coupled receptors. Previously CHO cells expressing M3 were shown to be capable of inducing translocation of γ11 on activation of a chimeric αo subunit with its last 12 residues substituted with the corresponding residues of αq [1]. The results here demonstrate that wild type αq can couple to M3 and effectively induce translocation of γ11.
Fig. 3.

M3 induced αq activation leads to γ11-YFP translocation. (A) Images and (B) plots of average YFP intensity values from selected plasma membrane and Golgi regions of single cell images. M3-CHO cells expressing αq, β1 and γ11-YFP. Transfected cells were treated with PTX and imaged as described in Fig. 2 legend and the Methods section. Arrows in images highlight the regions on the plasma membrane and the Golgi emitting the YFP signal that show distinct changes after receptor activation or inactivation. After antagonist treatment the cell has undergone a change in shape which occurs occasionally with these cells during the course of an experiment. On the plots, the time of introduction of agonist (1 mM acetylcholine) and antagonist (100 μM atropine) are indicated by arrows. Representative of at least four experiments.
We further examined whether β2 adrenergic receptors (β2AR) that are mainly coupled to Gs [19] would similarly induce γ11 translocation on activation. CHO cells stably transfected with β2 adrenergic receptors were transfected with αs, β1 and γ11-YFP. Translocation of γ11-YFP was examined as above using the same methods. Since it is known that β2AR is capable of activating Gi [19], the cells were treated with PTX as above. β2AR was activated with the agonist iso-proterenol and inactivated with the antagonist, alprenolol. Activation of the β2AR induced translocation of γ11-YFP. Inactivation resulted in the reverse translocation of the protein (Fig. 4). The translocation of γ11-YFP induced by β2AR activation indicated that γ11 translocation is common to all three classes of GPCRs.
Fig. 4.

β2AR induced αs activation leads to γ11-YFP translocation. (A) Images and (B) plots of average YFP intensity values from selected plasma membrane and Golgi regions of single cell images. β2AR-CHO cells expressing αs, β1 and γ11-YFP. Transfected cells were treated with PTX and imaged as described earlier. Arrows in images highlight regions on the plasma membrane and the Golgi emitting the YFP signal that show distinct changes after receptor activation or inactivation. On the plots, the time of introduction of agonist (1 μM isoproterenol) and antagonist (100 μM alprenolol) are indicated by arrows. Representative of at least four experiments.
We further examined whether endogenous Gq and Gs coupled receptors induce translocation of the βγ11 complex. Activation of three different Gq coupled receptors for ATP, lysophosphatidic acid (LPA) and bradykinin simultaneously in M2-CHO cells, resulted in a weak but detectable response (Supplementary Fig. 1). Three different receptors were activated together to enhance the possibility of detecting the translocation since endogenous receptors are in general expressed at very low levels. A similar experiment with two Gs coupled receptors for prostaglandin E2 and calcitonin did not yield a detectable change in βγ11 localization. Although these receptors have been previously reported to be present in these cells [20], this result may be due to the low expression of these receptors or their absence in the strain of CHO cells used.
3.3. The G protein β subunit co-translocates suggesting that γ11 translocates as a βγ complex
Previous results have shown that β1 co-translocates with γ11 when the M2 receptor activates Go [1]. We examined whether the translocation of γ11 seen on activation of Gi1 by the M2 receptor and Gq by the M3 receptor are also accompanied by the co-translocation of the β1 subunit. YFP was fused to the N terminus of the β1 subunit and CFP to the N terminus of the γ11 subunit. M2-CHO cells were transfected with αi1, β1-YFP, γ11-CFP and experiments were performed as above to examine the translocation of β1-YFP and γ11-CFP. Fig. 5 shows that the β1 subunit co-translocates from the plasma membrane to the Golgi complex with the γ11 subunit on agonist stimulation of the M2 receptor. When the receptor is inactivated, the β1 subunit translocates back to the plasma membrane. Identical results were obtained when M3-CHO cells expressing αq, β1-YFP and γ11-CFP were similarly examined (Fig. 6). Together these results suggest that the γ11 subunit translocates as a β1γ11complex. The more rapid decrease in the β1-YFP emission is not due to its more rapid translocation compared to γ11 but the higher sensitivity of YFP compared to CFP to bleaching. In these particular experiments the YFP is especially prone to bleaching because apart from direct excitation (YY) it is exposed to cross-excitation by the CFP excitation wavelengths. In addition, in the experiments in Figs. 5 and 6 there was exposure to fourfold more light (12.5% ND filter) compared for instance to Fig. 1B (3% ND filter).
Fig. 5.

M2 induced αi1 activation leads to γ11-CFP and β1-YFP translocation. Plots of average CFP (A and B) and YFP (C and D) intensity values from selected plasma membrane (A and C) and Golgi regions (B and D) of single cell images. M2-CHO cells expressed αi1R, β1-YFP and γ11-CFP. Transfected cells were treated with PTX and imaged as described in Methods and previous legends. CFP and YFP images were captured every 15 s and the time points at which agonist (1 mM acetylcholine) and antagonist (100 μM atropine) were introduced are indicated by arrows. Representative of two experiments.
Fig. 6.

M3 induced αq activation leads to γ11-CFP and β1-YFP translocation. Plots of average CFP (A and B) and YFP (C and D) intensity values from selected plasma membrane (A and C) and Golgi regions (B and D) of single cell images. M2-CHO cells expressed αq, β1-YFP and γ11-CFP. Transfected cells were treated with PTX and imaged as described in Methods and previous legends. CFP and YFP images were captured every 15 s and the time points at which agonist (1 mM acetylcholine) and antagonist (100 μM atropine) were introduced are indicated by arrows. Representative of two experiments.
Previously we showed that the βγ11 complex translocates to the Golgi complex on activation of Go by using a marker specific to the Golgi and demonstrating co-localization [1]. To confirm that the translocation of the βγ11 complex from Gq and Gs is also to the Golgi complex, we examined co-localization with a galatosyl transferase marker. The results show that Gq coupled and Gs coupled receptors also induce translocation of the βγ11 complex to the Golgi (Fig. 7 and Supplementary Fig. 2 in colour).
Fig. 7.

Colocalization of γ11 and a Golgi marker. (A) Images of M3-CHO cells expressing αq, β1, γ11-CFP, galT-YFP (a trans-Golgi marker) and treated with PTX were captured before the introduction of acetylcholine, after the introduction of acetylcholine and after subsequent inactivation with the antagonist, atropine. (B) Images of β2AR-CHO cells expressing αs, β1, γ11-CFP, galT-YFP and treated with PTX were captured before the introduction of isoproterenol, after the introduction of isoproterenol and after subsequent inactivation with the antagonist alprenolol. Images generated as in A. Representative of at least three experiments. Colourized versions of the same figures are in Supplementary material Fig. 2.
3.4. G protein α subunit activation is required for translocation of γ11
It is well established that G protein activation by a receptor requires the presence of both the α and βγ subunits in a heterotrimeric complex [7–9]. Since the molecular mechanisms at the basis of receptor induced G protein βγ complex translocation are unknown, we examined whether the translocation event required the activation of the α subunit. M2-CHO cells expressing β1 and γ11-YFP were treated with PTX first and then stimulated with agonist. Images were analyzed as above to examine γ11 translocation. PTX treated cells were compared to the same cells that were not treated with PTX. Fig. 8 shows plots of the decrease in the γ11-YFP on the plasma membrane in the PTX treated and untreated cells after agonist treatment (“no α” and “no α untreated”). The result showed that PTX treatment abrogated the translocation response which occurs in the absence of PTX treatment. This result showed that activation of the αi subunit endogenous to CHO cells is required for the receptor induced translocation of γ11-YFP. Since experiments presented earlier were performed with introduced α subunits, we then tested whether an introduced αo subunit could support the translocation of γ11. M2-CHO cells transfected with αo wild type, β1 and γ11-YFP were treated with PTX and translocation examined. Fig. 8 shows that ADP ribosylation of αo eliminates translocation of γ11-YFP in these cells. When a mutant αo subunit that was resistant to PTX ADP ribosylation was introduced into the cells and examined as above in the presence of β1 and γ11-YFP, a strong 11 translocation response was detected. These results showed that the activation of the α subunit is a requirement for γ11 translocation. Furthermore, the rate of translocation observed in cells expressing αo was significantly higher than that seen with the untransfected cells containing endogenous αi (Fig. 8). This result indicated that the rate of γ11 translocation is directly related to the concentration of α subunit in the cell. This result also implied that the rate of G protein cycling through the activated and deactivated states would have an impact on the translocation process. This relationship was further examined as described later. Overall, these results provided direct evidence for the role of the receptor activation of the α subunit in the translocation of the γ11 complex.
ADP ribosylation of the α subunit leads to complete inhibition of the interaction of the α subunit with a receptor [21]. Due to the consequent inability of a receptor to activate the G protein, translocation of the βγ complex is eliminated entirely. To examine the effect of an α subunit mutant that is potentially partially affected in its ability to interact with a receptor on γ11 translocation we constructed a chimeric αo subunit in which the last 11 residues of the αo subunit were substituted with those specific to αs. There is considerable evidence for the α subunit C terminus being involved in specifying interaction with a receptor [21–23]. The αo C terminus specifies contact with receptors that couple to the Go/Gi proteins and the αs C terminus specifies contact with the Gs coupling receptors. Thus the αo-s chimera was expected to be affected in coupling to the M2 receptor. Since regions other than the α subunit C terminus have been implicated in specifying interaction with a receptor [21,22], it was anticipated that the Go-s heterotrimer would be activated partially leading to reduced γ11 translocation but not complete abrogation of translocation unlike in the case of ADP ribosylation with PTX. We compared the translocation rate of γ11-YFP in cells that express CFP tagged αo resistant to PTX (αoR-CFP) and cells expressing CFP tagged αo-s chimera resistant to PTX (αo-sR-CFP). αoR-CFP and αo-sR-CFP expressing cells with similar gray scale levels of CFP emission intensity were compared to ensure that any differences seen in translocation of γ11 between these cells were not due to differential expression of αoR-CFP and αo-sR-CFP. Fig. 9 shows the results of examining γ11-YFP translocation in these cells after agonist addition. The rate of γ11-YFP translocation was distinctly lower in the presence of chimeric αo-sR-CFP, compared to αoR-CFP (Fig. 9A). To examine whether CFP-tagged αoR and αo-sR associated equally well with βγ11-YFP we measured the recovery of CFP (donor) emission in response to YFP (acceptor) photobleaching. The recovery occurs as a result of the abrogation of fluorescence resonance energy transfer (FRET) and is a measure of the efficiency of association between the interacting proteins that contribute the FRET signal [12]. The magnitude of recovery was similar when αoR-CFPβγ-YFP expressing cells were compared to αo-sR-CFPβγ11-YFP expressing cells (Fig. 9B). These results further indicated that effective interaction of the α subunit with a receptor and its activation by the receptor are a requirement for the γ11 to translocate.
Fig. 9.

Effective interaction of the α subunit with a receptor is essential for γ11-YFP translocation. (A) M2-CHO cells coexpressing β1, γ11-YFP without introduced α subunit (No α), with CFP tagged PTX resistant αo (αoR-CFP) or PTX resistant αo-s chimera (αo-sR-CFP) were treated with PTX and imaged as above. The percentage of γ11-YFP decrease in the plasma membrane was calculated as described earlier. Data in plots correspond to averages±SEM of at least four experiments. Differences between αoR-CFP and αo-sR-CFP are significant at time points indicated (*p<0.05, **p<0.005). (B) M2-CHO cells coexpressing β1, γ11-YFP and αoR-CFP or αo-sR-CFP were photobleached for 2 min with illumination selective for YFP in the absence of a neutral density filter. Recovery of CFP emission intensity was compared before and after the bleaching treatment [12]. Cells were maintained in HBSS. Mean±SEM of results from 14 cells.
3.5. The effect of different α subunit types on the rate of γ11 translocation
A variety of in vitro experiments have indicated that G protein activation by a receptor requires that the α and βγ subunits are bound and presented to the receptor as a heterotrimer [7–9,24]. These experiments suggest that α subunit types with intrinsically different guanine nucleotide exchange rates regulate the rate at which a G protein cycles through receptor dissociation on activation and association on inactivation. These findings imply that dissociation of the G protein subunits on activation and reassociation on deactivation are also influenced by the type of G protein α subunit. This relationship has not been examined in vivo.
The translocation of the γ11 subunit away from the α subunit on the plasma membrane on activation indicates that the α subunit and the βγ complex dissociate in vivo. The rate of translocation of γ11 can therefore be expected to be affected by the α subunit activation rate. In vitro analysis of M2 stimulation of αo, αi1 and αi2 GTPase activity has shown that receptor stimulated GTPase rates rank in the decreasing order of αo, αi1 and αi2 [25]. Earlier results from examining M2 activation of Go and Gi2 have also shown that Go exhibits significantly higher receptor stimulated nucleotide exchange compared to Gi2 [26]. We examined the impact of different α subunit types known to have different guanine nucleotide exchange rates on the rate of translocation of γ11-YFP. αo, αi1 and αi2 were introduced independently into M2-CHO cells along with β1 and γ11-YFP. Constructs encoding PTX resistant mutant forms of the α subunit types (described in Methods section) were used here to assess the individual contributions of the α subunit types to γ11 translocation. We found γ11-YFP translocated at decreasing rates in the presence of αo, αi1 and αi2 (Fig. 10A) corresponding with their decreasing rates of nucleotide exchange in the presence of an activated receptor in vitro.
To eliminate the possibility that the differential rates of γ11 translocation are due to differential expression of the α subunit types, M2-CHO cells were transfected independently with αoR and αi1R tagged with CFP along with β1 and γ11-YFP. Cells expressing similar amounts of αoR-CFP and αi1R-CFP were selected by ensuring that the intensities of CFP emission in the two different transfectants were similar. The translocation rates of γ11-YFP from the two different transfectants (Fig. 10B) showed a similar difference as in the γ11-YFP translocation seen in cells expressing the untagged αo and αi1 (Fig. 8A).
Overall these results showed that the in vivo translocation rates of γ11 mirrored the receptor stimulated guanine nucleotide exchange rates of the α subunit types coexpressed. The translocation rate was significantly higher in the presence of αo which is known to be activated at a high rate compared to αi1 or αi2. There was a similar difference between the translocation rates detected in the presence of αi1 and αi2 (Fig. 10A). These results indicate that the translocation process is controlled by the rate of cycling of the G protein through the GTP bound activated form (when it is dissociated from the βγ complex) and the GDP bound deactivated form (when it is associated with the βγ complex).
Together these results show that the translocation of the G protein γ11 subunit types is initiated by all the major classes of GPCRs. The role that this translocation plays in signaling is therefore likely to be common to all G protein mediated pathways. The differential rate of translocation in the presence of different α subunit types also suggests that various pathways can be regulated in distinct ways by the translocation process. The ability to detect differences in α subunit activation rates at the level of γ11-YFP translocation suggests that cells expressing βγ11 tagged with a fluorescent protein can be used as a non-invasive tool to measure the relative activity of a receptor or an α subunit in a live cell. Such a tool would be useful in characterizing the in vivo activities of subtypes as well as mutants of receptors and G protein subunits with less effort and time compared to traditional methods that involve cell destruction. Additionally, since the experiments would be performed within intact cells, the properties of the subtypes of proteins examined are likely to be reflective of their native counterparts. Finally, the ability to detect the rapid translocation of fluorescent protein tagged γ11 on activation of all major classes of GPCRs suggests that cells expressing the tagged γ11 subunit can be used for identifying agonist and antagonist drugs that act on a variety of GPCRs.
Supplementary Material
Appendix A. Supplementary data
Supplementary data associated with this article can be found, in the online version, at doi:10.1016/j.cellsig.2005.09.007.
Acknowledgments
Supported by National Institutes of Health grants GM69027 and American Heart Association Post Doctoral Fellowship 0225378Z (M.A.).
References
- 1.Akgoz M, Kalyanaraman V, Gautam N. J Biol Chem. 2004;279(49):51541. doi: 10.1074/jbc.M410639200. [DOI] [PubMed] [Google Scholar]
- 2.Dell'Acqua ML, Carroll RC, Peralta EG. J Biol Chem. 1993;268(8):5676. [PubMed] [Google Scholar]
- 3.Hunt TW, Carroll RC, Peralta EG. J Biol Chem. 1994;269(47):29565. [PubMed] [Google Scholar]
- 4.Neves SR, Ram PT, Iyengar R. Science. 2002;296(5573):1636. doi: 10.1126/science.1071550. [DOI] [PubMed] [Google Scholar]
- 5.Wong SK. Neurosignals. 2003;12(1):1. [Google Scholar]
- 6.Simon MI, Strathmann MP, Gautam N. Science. 1991;252(5007):802. doi: 10.1126/science.1902986. [DOI] [PubMed] [Google Scholar]
- 7.Gautam N, Downes GB, Yan K, Kisselev O. Cell Signal. 1998;10(7):447. doi: 10.1016/s0898-6568(98)00006-0. [DOI] [PubMed] [Google Scholar]
- 8.Hamm HE. J Biol Chem. 1998;273(2):669. doi: 10.1074/jbc.273.2.669. [DOI] [PubMed] [Google Scholar]
- 9.Alves ID, Ciano KA, Boguslavski V, Varga E, Salamon Z, Yamamura HI, Hruby VJ, Tollin G. J Biol Chem. 2004;279(43):44673. doi: 10.1074/jbc.M404713200. [DOI] [PubMed] [Google Scholar]
- 10.Azpiazu I, Cruzblanca H, Li P, Linder M, Zhuo M, Gautam N. J Biol Chem. 1999;274(50):35305. doi: 10.1074/jbc.274.50.35305. [DOI] [PubMed] [Google Scholar]
- 11.Liang W, Bidwell CA, Collodi PR, Mills SE. J Anim Sci. 2000;78(9):2329. doi: 10.2527/2000.7892329x. [DOI] [PubMed] [Google Scholar]
- 12.Azpiazu I, Gautam N. J Biol Chem. 2004;279(26):27709. doi: 10.1074/jbc.M403712200. [DOI] [PubMed] [Google Scholar]
- 13.Zacharias DA, Violin JD, Newton AC, Tsien RY. Science. 2002;296(5569):913. doi: 10.1126/science.1068539. [DOI] [PubMed] [Google Scholar]
- 14.Bray P, Carter A, Guo V, Puckett C, Kamholz J, Spiegel A, Nirenberg M. Proc Natl Acad Sci U S A. 1987;84(15):5115. doi: 10.1073/pnas.84.15.5115. [DOI] [PMC free article] [PubMed] [Google Scholar]
- 15.Lavu S, Clark J, Swarup R, Matsushima K, Paturu K, Moss J, Kung HF. Biochem Biophys Res Commun. 1988;150(2):811. doi: 10.1016/0006-291x(88)90463-9. [DOI] [PubMed] [Google Scholar]
- 16.Downes GB, Gautam N. Genomics. 1999;62(3):544. doi: 10.1006/geno.1999.5992. [DOI] [PubMed] [Google Scholar]
- 17.Taussig R, Sanchez S, Rifo M, Gilman AG, Belardetti F. Neuron. 1992;8(4):799. doi: 10.1016/0896-6273(92)90100-r. [DOI] [PubMed] [Google Scholar]
- 18.Kostenis E, Zeng FY, Wess J. Life Sci. 1999;64(6–7):355. doi: 10.1016/s0024-3205(98)00574-8. [DOI] [PubMed] [Google Scholar]
- 19.Lefkowitz RJ, Rockman HA, Koch WJ. Circulation. 2000;101(14):1634. doi: 10.1161/01.cir.101.14.1634. [DOI] [PubMed] [Google Scholar]
- 20.George SE, Bungay PJ, Naylor LH. J Neurochem. 1997;69(3):1278. doi: 10.1046/j.1471-4159.1997.69031278.x. [DOI] [PubMed] [Google Scholar]
- 21.Gudermann T, Schoneberg T, Schultz G. Annu Rev Neurosci. 1997;20:399. doi: 10.1146/annurev.neuro.20.1.399. [DOI] [PubMed] [Google Scholar]
- 22.Cabrera-Vera TM, Vanhauwe J, Thomas TO, Medkova M, Preininger A, Mazzoni MR, Hamm HE. Endocr Rev. 2003;24(6):765. doi: 10.1210/er.2000-0026. [DOI] [PubMed] [Google Scholar]
- 23.Bourne HR. Curr Opin Cell Biol. 1997;9(2):134. doi: 10.1016/s0955-0674(97)80054-3. [DOI] [PubMed] [Google Scholar]
- 24.Alves ID, Salamon Z, Varga E, Yamamura HI, Tollin G, Hruby VJ. J Biol Chem. 2003;278(49):48890. doi: 10.1074/jbc.M306866200. [DOI] [PubMed] [Google Scholar]
- 25.Hooks SB, Waldo GL, Corbitt J, Bodor ET, Krumins AM, Harden TK. J Biol Chem. 2003;278(12):10087. doi: 10.1074/jbc.M211382200. [DOI] [PubMed] [Google Scholar]
- 26.Parker EM, Kameyama K, Higashijima T, Ross EM. J Biol Chem. 1991;266(1):519. [PubMed] [Google Scholar]
Associated Data
This section collects any data citations, data availability statements, or supplementary materials included in this article.
Supplementary Materials
Appendix A. Supplementary data
Supplementary data associated with this article can be found, in the online version, at doi:10.1016/j.cellsig.2005.09.007.