

Abstract
Background
The estrogen receptors α and β (ESR1, ESR2) have been implicated in adiposity, lipid metabolism and feeding behaviour. In this report we analyse ESR1 and ESR2 gene single nucleotide polymorphisms (SNPs) for association with obesity. We also relate adipose tissue ESR1 mRNA levels and ESR1 SNPs to adipocyte lipolysis and lipogenesis phenotypes.
Methods
23 ESR1 and 11 ESR2 tag-SNPs, covering most of the common haplotype variation in each gene according to HAPMAP data, were analysed by Chi2 for association with obesity in a cohort comprising 705 adults with severe obesity and 402 lean individuals. Results were replicated in a cohort comprising 837 obese and 613 lean subjects. About 80% of both cohorts comprised women and 20% men. Adipose tissue ESR1 mRNA was quantified in 122 women and related to lipolysis and lipogenesis by multiple regression. ESR1 SNPs were analysed for association with adipocyte lipolysis and lipogenesis phenotypes in 204 obese women by simple regression.
Results
No ESR1 SNP was associated with obesity. Five ESR2 SNPs displayed nominal significant allelic association with obesity in women and one in men. The two ESR2 SNPs associated with obesity with nominal P value < 0.01 were genotyped in a second cohort where no association with obesity was observed. There was an inverse correlation between ESR1 mRNA levels in abdominal subcutaneous (sc) adipose tissue and basal lipolysis, as well as responsiveness to adrenoceptor agonists independent of age and BMI (P value 0.009–0.045). ESR1 rs532010 was associated with lipolytic sensitivity to noradrenaline (nominal P value 0.012), and ESR1 rs1884051 with responsiveness to the non-selective beta-adrenoceptor agonist isoprenaline (nominal P value 0.05). These associations became non-significant after Bonferroni correction.
Conclusion
ESR1 gene alleles are unlikely to be a major cause of obesity in women. A minor importance of ESR2 on severe obesity cannot be excluded. The inverse correlation between ESR1 mRNA levels and lipolytic responsiveness to adrenoceptor agonists implies that low adipose tissue ESR1 levels attenuate catecholamine resistance in sc fat cells of obese women hereby contributing to loss of sc and gain of visceral fat. There is no evidence for a genetic impact of ESR1 on lipolysis or lipogenesis.
Background
The prevalence of obesity has reached epidemic proportions and is of great public health concern. Its metabolic complications, such as dyslipidemia and type 2 diabetes (T2D), represent a significant cost for the society. Though obesity is often triggered by life style, the importance of genetic predisposition has been clearly demonstrated [1]. Defining gene alleles that are associated with obesity will contribute to our understanding of the underlying mechanisms behind its development and potentially provide therapeutic targets.
Estrogen signalling is implicated in both central, that is regulation of food intake, and peripheral pathways protecting against adiposity. Low estrogen levels following menopause are associated with loss of subcutaneous (sc) and gain of visceral fat [2]. Estrogens signal via the transcription factors estrogen receptors α and β (ESR1, ESR2) [3]. Silencing of the ESR1 gene in mice renders an obese phenotype [4]. Both ESR1 and ESR2 are expressed in the hypothalamus, a brain area known to be involved in the regulation of appetite and satiety [5], whilst adipocytes express mainly ESR1 [6]. In the brain, ESR2 has been implicated in mediating the effects of estrogen on food intake [7]. As for peripheral effects of estrogens, hormone replacement therapy (HRT) has been shown to inhibit Epinephrine-stimulated lipolysis in human sc adipose tissue [8]. Estrogen, signalling through ESR1, lowers the lipolytic response in sc fat by increasing the number of antilipolytic α2-adrenoceptors [9].
Human genetic studies support a role for the ESR genes in regulation of body weight and certain aspects of the metabolic syndrome. Body mass index (BMI) (LOD 4.6, 4.2 and 2.8), waist circumference (LOD 3.3) and high-density lipoprotein (HDL) cholesterol levels have been linked to the chromosomal region harbouring ESR1 [10-13]. Among four investigated ESR1 polymorphisms, rs2234693 and rs9340799 were associated with waist circumference and rs1801132 with BMI in men, but not women [14]. In another study, ESR1 rs9340799, but not rs2234693, was associated with waist and BMI in Japanese women but not men [15]. Furthermore, neither rs2234693 nor rs9340799 was associated with obesity in Swedish women [16]. More recently, among 17 investigated ESR1 polymorphisms, rs6902771, rs2431260 and rs2175898 were associated with BMI in African Americans [17]. Among these same 17 ESR1 polymorphisms, rs1709183 and rs2431260 were associated with T2D in European Americans and rs1033182 in African Americans [18]. ESR2 has primarily been investigated in eating disorders. ESR2 rs928554 and rs4986938, but not rs1256049, have been associated with bulimic behavior [19] and rs1256049, but not rs4986938, with anorexia nervosa [20]. Rosenkrantz et al screened the coding region of ESR2 in probands of different weight extremes, but identified no mutations associated with the studied phenotypes [21].
We have recently reported that ESR1 mRNA expression levels in sc adipose tissue and isolated adipocytes from premenopausal women are inversely correlated with BMI [16]. However, whether ESR1 protects against obesity or is upregulated as a result of low BMI remains to be established. In this report we analyse polymorphisms covering most of the common haplotype variation in the ESR1 and ESR2 genes for association with obesity in two large cohorts of Swedish Caucasians. We also investigate if ESR1 is important for lipid turnover in human adiposity by analysing mRNA levels and gene polymorphisms for association with adipose tissue lipolysis and lipogenesis phenotypes in a third cohort of women., Table 1. To our knowledge, this represents the first extensive analysis of the impact of variations in the ESR1 and ESR2 genes for the development of obesity.
Table 1.
Sample phenotypic distributions
| Name Phenotype | Sample 1 Obesity | Sample 2 Obesity replication | Sample 3a Fat cells | ||
| Obese | Women (N = 581) | Men (N = 124) | Women (N = 689) | Men (N = 148) | Women (N = 216) |
| Age (years) | 41 ± 12 | 45 ± 13 | 43 ± 11 | 45 ± 12 | 38 ± 10 |
| BMI (kg/m2) | 43 ± 5 | 45 ± 5 | 37 ± 5 | 45 ± 5 | 38 ± 5 |
| HOMAIR | 5.3 ± 5.7 | 10.5 ± 16.5 | 4.5 ± 5.7 | 8.2 ± 5.5 | 3.8 ± 2.8 |
| Pl-cholesterol (mmol/l) | 5.2 ± 1. | 5.2 ± 1.2 | 5.3 ± 1.1 | 5.2 ± 1.1 | 5.2 ± 1.1 |
| Pl-HDL cholesterol (mmol/l) | 1.2 ± 0.3 | 1.0 ± 0.2 | 1.3 ± 0.3 | 1.1 ± 0.3 | 1.2 ± 0.3 |
| Pl-triglycerides (mmol/l) | 1.7 ± 0.9 | 2.3 ± 2.3 | 1.7 ± 1.0 | 2.0 ± 1.2 | 1.6 ± 1.0 |
| Lean | Women (N = 338) | Men (N = 64) | Women (N = 525) | Men (N = 88) | Women (N = 12) |
| Age (years) | 50 ± 4 | 57 ± 8 | 39 ± 6 | 36 ± 11 | 33 ± 8 |
| BMI (kg/m2) | 22 ± 2 | 23 ± 2 | 22 ± 3 | 23 ± 1 | 22 ± 2 |
| HOMAIR | 1.3 ± 0.7 | 1.6 ± 0.8 | 1.3 ± 1.0 | 1.4 ± 0.7 | 1.4 ± 0.9 |
| Pl-cholesterol (mmol/l) | 5.4 ± 1.0 | 5.7 ± 1.1 | 4.7 ± 0.8 | 4.9 ± 1.1 | 4.8 ± 0.7 |
| Pl-HDL cholesterol (mmol/l) | 1.7 ± 0.4 | 1.4 ± 0.4 | 1.6 ± 0.4 | 1.3 ± 0.5 | 1.6 ± 0.4 |
| Pl-triglycerides (mmol/l) | 0.9 ± 0.5 | 1.5 ± 1.0 | 0.9 ± 0.5 | 1.3 ± 1.4 | 0.8 ± 0.2 |
Values are mean ± SD
a) 99 subjects overlap between sample 1 and 3.
Methods
Subjects and clinical evaluation
Samples 1 and 2 were recruited for the purpose of studying genes underlying susceptibility to obesity, Table 1. In sample 1, the lean subjects were subjects > 45 years old and had never reached BMI > 25 kg/m2 whereas the obese subjects had BMI > 30 kg/m2 at < 20 years of age or morbid obesity, i.e. BMI > 40 kg/m2. These recruitment criteria resulted in more young obese than lean subjects, Table 1. The aim of selecting subjects with an extreme BMI phenotype in sample 1 was to enrich for a genetic impact on obesity [22]. This was also the purpose of recruiting young obese adults, since early onset of this disorder is believed to have a stronger genetic component due to reduced time of environmental impact [22]. The size of sample 1 provided 90% power to detect an allele with a frequency of 20% among controls and odds ratio (OR) ≥ 1.5 to develop obesity assuming a threshold P value of 0.05 and dominant impact on obesity [23]. 59 subjects in sample 1 were diagnosed with T2D according to self report, but otherwise the subjects were healthy and free of medication according to self-report. 381 subjects in sampe 1 were also included in our previously reported analysis of two ESR1 SNPs in obesity [16].
Sample 2 had less stringent inclusion criteria for obesity and leanness in comparison with sample 1. Sample 2 comprised healthy non-obese subjects > 25 years old with BMI < 25 kg/m2 and obese individuals with BMI > 30 kg/m2, Table 1. 197 of the obese subjects in sample 2 had hypertension, 116 T2D, and 50 dyslipidemia according to self report. Differences in recruitment criteria resulted in phenotypic differences between sample 1 and 2, Table 1. The ratios between men and women were similar among obese and lean in both samples (17–21%).
Sample 3 comprised obese and lean otherwise healthy women recruited with the purpose of studying fat cell function, Table 1. Lipolysis and lipogenesis were investigated in 204 obese women in sample 3. 204 subjects provide approximately 75% power to detect an allele with a frequency of 20% and R2 0.04 assuming a threshold P value of 0.05 and dominant impact on adipocyte phenotypes [23]. ESR1 mRNA levels in adipose tissue were quantified in the 122 women of sample 3 for which RNA was available. 99 women in sample 3 who met the criteria for obesity in sample 1 were included in both samples.
All subjects above were Caucasians and at least second generation Swedish. Obese subjects were recruited from an outpatient center for treatment of obesity or through local advertisement. All lean subjects were recruited through local advertisement. All subjects came to the laboratory in the morning after an overnight fast. A venous blood sample was obtained for extraction of genomic DNA and determination of serum insulin, as well as plasma glucose, triglycerides, total cholesterol, and HDL cholesterol as described [24,25]. Insulin resistance index HOMAIR (homeostasis model assessment) was calculated as fasting serum insulin (μU/ml) × fasting plasma glucose (mmol/l)/22.5 [26]. The ethical committee of the Karolinska University Hospital (Southern Campus) approved the study. It was explained in detail to each participant and her/his consent was obtained.
Lipolysis and lipogenesis investigation
In the morning after an overnight fast a sc fat biopsy was obtained from the abdominal area by needle biopsy [27]. One part of the adipose tissue pieces was immediately frozen in liquid nitrogen for subsequent RNA analysis. Another piece was digested with collagenase to isolate fat cells and mean fat cell weight was determined [28]. Lipolysis in isolated fat cells was investigated as described [29,30]. Briefly, cell suspensions were incubated in the absence or presence of increasing concentrations of noradrenaline, the non-selective β-adrenoceptor agonist isoprenaline, or the α2-adrenoceptor selective agonist clonidine. At the end of incubation an aliquot of the medium was removed for analysis of glycerol release, which was used as an index of lipolysis.
Lipogenesis was investigated by determining the uptake of radio labeled glucose into lipids as described [31]. Briefly, diluted suspensions of fat cells were incubated in the absence or presence of increasing concentrations of crystalline human insulin (10-15–10-6 mol/l) for 2 h at 37°C. Incubation was terminated by addition of sulphuric acid and radioactivity incorporated into lipids determined.
The concentration (log mol/l) of hormone or agonist causing half maximum effect was determined using logarithmic conversion of each concentration response curve. This value was converted to its negative form (pD2), which reflects hormone sensitivity. The maximum effect or responsiveness of hormone or agonist was determined as glycerol release or glucose incorporation into lipids at the maximum effective hormone concentration.
mRNA quantification
Total RNA was prepared from adipose tissue and reverse transcribed as described [32]. All qPCR assays were run in triplicates on an ABI 7500 machine (Applied Biosystems, Foster City, CA, USA). A direct comparative method was used for data analysis with GAPDH as control gene (User Bulletin #2, Applied Biosystems). The amplification was repeated twice to confirm results. ESR1 was amplified by Taqman whereas a SYBRGreen assay was applied for GAPDH. Primer/probe sequences were as follows: ESR1 (F: 5'-AATATGCCCTTTTGCGATG-3'; R: 5'-ACAAAGCAAAGCTGCGACAA-3'; and Taqman probe: 5'-CTATTACTGATGTGACTCGGT-3'), GAPDH (F: 5'-TGACAACTTTGGTATCGTGGAAGG-3'; R: 5'-AGGCAGGGATGATGTTCTGGAGAG-3').
SNP selection and genotyping
Genotype information for ESR1 and ESR2 and regions approximately 10 000 base pairs up- and downstream of these genes were downloaded from HAPMAP in May 2005 [33]. Genotype data for the population of individuals of European ancestry were visualized using Haploview [34]. We initially selected tag-SNPs defining all haplotypes with frequency > 5% from the block-by-block tags displayed in the HAPLOVIEW "Haplotypes" window. However, sometimes these tag-SNPs were exchanged to other SNPs on the same haplotype due to difficulties in designing genotyping assays. In addition, in regions not covered by common haplotypes we aimed to select one common SNP (allele frequency > 5%) every 5 000 base pair. No non-synonymous SNPs full-filling these criteria were detected in the ESR genes. In selecting between different SNPs we prioritized (1) Golden-gate validated assays, and (2) SNPs with high score according to Illumina, which indicate that the designed Illumina genotyping assays are highly likely to work [35]. Besides the HAPMAP SNPs we genotyped the ESR2 SNPs rs928554 and rs4986938, which previously have been associated with feeding behavior [19].
Samples 1 and 3 were genotyped using the Illumina technology at the SNP technology platform in Uppsala [36,35] except SNPs rs928554 and rs4986938 that were genotyped by RFLP as described [19]. Sample 2 was genotyped using matrix-assisted laser desorption/ionization time-of-flight (MALDI-TOF) mass spectrometry (SEQUENOM Inc., San Diego, California) as described [37]. Primers can be provided on request. The genotype call rate for all genotyping platforms was ≥ 97% and the accuracy was 99.99% according to duplicate analysis of, on average, 2% of the total genotypes. Hardy-Weinberg equilibrium (HWE) calculations were performed to ensure that each marker was within population equilibrium.
Statistical analyses
Association between ESR1 mRNA levels and lipolysis and lipogenesis measures was assessed by multiple regression with age and BMI as additional independent variables. The Finetti software [38] using Pearson's goodness-of-fit Chi2 was employed to test for allelic association between single SNPs and obesity. ANCOVA with age and BMI as covariates were used to analyze differences in insulin resistance and blood lipid phenotypes between genotypes. HOMAIR, Pl-HDL cholesterol, and Pl-triglycerides were ln-transformed before analysis to become normally distributed. For genetic analysis of adipocyte lipolysis and lipogenesis, logarithm transformed phenotypes were used as independent quantitative variables in linear regression models. Genotypes were indicated as character (nominal) with three levels, two different homozygous and heterozygous. There was no association between the adipocyte phenotypes and age or BMI in our sample and these variables were therefore not included in the regression model. Haplotypes were estimated and analyzed with Haploview [34]. LD was calculated as D'. We used HAPMAP Caucasian data to define haploblock limits. Association between haplotypes and obesity status was evaluated by Chi2. Haplotypes with frequency < 5% and individuals with > 50% missing genotypes were excluded in the analysis. We performed 10 000 permutations in Haploview to adjust P values to multiple tests.
Results
ESR genotyping results
To investigate if ESR1 and ESR2 alleles contribute to susceptibility to obesity, polymorphisms covering the common variation in these genes were genotyped in sample 1, Table 2. For ESR1, 6 out of 29 (21%) Illumina genotyping assays failed, which is higher than the expected 10% failure rate. The majority represented Golden-gate validated assays indicating, according to the supplier, that the failure is due to interference between different SNP assays under the employed multiplex conditions. LD between ESR gene SNPs is shown in Figure 1 and 2, in which haploblock limits according to Caucasian HAPMAP data have been labeled. Genotyped ESR1 SNPs built 25 haplotypes, Table 3. These SNPs unambiguously identified 67% (20/30) of the common (> 5%) haplotypes in the ESR1 region in HAPMAP, representing 75% of the common haplotype variation in ESR1 according to HAPMAP data. Remaining ten ESR1 haplotypes in HAPMAP could in our sample not be separated from another haplotype, that is they were merged into five haplotypes. For ESR2, all genotyped assays were called successfully although one SNP, rs7154455, displayed a low genotyping call rate, 83%, Table 2. Thus there was 100% coverage of the common Caucasian ESR2 haplotypes in HAPMAP, Figure 2. All SNPs were in HWE.
Table 2.
Genotyped ESR1 and ESR2 SNPs
| Marker | Gene position | Chromosome position | Alleles | Common allele (%) | Call rate (%) | Chi2 of HWE |
| ESR1 (Chromosome 6) | ||||||
| rs488133 | 5' | 152217558 | C > T | 68 | 98 | 0.45 |
| rs532010 | 5' | 152223032 | A > G | 65 | 98 | 0.95 |
| rs11155813 | intron 1 | 152241549 | T > C | 88 | 96 | 0.06 |
| rs1709182 | intron 2 | 152267471 | T > C | 66 | 96 | 0.81 |
| rs1709183 | intron 2 | 152286110 | T > C | 72 | 98 | 0.4 |
| rs9340835 | intron 2 | 152292045 | G > A | 68 | 98 | 0.06 |
| rs6557170 | intron 3 | 152295218 | G > A | 79 | 95 | 0.97 |
| rs2347867 | intron 3 | 152321964 | A > G | 68 | 98 | 0.17 |
| rs9397456 | intron 3 | 152339266 | G > A | 80 | 98 | 0.15 |
| rs12154178 | intron 3 | 152343194 | A > C | 72 | 98 | 0.59 |
| rs3020317 | intron 4 | 152370855 | T > C | 82 | 98 | 0.03 |
| rs1884051 | intron 4 | 152375393 | A > G | 71 | 98 | 0 |
| rs1884054 | intron 4 | 152383680 | A > C | 67 | 98 | 0.47 |
| rs7754762 | intron 4 | 152403651 | T > A | 87 | 97 | 1.61 |
| rs7757956 | intron 4 | 152409254 | T > A | 86 | 98 | 2.69 |
| rs9340954 | intron 4 | 152412286 | T > G | 70 | 98 | 2.89 |
| rs3020368 | intron 5 | 152463304 | C > T | 91 | 97 | 0.05 |
| rs3778082 | intron 6 | 152479778 | G > A | 86 | 95 | 1.76 |
| rs2982896 | intron 6 | 152491607 | C > T | 77 | 97 | 0.01 |
| rs3020383 | intron 7 | 152508893 | G > C | 92 | 97 | 0.28 |
| rs3778099 | intron 7 | 152510689 | T > C | 87 | 97 | 1.18 |
| rs2813544 | 3' | 152517696 | A > G | 79 | 98 | 0.88 |
| rs1543403 | 3' | 152520818 | G > C | 52 | 96 | 1.48 |
| ESR2 (Chromosome 14) | ||||||
| rs3020450 | 5' | 63838055 | C > T | 70 | 93 | 6.29a |
| rs1271572 | 5' | 63831670 | C > A | 54 | 98 | 1.03 |
| rs1887994 | intron 1 | 63830364 | C > A | 89 | 97 | 0.28 |
| rs7159462 | intron 1 | 63828629 | C > T | 92 | 97 | 0.14 |
| rs1269056 | intron 3 | 63813643 | C > T | 56 | 97 | 1.3 |
| rs7154455 | intron 3 | 63806413 | G > C | 64 | 83 | 0.23 |
| rs1256061 | intron 7 | 63773346 | G > T | 50 | 97 | 1.89 |
| rs1256063 | intron 7 | 63771970 | G > A | 91 | 94 | 0.27 |
| rs4986938 | 3' | 63769569 | G > A | 62 | 100 | 0.56 |
| rs928554 | 3' | 63763948 | A > G | 56 | 100 | 2.8 |
| rs1152582 | 3' | 63762383 | C > G | 56 | 98 | 0.71 |
a) HWE among controls n.s.
Figure 1.
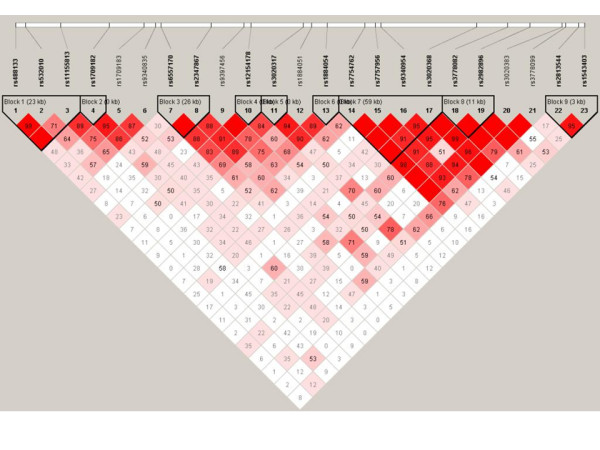
LD (D') between ESR1 SNP and haploblocks according to Caucasian HAPMAP data.
Figure 2.

LD (D') between ESR2 SNP and haploblocks according to Caucasian HAPMAP data.
Table 3.
Association of ESR1 and ESR2 haplotypes with obesity
| Cases | Controls | |||||
| Haploblock | % | Specific haplotype (n) | Other (n) | Specific haplotype (n) | Other (n) | P value |
| ESR1 | ||||||
| rs488133-rs532010-rs11155813 | ||||||
| CGT | 34 | 449 | 917 | 288 | 508 | 0.12 |
| TAT | 33 | 455 | 911 | 250 | 546 | 0.37 |
| CAT | 21 | 285 | 1081 | 167 | 629 | 0.96 |
| CAC | 11 | 158 | 1208 | 82 | 714 | 0.36 |
| rs1709182 | ||||||
| T | 67 | 925 | 441 | 516 | 282 | 0.14 |
| C | 33 | 441 | 925 | 282 | 516 | 0.14 |
| rs6557170-rs2347867 | ||||||
| GA | 68 | 916 | 450 | 549 | 249 | 0.40 |
| AG | 21 | 299 | 1067 | 165 | 633 | 0.52 |
| GG | 11 | 151 | 1215 | 84 | 714 | 0.68 |
| rs12154178 | ||||||
| A | 18 | 976 | 390 | 575 | 223 | 0.76 |
| C | 28 | 390 | 976 | 223 | 575 | 0.76 |
| rs3020317 | ||||||
| T | 82 | 1116 | 250 | 652 | 146 | 1.00 |
| C | 18 | 250 | 1116 | 146 | 652 | 1.00 |
| rs1884054 | ||||||
| A | 67 | 920 | 446 | 531 | 267 | 0.70 |
| C | 33 | 446 | 920 | 267 | 531 | 0.70 |
| rs7754762-rs7757956-rs9340954-rs3020368 | ||||||
| TTTC | 69 | 947 | 420 | 557 | 239 | 0.75 |
| ATGC | 13 | 185 | 1181 | 99 | 697 | 0.47 |
| TAGT | 8 | 113 | 1253 | 69 | 727 | 0.77 |
| TAGC | 5 | 67 | 1299 | 43 | 753 | 0.59 |
| rs3778082-rs2982896 | ||||||
| GC | 63 | 862 | 502 | 502 | 296 | 0.90 |
| GT | 23 | 310 | 1054 | 197 | 601 | 0.30 |
| AC | 14 | 192 | 1172 | 99 | 699 | 0.27 |
| rs2813544-rs1543403 | ||||||
| AC | 48 | 640 | 727 | 396 | 402 | 0.21 |
| AG | 31 | 419 | 948 | 248 | 550 | 0.82 |
| GG | 21 | 301 | 1065 | 152 | 646 | 0.10 |
| ESR2 | ||||||
| rs3020450-rs1271572-rs1887994-rs7159462 | ||||||
| CACC | 46 | 639 | 727 | 346 | 452 | 0.12 |
| TCCC | 29 | 372 | 994 | 254 | 544 | 0.024* |
| CCAC | 11 | 153 | 1213 | 79 | 719 | 0.33 |
| CCCT | 8 | 116 | 1251 | 65 | 733 | 0.83 |
| CCCC | 6 | 81 | 1285 | 49 | 749 | 0.86 |
| rs1256061-rs1256063 | ||||||
| TG | 50 | 671 | 689 | 401 | 397 | 0.68 |
| GG | 41 | 547 | 814 | 331 | 467 | 0.57 |
| GA | 10 | 142 | 1218 | 66 | 732 | 0.10 |
| rs4986938-rs928554-rs1152582 | ||||||
| GGG | 44 | 619 | 747 | 333 | 465 | 0.10 |
| AAC | 38 | 502 | 864 | 310 | 488 | 0.32 |
| GAC | 18 | 233 | 1133 | 149 | 649 | 0.35 |
Analysis of ESR SNPs and haplotypes in obesity
No ESR1 SNP displayed significant allelic association with obesity, but one SNP, rs2813544, was associated with obesity in analysis of homozygous subjects only, nominal P value 0.05, Table 4. Two ESR2 SNPs, rs7154455 and rs3020450, displayed allelic association with obesity in the joint analysis of women and men, nominal P value 0.0003–0.01, Table 4. In permutation test, the association between rs7154455 and obesity remained significant (P value 0.0022), whereas the result for rs3020450 became borderline significant (P value 0.064). Both SNPs were associated with obesity in women, but not in men. For ESR2 SNPs rs1152582, rs1271572 and rs1269056, allelic associations with obesity were observed in women, nominal P value 0.03–0.05, but not in joint analysis of women and men, Table 4. ESR2 SNP rs4986938 was associated with obesity in men only, nominal P value 0.05. rs7154455 and rs3020450 were genotyped in sample 2 where no association with obesity was observed, Table 4. Nor was there any association with obesity in analysis of pooled samples 1 and 2 (results not shown). No ESR SNP was associated with HOMAIR, Pl-cholesterol, Pl-HDL cholesterol, and Pl-triglycerides with P < 0.0125, and did thus not remain significant after Bonferroni correction for analysis of several SNPs (results not shown).
Table 4.
Association between ESR SNPs and obesity in samples 1 and 2a
| Gene | SNP | Controls (n) | Cases (n) | Allele Frequency | Heterozygous | Homozygous | Recessive model | Armitage's trend test | |||||||||
| 22b | 21 | 11 | 22 | 21 | 11 | [2]<-> [1]c | P value | [22]<-> [12] | P value | [22]<-> [11] | P value | [11+12]<-> [22] | P value | OR | P value | ||
| Sample 1 | |||||||||||||||||
| ESR1 | rs2813544 | 10 | 134 | 255 | 33 | 242 | 408 | 0.82 [0.66–1.02] | 0,08 | 0.55 [0.26–1.14] | 0,11 | 0.48 [0.24–1.00] | 0,05 | 0.51 [0.25–1.04] | 0,06 | 0,79 | 0,07 |
| Women | 8 | 114 | 213 | 29 | 194 | 339 | 0.83 [0.66–1.06] | 0,13 | 0.47 [0.21–1.06] | 0,06 | 0.44 [0.20–0.98] | 0,04 | 0.45 [0.20–1.00] | 0,04 | 0,79 | 0,13 | |
| Men | 2 | 20 | 42 | 4 | 48 | 69 | 0.77 [0.45–1.31] | 0,33 | 1.20 [0.20–7.08] | 0,84 | 0.82 [0.14–4.68] | 0,82 | 0.94 [0.17–5.30] | 0,95 | 0,78 | 0,31 | |
| ESR2 | rs7154455 | 107 | 167 | 47 | 273 | 260 | 62 | 0.70 [0.57–0.85] | 0,0003 | 0.61 [0.45–0.82] | 0,001 | 0.52 [0.33–0.80] | 0,003 | 0.59 [0.44–0.78] | 0,0002 | 0,7 | 0,0003 |
| Women | 84 | 144 | 43 | 223 | 219 | 45 | 0.63 [0.51–0.78] | 0,00003 | 0.57 [0.41–0.80] | 0,0008 | 0.39 [0.24–0.64] | 0,0001 | 0.53 [0.39–0.73] | 0,00007 | 0,62 | 0,00002 | |
| Men | 23 | 23 | 4 | 50 | 41 | 17 | 1.18 [0.71–1.97] | 0,51 | 0.82 [0.40–1.67] | 0,58 | 2.0 [0.59–6.46] | 0,27 | 0.99 [0.50–1.94] | 0,97 | 1,26 | 0,53 | |
| rs3020450 | 177 | 163 | 44 | 353 | 237 | 59 | 0.78 [0.64–0.94] | 0,01 | 0.73 [0.56–0.95] | 0,02 | 0.67 [0.44–1.03] | 0,07 | 0.72 [0.56–0.92] | 0,01 | 0,8 | 0,01 | |
| Women | 147 | 139 | 41 | 288 | 202 | 42 | 0.72 [0.58–0.89] | 0,002 | 0.74 [0.55–1.00] | 0,05 | 0.52 [0.33–0.84] | 0,007 | 0.69 [0.52–0.91] | 0,009 | 0,73 | 0,003 | |
| Men | 30 | 24 | 3 | 65 | 35 | 17 | 1.17 [0.71–1.94] | 0,54 | 0.67 [0.34–1.32] | 0,25 | 2.61 [0.71–9.61] | 0,14 | 0.89 [0.47–1.68] | 0,72 | 1,32 | 0,57 | |
| ESR2 | Women | ||||||||||||||||
| rs1152582 | 54 | 171 | 110 | 127 | 274 | 161 | 0.80 [0.66–0.98] | 0,03 | 0.68 [0.47–1.00] | 0,04 | 0.62 [0.42–0.93] | 0,01 | 0.66 [0.46–0.94] | 0,02 | 0,8 | 0,03 | |
| rs1271572 | 59 | 172 | 104 | 130 | 281 | 151 | 0.82 [0.68–1.00] | 0,05 | 0.74 [0.52–1.06] | 0,1 | 0.66 [0.44–1.00] | 0,04 | 0.71 [0.50–1.00] | 0,05 | 0,82 | 0,04 | |
| rs1269056 | 53 | 175 | 107 | 127 | 275 | 158 | 0.81 [0.66–0.98] | 0,03 | 0.66 [0.45–0.95] | 0,03 | 0.62 [0.41–0.92] | 0,02 | 0.64 [0.45–0.91] | 0,01 | 0,8 | 0,03 | |
| ESR2 | Men | ||||||||||||||||
| rs4986938 | 4 | 30 | 30 | 20 | 59 | 45 | 0.64 [0.40–1.00] | 0,05 | 0.39 [0.12–1.26] | 0,11 | 0.30 [0.09–0.96] | 0,04 | 0.35 [0.11–1.06] | 0,05 | 0,6 | 0,05 | |
| Sample 2 | |||||||||||||||||
| ESR2 | rs3020450 | 326 | 245 | 41 | 410 | 332 | 60 | 1.08 [0.91–1.27] | 0,39 | 1.08 [0.86–1.34] | 0,51 | 1.16 [0.76–1.78] | 0,48 | 1.09 [0.88–1.34] | 0,42 | 1.08 | 0,38 |
| Women | 273 | 216 | 35 | 346 | 282 | 53 | 1.06 [0.89–1.27] | 0,42 | 1.03 [0.81–1.31] | 0,81 | 1.20 [0.76–1.88] | 0,44 | 1.05 [0.84–1.32] | 0,65 | 1.07 | 0,51 | |
| Men | 53 | 29 | 6 | 64 | 50 | 7 | 1.18 [0.75–1.86] | 0,46 | 1.42 [0.80–2.56] | 0,23 | 0.97 [0.31–3.05] | 0,95 | 1.35 [0.77–2.35] | 0,29 | 1.11 | 0,46 | |
| rs7154455 | 318 | 248 | 46 | 399 | 341 | 63 | 1.06 [0.90–1.26] | 0,45 | 1.10 [0.88–1.37] | 0,42 | 1.09 [0.73–1.64] | 0,67 | 1.09 [0.89–1.35] | 0,40 | 1.06 | 0,44 | |
| Women | 268 | 216 | 40 | 337 | 287 | 57 | 1.06 [0.89–1.27] | 0,52 | 1.06 [0.83–1.34] | 0,65 | 1.13 [0.73–1.75] | 0,57 | 1.07 [0.85–1.34] | 0,57 | 1.06 | 0,52 | |
| Men | 50 | 32 | 6 | 62 | 54 | 6 | 1.11 [0.71–1.73] | 0,64 | 1.36 [0.77–2.42] | 0,29 | 0.81 [0.24–2.65] | 0,72 | 1.27 [0.73–2.21] | 0,74 | 1.05 | 0,63 | |
a) Shown are SNPs with P value < 0.05 in at least one analysis.
b) 1 and 2 represent the two alleles of each SNP.
c) OR (95% confidence interval)
In sample 1, no ESR1 haplotype was associated with obesity, Table 3. One common ESR2 haplotype, TCCC (frequency 29%) at SNPs rs3020450-rs1271572-rs1887994-rs7159462 was associated with obesity, nominal P value 0.024, Table 3. TCCC was captured by SNP rs3020450. rs3020450 was genotyped in sample 2, where we were unable to confirm the association observed in sample 1.
Relation of ESR1 SNPs and mRNA levels to adipocyte lipolysis and lipogenesis phenotypes
In 122 women with a large variation in BMI, part of sample 3, there was an inverse correlation between ESR1 mRNA levels in abdominal sc adipose tissue and adipocyte basal lipolysis as well as responsiveness to noradrenaline and more selective adrenoceptor agonists, Figure 3. In multiple regression, including BMI, age, and ESR1 mRNA levels as independent variables, ESR1 levels were an independent factor regulating basal lipolysis (P = 0.018), as well as responsiveness to noradrenaline (P = 0.013), Table 5. Association between ESR1 mRNA levels and lipolytic responsiveness was stronger for the α2-adrenoceptor selective agonist clonidine (P = 0.009), than for the non-selective β-adrenoceptor agonist isoprenaline (P = 0.045), Table 5. There was no association between ESR1 mRNA levels and sensitivity of lipolysis to adrenoceptor agonists, nor between ESR1 mRNA levels and measures of lipogenesis. We next analysed ESR1 SNPs for impact on adipocyte lipolysis and lipogenesis in the 204 obese women of sample 3, for which these phenotypes had been investigated. No SNP was associated with basal lipolysis (results not shown). One ESR1 SNP, rs532010, was associated with lipolytic sensitivity to noradrenaline, nominal P value 0.012, Table 6. Another ESR1 SNP, rs1884051, was associated with responsiveness to the non-selective beta-adrenoceptor agonist isoprenaline, nominal P value 0.05. These SNP associations became non-significant after Bonferroni correction for analysis of several SNPs. No ESR1 SNP was associated with lipogenesis (results not shown).
Figure 3.

ESR1 mRNA levels in abdominal sc adipose tissue plotted against (A) basal lipolysis, response to (B) noradrenaline, (C) the non-selective β-adrenoceptor agonist isoprenaline, and (D) the α2-adrenoceptor selective agonist clonidine.
Table 5.
Regression of basal lipolysis and responsiveness to adrenoceptor agonist on ERS1 mRNA levels
| Coefficient ± SE | Std. Coeff. | T-value | P value | |
| Basal lipolysis | ||||
| Intercept | 2.34 ± 4.54 | 2.34 | 0.51 | 0.61 |
| ESR1 (AU) | -3.90 ± 1.62 | -0.20 | -2.40 | 0.018 |
| BMI (kg/m2) | 0.44 ± 0.10 | 0.39 | 4.61 | <0.0001 |
| Age (years) | -0.14 ± 0.08 | -0.15 | -1.86 | .065 |
| Response to noradrenaline | ||||
| Intercept | 13.84 ± 6.40 | 13.84 | 2.16 | .033 |
| ESR1 (AU) | -5.72 ± 2.26 | -0.21 | -2.53 | .013 |
| BMI (kg/m2) | 0.58 ± 0.13 | 0.37 | 4.38 | <0.0001 |
| Age (years) | -0.22 ± 0.11 | -.174 | -2.12 | .036 |
| Response to isoprenaline | ||||
| Intercept | 15.44 ± 8.72 | 15.44 | 1.77 | 0.079 |
| ESR1 (AU) | -6.31 ± 3.11 | -0.18 | -2.03 | 0.045 |
| BMI (kg/m2) | 0.78 ± 0.18 | 0.37 | 4.28 | <.0001 |
| Age (years) | -0.16 ± 0.14 | -0.10 | -1.14 | 0.26 |
| Response to clonidine | ||||
| Intercept | 0.99 ± 0.92 | 0.99 | 1.08 | 0.28 |
| ESR1 (AU) | -0.87 ± 0.33 | -0.23 | -2.65 | 0.0091 |
| BMI (kg/m2) | 0.07 ± 0.02 | 0.31 | 3.57 | 0.0005 |
| Age (years) | -0.02 ± 0.02 | -0.08 | -1.00 | 0.32 |
Table 6.
Association between ESR1 SNPs and lipolysis and lipogenesis phenotypesa
| Source | Sum of Squares | F Ratio | Prob > F | |
| Noradrenaline pD2, lipolysis b | ||||
| ESR1 | rs532010 | 0.045 | 4.51 | 0.012 |
| Response to Isoprenaline, lipolysis c | ||||
| ESR1 | rs1884051 | 0.219 | 3.02 | 0.050 |
a) For quantitative analysis of lipolysis and lipogenesis, logarithm transformed phenotypes were used as independent quantitative variables in linear regression models. Genotypes were indicated as character (nominal) with three levels, two alternative homozygous and heterozygous.
b) The concentration (log mol/l) of hormone or agonist causing half maximum effect was determined using logistic conversion of each concentration response curve. This value was converted to its negative form (pD2), which reflects hormone sensitivity.
c) Lipolysis is expressed as mmol of glycerol/2 h/107 cells.
Discussion
Estrogen signalling has been implicated in regulation of human adiposity [4]. There is evidence that ESR1 acts in fat cells, whereas ESR2 mediates the effects of estrogen on food intake [7,9]. We here report that ESR1 mRNA levels in adipose tissue were inversely correlated with basal lipolysis and adrenoceptor responsiveness in obese women. In sample 1, two ESR2 SNPs were associated with obesity with nominal P value < 0.01. However, these associations were not confirmed in sample 2. No ESR1 SNP displayed allelic association with obesity or lipolysis.
Although no ESR1 SNP displayed allelic association with obesity, we cannot completely exclude an impact of ESR1 alleles on female obesity since genotyped SNPs failed to capture a few common haplotypes in the region of the ESR1gene.
Two ESR2 SNPs, rs7154455 and rs3020450 were associated with obesity with nominal P value < 0.01. The call rate for rs7154455 was only 83% adding some uncertainty to this association. rs7154455 and rs3020450 were genotyped in sample 2. In sample 2, as well as in pooled analysis of sample 1 and 2, no association with obesity was observed. This suggests that the allelic association of the two ESR2 SNPs in sample 1 was spurious. However, since recruitment criteria for sample 2 were based on less stringent definitions of obesity and leanness, and included subjects with metabolic complications of obesity, we cannot exclude that the ESR2 SNPs have a modest impact on more extreme forms of uncomplicated obesity such as in sample 1. In addition, this study was not designed to study potential gene-environment interactions. This is particularly important for ESR2, which has been implicated in mediating the effects of estrogen on food intake. Furthermore, our cohort of men was too small to exclude a male-specific impact of ESR1 and ESR2 on obesity. This might explain the difference between our results and the association of ESR1 and male obesity previously reported [14].
We have reported before that ESR1 rs2234693 and rs9340799 are not associated with obesity in a cohort of Swedish women partially overlapping with the cohort studied in this project [16]. We therefore did not genotype rs2234693 and rs9340799 in this study. ESR1 rs1801132, reported to be associated with BMI in men in the Framingham Heart Study [14], is according to the Caucasian HAPMAP data on the same haplotype as rs9397456, which was genotyped in this project. We did not genotype the three ESR1 SNP reported to be associated with BMI in African Americans [17]; however the reported BMI associated SNP rs6902771 is according to HAPMAP on the same haplotype as rs2234693, which we genotyped. We genotyped rs1709183, but not rs2431260, reported to be associated with T2D [18]. Finally, we genotyped rs928554 and rs4986938, but not rs1256049, implicated in eating disorders [19,20]. SNPs genotyped in our present project, that previously have been associated with obesity related and eating disorders, were not associated with obesity in the present project.
Human obesity is associated with increased rate of basal lipolysis in all fat depots and lipolytic resistance to catecholamines in sc fat [39]. Our finding that ESR1 mRNA levels in adipose tissue are inversely correlated with rate of basal lipolysis might suggest that low adipose tissue ESR1 levels, as observed in obesity [16], increases basal lipolysis. In addition, the inverse correlation between ESR1 mRNA levels and lipolytic responsiveness to catecholamines implies that low adipose tissue ESR1 levels among obese counteracts catecholamine resistance in sc fat cells of obese women. Catecholamine resistance among obese is specific to sc fat [39]. Attenuation of lipolytic catecholamine resistance may explain why low estrogen signalling is associated with fat redistribution with loss of sc and gain of visceral fat [2]. In our analyses, there was no evidence for a genetic impact of ESR1 on lipolysis or lipogenesis.
Conclusion
Common ESR1 gene alleles are unlikely to contribute to obesity in women, whereas a minor importance of ESR2 on severe obesity cannot be excluded. The male subset in our sample was too small to exclude that ESRs have an impact on obesity in men. Low ESR1 mRNA levels in adipose tissue may counteract catecholamine resistance in fat cells of obese women hereby contributing to loss of sc and gain of visceral fat [39]. In our analysis of obese women there was no evidence for a genetic impact of ESR1 on lipolysis or lipogenesis. In future research, it will be important to investigate if there are interactions between ESR2 gene alleles and environmental factors such as food intake.
Competing interests
The author(s) declare that they have no competing interests, except in case of Jan-Åke Gustafsson who is shareholder, research grant receiver and consultant of KaroBio AB.
Authors' contributions
MN performed the mRNA measurements and RFLP, analysed data, and drafted the manuscript. ID designed the genetic study, analysed data, and drafted the manuscript together with MN. HJ analysed data. JAG helped to draft the manuscript. PA collected the obese and lean samples and was responsible for the fat cell studies. KDW designed the study and helped to draft the manuscript. All authors read and approved the final manuscript.
Pre-publication history
The pre-publication history for this paper can be accessed here:
Acknowledgments
Acknowledgements
The authors want to thank all subjects for participating in the present study. This work was supported by The Royal Physiographic Society in Lund, Stiftelsen Lars Hiertas Minne (both to MN), Swedish Research Council and AFA foundation. We thank the the SNP technology platform at Uppsala University for the Illumina genotyping. The SNP technology platform at Uppsala University was supported with a grant from the K&A Wallenbergs Stiftelse to the Wallenberg Consortium North. The authors want to thank Elisabeth Dungner and Kerstin Wåhlén for technical assistance.
Contributor Information
Maria Nilsson, Email: nilsson_anna_maria@yahoo.se.
Ingrid Dahlman, Email: ingrid.dahlman@ki.se.
Hong Jiao, Email: hong.jiao@biosci.ki.se.
Jan-Åke Gustafsson, Email: jan-ake.gustafsson@mednut.ki.se.
Peter Arner, Email: peter.arner@ki.se.
Karin Dahlman-Wright, Email: kada@biosci.ki.se.
References
- Maes HH, Neale MC, Eaves LJ. Genetic and environmental factors in relative body weight and human adiposity. Behav Genet. 1997;27:325–351. doi: 10.1023/A:1025635913927. [DOI] [PubMed] [Google Scholar]
- Toth MJ, Tchernof A, Sites CK, Poehlman ET. Effect of menopausal status on body composition and abdominal fat distribution. Int J Obes Relat Metab Disord. 2000;24:226–231. doi: 10.1038/sj.ijo.0801118. [DOI] [PubMed] [Google Scholar]
- Dahlman-Wright K, Cavailles V, Fuqua SA, Jordan VC, Katzenellenbogen JA, Korach KS, Maggi A, Muramatsu M, Parker MG, Gustafsson JA. International Union of Pharmacology. LXIV. Estrogen receptors. Pharmacol Rev. 2006;58:773–781. doi: 10.1124/pr.58.4.8. [DOI] [PubMed] [Google Scholar]
- Heine PA, Taylor JA, Iwamoto GA, Lubahn DB, Cooke PS. Increased adipose tissue in male and female estrogen receptor-alpha knockout mice. Proc Natl Acad Sci U S A. 2000;97:12729–12734. doi: 10.1073/pnas.97.23.12729. [DOI] [PMC free article] [PubMed] [Google Scholar]
- Laflamme N, Nappi RE, Drolet G, Labrie C, Rivest S. Expression and neuropeptidergic characterization of estrogen receptors (ERalpha and ERbeta) throughout the rat brain: anatomical evidence of distinct roles of each subtype. J Neurobiol. 1998;36:357–378. doi: 10.1002/(SICI)1097-4695(19980905)36:3<357::AID-NEU5>3.0.CO;2-V. [DOI] [PubMed] [Google Scholar]
- Pedersen SB, Bruun JM, Hube F, Kristensen K, Hauner H, Richelsen B. Demonstration of estrogen receptor subtypes alpha and beta in human adipose tissue: influences of adipose cell differentiation and fat depot localization. Mol Cell Endocrinol. 2001;182:27–37. doi: 10.1016/S0303-7207(01)00557-3. [DOI] [PubMed] [Google Scholar]
- Liang YQ, Akishita M, Kim S, Ako J, Hashimoto M, Iijima K, Ohike Y, Watanabe T, Sudoh N, Toba K, Yoshizumi M, Ouchi Y. Estrogen receptor beta is involved in the anorectic action of estrogen. Int J Obes Relat Metab Disord. 2002;26:1103–1109. doi: 10.1038/sj.ijo.0802054. [DOI] [PubMed] [Google Scholar]
- Lindberg UB, Crona N, Silfverstolpe G, Bjorntorp P, Rebuffe-Scrive M. Regional adipose tissue metabolism in postmenopausal women after treatment with exogenous sex steroids. Horm Metab Res. 1990;22:345–351. doi: 10.1055/s-2007-1004917. [DOI] [PubMed] [Google Scholar]
- Pedersen SB, Kristensen K, Hermann PA, Katzenellenbogen JA, Richelsen B. Estrogen controls lipolysis by up-regulating alpha2A-adrenergic receptors directly in human adipose tissue through the estrogen receptor alpha. Implications for the female fat distribution. J Clin Endocrinol Metab. 2004;89:1869–1878. doi: 10.1210/jc.2003-031327. [DOI] [PubMed] [Google Scholar]
- Atwood LD, Heard-Costa NL, Cupples LA, Jaquish CE, Wilson PW, D'Agostino RB. Genomewide linkage analysis of body mass index across 28 years of the Framingham Heart Study. Am J Hum Genet. 2002;71:1044–1050. doi: 10.1086/343822. [DOI] [PMC free article] [PubMed] [Google Scholar]
- Arya R, Lehman D, Hunt KJ, Schneider J, Almasy L, Blangero J, Stern MP, Duggirala R. Evidence for bivariate linkage of obesity and HDL-C levels in the Framingham Heart Study. BMC Genet. 2003;4:S52. doi: 10.1186/1471-2156-4-S1-S52. [DOI] [PMC free article] [PubMed] [Google Scholar]
- Geller F, Dempfle A, Gorg T. Genome scan for body mass index and height in the Framingham Heart Study. BMC Genet. 2003;4:S91. doi: 10.1186/1471-2156-4-S1-S91. [DOI] [PMC free article] [PubMed] [Google Scholar]
- Fox CS, Heard-Costa NL, Wilson PW, Levy D, D'Agostino RB, Sr, Atwood LD. Genome-wide linkage to chromosome 6 for waist circumference in the Framingham Heart Study. Diabetes. 2004;53:1399–1402. doi: 10.2337/diabetes.53.5.1399. [DOI] [PubMed] [Google Scholar]
- Fox CS, Yang Q, Cupples LA, Guo CY, Atwood LD, Murabito JM, Levy D, Mendelsohn ME, Housman DE, Shearman AM. Sex-specific association between estrogen receptor-alpha gene variation and measures of adiposity: the Framingham Heart Study. J Clin Endocrinol Metab. 2005;90:6257–6262. doi: 10.1210/jc.2005-0670. [DOI] [PubMed] [Google Scholar]
- Okura T, Koda M, Ando F, Niino N, Ohta S, Shimokata H. Association of polymorphisms in the estrogen receptor alpha gene with body fat distribution. Int J Obes Relat Metab Disord. 2003;27:1020–1027. doi: 10.1038/sj.ijo.0802378. [DOI] [PubMed] [Google Scholar]
- Nilsson M, Dahlman I, Ryden M, Nordstrom EA, Gustafsson JA, Arner P. Dahlman-Wright K, Oestrogen receptor alpha gene expression levels are reduced in obese compared to normal weight females. Int J Obes (Lond) 2007 doi: 10.1038/sj.ijo.0803528. [DOI] [PubMed] [Google Scholar]
- Gallagher CJ, Langefeld CD, Gordon CJ, Campbell JK, Mychaleckyj JC, Bryer-Ash M, Rich SS, Bowden DW, Sale MM. Association of the estrogen receptor-alpha gene with the metabolic syndrome and its component traits in African-American families: the Insulin Resistance Atherosclerosis Family Study. Diabetes. 2007;56:2135–2141. doi: 10.2337/db06-1017. [DOI] [PubMed] [Google Scholar]
- Gallagher CJ, Keene KL, Mychaleckyj JC, Langefeld CD, Hirschhorn JN, Henderson BE, Gordon CJ, Freedman BI, Rich SS, Bowden DW, Sale MM. Investigation of the estrogen receptor-alpha gene with type 2 diabetes and/or nephropathy in African-American and European-American populations. Diabetes. 2007;56:675–684. doi: 10.2337/db06-0303. [DOI] [PubMed] [Google Scholar]
- Nilsson M, Naessen S, Dahlman I, Linden Hirschberg A, Gustafsson JA, Dahlman-Wright K. Association of estrogen receptor beta gene polymorphisms with bulimic disease in women. Mol Psychiatry. 2004;9:28–34. doi: 10.1038/sj.mp.4001402. [DOI] [PubMed] [Google Scholar]
- Eastwood H, Brown KM, Markovic D, Pieri LF. Variation in the ESR1 and ESR2 genes and genetic susceptibility to anorexia nervosa. Mol Psychiatry. 2002;7:86–89. doi: 10.1038/sj/mp/4000929. [DOI] [PubMed] [Google Scholar]
- Rosenkranz K, Hinney A, Ziegler A, Hermann H, Fichter M, Mayer H, Siegfried W, Young JK, Remschmidt H, Hebebrand J. Systematic mutation screening of the estrogen receptor beta gene in probands of different weight extremes: identification of several genetic variants. J Clin Endocrinol Metab. 1998;83:4524–4527. doi: 10.1210/jc.83.12.4524. [DOI] [PubMed] [Google Scholar]
- Bell CG, Walley AJ, Froguel P. The genetics of human obesity. Nat Rev Genet. 2005;6:221–234. doi: 10.1038/nrg1556. [DOI] [PubMed] [Google Scholar]
- QUANTO http://hydra.usc.edu/GxE/
- Eriksson P, Reynisdottir S, Lonnqvist F, Stemme V, Hamsten A, Arner P. Adipose tissue secretion of plasminogen activator inhibitor-1 in non-obese and obese individuals. Diabetologia. 1998;41:65–71. doi: 10.1007/s001250050868. [DOI] [PubMed] [Google Scholar]
- Hoffstedt J, Arvidsson E, Sjolin E, Wahlen K, Arner P. Adipose tissue adiponectin production and adiponectin serum concentration in human obesity and insulin resistance. J Clin Endocrinol Metab. 2004;89:1391–1396. doi: 10.1210/jc.2003-031458. [DOI] [PubMed] [Google Scholar]
- Bonora E, Targher G, Alberiche M, Bonadonna RC, Saggiani F, Zenere MB, Monauni T, Muggeo M. Homeostasis model assessment closely mirrors the glucose clamp technique in the assessment of insulin sensitivity: studies in subjects with various degrees of glucose tolerance and insulin sensitivity. Diabetes Care. 2000;23:57–63. doi: 10.2337/diacare.23.1.57. [DOI] [PubMed] [Google Scholar]
- Kolaczynski JW, Morales LM, Moore JH, Jr, Considine RV. Pietrzkowski, Z Noto, PF Colberg, J Caro, JF A new technique for biopsy of human abdominal fat under local anaesthesia with Lidocaine. Int J Obes Relat Metab Disord. 1994;18:161–166. [PubMed] [Google Scholar]
- Reynisdottir S, Eriksson M, Angelin B, Arner P. Impaired activation of adipocyte lipolysis in familial combined hyperlipidemia. J Clin Invest. 1995;95:2161–2169. doi: 10.1172/JCI117905. [DOI] [PMC free article] [PubMed] [Google Scholar]
- Reynisdottir S, Ellerfeldt K, Wahrenberg H, Lithell H, Arner P. Multiple lipolysis defects in the insulin resistance (metabolic) syndrome. J Clin Invest. 1994;93:2590–2599. doi: 10.1172/JCI117271. [DOI] [PMC free article] [PubMed] [Google Scholar]
- Reynisdottir S, Wahrenberg H, Carlstrom K, Rossner S, Arner P. Catecholamine resistance in fat cells of women with upper-body obesity due to decreased expression of beta 2-adrenoceptors. Diabetologia. 1994;37:428–435. doi: 10.1007/BF00408482. [DOI] [PubMed] [Google Scholar]
- Arner P, Engfeldt P. Fasting-mediated alteration studies in insulin action on lipolysis and lipogenesis in obese women. Am J Physiol. 1987;253:E193–201. doi: 10.1152/ajpendo.1987.253.2.E193. [DOI] [PubMed] [Google Scholar]
- Arvidsson E, Blomqvist L, Ryden M. Depot-specific differences in perilipin mRNA but not protein expression in obesity. J Intern Med. 2004;255:595–601. doi: 10.1111/j.1365-2796.2004.01314.x. [DOI] [PubMed] [Google Scholar]
- Hapmap http://www.hapmap.org
- Haploview http://www.broad.mit.edu/mpg/haploview/
- Fan JB, Oliphant A, Shen R, Kermani BG, Garcia F, Gunderson KL, Hansen M, Steemers F, Butler SL, Deloukas P, Galver L, Hunt S, McBride C, Bibikova M, Rubano T, Chen J, Wickham E, Doucet D, Chang W, Campbell D, Zhang B, Kruglyak S, Bentley D, Haas J, Rigault P, Zhou L, Stuelpnagel J, Chee MS. Highly parallel SNP genotyping. Cold Spring Harb Symp Quant Biol. 2003;68:69–78. doi: 10.1101/sqb.2003.68.69. [DOI] [PubMed] [Google Scholar]
- SNP technology platform http://www.genotyping.se
- Jurinke C, van den Boom D, Cantor CR, Koster H. Automated genotyping using the DNA MassArray technology. Methods Mol Biol. 2002;187:179–192. doi: 10.1385/1-59259-273-2:179. [DOI] [PubMed] [Google Scholar]
- software, F http://ihg.gsf.de/cgi-bin/hw/hwa1.pl
- Arner P. Human fat cell lipolysis: biochemistry, regulation and clinical role. Best Pract Res Clin Endocrinol Metab. 2005;19:471–482. doi: 10.1016/j.beem.2005.07.004. [DOI] [PubMed] [Google Scholar]