Abstract
The microtubule-associated protein TOGp which belongs to a widely distributed protein family from yeasts to humans, is highly expressed in human tumors and brain tissue. From purified components, we have determined the effect of TOGp on thermally induced tubulin association in vitro, in the presence of 1 mM GTP and 3.4 M glycerol. Physicochemical parameters describing the mechanism of tubulin polymerization were deduced from the kinetic curves by application of the classical theoretical models of tubulin assembly. We have calculated from the polymerization time curves a range of parameters characteristic of nucleation, elongation or steady state phase. In addition, the tubulin subunits turnover at microtubule ends was deduced from tubulin GTPase activity. For comparison, parallel experiments were conducted with colchicine and taxol, two drugs active on microtubules and with tau, a structural microtubule-associated protein from brain tissue. TOGp, which decreases the nucleus size and the tenth time of the reaction (the time required to produce 10% of the final amount of polymer), shortens the nucleation phase of microtubule assembly. In addition, TOGp favours microtubules formation by increasing the apparent first order rate constant of elongation. Moreover, TOGp increases the total amount of polymer by decreasing the tubulin critical concentration and by inhibiting depolymerization during the steady state of the reaction.
Keywords: Animals; Brain; metabolism; Brain Chemistry; Guanosine Triphosphate; chemistry; metabolism; Humans; Kinetics; Microtubule-Associated Proteins; chemistry; metabolism; Microtubules; chemistry; metabolism; Models, Molecular; Neoplasms; chemistry; metabolism; Swine; Tubulin; chemistry; metabolism
INTRODUCTION
Microtubules are highly dynamic structures that switch between growing and shrinking phases both in vivo and in vitro. These cytoskeleton polymers are necessary for many functions within the cell including intracellular transport, motility, morphogenesis and cell division. The intrinsic dynamic instability of microtubules is further modified in the cell by numerous protein factors that favour alternatively elongation, shortening or anchoring of these polymers. Since the mitotic spindle plays a crucial role in cell division, it is used for decades as an important target in cancer chemotherapy. Many tubulin poisons have been identified, some of them, taxanes and vinca alkaloids, have demonstrated their therapeutic value. However, all tubulin poisons are not of clinical utility. This has led to extensive efforts to explore other targets that could affect spindle integrity. A promising approach is to identify the protein regulators which modulate tubulin polymerization and to investigate their mechanism of action.
The dynamic instability of microtubules is controled in vivo by several classes of cellular factors including depolymerizing kinesins (MCAK/XKCM1) (1, 2), stathmins (3) and microtubule-associated proteins (MAPs). This last group is composed of structural MAPs (MAP2, tau) that were first identified in brain tissue and of a group of XMAP215 related proteins whose generic member was first characterized in Xenopus eggs (4). TOGp (HUGO Gene Symbol: CKAP5) which is highly expressed in tumors and brain (5) is the human homolog of XMAP215. TOGp promotes microtubule assembly both in solution and from nucleation centers (6). It was evidenced that this MAP possesses a high affinity for polymer lattice and that it binds protofilaments by its N-terminal part (7). This protein is involved in microtubule aster formation in mammalian mitotic cells (8), moreover, TOGp is required for centrosome integrity and spindle pole organization (9).
The TOGp family has a wide distribution, it is present from yeasts to humans. In addition to the human TOGp and to the frog XMAP215 protein, members of this group have been independently discovered in Drosophila melanogaster (Msps), in Dictyostelium discoideum (DdCP224) and in Arabidopsis thaliana (Mor1) (10, 11, 12). Other forms with more divergent protein structure were identified in Caenorhabditis elegans (Zyg-9) (13) and in yeasts. Two forms Dis1 and Alp14 are present in fission yeast (14, 15) while one member Stu2 was characterized in Saccharomyces cerevisiae (16). This evolutionary conserved protein family is implicated in microtubule polymer assembly and spindle formation.
Microtubules are hollow cylindrical aggregates of 25 nm diameter composed of heterodimers of α- and β-tubulin. Each of these subunits binds one mol of GTP. GTP bound to α-tubulin is not exchanged, while β-tubulin bound GTP is hydrolyzed to GDP soon after tubulin polymerization. A significant amount of the free energy of this hydrolysis goes into the microtubule via a conformational change of the tubulin dimer, its consequence is to destabilize the structure.
Microtubules can spontaneously assemble in vitro from a solution of purified tubulin in the presence of GTP by a temperature jump from 0 to 37°C. The kinetics of tubulin assembly are generally interpreted as a two steps nucleation elongation process. The theoretical interpretation of tubulin polymerization is based on the actin helical aggregation model (17, 18). However, the polymerization of microtubules is much more complex than the assembly of actin filaments and necessitates kinetic as well as thermodynamic considerations (19). Its mathematical analysis requires an infinite set of inter-related differential equations (20). In the case of actin, some approximations were introduced by Wegner and Engel (18) leading to simplify the process to two inter-related differential equations, which after integration give a numerical solution of the polymerization curves (21, 22). The actin model cannot be directly extrapolated to tubulin. Microtubule elongation is well documented both at the structural and mechanistic levels, in contrast nucleation is still poorly understood, mainly because it is composed of weakly concentrated transient intermediates (23). Voter and Erikson (24) introduced a two-dimensional nucleation mechanism which improves the fitting with the experimental kinetic curves. More recently Flyvbjerg et al. (25) formulated a new assembly model in which the final nucleus is the result of a series of intermediate aggregates formed by the step by step addition of a variable number of tubulin monomers.
Quantitative parameters describing the mechanism of tubulin assembly can be deduced from the kinetics by application of the theoretical models. It is possible to calculate from the polymerization time curves a range of physicochemical parameters characteristic of nucleation, elongation or steady state phase. In addition, the tubulin subunits turnover at microtubule ends can be deduced from tubulin GTPase activity. In this paper we have determined the influence of TOGp on these kinetic parameters. The results showed that this MAP was a strong activator of microtubule production, able to influence various steps of the reaction at low concentration. For comparison, parallel experiments were conducted with colchicine and taxol, two microtubule reactive drugs and with tau, a classical MAP from brain tissue.
MATERIAL AND METHODS
Tubulin purification
Tubulin was prepared according to the purification procedure described by Williams and Lee (26).
Purification of TOGp
TOGp was isolated from pig brain cytosol. Pig brains were obtained from the local slaughterhouse and transported to the laboratory on ice within 2 hours following bleeding. Meninges and superficial blood vessels were removed from the brains at 4°C. Two brains (160 g) were homogenized in 200 ml of PEM buffer (100 mM Pipes/NaOH, pH 6.6, 1 mM EGTA, 1 mM MgSO4, 1 μg/ml leupeptin ) for 30 sec in a Warring Blendor mixer. The tissue was further disrupted by means of a Tenbroeck homogenizer with a teflon pestle (five strokes on ice). The homogenate was centrifuged at 125000 g for 75 min at 5°C and the supernatant recovered. This fraction was brought to 32% saturation by adding progressively solid ammonium sulphate at room temperature. The precipitate was recovered by centrifugation at 5000 g for 20 min. The pellet was resuspended in 250 ml of a H2O/PEM (v/v) mixture. The solution was dialysed overnight at 4° C against 4 l of PEM buffer. A small protein precipitate was eliminated following centrifugation at 10000 rpm for 20 min. The protein TOGp was purified from the supernatant in two chromatographic steps.
1/Hydroxyapatite
The column (1.6×20 cm) was filled with Macro-Prep Ceramic Hydroxyapatite from Bio-Rad (Hercules, CA.) and equilibrated with PEM buffer. The column was loaded with the cleared supernatant and rinsed with PEM buffer. The proteins were eluted with two successive salt concentration gradients. First the KCl concentration was raised from 0 to 2 M in PEM buffer. Then, the PEM buffer was replaced by phosphate buffer (10 mM potassium phosphate, pH 6.8, 1 mM EGTA, 1 mM MgSO4, 1 μg/ml leupeptin) and a second gradient from 10 to 600 mM potassium phosphate was applied to the column. Usually, TOGp eluted with approximately 400 mM potassium phosphate. The protein fractions were analysed by Western blotting and the chromatographic fractions enriched in TOGp were pooled.
2/DEAE Sepharose
This chromatography was performed in TEM buffer (Tris/HCl, 20 mM, pH 8.2, 1 mM EGTA, 1 mM MgSO4, 1 μg/ml leupeptin) on a 1×10 cm column of DEAE Sepharose Fast Flow from Amersham Biosciences (Uppsala, Sweden). The protein fraction eluted from the hydroxyapatite column was dialysed against 2 l of TEM buffer for 5 hours and loaded on the column, unadsorbed proteins were eliminated by rinsing with the TEM buffer. A KCl concentration gradient from 0 to 0.1 M in TEM buffer was then applied. The protein fractions eluted with this gradient were immediately stored at −80° C. The qualitative composition of each fraction was determined on SDS PAGE and Western Blots revealed with anti-TOGp antibodies.
Purification of protein tau
We applied the purification procedure described by Cleveland et al. (27) to the 125000 g pig brain supernatant.
Antibodies
Rabbit polyclonal anti-TOGp antibodies were prepared as previously mentioned (6). Mouse monoclonal anti-tau (Clone tau-2) and mouse monoclonal anti-β-tubulin antibodies (Clone Tub 2.1) were from Sigma (St Louis, MO). Immunogold conjugated goat anti-rabbit IgG (5 nm and 15 nm particles) were from British Biocell International (Cardiff, UK). Fluoresceine (FITC)-conjugated goat anti-rabbit antibody and Texas-Red-conjugated goat anti-mouse antibody were from Cappel (MP Biomedicals, Strasbourg, France).
Electrophoresis and Western Blots
Proteins were resolved in denaturing 6% acrylamide gels, in a discontinuous buffer system, as described by Laemmli (28). Then, they were electrotransferred for 1 hour at 350 mA on a PVDF membrane (Immobilon P from Millipore, Bedford, MA) in Tris/glycine buffer (48 mM Tris, 39 mM glycine, pH 9.2, 1.3 mM SDS and 20% methanol). Protein bands were stained unspecifically by Amido black. Membranes were blocked overnight in 6% non fat milk in PBS at 4°C. They were subsequently probed for 2 hours with either anti-TOGp, anti-tubulin or anti-tau antibodies, diluted 1/1000. The blots were rinsed and incubated with the appropriate secondary antibody (1/2000) conjugated with peroxidase. Bound antibodies were detected by the enhanced chemiluminescence reagent ECL from Amersham Pharmacia Biotech (Buckinghamshire, England).
Peptide sequencing of TOGp immunoreactive forms
The protein extract was resolved in a 6% acrylamide gel under denaturing conditions. After the run, the gel was stained with 0.2% Coomassie blue R250 dissolved in 2% acetic acid, 50% methanol (HPLC grade). It was destained in 30% methanol. The 160 and 130 kDa polypeptides were both sequenced. They were excised from the gel and hydrolysed by trypsin according to Rosenfeld et al. (29). The resulting digest was fractionated using reverse phase chromatography on C8 then C18 Aquapore (2×10 mm) columns from Applied Biosystems (Foster City, CA) and eluted by an acetonitrile gradient in 0.1% trifluoroacetic acid. The eluate was monitored by UV spectroscopy (220 nm). Purified peptides were sequenced on a Procise sequencer from Applied Biosystem, using the pulsed liquid program.
Protein identification by mass spectrometry
Proteins resolved by polyacrylamide gel electrophoresis were identified by MALDI-TOF (Matrix-assisted laser desorption ionization time-of-flight) mass spectrometry. Selected protein spots were excised from the gel and destained. Following reduction and alkylation of disulfide bonds, the dried gel pieces were incubated with trypsin. The resulting peptides were extracted, purified with Millipore Zip-Tip C18 columns and added to the α-cyano-4-hydroxycinnamic acid matrix. The MALDI TOF mass spectrometry was performed at the Institut de Génomique Fonctionnelle (CNRS UPR 2580, Montpellier, France) using a Ultraflex apparatus from Bruker Daltonics (Billerica, MA). The peptide masses were matched with the theoretical peptide masses of all proteins in the Swiss-Prot database using the MASCOT search engine.
Microtubule assembly assays
Tubulin polymerization was monitored turbidimetrically at 350 nm with a MC2 (Safas, Monaco) spectrophotometer equipped with a thermally jacketed cuvette holder. The cuvette had a 10 mm pathlength and was 2 mm wide internally. The final volume of the sample was 200 μl. Experiments were run in PEM buffer, 3.4 M glycerol (25% v/v), 1 mM GTP, tubulin amount was varied from 5 to 20 μM, MAPs or drugs were added in the medium as indicated elsewhere. The reaction mixture was prepared at 0° C, the reaction was started by placing the cuvette in the spectrophotometer cell compartment thermostated at 37° C.
GTP hydrolysis associated with tubulin assembly
The GTPase activity was detected by using the PiPer phosphate Assay Kit from Molecular Probes (Eugene, OR). Briefly, inorganic phosphate is combined with maltose to give glucose 1-phosphate and glucose. Then glucose oxidase converts glucose to gluconolactone and H2O2. Finally horseradish peroxidase converts Amplex Red to Resorufin in the presence of hydrogen peroxide. Resorufin can be detected by measuring the increase in fluorescence or absorbance of the solution. Tubulin was polymerized at 37° C in the conditions indicated above, except that the amount of GTP was lowered to 0.1 mM to diminish the deep red coloration of the blank. The medium was divided in ten 50 μl samples which were incubated at 37°C. At various time intervals the polymerization was stopped by denaturing the proteins for 5 min in boiling water. The precipitate was removed by centrifugation and the supernatant was mixed with an equal volume of the kit reagent. The reaction was developed for 3 hours at 37° C and the absorbance measured at 570 nm. A dilution range was prepared in the same conditions from a 50 μM potassium phosphate solution to standardise the assay.
Kinetic parameters of tubulin assembly
Tubulin assembly is usually described as a sequence of bimolecular reactions (for details see ref. (20)) in which the polymer is built by successive additions of basal units of α- and β-tubulin dimers, for simplicity these building blocks are frequently termed monomers. The initial bimolecular reactions are thermodynamically unfavourable (24), small aggregates tend to dissociate. Once a certain size, n monomers (commonly named “critical nucleus”), is reached, the addition of the next monomer gives a polymer more stable than its precursor. From this step the elongation takes place by polymerization of subunits onto the microtubule ends. The reaction continues until the elongation process is compensated by the release of monomers at microtubule ends. At that time the polymer is in simple equilibrium with a fixed (critical) concentration of tubulin subunits.
As indicated above we followed the reaction of polymerization at 350 nm. It was shown previously (30) that there is a quite linear relationship between the turbidity and the total amount of microtubules. In consequence we considered the absorbance at 350 nm (A350nm) as proportionally related to the mass concentration of tubulin polymer. Informations concerning nucleation as well as elongation were drawn from the analysis of the sigmoid kinetics (30, 31). Two distinct parts can be seen on the curves, from time 0 to the first few minutes there is a lag phase corresponding principally to nucleation, then an exponential decay process takes place corresponding to elongation.
Nucleation
This phase may be characterized by various parameters. The determination of the tenth time, t1/10 (the time necessary to produce 10% of the final amount of polymer) is of current usage to estimate the lag time duration. Moreover, according to the theoretical models, we find that two parameters can be used to characterize the nucleus size. In this paper, we termed these parameters p and q. The former is defined by Flyvbjerg et al. (25), on the basis of the “scalling” properties of the polymerization curves obtained with various amounts of tubulin. From the experimental results, these authors noticed that the increase in polymer concentration for the earliest times is proportional to tp. They formulated a theoretical model, in which the parameter p was indicative of the number of successive steps in the nucleation process. The value of p can be easily determined by plotting log [A(t)/A∞] against log t. The second parameter, q, originates from the theory of helical aggregation of macromolecules of Oosawa and Kasai (17). In the case of actin polymerization it was demonstrated that the half time of the reaction (t1/2), was proportional to [M0]q, [M0] being the initial monomer concentration. This relationship is valuable with other characteristic times: t1/20 or t1/10 (24, 21, 25). Parameter q is obtained from the log-log plot of the tenth time of polymerization versus the total amount of monomer. Tobacman and Korn (21) indicate that it is equal to one-half of the nucleus size (n/2), while according to Voter and Erickson (24) it is equal to (n+1)/2. This apparent discrepancy is due in fact to different definitions of the critical nucleus in the two papers. In the former the nucleus is defined as the first polymer that is itself more stable than its precursor while in the second paper the nucleus is the least stable intermediate in the reaction. Nevertheless parameter q gives an objective estimation of the number of monomers in the critical nucleus.
Elongation develops after the lag phase following a procedure which is strongly similar to a first order chemical reaction. According to the pioneering work of Johnson and Borisy (30) the elongation reaction rate can be interpreted as the sum of the rates of polymerization and depolymerization as indicated in the following equation:
Where P represents the polymer, [M] is the concentration of free tubulin, [E] the concentration of assembly-competent microtubule ends, k+ is an apparent second order association rate constant corresponding to the sum of the rate constants for monomer addition at the two filament ends and k− is an apparent first order dissociation rate constant corresponding to the sum of the rate constants for monomer dissociation at the two filament ends. At steady state the reactions of growth and shortening of microtubules are identical. At that time [M] is equal to [M∞] the critical concentration of tubulin. In consequence:
It results that k− = k+ [M∞]. It can be outlined that the critical concentration [M∞] is equal to k−/k+ or to 1/K (K being the equilibrium association constant (30)).
By replacing k− by its value in the differential equation:
It can be assumed that [E] is constant during the elongation phase, the expression reduces to a pseudo first order rate expression, the product k+ [E] can be replaced by a constant termed k, the factor ([M]−[M∞]) represents the concentration of active tubulin named [Ma]. Following integration:
The ratio [Ma]/[Ma0] is easily accessible from the measures of the absorbance at 350 nm. It is equal to (A∞ − At)/A∞), where At represents the absorbance at a given time and A∞ is the absorbance maximum obtained at the plateau of the kinetic curve. By plotting ln(1−At/A∞) as a function of time, the pseudo-first-order rate constant of elongation kobs, can be determined.
Electron microscopy
Microtubules were prepared in a spectrophometer cuvette (200 μl final volume) at 37°C as indicated above in the microtubule assembly assays. Polymers prepared with native 200 kDa TOGp and control polymers with tubulin alone were incubated simultaneously.
First method
Microtubules were centrifuged at 36000 g for 30 min, the supernatant was discarded and the pellet resuspended in 200 μl of PEM buffer, 25% glycerol, 0.1 mM GTP. Anti-TOGp antibodies (5 μl) were added and the mixture incubated for 3 hours at 30°C. The antibodies were eliminated by centrifugation at 36000 g for 30 min at 35°C. The pellet was resuspended in 200 μl of PEM/Glycerol/GTP buffer and mixed with 5 μl of immunogold-conjugated goat anti-rabbit IgG (5 nm and 15 nm gold labelled antibodies were used alternatively). The incubation lasted 2 hours at 30°C. The secondary antibody was eliminated by centrifugation at 30°C and the microtubules were suspended in 200 ml of fresh buffer and placed at 30°C.
Second method
Following tubulin aggregation at 37°C, 4 μl of anti-TOGp antibodies were added to the solution and the incubation was continued for 3 hours at 30°C. The secondary antibody (15 μl) was then included and the incubation prolonged for 2 hours. The polymers were separated from tubulin and antibodies by centrifugation in a 2 ml sucrose gradient (37–60%) for 1 hour at 180 000 g in a swinging rotor thermostated at 30°C. Microtubules were present in the first 0.1 ml fraction at the bottom of the gradient. Microtubules were diluted in PEM/Glycerol/GTP buffer to a protein concentration of 0.2 mg/ml, deposited onto Formvar-carbon coated grids and negatively stained with 2% uranyl acetate. Grids were examined using a Jeol 1200 EX electron microscope at an accelerating voltage of 80 kV.
Immunofluorescence microscopy
Primary cultures of hypothalamus cells were prepared by mechanoenzymatic dissociation of fetal (day 17) rat hypothalamus. Cells (106) were plated in 16 mm diameter culture dishes containing a 10 mm glass coverslip previously coated with poly-D-lysine (32). Cultures were maintained at 37°C in a 95% air, 5% CO2 atmosphere in a MEM medium containing 10% Nu serum, 0.6% glucose, 2 mM glutamine, 2.5 U/ml penicillin-streptomycin, adjusted to pH 7.3. Two days after seeding, the cells on the coverslip were fixed for 10 minutes in cold methanol (−20°C), gradually rehydrated with phosphate buffer saline (PBS). Cells were then incubated for 60 minutes with a mixture of anti-TOGp rabbit antiserum (1/200) and anti-tubulin monoclonal antibody (1/200) in PBS containing 1 mg/ml albumin. After a wash in PBS, an incubation was carried out in the same solution containing both FITC conjugated anti-rabbit antibodies and Texas-Red conjugated anti-mouse antibodies. Stained cells were mounted in 0.25% Airvol 205 in PBS and images were recorded using a 63XNA objective on a Leica inverted microscope.
RESULTS AND DISCUSSION
Purification of TOGp
The purification procedure is detailed in Materials and Methods. The elution profile of the DEAE Sepharose chromatography, which is the last step of the purification, is shown in Figure 1. TOGp is eluted from the column by increasing the ionic strength of the buffer with 0.1 M KCl (fraction T21 to fraction T32). Several TOGp immunoreactive proteins are present in the eluate as indicated in Figure 2A. In addition to the 200 kDa TOGp native form we observe two polypeptides of respectively 160 and 130 kDa. The amino acid sequencing of these polypeptides was performed following trypsin hydrolysis. Two internal peptides were detected in the 160 kDa hydrolysate, which were identical respectively to amino acids 213 to 220 and 1207 to 1221 in the TOGp sequence. One peptide identical to amino acids 213 to 220 was identified in the hydrolysate of the 130 kDa subform. This result confirms our previous observation (6) that the 130 and 160 kDa fragments were produced by the proteolytic degradation of TOGp. In addition, since the anti-TOGp antibodies are reactive against the central part of the protein (amino-acid 844 to amino acid 1230) it can be concluded that the 160 and 130 kDa forms correspond to the N-terminal moiety of TOGp. During our purification assays we have always detected these two subforms, whatever the purification procedure that we employed, there was a progressive hydrolysis of the native protein in the 160 then in the 130 kDa subform. A similar splitting was reported by Shirasu-Hiza et al. (33) during the purification of the TOGp related protein XMAP215.
Figure 1.
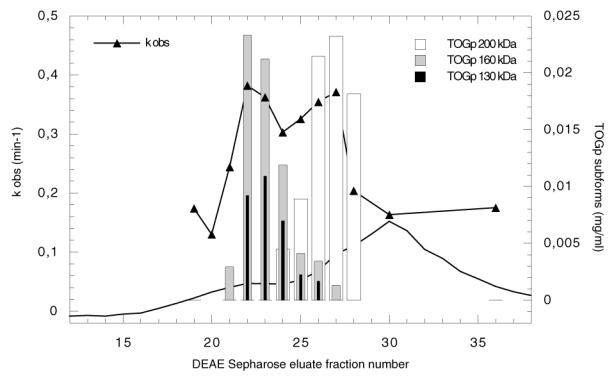
Purification of TOGp by ion exchange chromatography on DEAE Sepharose column. The experiment is performed in TEM buffer (Tris/HCl, 20 mM, pH 8.2, 1 mM EGTA, 1 mM Mg SO4, 1 μg/ml leupeptin). Proteins bound to the column are eluted with a 0 to 0.1 M KCl gradient in TEM buffer. The absorbance at 280 nm is indicated in arbitrary units (solid line). The apparent first order rate constant of microtubule elongation catalyzed by the eluate is determined as follows: a dialyzed sample (65 μl) of each fraction is incubated at 37°C with 20 μM tubulin in PEM buffer, 3.4 M glycerol, 5 mM Mg SO4, 1 mM GTP. The polymer formation is recorded at 350 nm for 30 min and the kobs expressed in min−1 is calculated from the kinetics. The concentration of the TOGp subforms is deduced from the densitometric analysis of the Western blots and from the total protein content of each chromatographic fraction. The difference in protein amount between fraction T22 and T20 is considered to represent the total amount of TOGp in fraction T22. This value is used to standardize the measure. The 130, 160 and 200 kDa TOGp subform concentrations are estimated in each fraction.
Figure 2.
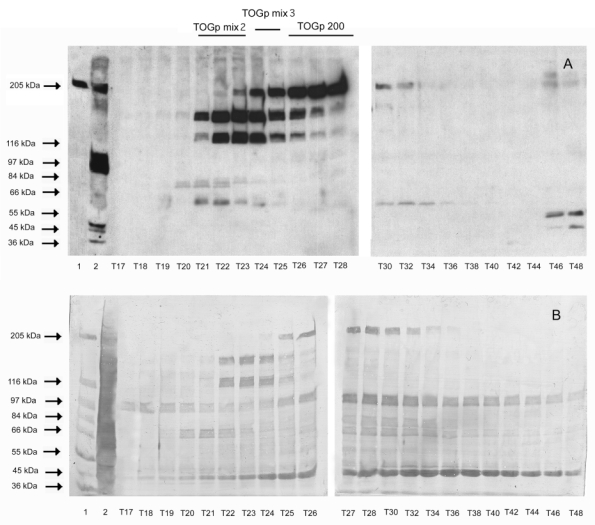
Electrophoretic pattern of protein fractions eluted from the DEAE Sepharose column by a 0 to 0.1 M KCl gradient in TEM buffer. (A) Western blots revealed by anti-TOGp polyclonal antibodies. (B) Electrophoresis transferred on a PVDF membrane stained with Amido black. Lane 1, standard molecular-mass proteins. Lane 2, 125 000 g pig brain supernatant (400 μg). Lane 3 to lane 24, DEAE eluted fractions (100 μl each), the fraction numbers are identical to those indicated in figure 1. Fractions T21 to T23, T24 to T25 and T26 to T29, which contain respectively the 130 and 160 kDa forms, a mixture of the three TOGp variants and the native 200 kDa subform are brought together. For simplification they are termed respectively TOGp mix2, TOGp mix3 and TOGp 200.
In order to decrease the proteolytic degradation of TOGp throughout our purification procedure, we included various protease inhibitors within the buffers. We added PMSF, pepstatin A, leupeptin, aprotinin and MG115, a proteasome inhibitor. We noticed that leupeptin (1 μg/ml) was able to slightly delay the degradation process, although it did not stop totally this phenomenon.
Following unspecific protein staining of the blot (Figure 2B), we see that the TOGp fractions eluted from the DEAE Sepharose column are contaminated by various proteins. The two main contaminants have apparent molecular masses respectively of 40 and 90 kDa. By mass spectrometry, we have identified dynamin (score 173, peptides matched 42) and glutamine synthetase (score 75, peptides matched 11) in the two protein spots. Dynamin (34) is a GTPase involved in endocytosis. It has been viewed in the past as a mechanochemical enzyme that pinches vesicles from the plasma membrane, but more recently, it has been proposed as a classical regulator that recruits effectors of endocytosis. Glutamine synthetase (35) is a protein of the vertebrate nervous system which plays a central role in the detoxification of brain ammonia and in the metabolic regulation of the neurotransmitter glutamate. We tried to eliminate these low molecular components by gel filtration on a Sephacryl S300 column. We finally suppressed this step, which decreased dramatically the yield of the preparation without improving significantly the purity of TOGp.
The ability of TOGp to catalyse tubulin polymerisation was measured in the fractions eluted from the DEAE column (Figure 1). The biological function of TOGp will be investigated more thoroughly in the next chapters. We report here the influence of identical aliquots of the DEAE fractions on the in vitro polymerisation of a given amount of tubulin at 37°C. The values of the pseudo first order rate constant of microtubule elongation (kobs) are indicated in the figure. Fractions 19 and 36 can be considered as controls, since they are TOGp free and contain only the protein contaminants of the preparation. From the figure, we see that the rate constant increases in the fractions containing the TOGp immunoreactive proteins. The kobs reaches maximal values in fractions T22 and T23 and in fractions T26 and T27. These fractions correspond respectively to the peak value of the 130 and 160 TOGp polypeptides and to the maximum value of the 200 kDa native form. In addition we observed that the stimulation of tubulin polymerization by these fractions could be totally suppressed by anti-TOGp antibodies (Figure 3).
Figure 3.
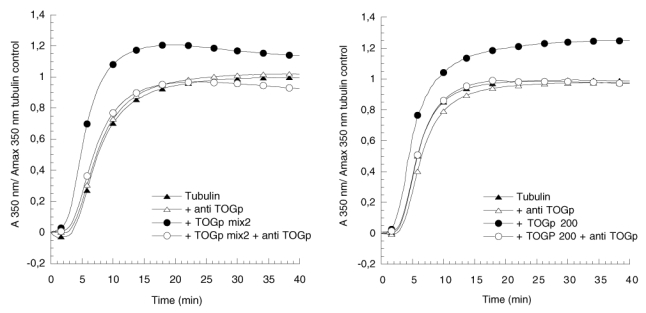
Immuno-inhibition by anti-TOGp antibodies of tubulin assembly induced by the DEAE sepharose fraction TOGp mix2 (left graph) or TOGp 200 (right graph). Tubulin assembly is recorded continuously in function of time by measuring the increase in absorbance at 350 nm. Tubulin (12 μM) is polymerized in PEM buffer (solid triangle), an identical experiment is conducted in the presence of 2 μl of anti-TOGp anti serum (empty triangle). Tubulin (12 μM) is polymerized with purified TOGp (30 nM TOGp mix2 or 20 nM TOGp 200) (solid circle), a similar experiment is conducted in the presence of 2 μl of anti-TOGp anti serum (empty circle).
The DEAE column chromatography leads to a partial resolution of the immunoreactive TOGp polypeptides, the 160 and 130 kDa forms are collected in fractions T21 to T23, fractions T24 and T25 contain a mixture of the 200, 160 and 130 isoforms and the 200 kDa native form is principally eluted in fractions T26 to T29. These chromatographic fractions were pooled according to their composition. For simplification, in the next part of this paper, they will be termed respectively TOGp mix2, TOGp mix3 and TOGp 200 as indicated in Figure 2. Although we could not eliminate totally some protein contaminants from our preparation, it is important to note that the biological function of TOGp is preserved. Moreover, the 130 and 160 kDa cannot be simply considered as degraded side products of the purification since they possess a significant enzymatic activity on tubulin assembly.
Effect of TOGp on tubulin polymerization; Effect of tubulin concentration
We asked first if TOGp targets nucleation, elongation or both steps in tubulin polymerization. In view to answer this question we determined the critical concentration of tubulin M∞, and the nucleus size parameters p and q, as defined above, in the presence of purified TOGp. In these investigations we used the DEAE purified fraction TOGp 200 (T26 to T29). Parallel experiments were performed with two drugs, taxol and colchicine, known for their opposite effect on tubulin polymerization.
The variation of turbidity in function of time was recorded with various tubulin concentrations (Figure 4). The initial tubulin concentration was plotted versus the absorbance maximum at 350 nm. There is a linear relationship between the two values. When extrapolated to absorbance 0, we can determine the critical concentration of tubulin M∞ on the y axis. This value indicates the minimum amount of tubulin necessary to obtain polymerization. As mentioned above, it is equal to 1/K (K being the equilibrium association constant). It can be calculated from the figure that the value of the equilibrium constant is 0.19 106 M−1 with control tubulin polymerized in 0.5% DMSO while it is slightly less elevated in the absence of DMSO (0.1 106 M−1). DMSO which is employed to solubilize taxol and colchicine is known to activate tubulin aggregation (36). In view to obtain comparative results, we adjusted the final concentration of DMSO to 0.5% in all the experiments. In the presence of 25 nM of TOGp, the equilibrium constant K increases to 1.4 106 M−1. We noticed that 1 μM taxol has about the same effect, in contrast 1 μM colchicine decreases the constant to 0.12 106 M−1. From these results, it is obvious that TOGp strongly favours tubulin subunits association. We observed a similar influence of taxol, however, the molar concentration of drug required to obtain a comparable effect is forty fold more elevated than the concentration of TOGp.
Figure 4.
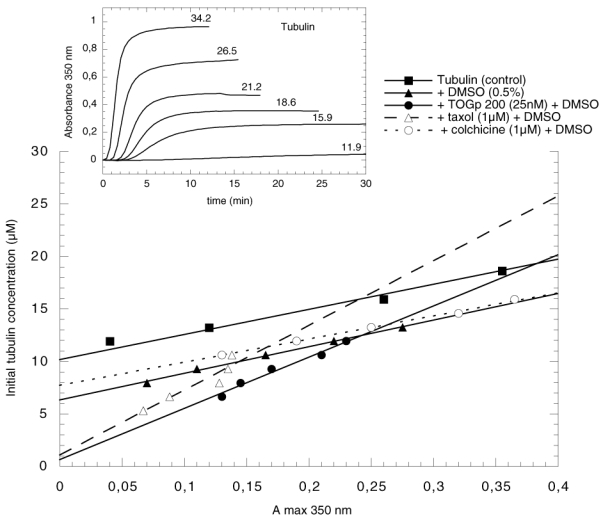
Estimation of the tubulin critical concentration. Various amounts of tubulin are polymerized at 37°C as indicated in Material and Methods. The curves of assembly of the tubulin control are shown in the inset. The absorbance maximum at 350 nm determined at the end of the polymerization is plotted versus the initial tubulin concentration. The experiment is realised successively with 25 nM TOGp 200, 1 μM taxol and 1 μM colchicine in the presence of 0.5% DMSO (this solvent is required to solubilize taxol and colchicine). The control with tubulin alone is performed both in the presence or in the absence of 0.5% DMSO. Tubulin amount extrapolated through the points to absorbance 0 gives the value of the critical concentration.
As explained above, we determined the two parameters p and q in view to characterize the nucleus size. The results are indicated in figure 5 and 6. There is no clear modification of factor q in the presence of TOGp, it is only slightly decreased by 1 μM taxol. In contrast parameter p, which is equal to 4 in the control tubulin sample, is divided by two when TOGp was added. It is noteworthy that taxol further decreases this parameter to 1 and that colchicine has no incidence on p. In consequence, TOGp seems to influence nucleation by decreasing the nucleus size. It should be noticed that the values of p and q, that we obtained in the absence of DMSO, are respectively close to 5 and 3 as found by Flyvbjerg et al. (25).
Figure 5.
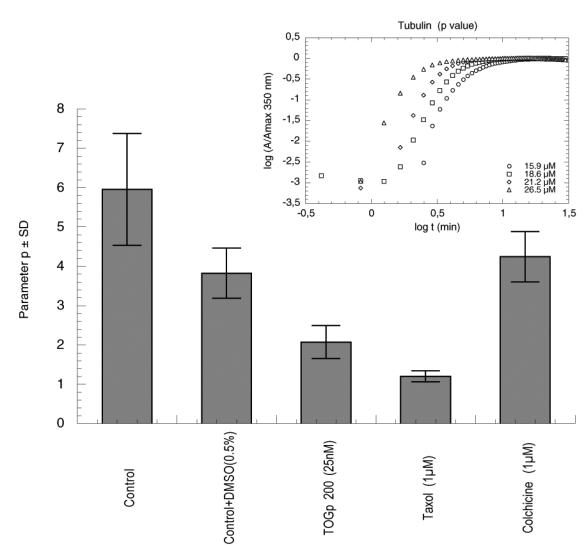
Nucleus size estimated by parameter p as defined by Flyvbjerg et al. (25). Various amounts of tubulin are polymerized at 37°C in the conditions described in Material and Methods. The absorbance at 350 nm (A) is recorded in function of time (t) and parameter p is determined by plotting log A/Amax against log t. At early times the two variables display a straight line of slope p independent of the initial tubulin concentration. The inset shows the plot for tubulin control. Parameter p ± standard deviation is determined successively with 25 nM TOGp 200, 1 μM taxol and 1 μM colchicine in a solution containing 0.5% DMSO. The control with tubulin alone is performed both in the presence and in the absence of 0.5% DMSO.
Figure 6.
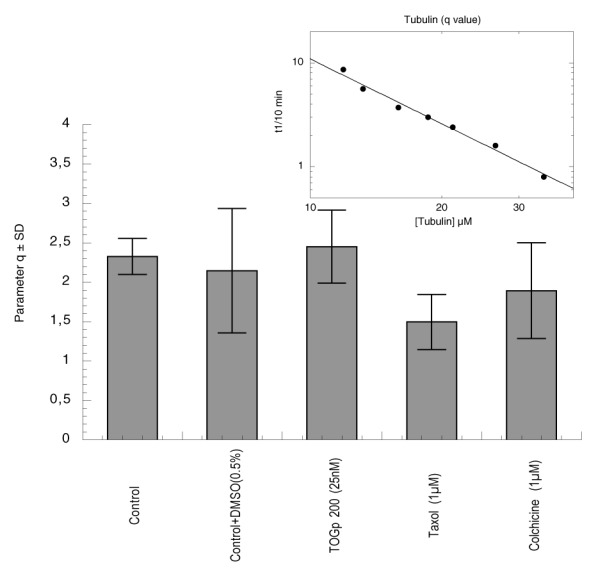
Nucleus size estimated by parameter q as defined by Oosawa and Kasai (17). Various amounts of tubulin are polymerized at 37°C. Parameter q is determined by the log-log plot of the tenth time of the reaction against the initial tubulin concentration. The inset shows the determination of this parameter for tubulin control. Parameter q ± standard deviation is determined successively with 25 nM TOGp 200, 1 μM taxol and 1 μM colchicine in a solution containing 0.5% DMSO. The control with tubulin alone is realised both in the presence and in the absence of 0.5% DMSO.
Parameters p and q are linked to the nucleus size, however, in function of the polymerization model they can be interpreted differently. In the case of actin (17, 21), parameter q is equal to the half-value of the number of monomers included in the nucleus. In the case of tubulin, parameter q is considered by Voter and Erickson (24) as proportional to the number of monomers present in the first nucleus. In contrast, in the paper of Flyvbjerg et al. (25), q indicates the number of monomers added at each step of the nucleation phase, while p is linked to the number of successive steps. In tubulin polymerization models, each of these parameters was attributed to a specific dimension of the nucleus. They are not simply indicative of the number of nucleus monomers, as in the case of actin. Moreover, recently (23) it was suggested that the nucleus should not correspond to a strictly defined structure but should be an average between many alternative association pathways. Nevertheless, TOGp decreases significantly the value of parameter p and influences the microtubule nucleation step. In function of the theoretical model, we can conclude that TOGp could either decrease the nucleus size or simplify the nucleus association process.
Effect of TOGp on tubulin polymerization. Effect on GTP hydrolysis
We followed the liberation of inorganic phosphate (Pi) as a function of time during tubulin assembly. The effect of TOGp was compared to the effect of colchicine and taxol, which are known to have opposite influence on tubulin GTPase activity (37, 38, 39). In these experiments, we employed alternatively the three DEAE Sepharose purified fractions of TOGp: TOGp mix2, TOGp mix3 and TOGp 200.
Tubulin dimers bind two moles of GTP, one exchangeable in β-tubulin and the other nonexchangeable in α-tubulin. GTP bound to the exchangeable site becomes hydrolyzed following incorporation of the tubulin dimer into the microtubule. According to Carlier and Pantaloni (40), when tubulin was polymerized in vitro, there was a “burst” of Pi liberation accompanying tubulin polymerization, then the rate of GTP hydrolysis slowed down and reached a stable steady-state rate only about 15–20 min after the reaction was started.
We observed that the kinetics of GTP hydrolysis, expressed as inorganic phosphate (Pi) released, exhibited minimal differences in the presence of the TOGp isoforms or drugs by reference to the tubulin control (data not shown). We noticed that Pi liberated during the burst (10 to 12 μM), was roughly equal to the concentration of tubulin-GTP dimers present at the beginning of the reaction (13.2 μM).
We determined the amount of tubulin polymer produced at the steady state of the reaction by centrifugation at 36000 g. The amount of Pi liberated in function of time was expressed versus the final amount of polymer (figure 7). The results we obtained with colchicine and taxol (Figure 7A), are in good accordance with those previously published (37, 39). As it can be seen on the ordinate axis, the production of an equivalent quantity of polymer in the presence of 4 μM colchicine necessitates 2 times more GTP than in the tubulin control sample. In contrast, the hydrolysis of GTP is slightly reduced in the presence of 1 μM taxol. The kinetics that we obtained with the 3 purified fractions of TOGp are situated between those of tubulin control and taxol. We have calculated the reaction rates of GTP hydrolysis during the steady state part of the kinetics, from time 15 to time 45 min. The results are indicated in Figure 7B. By reference to tubulin we see that the 200 kDa isoform (TOGp 200) significantly slows down GTP hydrolysis. From an energetic point of view, it seems that the native 200 kDa protein renders tubulin polymerization more economical. We do not see a similar decrease with TOGp mix3 and TOGp mix2, which contain the 130 and 160 kDa isoforms.
Figure 7.
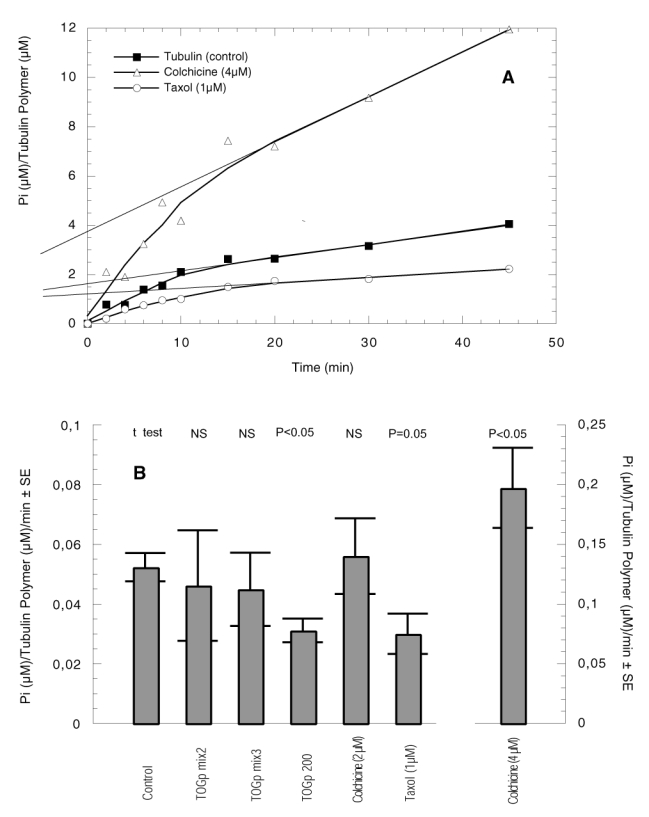
GTPase activity of tubulin associated with microtubule assembly. Tubulin (13.2 μM) is assembled in PEM buffer, 3.4 M glycerol, 5 mM Mg SO4, 0.1 mM GTP. The reaction is performed successively with TOGp mix2, TOGp mix3, TOGp 200 (25 nM each), colchicine (2 and 4 μM) and taxol (1 μM). The mixture is incubated at 37° C, at various time intervals a 50 μl aliquot is withdrawn and the reaction is stopped in boiling water. The precipitated proteins are eliminated by centrifugation and inorganic phosphate (Pi) is measured in the supernatant by Amplex Red reagent as indicated in Material and Methods. The amount of polymer produced at the steady state of the reaction is determined following centrifugation at 36000 g of an aliquot of the medium incubated for 45 min at 37°C. (A), GTPase activity from time 0 to time 45 min for control, 4 μM colchicine and 1 μM taxol. The results are expressed in μM of Pi released per μM of final tubulin polymer. The amount of Pi liberated during the burst of the reaction is visible on the ordinate axis. (B), GTPase activity during the steady state of the reaction (from time 15 to time 45 min) with various effectors. The results are expressed in μM of Pi liberated per μM of final polymer per min ± standard error. The Student t-test is calculated with the tubulin control as reference value.
Tubulin dimers could adopt two conformations. When β-tubulin is liganded with GTP, tubulin is in a “straight” conformation, while upon GTP hydrolysis, the tubulin dimer tends to adopt a “curved” conformation, favouring depolymerization (41, 42). It was deduced that GTP hydrolysis renders the microtubule lattice more unstable. During the steady-state, when the polymerization equilibrium is reached, the constant GTPase activity reflects the cyclic addition and release of tubulin dimers at the ends of the microtubules (43). In consequence, the decrease in GTP hydrolysis induced by the 200 kDa TOGp isoform is indicative that TOGp favours microtubule cohesion and antagonizes depolymerization. It can be outlined that we obtain a similar effect with 1 μM taxol, which is known to inhibit depolymerization.
Effect of TOGp amount on tubulin polymerization; Comparison with protein tau
We have seen in the previous paragraphs that the purified TOGp 200 kDa subform favours the nucleation process as well as the association of tubulin dimers on growing microtubules, moreover, we have evidenced that this protein antagonizes depolymerization. In view to determine its intrinsic activity on tubulin polymerization, we have compared its concentration effect with protein tau, a classical MAP of the nervous system, as well as with colchicine and taxol. The results are presented in Figure 8. A constant amount of tubulin (15 μM) is incubated in the presence of increasing amounts of MAP or drug. The polymer formation was recorded at 350 nm. The Amax, , t1/10 and kobs were calculated from the kinetic curves as indicated in Material and Methods.
Figure 8.
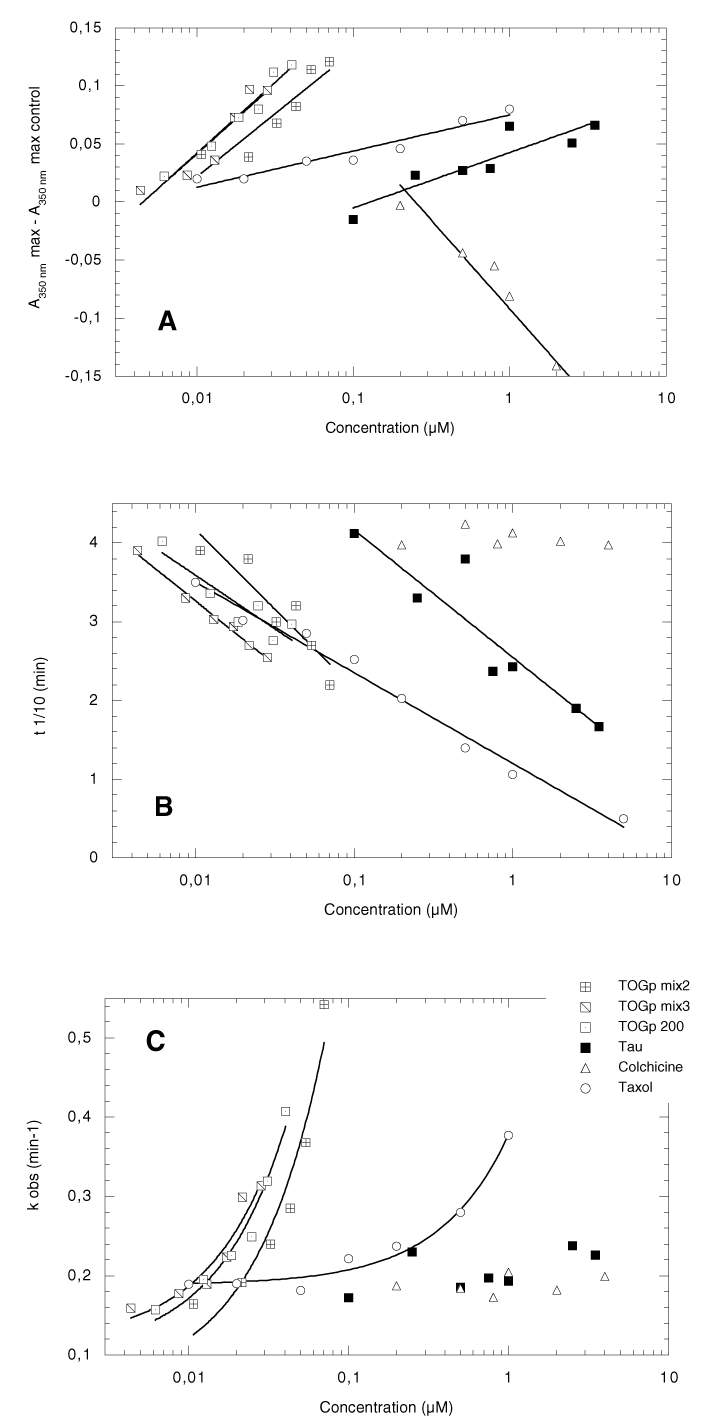
Dose effect of TOGp, tau and drugs on the kinetic parameters of tubulin assembly. The experiments are run in PEM buffer, 3.4 M glycerol, 1 mM GTP containing 15 μM tubulin and various amounts of MAPs or drugs. The absorbance at 350 nm (A350 nm) is recorded in function of time. The values of A350nm max, t1/10 and k0bs are calculated from the sigmoid kinetic curves as indicated in Material and Methods. The experiments are realised successively in the presence of increasing concentrations of TOGp mix2, TOGp mix3, TOGp 200, protein tau, colchicine and taxol. The different parameters are expressed versus the amount of effector on a logarithmic scale. (A), the ordinate axis represents the values of the absorbance maximum minus the absorbance maximum with no effector. (B) and (C) show respectively the values of the tenth time (t1/10) and the values of the pseudo first order rate constant (kobs) of the reaction.
The variation in final polymer amount by reference to a blank containing tubulin alone, is plotted versus the concentration of the effector (figure 8A). In these assays, we employed alternatively TOGp 200, TOGp mix3 and TOGp mix2. Figure 8A clearly indicates that the three purified fractions of TOGp increases the total amount of polymer. They are active within the concentration range 5 to 70 nM of TOGp. We can estimate that the half maximal effect is obtained with 25 nM of protein. In contrast the half maximal effect of tau is roughly 1 μM indicating that the TOGp isoforms are approximately 40 times more active than protein tau. In addition it is noteworthy that TOGp mix3 and TOGp 200 which both contain the 200 kDa native TOGp isoform are the most active fractions.
The effect of TOGp can be estimated as well from the measurement of the tenth time of the reaction, which is characteristic of the nucleation phase. As indicated in figure 8B, the 3 TOGp fractions, tau and taxol decrease the tenth time of polymerization in a dose dependent manner, while colchicine, which induces microtubule depolymerization, has no effect on this parameter. When the results obtained with the TOGp isoforms and tau are compared, we can see that an equivalent decrease in the tenth time necessitates about 20 times more tau than TOGp. Taxol has the greatest influence in lowering the tenth time, however, its half maximal effect is obtained at higher concentration (200 nM) than with the TOGp fractions (20 to 30 nM)
The kobs (fig 8C) is strongly increased by TOGp at low concentration, indicating that this MAP takes an active part in the elongation process of microtubules. TOGp 200 and TOGp mix3 fractions are slightly more efficient than the TOGp mix2 fraction, which contains principally the 130 and 160 isoforms. Taxol is active at higher doses than TOGp, in contrast, protein tau has a much moderate influence on this parameter.
In conclusion, the three TOGp isoforms exert a strong effect on in vitro tubulin polymerization, an equivalent effect with protein tau is seen at more elevated concentration. TOGp accelerates the nucleation and the elongation processes and increases the final amount of polymer. In addition, we see that the purified fractions containing the 200 kDa TOGp isoform, are slightly more active than the fraction containing the two other isoforms. The three TOGp related polypeptides that we obtained at the end of our purification procedure differ by their C-terminal part. Their biochemical activity on tubulin polymerization is very similar, indicating that the N-terminal moiety of the protein plays a fundamental role in the catalysis of tubulin assembly. On the other hand, the C-terminal part may exert some control on this activity, since the native 200 kDa isoform is slightly more active than the 160 and 130 kDa polypeptides.
It is reported in literature (44) that half-maximal polymerization occurs respectively at 0.33 μM and 2.5 μM for MAP2 and tau, and that microtubules formed in the presence of these MAPs contain respectively 1 mol MAP2/5mol tubulin and 1 mol tau/4 mol tubulin. Since MAP2 and tau have been shown to promote tubulin polymerization stoichiometrically rather than catalytically, this protein group is often considered as a structural MAP family. Our experiments show that TOGp, which is active at low doses and which activates tubulin polymerization at various steps of the biochemical pathway, is clearly distinct from this group of MAPs.
TOGp localization on microtubules
By performing electron microscopy of immunogold labelled microtubules (Figure 9) we saw that TOGp was located both along the microtubule fibers and at microtubule ends. We measured, on a group of microtubules (n=186) with visible extremities, the occurrence of gold spots every 50 nm along the length of the fibers. The first 50 nm fragment was placed at the microtubule termini and the last one 1000 nm away. We found 14 gold decorated ends versus 172 unlabelled ones. On the other hand, we counted on the microtubule walls 46 gold spots versus 2986 unlabelled 50 nm fragments. According to the Fisher’s exact test the two groups are significantly different (p < 0.001). It can be argued that this calculation is impaired by the fact that the population of short microtubules is more elevated than the population of long microtubules of more than 1000 nm in length. If the number of gold spots is normalized to 100 microtubules, the probability according to the Fisher’s test slightly increases to 0.001. Nevertheless, the two estimations suggest a higher affinity of TOGp for microtubule ends than for microtubule walls. In order to localize TOGp on “native” microtubules, we double stained primary cultures of rat hypothalamus cells (Figure 10) with anti-tubulin and anti-TOGp antibodies. The cytoskeleton is abundant and well developed in the interphasic cytoplasm of these cells. By immunofluorescence microscopy, we saw that TOGp was located in a punctuate pattern all along the microtubules fibers.
Figure 9.
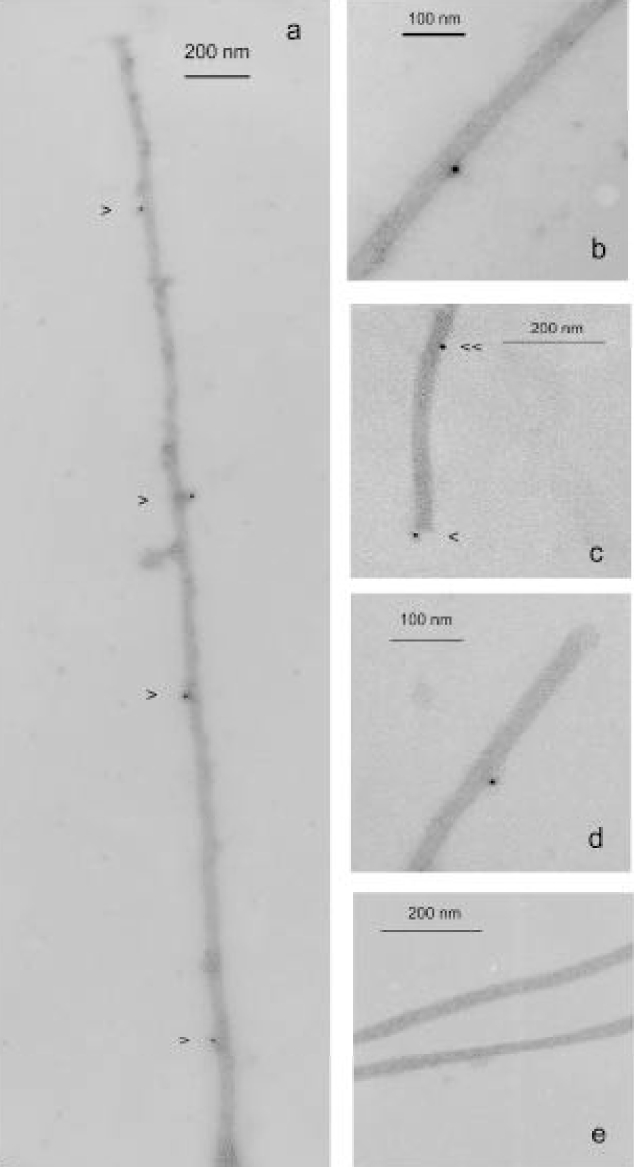
Electron microscopy of negatively-stained microtubules assembled in the presence (a, b, c and d) or in the absence (e) of TOGp 200 by incubation of tubulin with 1 mM GTP for 30 min at 37°C. Tubulin polymers are first treated with anti-TOGp antibodies then with immunogold labelled anti-rabbit IgG, alternatively 5 nm (a, c, and d) and 15 nm (b) gold particles labelled antibodies are used. Samples diluted 1/20 in PEM buffer, 3.4 M glycerol, 0.1 mM GTP are loaded on the microscope grid and stained with 2% uranyl acetate.
Figure 10.
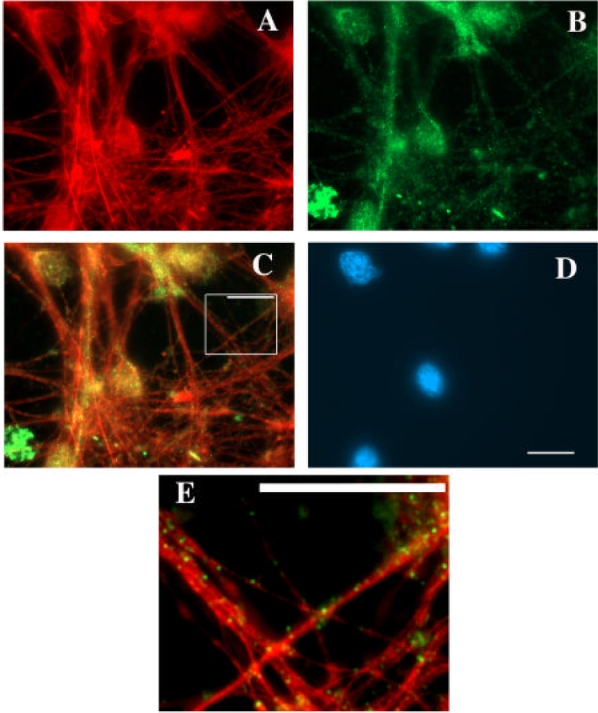
Localization of TOGp along microtubules in cultured hypothalamic neurones. Pictures obtained after methanol fixation and staining with mouse anti-tubulin antibodies (panel A), with rabbit anti-TOGp antisemm (panel B) and merged picture (panel C). Panel D shows the Hoechst staining of nuclear DNA. Panel E represents a magnified part of panel C, the blown-up portion is framed on panel C. The scale bars are equal to 10 μm.
It was reported by us in a previous study (6), that TOGp co-localizes with centrosomes and spindles in mitotic cells and that TOGp co-sediments with taxol-stabilized microtubules in vitro. It was later evidenced (7) by the use of cloned truncated fragments, that both full-length and the N-terminal part of TOGp bind along the length of individual protofilaments with a great affinity for microtubule ends. Within dividing cells, it was shown that the major function of TOGp was to maintain centra some integrity by focusing microtubule minus-ends at spindle poles (9).
Msps protein from Drosophila associates with microtubules in vitro. In the embryonic division cycles Msps localizes to the centrosomal region at all mitotic stages and spreads over the spindles during metaphase and anaphase (10). DdCP224 from Dictyotelium discoideum was detected at the centrosome, and more weakly along microtubules throughout the entire cell cycle, furthermore, it binds to microtubules in vitro (11). XMAP215 from Xenopus promotes the formation of long microtubules by increasing the rate of microtubule polymerization, particularly at the plus end (4, 45). Expression of truncated segments of XMAP215 in vivo (46) showed that the entire protein participates in microtubule binding.
In all species examined so far, TOGp orthologs have been found on microtubules and centrosomes in all stages of the cell cycle (46, 47). From our investigations on the kinetics of tubulin assembly, we have shown that TOGp induces a stimulation of microtubule growth and a reduction of depolymerization. Both effects could be easily explained by the localization of TOGp at microtubule ends. The affinity of TOGp for microtubule ends in vitro was previously reported by Spittle et al. (7). Moreover, TOGp related proteins in other species have been principally detected in vivo at centrosome and spindle poles, confirming a function of this protein family on the extremities of tubulin polymers. Within the cell the location of these MAPs is complicated by the presence of interacting proteins. It has been reported that the attachment of TOGp isoforms to microtubule terminal organelles should involve the participation of other cell components. In this sense, spindle-kinetochore attachment in fission yeast requires the combined action of two kinesin KIp5 and KIp6, with Alp 14 and Dis1, which are two MAPs of the TOGp family (48). Moreover, D-TACC, the Drosophila form of transforming acid coiled-coil protein, maintains Msps at centrosomes and helps it to bind to microtubule minus-ends and plus-ends as microtubules grow out of the centrosome (49, 50). By electron microscopy of immunogold labelled microtubules, we confirmed the affinity of TOGp for microtubule ends, however, this attachment is not exclusive since we detected TOGp molecules on microtubule walls both in vitro and in vivo.
In conclusion, we have tested the influence of TOGp on tubulin polymerization in vitro by investigating the kinetic parameters of the reaction. Three subforms of TOGp were isolated from brain tissue: the native 200 kDa protein and two polypeptides of 160 and 130 kDa, resulting of the proteolytic splitting of C-terminal fragments of the protein. The 200 kDa TOGp form has a strong effect on microtubules formation. It favours the nucleation phase, increases the association constant of tubulin subunits on elongating microtubules and antagonizes depolymerization during the steady state of the reaction. The native 200 kDa, as well as the 160 and 130 kDa polypeptide fragments, enhance the total amount of polymer, decrease the tenth time of the reaction and augment the rate constant of elongation. However, the purified fraction containing the 200 kDa polypeptide is more efficient than the fraction containing the hydrolysed forms.
The study of tubulin polymerization under controled conditions led us to determine a set of kinetic parameters allowing a better understanding of TOGp action. This method could be extended in the future to other microtubule protein effectors added individually or in conjunction with TOGp. More interestingly, these investigations should facilitate a screening of drugs targeting the interaction TOGp-microtubule with the aim to uncover new microtubule active drugs.
Acknowledgments
We are grateful to L. Cassimeris (Lehigh University, Bethlehem, PA) for many useful comments on the manuscript. We thank J. Derancourt (CRBM, Montpellier) for peptide sequencing, P. Jouin and N. Galéotti (IGF, Montpellier) for mass spectrometry analysis. We greatly acknowledge the Veterinarian and the employees from the Abattoir of Alès (France) for their help in pig brains collection. We also thank S. Arancibia (Université Montpellier II) for providing cultures of rat hypothalamus cells and J. Piette (EMI229, Montpellier) for critical reading of the manuscript.
References
- 1.Hunter AW, Caplow M, Coy DL, Hancock WO, Diez S, Wordeman L, Howard J. Mol Cell. 2003;11:445–457. doi: 10.1016/s1097-2765(03)00049-2. [DOI] [PMC free article] [PubMed] [Google Scholar]
- 2.Walczak CE, Mitchison TJ, Desai A. Cell. 1996;84:37–47. doi: 10.1016/s0092-8674(00)80991-5. [DOI] [PubMed] [Google Scholar]
- 3.Belmont LD, Mitchison TJ. Cell. 1996;84:623–631. doi: 10.1016/s0092-8674(00)81037-5. [DOI] [PubMed] [Google Scholar]
- 4.Gard DL, Kirschner MW. J Cell Biol. 1987;105:2203–2215. doi: 10.1083/jcb.105.5.2203. [DOI] [PMC free article] [PubMed] [Google Scholar]
- 5.Charrasse S, Mazel M, Taviaux S, Berta P, Chow T, Larroque C. Eur J Biochem. 1995;234:406–413. doi: 10.1111/j.1432-1033.1995.406_b.x. [DOI] [PubMed] [Google Scholar]
- 6.Charrasse S, Schroeder M, Gauthier-Rouviere C, Ango F, Cassimeris L, Gard DL, Larroque C. J Cell Sci. 1998;111:1371–1383. doi: 10.1242/jcs.111.10.1371. [DOI] [PubMed] [Google Scholar]
- 7.Spittle C, Charrasse S, Larroque C, Cassimeris L. J Biol Chem. 2000;275:20748–20753. doi: 10.1074/jbc.M002597200. [DOI] [PubMed] [Google Scholar]
- 8.Dionne MA, Sanchez A, Compton DA. J Biol Chem. 2000;275:12346–12352. doi: 10.1074/jbc.275.16.12346. [DOI] [PubMed] [Google Scholar]
- 9.Cassimeris L, Morabito J. Mol Biol Cell. 2004;15:1580–1590. doi: 10.1091/mbc.E03-07-0544. [DOI] [PMC free article] [PubMed] [Google Scholar]
- 10.Cullen CF, Deak P, Glover DM, Ohkura H. J Cell Biol. 1999;146:1005–1018. doi: 10.1083/jcb.146.5.1005. [DOI] [PMC free article] [PubMed] [Google Scholar]
- 11.Gräf R, Daunderer C, Schliwa M. J Cell Sci. 2000;113:1747–1758. doi: 10.1242/jcs.113.10.1747. [DOI] [PubMed] [Google Scholar]
- 12.Whittington AT, Vugrek O, Wei KJ, Hasenbein NG, Sugimoto K, Rashbrooke MC, Wasteneys GO. Nature. 2001;411:610–613. doi: 10.1038/35079128. [DOI] [PubMed] [Google Scholar]
- 13.Matthews LR, Carter P, Thierry-Mieg D, Kemphues K. J Cell Biol. 1998;141:1159–1168. doi: 10.1083/jcb.141.5.1159. [DOI] [PMC free article] [PubMed] [Google Scholar]
- 14.Ohkura H, Adachi Y, Kinoshita N, Niwa O, Toda T, Yanagida M. Embo J. 1988;7:1465–1473. doi: 10.1002/j.1460-2075.1988.tb02964.x. [DOI] [PMC free article] [PubMed] [Google Scholar]
- 15.Garcia MA, Vardy L, Koonrugsa N, Toda T. Embo J. 2001;20:3389–3401. doi: 10.1093/emboj/20.13.3389. [DOI] [PMC free article] [PubMed] [Google Scholar]
- 16.Wang PJ, Huffaker TC. J Cell Biol. 1997;139:1271–1280. doi: 10.1083/jcb.139.5.1271. [DOI] [PMC free article] [PubMed] [Google Scholar]
- 17.Oosawa F, Kasai M. J Mol Biol. 1962;4:10–21. doi: 10.1016/s0022-2836(62)80112-0. [DOI] [PubMed] [Google Scholar]
- 18.Wegner A, Engel J. Biophys Chem. 1975;3:215–225. doi: 10.1016/0301-4622(75)80013-5. [DOI] [PubMed] [Google Scholar]
- 19.Erickson HP, Pantaloni D. Biophys J. 1981;34:293–309. doi: 10.1016/S0006-3495(81)84850-3. [DOI] [PMC free article] [PubMed] [Google Scholar]
- 20.Hall D. Biophys Chem. 2003;104:655–682. doi: 10.1016/s0301-4622(03)00040-1. [DOI] [PubMed] [Google Scholar]
- 21.Tobacman LS, Korn ED. J Biol Chem. 1983;258:3207–3214. [PubMed] [Google Scholar]
- 22.Houmeida A, Bennes R, Benyamin Y, Roustan C. Biophys Chem. 1995;56:201–214. doi: 10.1016/0301-4622(95)00038-y. [DOI] [PubMed] [Google Scholar]
- 23.Caudron N, Arnal I, Buhler E, Job D, Valiron O. J Biol Chem. 2002;277:50973–50979. doi: 10.1074/jbc.M209753200. [DOI] [PubMed] [Google Scholar]
- 24.Voter WA, Erickson HP. J Biol Chem. 1984;259:10430–10438. [PubMed] [Google Scholar]
- 25.Flyvbjerg H, Jobs E, Leibler S. Proc Natl Acad Sci U S A. 1996;93:5975–5979. doi: 10.1073/pnas.93.12.5975. [DOI] [PMC free article] [PubMed] [Google Scholar]
- 26.Williams RC, Jr, Lee JC. Methods Enzymol. 1982;85(Pt B):376–385. doi: 10.1016/0076-6879(82)85038-6. [DOI] [PubMed] [Google Scholar]
- 27.Cleveland DW, Hwo SY, Kirschner MW. J Mol Biol. 1977;116:207–225. doi: 10.1016/0022-2836(77)90213-3. [DOI] [PubMed] [Google Scholar]
- 28.Laemmli UK. Nature. 1970;227:680–685. doi: 10.1038/227680a0. [DOI] [PubMed] [Google Scholar]
- 29.Rosenfeld J, Capdevielle J, Guillemot JC, Ferrara P. Anal Biochem. 1992;203:173–179. doi: 10.1016/0003-2697(92)90061-b. [DOI] [PubMed] [Google Scholar]
- 30.Johnson KA, Borisy GG. J Mol Biol. 1977;117:1–31. doi: 10.1016/0022-2836(77)90020-1. [DOI] [PubMed] [Google Scholar]
- 31.Sternlicht H, Ringel I. J Biol Chem. 1979;254:10540–10550. [PubMed] [Google Scholar]
- 32.Rage F, Benyassi A, Arancibia S, Tapia-Arancibia L. Endocrynology. 1992;130:1056–1062. doi: 10.1210/endo.130.2.1346378. [DOI] [PubMed] [Google Scholar]
- 33.Shirasu-Hiza M, Coughlin P, Mitchison T. J Cell Biol. 2003;161:349–358. doi: 10.1083/jcb.200211095. [DOI] [PMC free article] [PubMed] [Google Scholar]
- 34.Sever S. Curr Opin Cell Biol. 2002;14:463–467. doi: 10.1016/s0955-0674(02)00347-2. [DOI] [PubMed] [Google Scholar]
- 35.Suarez I, Bodega G, Fernandez B. Neurochem Int. 2002;41:123–142. doi: 10.1016/s0197-0186(02)00033-5. [DOI] [PubMed] [Google Scholar]
- 36.Robinson J, Engelborghs Y. J Biol Chem. 1982;257:5367–5371. [PubMed] [Google Scholar]
- 37.David-Pfeuty T, Simon C, Pantaloni D. J Biol Chem. 1979;254:11696–11702. [PubMed] [Google Scholar]
- 38.Lin CM, Hamel E. J Biol Chem. 1981;256:9242–9245. [PubMed] [Google Scholar]
- 39.Carlier MF, Pantaloni D. Biochemistry. 1983;22:4814–4822. doi: 10.1021/bi00289a031. [DOI] [PubMed] [Google Scholar]
- 40.Carlier MF, Pantaloni D. Biochemistry. 1981;20:1918–1924. doi: 10.1021/bi00510a030. [DOI] [PubMed] [Google Scholar]
- 41.Mandelkow EM, Mandelkow E, Milligan RA. J Cell Biol. 1991;114:977–991. doi: 10.1083/jcb.114.5.977. [DOI] [PMC free article] [PubMed] [Google Scholar]
- 42.Müller-Reichert T, Chretien D, Severin F, Hyman AA. Proc Natl Acad Sci U S A. 1998;95:3661–3666. doi: 10.1073/pnas.95.7.3661. [DOI] [PMC free article] [PubMed] [Google Scholar]
- 43.David-Pfeuty T, Erickson HP, Pantaloni D. Proc Natl Acad Sci U S A. 1977;74:5372–5376. doi: 10.1073/pnas.74.12.5372. [DOI] [PMC free article] [PubMed] [Google Scholar]
- 44.Sandoval IV, Vandekerckhove JS. J Biol Chem. 1981;256:8795–8800. [PubMed] [Google Scholar]
- 45.Vasquez RJ, Gard DL, Cassimeris L. J Cell Biol. 1994;127:985–993. doi: 10.1083/jcb.127.4.985. [DOI] [PMC free article] [PubMed] [Google Scholar]
- 46.Popov AV, Pozniakovsky A, Arnal I, Antony C, Ashford AJ, Kinoshita K, Tournebize R, Hyman AA, Karsenti E. Embo J. 2001;20:397–410. doi: 10.1093/emboj/20.3.397. [DOI] [PMC free article] [PubMed] [Google Scholar]
- 47.Ohkura H, Garcia MA, Toda T. J Cell Sci. 2001;114:3805–3812. doi: 10.1242/jcs.114.21.3805. [DOI] [PubMed] [Google Scholar]
- 48.Garcia MA, Koonrugsa N, Toda T. Embo J. 2002;21:6015–6024. doi: 10.1093/emboj/cdf611. [DOI] [PMC free article] [PubMed] [Google Scholar]
- 49.Cullen CF, Ohkura H. Nat Cell Biol. 2001;3:637–642. doi: 10.1038/35083025. [DOI] [PubMed] [Google Scholar]
- 50.Lee MJ, Gergely F, Jeffers K, Yeu Peak-Chew S, Raff JW. Nat Cell Biol. 2001;3:643–649. doi: 10.1038/35083033. [DOI] [PubMed] [Google Scholar]


