

Abstract
We previously reported that Zscan4 showed heterogeneous expression patterns in mouse embryonic stem (ES) cells. To identify genes that show similar expression patterns, we carried out high-throughput in situ hybridization assays on ES cell cultures for 244 genes. Most of the genes are involved in transcriptional regulation, and were selected using microarray-based comparisons of gene expression profiles in ES and embryonal carcinoma (EC) cells versus differentiated cell types. Pou5f1 (Oct4, Oct3/4) and Krt8 (EndoA) were used as controls. Hybridization signals were detected on ES cell colonies for 147 genes (60%). The majority (136 genes) of them showed relatively homogeneous expression in ES cell colonies. However, we found that two genes unequivocally showed Zscan4-like spotted expression pattern (spot-in-colony pattern; Whsc2 and Rhox9). We also found that nine genes showed relatively heterogeneous expression pattern (mosaic-in-colony pattern: Zfp42/Rex1, Rest, Atf4, Pa2g4, E2f2, Nanog, Dppa3/Pgc7/Stella, Esrrb, and Fscn1). Among these genes, Zfp42/Rex1 showed unequivocally heterogeneous expression in individual ES cells prepared by the CytoSpin. These results show the presence of different types or states of cells within ES cell cultures otherwise thought to be undifferentiated and homogeneous, suggesting a previously unappreciated complexity in ES cell cultures.
Keywords: ES cells, EC cells, pluripotent stem cells, heterogeneous gene expression, homogeneous gene expression, Zscan4, Pou5f1, Oct4, Oct3/4, Krt8, EndoA, Whsc2, Nelfa, Rhox9, Zfp42, Rex1, Rest, Zfp42, Rex1, Rest, Atf4, Pa2g4, E2f2, Nanog, Dppa3, Pgc7, Stella, Esrrb, Fscn1
1. Results and discussion
1.1. Rationale for the study
Mouse ES cells remain undifferentiated when cultured in the presence of leukemia inhibitory factor (LIF) (Niwa, 2007). The undifferentiated state of ES cells is usually verified by positive staining for expression of alkaline phosphatase and Pou5f1 (aka: Oct4, Oct3/4). It has been thought that these undifferentiated ES cells are relatively homogeneous and retain capacities for pluripotency and self-renewal (Niwa, 2007). Therefore, the analysis of ES cells is typically population-based. For example, we have analyzed the global gene expression profiles of ES cells, comparing populations of ES cells cultured in conditions which promote or prevent cellular differentiation (Aiba et al., 2006; Sharova et al., 2007).
However, the presence of heterogeneous cell populations in undifferentiated ES cell cultures is now increasingly recognized. Recent reports have demonstrated that surface markers, such as Ssea1, Pecam1, and Icam1, are expressed heterogeneously in mouse ES cell cultures, and their expression patterns appear to be modulated by differentiation processes in these cultures (Cui et al., 2004; Li et al., 2005). Furthermore, in the case of Pecam1, overall expression levels and isoform distributions are indicative of ES cell differentiation state (Cui et al., 2004; Li et al., 2005) as well as embryonic developmental potential (Furusawa et al., 2004). The presence of T-positive cells in ES cell colonies has also been reported (Suzuki et al., 2006). Recently, we have reported that a gene named Zscan4, which is expressed exclusively in 2-cell embryos and ES cells, shows heterogeneous expression in ES cells: only up to 10% of ES cells cultured in undifferentiated conditions express Zscan4 by in situ hybridization (Falco et al., 2007). We suspect the existence of other transcription-regulating genes that show similar expression patterns.
The goals of this study are to find additional evidence for heterogeneous cell populations within undifferentiated ES cell cultures by identifying such genes and characterizing their expression patterns. We report here a two-step approach to identify transcription factor genes responsible for heterogeneity in ES cell cultures, possibly with roles in regulating early differentiation.
1.2. Identification of transcription factor genes expressed predominantly in ES/EC cells
First, we used a microarray-based comparison of gene expression profiles in ES and embryonal carcinoma (EC) cells vs. differentiated cell types to identify enriched transcripts in ES and EC cells. Previously published Microarray data sets (Carter et al., 2003; Aiba et al., 2006) generated using the NIA Mouse 22K Microarray (Carter et al., 2003) were processed using the NIA Array Analysis Tool (Sharov et al., 2005b). Expression profiles for undifferentiated cultures of 129/SvEv and R1 ES cells were combined with those of F9 and P19 embryonal carcinoma (EC) cells to represent stem cell gene expression patterns. Expression profiles for trophoblast stem (TS) cells, neural stem/progenitor (NS) cells, differentiated cells (DC) from the NS cells, and E12.5 whole placenta were included to represent gene expression from differentiation-committed or differentiated cells (Figure 1A). Hierarchical clustering of tissues was carried out using the average distance method, and all tissues representing stem cell gene expression were grouped into a single compact branch of the dendrogram, along with TS cells (Figure 1A), suggesting that as a cultured, oligopotent stem cell line, TS cells have a gene expression profile that bears many similarities to EC and ES cell profiles, which are not related to pluripotency. Sets of genes expressed predominantly in ES/EC cells were identified for clusters 10, 12, 13, and 14 as described previously (Sharov et al., 2005b) and these lists were combined to form a list of 541 genes.
Figure 1. (A) Selection of ES/EC-enriched genes.
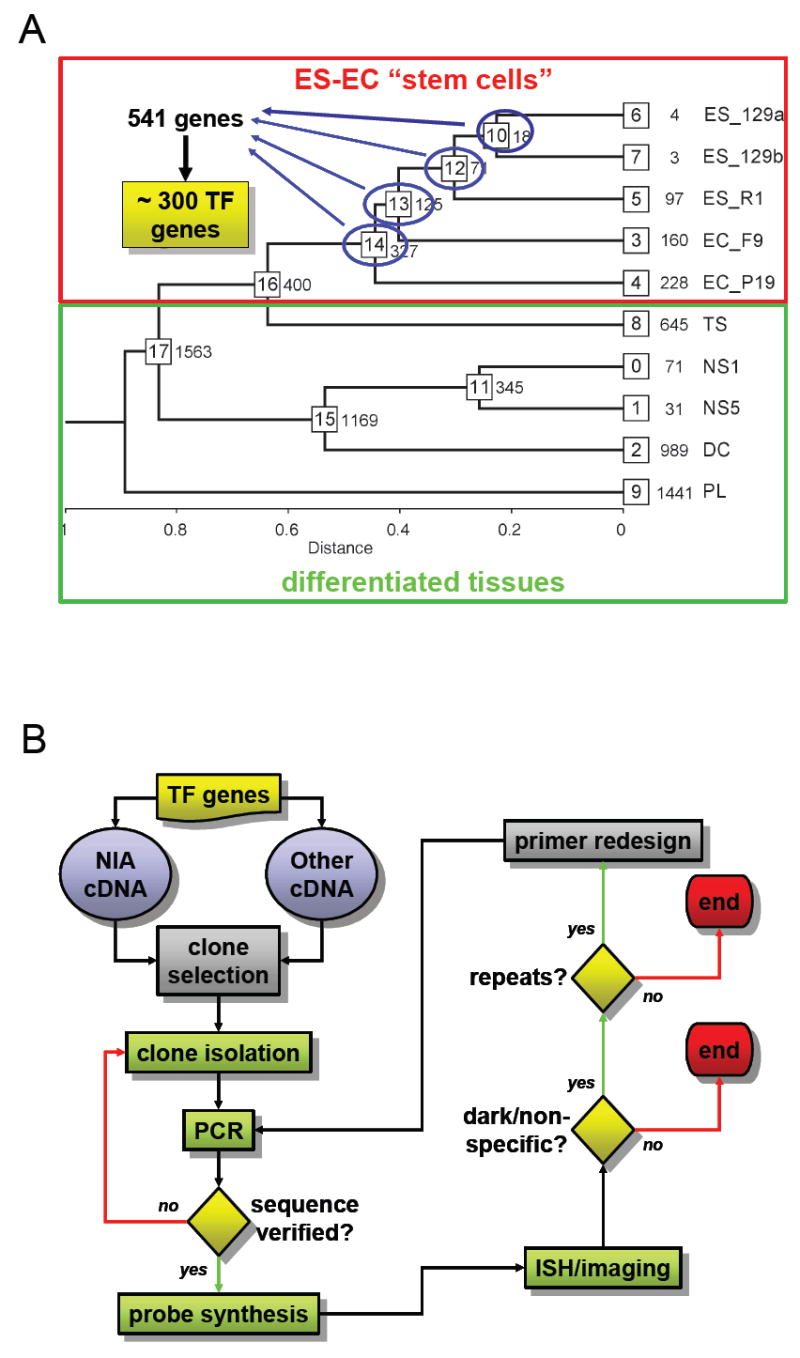
Using the NIA Microarray Analysis Tool (lgsun.grc.nia.nih.gov/ANOVA/), data were compiled from 30 two-channel fluorescent hybridizations of linearly amplified cRNA target mixtures on NIA/Agilent 22K v1.1 60-mer oligo arrays, representing 10 separate tissues and cell cultures in triplicate against a common universal reference. Nodes 12, 13, and 14 on the hierarchical clustering tree above represent transcripts which are enriched in ES cells only, ES cells and F9 EC cells, and ES and EC cells, respectively, relative to TS and differentiated tissues. Of these 541 gene transcripts, approximately 300 encode known or putative transcription factors, DNA binding proteins, or contain motifs associated with DNA-binding and/or transcription-regulating activity. (ES_129a, ES_129b = 129Sv-derived ES cells cultured in two different conditions as described (Aiba et al., 2006); ES_R1 = R1 ES cell line; EC_F9, EC_P19 = F9 and P19 embryonic carcinoma cells; TS = trophoblast stem cells; NS1, NS5 = neural stem/progenitor cells cultured for 1 and 5 days; DC = differentiated neural stem cells; PL = E12.5 whole placenta.
(B) ES cell culture in situ hybridization screening workflow. Clones were identified in NIA cDNA libraries representing genes from our list of approximately 300 known or putative transcription factors. For genes not represented, clones were obtained from Open Biosystems. All clones were single-colony purified, PCR amplified with M13 forward and reverse primers, and PCR products were sequenced for verification. Digoxigenin-labeled antisense RNA probes were synthesized from PCR products and hybridized to fixed ES cells grown on gelatin-coated plastic in LIF-supplemented medium for 3 days. Probes producing extremely dark and/or non-specific signals were examined for repeat element sequences, and gene-specific primers were designed to amplify repeat-free probe templates, which were used for subsequent hybridizations.
Based on GO annotations (Ashburner et al., 2000), protein motif homology, and literature reports, a list of 2,727 known/putative transcription factor and/or DNA-binding genes was identified, 2,025 of which are identified and annotated in the NIA Mouse Gene Index v5.0 (NMGI5) (Sharov et al., 2005a). This list was used to identify ~300 transcription factor candidates from the ES/EC-enriched gene list. In a similar process, data sets comparing gene expression in ES and TS cells on the NIA Mouse 44K Microarray (Carter et al., 2005), a whole-genome platform which allows estimation of absolute expression levels, were filtered to identify 126 ES-enriched transcription factor candidate genes. In this case, genes with absolute expression levels estimated at ≥1 copy/cell in ES cells and < 1 copy/cell in TS cells were considered “ES-enriched”. Genes predominantly expressed in the inner cell mass (ICM) of mouse blastocysts were previously identified using whole-mount in situ hybridization (Yoshikawa et al., 2006) and 61 of these genes were included in the candidate list. Finally, unpublished gene lists from experiments performed in our laboratory were added, as well as individual genes of interest under study. All gene lists were compiled into a non-redundant master list of 344 candidate genes.
1.3. Clone selection and verification
For each candidate gene that is represented in NMGI4, transcript assembly models (Sharov et al., 2005a) were consulted for manual selection of 319 cDNA clone templates for in situ hybridization probes. When possible, cDNA clones covering 3’UTRs of genes were selected to give higher specificity, and clones with inserts ≤1 Kb in length were preferred. In 38 cases where a given gene was not represented in NMGI4 or a suitable cDNA clone for that gene was not available in NIA libraries, clones were selected from other sources (e.g., Open Biosystems Inc. collections). All bacterial clones were sequence-verified prior to use as ISH probe templates. Finally, we obtained digoxigenin-labeled riboprobes for 254 genes.
1.4. High-throughput in situ protocol
Previously we reported the development of a protocol for a high-throughput whole mount in situ hybridization of preimplantation mouse embryos and the expression patterns of 98 genes in mouse blastocysts (Yoshikawa et al., 2006). We adapted this protocol to mouse ES cell culture (see the detailed protocol in Supplement). We tested Pou5f1, which is known to be expressed in undifferentiated ES cells, and Krt8 (EndoA), which is known to be expressed in trophectoderm and visceral endoderm. The transcripts of Pou5f1 were detected in the undifferentiated colonies of ES cells, whereas the transcripts of Krt8 were detected in the flatter cells that surround undifferentiated colonies (Fig. 2, Fig. 3). To increase the throughput of the procedure, we adapted the method to gelatin-coated 12-well microtiter plates. This particular culture condition was not necessarily best suited to undifferentiated ES cells. In fact, we frequently observed cells with features of differentiation, such as flatter cell morphology and the expression of Krt8, along with undifferentiated cells in typical compact colonies. Therefore, in each plate, the expression patterns of 10 genes were examined, together with Pou5f1 and Krt8 as controls. We also scored in situ hybridization results of cells only within compact ES cell colonies (see Fig. 2 and 3 for examples).
Figure 2. ES cell in situ hybridization results.
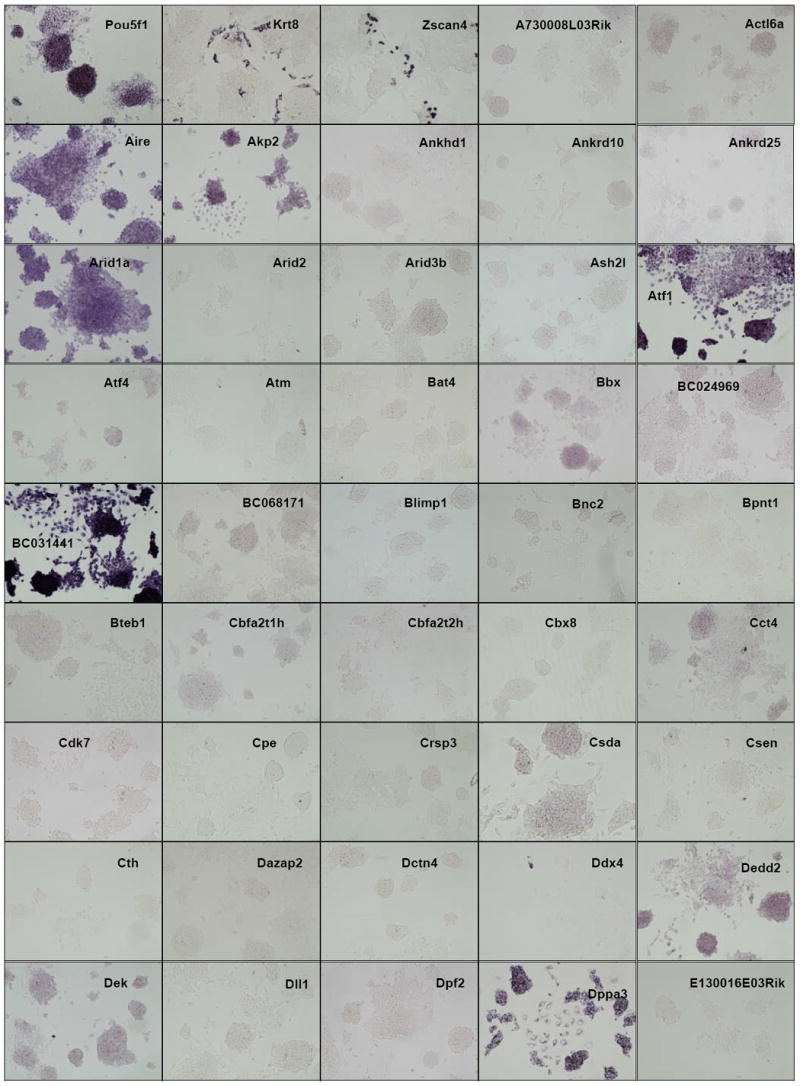
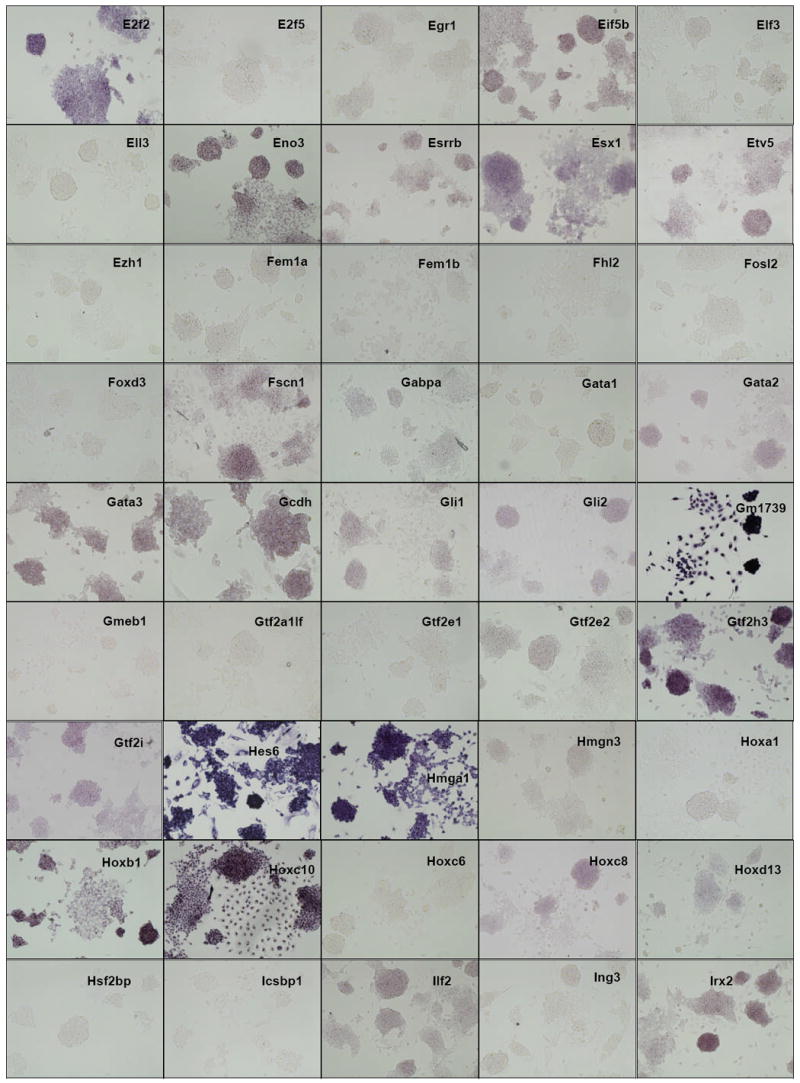
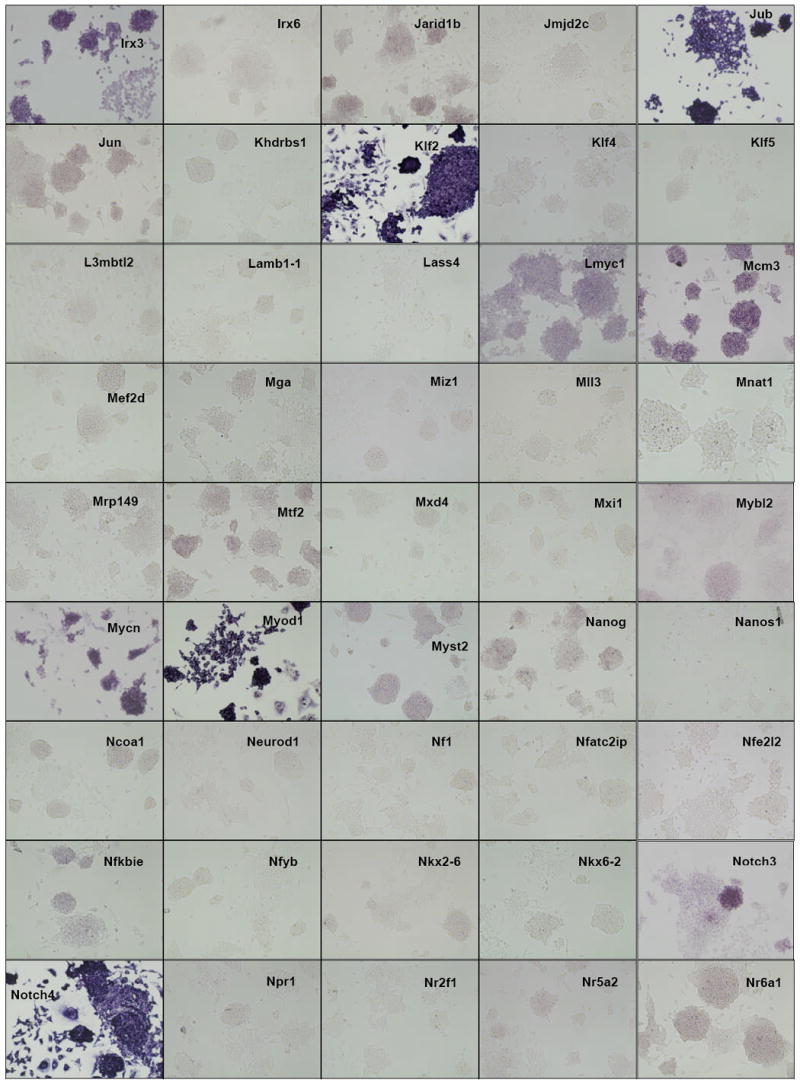
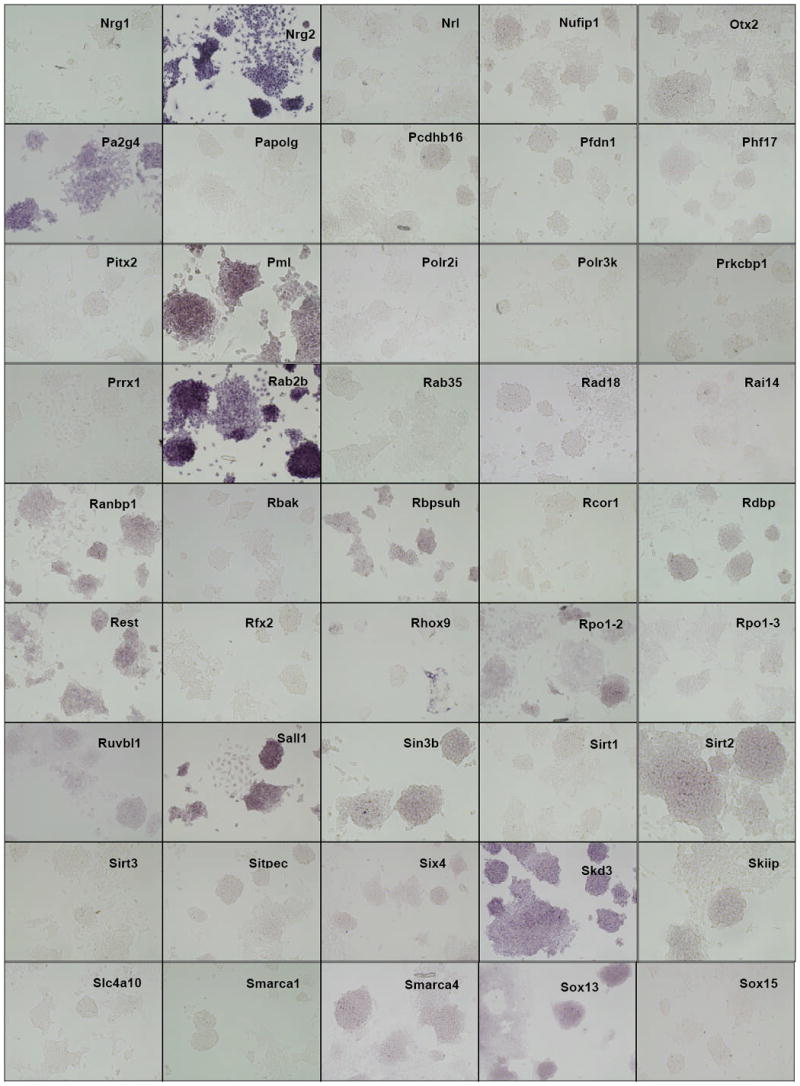
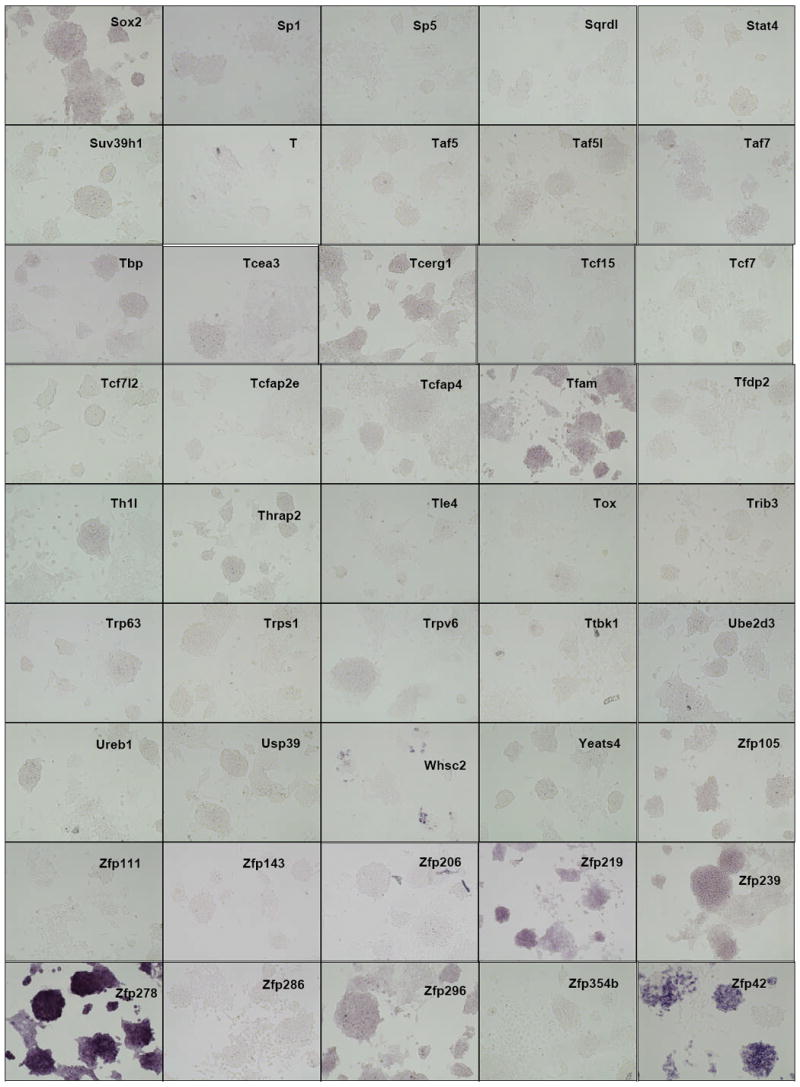
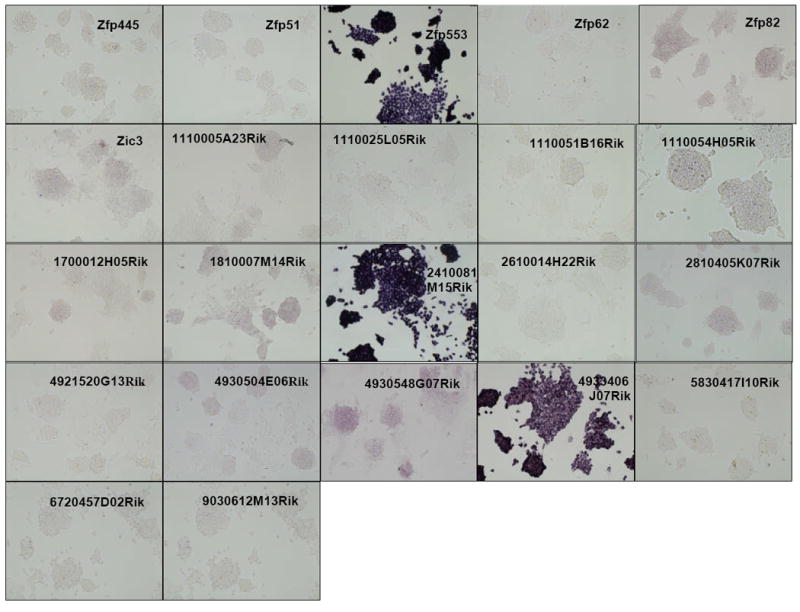
Distribution of gene expression intensity and pattern in ES cell cultures by in situ hybridization In situ hybridized ES cells were photographed under standardized conditions, and images from 252 different clones which were successfully isolated, sequence verified, PCR-amplified, transcribed into DIG-labeled probes, and hybridized were classified according to expression intensity and pattern type (Table 1). High-resolution images are available at the public OME site (http://ome.grc.nia.nih.gov).
Figure 3. Magnified view of representative genes.
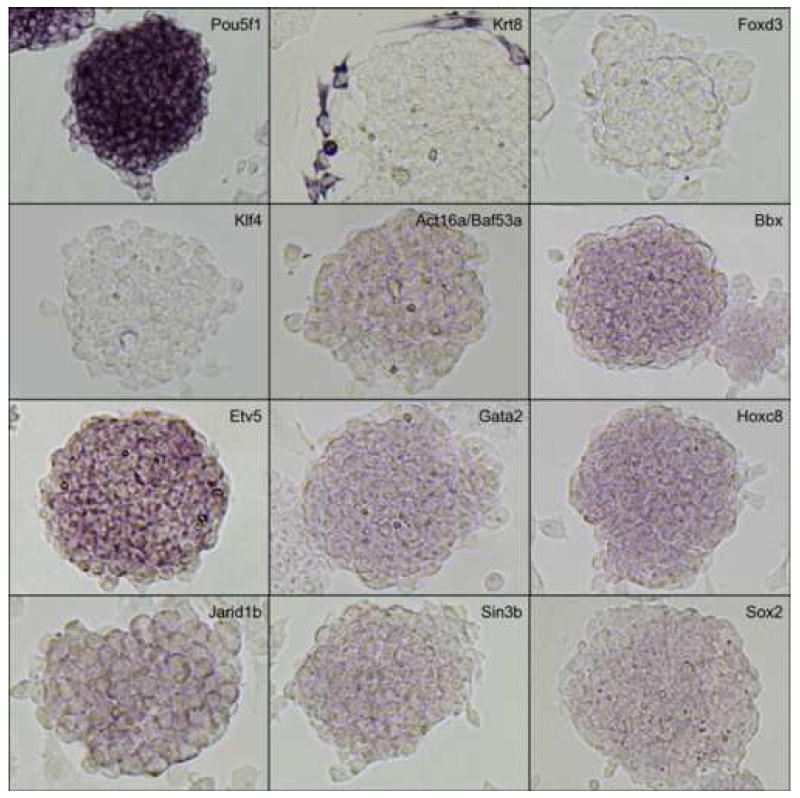
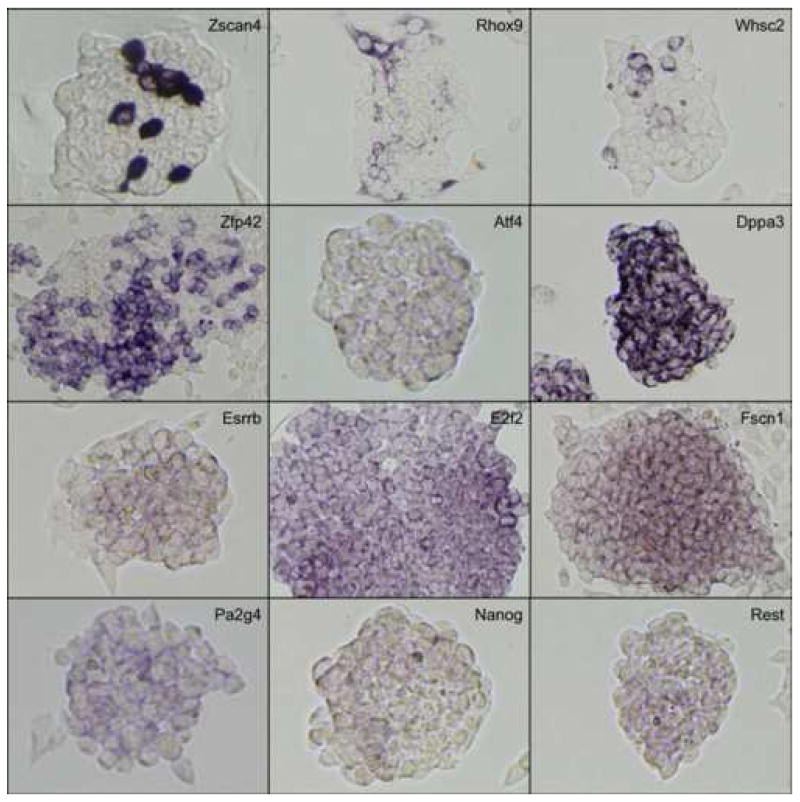
In situ hybridization results of representative genes are selected from Fig. 2 and magnified to show the detailed staining patterns. See the text for the interpretation of results.
1.5. In situ hybridization screen
We then carried out in situ hybridization of 254 genes (Figure 2). Based on the visual inspection of high-resolution images of these results, we classified the expression patterns of 254 genes by their signal intensities (Table 1). Six categories of signal intensity (non-detectable - 97/40%, very faint – 56/23%, faint – 36/15%, medium – 27/11%, strong – 13/5%, and very strong – 15/6%) were identified, with decreasing membership at higher signal intensities. In fact, almost half of the clones hybridized produced no discernable signal, but this aspect of the results is not surprising, given that many transcription factor/DNA-binding gene products are expressed at low levels, compared to metabolic and structural proteins. Because ISH is not as sensitive as other transcript detection methods, we might expect that some low-abundance transcripts may be missed, and some detection sensitivity is sacrificed for the localization information which is provided by ISH. For example, it is well known that Foxd3 (Hanna et al., 2002) and Klf4 (Nakatake et al., 2006) are expressed in mouse ES cells and play an important function, but we could not detect any hybridization signals for these genes (Figure 3). This is clearly a limitation of the current methodology.
Table 1.
A list of all the genes screened and the in situ results
| Gene | TF? | cDNA clone IDs | Signal Intensity | Expression Pattern in ES colonies |
|---|---|---|---|---|
| Pou5f1 (Oct3/4, Oct4) | Yes | H3028H01 | strong | Homogeneous |
| Krt8 (EndoA) | No | H3031C01 | strong | Peripheral |
| Zscan4 (Gm397) | Yes | C0407B02 | strong | Spot-in-Colony |
| A730008L03Rik (Nelfb) | Yes | K0109B03 | v faint | Homogeneous |
| Actl6a (Baf53a) | Yes | H3080C12 | faint | Homogeneous |
| Aire | Yes | EMM1002-7515871 | strong | Homogeneous |
| Akp2 | Yes | C0257F12 | med | Homogeneous |
| Ankhd1 | Yes | K0400H03 | v faint | Homogeneous |
| Ankrd10 | Yes | K0122H01 | v faint | Homogeneous |
| Ankrd25 | Yes | H3123C11 | v faint | Homogeneous |
| Arid1a (Baf250a) | Yes | H3023A03 | strong | Homogeneous |
| Arid2 | Yes | K0917G07 | n/d | n/d |
| Arid3b | Yes | C0326H11 | v faint | Homogeneous |
| Ash2l | Yes | H3147F02 | v faint | Homogeneous |
| Atf1 | Yes | H4067F10 | v strong | Homogeneous |
| Atf4 | Yes | H3124E06 | faint | Mosaic-in-Colony |
| Atm | Yes | H8200G06 | n/d | n/d |
| Bat4 | Yes | H3059D08 | n/d | n/d |
| Bbx | Yes | H3026G07 | faint | Homogeneous |
| BC024969 (Adnp2) | Yes | C0866H11 | v faint | Homogeneous |
| BC031441 | Yes | H8230G02 | v strong | Homogeneous |
| BC068171 (Dkc1) | No | H3066D04 | v faint | Homogeneous |
| Blimp1 (Prdm1) | Yes | EMM1032-597986 | n/d | n/d |
| Bnc2 | Yes | H3065E10 | v faint | Homogeneous |
| Bpnt1 | Yes | H3057C10 | n/d | n/d |
| Bteb1 (Klf9) | Yes | H3027A04 | v faint | Homogeneous |
| Cbfa2t1h (Runx1t1) | Yes | H3125F02 | v faint | Homogeneous |
| Cbfa2t2h (Cbfa2t2) | Yes | H3091A05 | v faint | Homogeneous |
| Cbx8 | Yes | H4002D08 | n/d | n/d |
| Cct4 | No | H3027F12 | faint | Homogeneous |
| Cdk7 | Yes | H3002H05 | n/d | n/d |
| Cpe | No | H4028H11 | n/d | n/d |
| Crsp3 (Med23) | No | H4006A08 | n/d | n/d |
| Csda | Yes | C0202D02 | faint | Homogeneous |
| Csen (Kcnip3) | Yes | K0906H01 | n/d | n/d |
| Cth | No | H3103D05 | n/d | n/d |
| Dazap2 | Yes | A0813H07 | n/d | n/d |
| Dctn4 | No | H4070C12 | n/d | n/d |
| Ddx4 (Mvh) | No | H3134G04 | n/d | n/d |
| Dedd2 | Yes | H4061C06 | med | Homogeneous |
| Dek | Yes | H3138A12 | faint | Homogeneous |
| Dll1 | No | MMM1013-9202259 | n/d | n/d |
| Dpf2 (Req) | Yes | C0818B07 | n/d | n/d |
| Dppa3 (Stella, Pgc7) | No | L0289B08 | strong | Mosaic-in-Colony |
| E130016E03Rik (Rad54b) | Yes | H3116F06 | n/d | n/d |
| E2f2 | Yes | EMM1002-7498698 | med | Mosaic-in-Colony |
| E2f5 | Yes | H3072H12 | n/d | n/d |
| Egr1 (Krox24) | Yes | B0267A11 | v faint | Homogeneous |
| Eif5b | No | H3053D03 | med | Homogeneous |
| Elf3 | Yes | H3015C12 | v faint | Homogeneous |
| Ell3 | Yes | E0754G01 | n/d | n/d |
| Eno3 | No | H4027G12 | strong | Homogeneous |
| Esrrb | Yes | H4053E01 | med | Mosaic-in-Colony |
| Esx1 | Yes | EMM1002-6760787 | med | Homogeneous |
| Etv5 | Yes | C0282F03 | med | Homogeneous |
| Ezh1 | Yes | H3154F11 | n/d | n/d |
| Fem1a | Yes | C0407G11 | v faint | Homogeneous |
| Fem1b | Yes | H3029F04 | n/d | n/d |
| Fhl2 | Yes | H3033C07 | n/d | n/d |
| Fosl2 | Yes | H3110A12 | n/d | n/d |
| Foxd3 (Genesis) | Yes | EMM1002-1111636 | n/d | n/d |
| Fscn1 | No | H3006D08 | strong | Mosaic-in-Colony |
| Gabpa | Yes | C0260F10 | v faint | Homogeneous |
| Gata1 | Yes | H3038A09 | n/d | n/d |
| Gata2 | Yes | H3009F04 | faint | Homogeneous |
| Gata3 | Yes | H3049E04 | med | Homogeneous |
| Gcdh | Yes | C0328C11 | med | Homogeneous |
| Gli1 | Yes | A0243G01 | faint | Homogeneous |
| Gli2 | Yes | K0239G06 | faint | Homogeneous |
| Gm1739 | No | H3128A09 | v strong | Homogeneous |
| Gmeb1 | Yes | K0502H03 | n/d | n/d |
| Gtf2a1lf | Yes | EMM1002-4195952 | n/d | n/d |
| Gtf2e1 | Yes | H3105C05 | n/d | n/d |
| Gtf2e2 | Yes | H3144B01 | faint | Homogeneous |
| Gtf2h3 | Yes | H8201G03 | strong | Homogeneous |
| Gtf2i | Yes | H3140H12 | med | Homogeneous |
| Hes6 | Yes | MMM101365220 | v strong | Homogeneous |
| Hmga1 | Yes | H3029B11 | strong | Homogeneous |
| Hmgn3 | Yes | B0224F03 | v faint | Homogeneous |
| Hoxa1 | Yes | EMM1032-608139 | n/d | n/d |
| Hoxb1 | Yes | H3031H08 | strong | Homogeneous |
| Hoxc10 | Yes | H3120B02 | strong | Homogeneous |
| Hoxc6 | Yes | EMM1002-25304 | n/d | n/d |
| Hoxc8 | Yes | H4041F10 | med | Homogeneous |
| Hoxd13 | Yes | EMM1002-6823925 | faint | Homogeneous |
| Hsf2bp | Yes | H3125B05 | n/d | n/d |
| Icsbp1 (Irf8) | Yes | H3072F09 | n/d | n/d |
| Ilf2 | Yes | H3029E05 | med | Homogeneous |
| Ing3 | Yes | H4072A09 | n/d | n/d |
| Irx2 | Yes | EMM1002-5626242 | med | Homogeneous |
| Irx3 | Yes | H3010C07 | strong | Homogeneous |
| Irx6 | Yes | EMM1002-1856631 | v faint | Homogeneous |
| Jarid1b | Yes | H3041C04 | faint | Homogeneous |
| Jmjd2c | Yes | H4053F10 | n/d | n/d |
| Jub | No | H3024A03 | v strong | Homogeneous |
| Jun | Yes | H3058C09 | faint | Homogeneous |
| Khdrbs1 | Yes | A0501F06 | n/d | n/d |
| Klf2 | Yes | EMM1002-7515994 | v strong | Homogeneous |
| Klf4 | Yes | H3015B01 | n/d | n/d |
| Klf5 | Yes | H3102C04 | v faint | Homogeneous |
| L3mbtl2 | Yes | A0354D01 | v faint | Homogeneous |
| Lamb1-1 (Lamb1) | No | H3147C04 | n/d | n/d |
| Lass4 (Trh1) | Yes | H3129C07 | n/d | n/d |
| Lmyc1 (Mycl1) | Yes | H3024G07 | med | Homogeneous |
| Mcm3 | Yes | C0403F03 | strong | Homogeneous |
| Mef2d | Yes | C0261E02 | v faint | Homogeneous |
| Mga | Yes | K0110B04 | v faint | Homogeneous |
| Miz1 (Pias2) | Yes | K0232F02 | n/d | n/d |
| Mll3 | Yes | H3057C11 | n/d | n/d |
| Mnat1 | Yes | C0025B02 | n/d | n/d |
| Mrpl49 | No | H3039A04 | v faint | Homogeneous |
| Mtf2 | Yes | H3048E07 | faint | Homogeneous |
| Mxd4 | Yes | H3131B07 | v faint | Homogeneous |
| Mxi1 | Yes | H4077G09 | n/d | n/d |
| Mybl2 (Bmyb) | Yes | H3144E01 | faint | Homogeneous |
| Mycn (Nmyc1) | Yes | H4041A05 | v strong | Homogeneous |
| Myod1 (MyoD) | Yes | EMM1002-1452165 | v strong | Homogeneous |
| Myst2 | Yes | H3107B07 | faint | Homogeneous |
| Nanog | Yes | H3050A07 | faint | Mosaic-in-Colony |
| Nanos1 | No | K0409A10 | n/d | n/d |
| Ncoa1 | Yes | A0400A03 | v faint | Homogeneous |
| Neurod1 | Yes | H4035E12 | n/d | n/d |
| Nf1 | No | H4070B01 | n/d | n/d |
| Nfatc2ip | Yes | H3046E09 | n/d | n/d |
| Nfe2l2 | Yes | C0819F04 | n/d | n/d |
| Nfkbie | Yes | MMM1013-7512133 | faint | Homogeneous |
| Nfyb | Yes | H3146B03 | n/d | n/d |
| Nkx2-6 | Yes | EMM1002-1148995 | v faint | Homogeneous |
| Nkx6-2 | Yes | EMM1002-21216 | n/d | n/d |
| Notch3 | Yes | H4028C12 | strong | Homogeneous |
| Notch4 | Yes | EMM1002-6752438 | v strong | Homogeneous |
| Npr1 | No | L0927H03 | v faint | Homogeneous |
| Nr2f1 (COUPTF1) | Yes | H3096D07 | n/d | n/d |
| Nr5a2 (LRH1) | Yes | H3087G01 | v faint | Homogeneous |
| Nr6a1 (Gcnf) | Yes | H3026F12 | faint | Homogeneous |
| Nrg1 | Yes | EMM1032-582702 | n/d | n/d |
| Nrg2/LOC381149 | No | EMM1002-5539961 | v strong | Homogeneous |
| Nrl | Yes | EMM1002-4982597 | n/d | n/d |
| Nufip1 | Yes | H3009B11 | v faint | Homogeneous |
| Otx2 | Yes | H3030H12 | v faint | Homogeneous |
| Pa2g4 | Yes | H3024B11 | med | Mosaic-in-Colony |
| Papolg | Yes | J0235C01 | n/d | n/d |
| Pcdhb16 | Yes | K0997C06 | v faint | Homogeneous |
| Pfdn1 | Yes | H3157C01 | n/d | n/d |
| Phf17 | Yes | H3127B05 | v faint | Homogeneous |
| Pitx2 | Yes | E0473B09 | n/d | n/d |
| Pml | Yes | C0208F04 | med | Homogeneous |
| Polr2i | Yes | H3089E01 | n/d | n/d |
| Polr3k | Yes | H3083H08 | n/d | n/d |
| Prkcbp1 | Yes | H3027G06 | n/d | n/d |
| Prrx1 | Yes | K0403B09 | n/d | n/d |
| Rab2b | Yes | A0363E07 | v strong | Homogeneous |
| Rab35 | Yes | H3136E02 | n/d | n/d |
| Rad18 | Yes | C0407D04 | n/d | n/d |
| Rai14 | Yes | K0417A05 | n/d | n/d |
| Ranbp1 | No | H3104D06 | faint | Homogeneous |
| Rbak | Yes | H3091E03 | n/d | n/d |
| Rbpsuh (Rbpj) | Yes | H4069C09 | faint | Homogeneous |
| Rcor1 | Yes | H4030A11 | n/d | n/d |
| Rdbp | No | H3025E10 | faint | Homogeneous |
| Rest | Yes | H3153C03 | med | Mosaic-in-Colony |
| Rfx2 | Yes | H8188D01 | n/d | n/d |
| Rhox9 (Psx2) | Yes | L0042E08 | faint | Spot-in-Colony |
| Rpo1-2 | Yes | H8164D08 | med | Homogeneous |
| Rpo1-3 | Yes | H3121B06 | v faint | Homogeneous |
| Ruvbl1 | Yes | H3016C12 | v faint | Homogeneous |
| Sall1 | Yes | H4055D01 | med | Homogeneous |
| Sin3b | Yes | C0281D12 | faint | Homogeneous |
| Sirt1 | Yes | H3119B12 | v faint | Homogeneous |
| Sirt2 | Yes | C0285H01 | faint | Homogeneous |
| Sirt3 | Yes | A0352G08 | n/d | n/d |
| Sitpec (Ecsit) | Yes | H4049D06 | v faint | Homogeneous |
| Six4 | Yes | H4056D02 | v faint | Homogeneous |
| Skd3 (Clpb) | Yes | C0341A10 | med | Homogeneous |
| Skiip (Snw1) | Yes | C0218H03 | v faint | Homogeneous |
| Slc4a10 | Yes | H4035E11 | n/d | n/d |
| Smarca1 (Snf2l) | Yes | H4004G06 | n/d | n/d |
| Smarca4 (Brg1) | Yes | C0402B01 | faint | Homogeneous |
| Sox13 | Yes | L0928B04 | med | Homogeneous |
| Sox15 | Yes | H3081C12 | n/d | n/d |
| Sox2 | Yes | C0403H11 | faint | Homogeneous |
| Sp1 | Yes | H3016H10 | n/d | n/d |
| Sp5 | Yes | EMM1002-5883694 | n/d | n/d |
| Sqrdl | No | H3122H06 | n/d | n/d |
| Stat4 | Yes | H4077D08 | n/d | n/d |
| Suv39h1 | Yes | H3141G04 | v faint | Homogeneous |
| T (Brachyury) | Yes | H3029B05 | n/d | n/d |
| Taf5 | Yes | K0278H01 | n/d | n/d |
| Taf5l | Yes | B0410D11 | v faint | Homogeneous |
| Taf7 | Yes | H3071E08 | v faint | Homogeneous |
| Tbp | Yes | K0240H01 | v faint | Homogeneous |
| Tcea3 | Yes | H4005B08 | faint | Homogeneous |
| Tcerg1 | Yes | H3128B05 | faint | Homogeneous |
| Tcf15 | Yes | EMM1002-1464550 | n/d | n/d |
| Tcf7 | Yes | H4003H11 | n/d | n/d |
| Tcf7l2 | Yes | H4028E05 | n/d | n/d |
| Tcfap2e | Yes | H3100H07 | n/d | n/d |
| Tcfap4 | Yes | MMM1013-9200312 | v faint | Homogeneous |
| Tfam | Yes | H8244A10 | med | Homogeneous |
| Tfdp2 | Yes | H4061E07 | v faint | Homogeneous |
| Th1l | Yes | C0208E04 | faint | Homogeneous |
| Thrap2 (Med13l) | Yes | H3137F02 | faint | Homogeneous |
| Tle4 | Yes | H3103G12 | n/d | n/d |
| Tox | Yes | K0748A03 | n/d | n/d |
| Trib3 | Yes | H3035B01 | n/d | n/d |
| Trp63 | Yes | E0485F10 | v faint | Homogeneous |
| Trps1 | Yes | A0909F05 | n/d | n/d |
| Trpv6 | Yes | H8162C12 | v faint | Homogeneous |
| Ttbk1 | No | H3137A12 | n/d | n/d |
| Ube2d3 | No | H3082D12 | v faint | Homogeneous |
| Ureb1 | No | H3129D11 | v faint | Homogeneous |
| Usp39 | No | H3005G05 | v faint | Homogeneous |
| Whsc2 (NelfA) | Yes | C0288C12 | med | Spot-in-Colony |
| Yeats4 | Yes | H4002F05 | v faint | Homogeneous |
| Zfp105 | No | H3154D12 | v faint | Homogeneous |
| Zfp111 | Yes | K0957E07 | n/d | n/d |
| Zfp143 | Yes | L0949H07 | n/d | n/d |
| Zfp206 (Zscan10) | Yes | H4040D10 | n/d | n/d |
| Zfp219 | No | H3014D06 | med | Homogeneous |
| Zfp239 | Yes | H4060F01 | med | Homogeneous |
| Zfp278 (Patz1) | Yes | K0852A06 | v strong | Homogeneous |
| Zfp286 | Yes | C0919G04 | n/d | n/d |
| Zfp296 | No | H3086D06 | med | Homogeneous |
| Zfp354b | Yes | EMM1032-6904991 | n/d | n/d |
| Zfp42 (Rex1) | Yes | H3036F04 | strong | Mosaic-in-Colony |
| Zfp445 | Yes | K0508E08 | v faint | Homogeneous |
| Zfp51 | Yes | H3122C02 | n/d | n/d |
| Zfp553 | Yes | C0405D09 | v strong | Homogeneous |
| Zfp62 | Yes | B0129B06 | n/d | n/d |
| Zfp82 | Yes | H4054E06 | faint | Homogeneous |
| Zic3 | Yes | B0716B04 | faint | Homogeneous |
| 1110005A23Rik | Yes | H3148B10 | v faint | Homogeneous |
| 1110025L05Rik (Bola2) | Yes | H3085B11 | v faint | Homogeneous |
| 1110051B16Rik | Yes | E0702B01 | n/d | n/d |
| 1110054H05Rik (Foxk2) | Yes | C0202E10 | faint | Homogeneous |
| 1700012H05Rik (Rbmxl2) | No | EMM1002-7533455 | v faint | Homogeneous |
| 1810007M14Rik | Yes | H4079B04 | faint | Homogeneous |
| 2410081M15Rik | No | H3093G04 | v strong | Homogeneous |
| 2610014H22Rik (Wbp7) | Yes | H3159D08 | n/d | n/d |
| 2810405K07Rik (Zfp661) | Yes | K0914F08 | faint | Homogeneous |
| 4921520G13Rik | Yes | MMM1013-9335122 | n/d | n/d |
| 4930504E06Rik | No | K0251E12 | v faint | Homogeneous |
| 4930548G07Rik | Yes | L0924F06 | med | Homogeneous |
| 4933406J07Rik (Syce1) | No | H4051E05 | v strong | Homogeneous |
| 5830417I10Rik | Yes | H3038H08 | n/d | n/d |
| 6720457D02Rik | Yes | B0142C08 | n/d | n/d |
| 9030612M13Rik | Yes | H3010E12 | n/d | n/d |
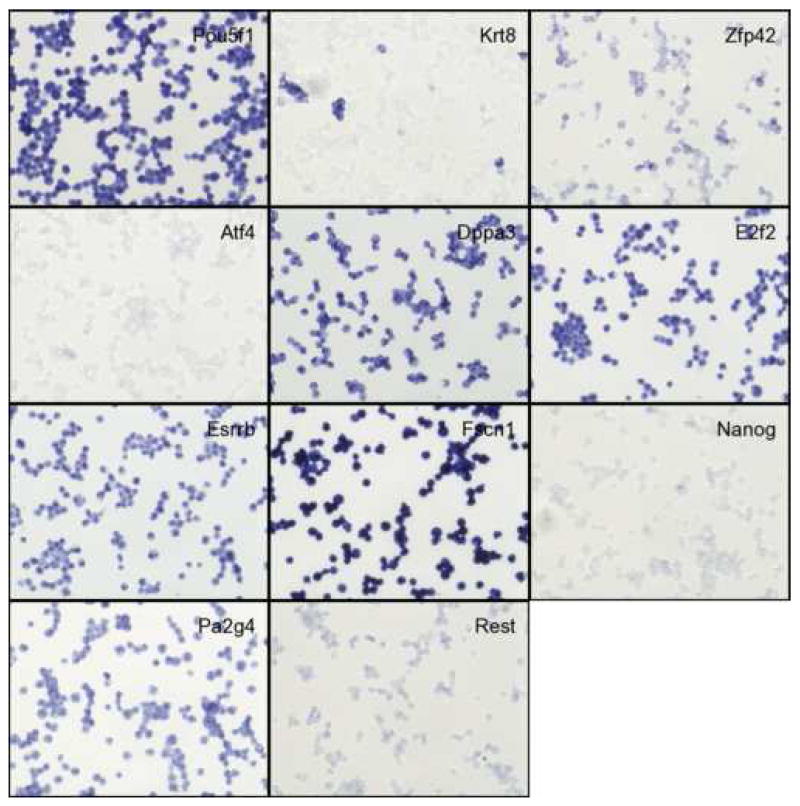
The observed expression patterns grouped the 147 positive genes into three groups (Table 1): (i) 136 genes showed relatively homogeneous expression in ES cell colonies. Magnified images for representative genes are shown in Fig. 3. These expression patterns resembled that of Pou5f1: strong expression in the center of ESC colonies, with reduction or absence of expression at the more differentiated, epithelioid edges of colonies and isolated cells. (ii) 2 genes showed Zscan4-like spotted expression patterns (spot-in-colony pattern: Rhox9 and Whsc2; Fig. 3); (iii) 9 genes showed heterogeneous expression patterns (mosaic-in-colony pattern: Zfp42, Atf4, Dppa3, Esrrb, E2f2, Fscn1, Pa2g4, Nanog, and Rest; Fig. 3). Although the expression patterns of these genes were distinctive compared to those of homogeneously expressed genes (Fig. 3), we note that, except for Zscan4, Rhox9, Whsc2, and Zfp42, these classifications were rather subjective and should be taken with caution. In fact, among 9 genes that showed mosaic-in-colony expression pattern, only Zfp42/Rex1 showed unequivocal heterogeneous expression pattern at the single cell level, when in situ hybridization was carried out on ES cells trypsinized and attached to a glass slide by the CytoSpin (Fig. 4). Some other genes also appeared to be heterogeneous (e.g., Atf4, Dppa3, Nanog, Pa2g4, and Rest), but the further confirmation by more quantitative methods will be required.
Figure 4. In situ hybridization results of CytoSpin-prepared ES cells.
These results show the presence of different types or states of cells in ES cell cultures, suggesting the previously unrecognized complexity of ES cell cultures grown under standard, non-differentiating conditions. We will briefly describe the features of these genes.
1.6. Genes with spotted expression patterns (spot-in-colony pattern)
Among genes we examined in this study, only three genes (Zscan4, Rhox9, and Whsc2) showed highly heterogeneous “spotted” expression patterns in undifferentiated ES cell cultures.
Zscan4, which encodes SCAN domain and four zinc-finger domains, was identified previously for the heterogeneous spot-in-colony expression pattern (Falco et al., 2007). Zscan4 is expressed exclusively in mouse 2-cell embryos and ES cells. Reducing the level of Zscan4 transcripts delays the progression from 2-cell embryos to 4-cell embryos.
Probes for Rhox9 (originally identified as Psx2) detected a sparse, heterogeneous expression pattern. Rhox homeobox genes are located in a cluster on the X chromosome and are the result of very recent gene duplications (Maclean et al., 2005; MacLean et al., 2006). As a consequence, Rhox6/Psx1 and Rhox9/Psx2 are virtually identical at the DNA sequence level, and our in situ hybridization probes cannot distinguish between the two genes. Quantitative RT-PCR analysis using primer pairs that can distinguish Rhox6 and Rhox9 showed that Rhox9 constituted 85% of transcripts and Rhox6 constituted 15% of transcripts in undifferentiated ES cells (data not shown). Therefore, transcripts detected by in situ hybridization were most likely Rhox9. Rhox6 is known to be a marker of the trophectoderm lineage (Han et al., 1998; Chun et al., 1999), but Rhox9 is expressed specifically in female germ cells (Takasaki et al., 2001).
Whsc2/NelfA mRNA was strongly expressed in a sparse heterogeneous pattern (two to four non-adjacent cells per colony). Whsc2 is a mammalian homolog of the Drosophila NELFA gene (Wright et al., 1999; Wu et al., 2005), which complexes with other Nelf proteins and can repress transcription by pausing RNA Polymerase II elongation (Wu et al., 2005). In Drosophila and mammals, it has been reported to be expressed ubiquitously (Wright et al., 1999; Yamaguchi et al., 1999; Mariotti et al., 2000). NELFA is involved in the regulation of immediate early expression of JunB in HepG2 cells (Aida et al., 2006).
1.7. Genes with heterogeneous expression patterns (mosaic-in-colony pattern)
Zfp42/Rex1 has been identified as a marker for undifferentiated EC cells (Hosler et al., 1989) and often called a pluripotency marker gene. The expression of Zfp42 is much lower in ES and embryonic germ (EG) cells derived from the C57BL/6 mouse strain than in those derived from the 129 mouse strain (Sharova et al., 2007). The mosaic expression pattern of Zfp42 has also been shown recently (Yayoi Toyooka and Hitoshi Niwa, personal communication).
RE1-silencing transcription factor (Rest) negatively regulates many neuronal genes in stem and progenitor cells (Chong et al., 1995). The expression of this gene was not detected in either ICM or TE in blastocysts by whole mount in situ hybridization (Yoshikawa et al., 2006). It has been shown that REST binds to the promoter region of Pou5f1 in ES cells (Boyer et al., 2005; Loh et al., 2006) and its expression is suppressed when Pou5f1 was repressed in mouse ES cells (Matoba et al., 2006). Reduction of Rest transcripts by siRNA in mouse ES cells does not seem to affect the undifferentiated state of ES cells (Loh et al., 2006).
Activating transcription factor 4 (Atf4) is a member of ATF/CREB (activating transcription factor/cyclic AMP response element binding protein) family of basic region-leucine zipper (bZip) transcription factors (Ameri and Harris, 2007). Atf4 is induced by oxidative and other stresses and known to be involved in multiple processes, including hematopoiesis, lens and skeletal development, and fertility (Ameri and Harris, 2007).
E2F transcription factor 2 (E2f2) is one of the eight E2F family member genes, E2f1-E2f8 (DeGregori and Johnson, 2006). E2Fs have diverse target genes and functions, including cell cycle regulation, apoptosis, and development (DeGregori and Johnson, 2006).
Nanog was originally isolated as a gene whose overexpression maintains the undifferentiated state of ES cells in the absence of LIF and has been used as a marker for pluripotency (Chambers et al., 2003; Mitsui et al., 2003). Heterogeneous expression of Nanog in mouse ES cells has been shown recently (Singh et al., 2007).
Dppa3/Pgc7/Stella was originally isolated as a marker for early germ cell differentiation (Saitou et al., 2002; Sato et al., 2002; Bortvin et al., 2003). Using a GFP marker under the regulation of the Stella promoter, it has been shown that GFP was expressed in a heterogeneous manner, i.e., a “salt-pepper” fashion (Payer et al., 2006).
Estrogen related receptor beta (Esrrb) plays an important role in the development of primordial germ cells (PGCs) (Mitsunaga et al., 2004). Recently it has been shown that Esrrb is one of the pluripotency-related genes (Ivanova et al., 2006; Loh et al., 2006).
Fascin homolog 1, actin bundling protein (Fscn1) has been shown to be expressed in neural and mesenchymal derivative cells (De Arcangelis et al., 2004).
1.8. Genes with homogeneous expression patterns within ES cell colonies
These genes will provide useful markers for undifferentiated ES cells. It will be important to study how these gene expression patterns change during the differentiation of ES cell cultures.
2. Experimental Procedures
2.1. Candidate gene/clone list assembly
Gene expression microarray data from previously published studies (Carter et al., 2005; Aiba et al., 2006) was analyzed using the NIA Microarray Analysis Tool (Sharov et al., 2005b) to generate lists of genes enriched in ES cell cultures grown in non-differentiating conditions. Official gene symbols and NIA Mouse Gene Index 5.0 (NMGI5) identifiers (Sharov et al., 2005a) were assigned to each gene, and NMGI5 locus and transcript models were used to select cDNA clones to be used as probe templates. Preference was given to NIA cDNA clones covering 3’UTRs, with an insert length ≤ 1 kb. In cases where suitable NIA cDNA clones were not available for a given gene, clones were selected and ordered from Open Biosystems Incorporated (OBI).
2.2. RNA probe preparation
cDNA clones were arrayed and cultured in 96-well microtiter plates. Inserts were PCR amplified directly from 2 μl bacterial culture in 100 μl PCR reactions (5 units RedTaq DNA polymerase in 10 mM Tris-HCl, pH 8.3; 50 mM KCl; 1.1 mM MgCl2; 0.01% gelatin; 200 μM each dNTP; 0.2 μM each primer). Reactions were cycled as follows: 30 cycles of denaturation at 95 °C for 30 seconds, annealing at 47 °C for 30 seconds, extension at 72 °C for 4 minutes, followed by the final extension at 72 °C for 10 minutes. NIA cDNA clones (in pSPORT-based backbones) were amplified using M13 forward (-20) (5’-GTAAAACGACGGCCAGT-3’) and M13 reverse (5’-GGAAACAGCTATGACCATG-3’) primers. OBI cDNA clones in backbones without M13 forward and reverse sites were amplified using T7 (5’-GTAATACGACTCACTATAGGGC-3’) and T3 (5’-AATTAACCCTCACTAAAGGG-3’) primers. PCR products were purified using a QIAquick PCR purification kit (Qiagen), eluted in 100 μl of buffer, and quantitated using a ND1000 spectrophotometer (NanoDrop Technologies Inc.). Digoxigenin-labeled RNA probes were transcribed from the PCR product templates using DIG RNA Labeling Mix (Roche) and the appropriate RNA polymerase. Ethanol-precipitated probes were re-suspended in water and quantitated by agarose gel electrophoresis or by running an RNA 6000 Nano Assay on a 2100 Bioanalyzer (Agilent Technologies).
2.3. Cell culture
ES cells (line 129.3, derived from 129Sv/J strain mice) were cultured at 37°C in 5% CO2 without feeders on gelatin-coated 12-well plastic plates using standard ES cell culture medium (DMEM, 15%FBS, 1 mM sodium pyruvate, 0.1 mM non-essential amino acids, 2 mM glutamate, 0.1 mM β-mercaptoethanol, 50U/ml penicillin, 50 μg/ml streptomycin,1,000 U/ml ESGRO LIF). Cells were seeded at 2×10⁴ cells/well and cultured for 3 days before ISH processing.
2.4. In situ hybridization
Cells were fixed in 4% PFA/PBS at 4°C overnight. After digestion with proteinase K, cells were hybridized overnight with 10 μl Digoxigenin-labeled riboprobe at 62°C overnight. Cells were then washed, blocked, incubated with alkaline phosphatase-conjugated anti-Digoxigenin antibody, and incubated with NBT/BCIP detection buffer for 30 minutes. See supplemental data for full protocol details.
2.5. Cytospin Cell Preparation
Cells were cultured as described in the section 2.3. The cells were harvested with 1X accutase and centrifuged at 1000 rpm for 5 minutes, washed with PBS, and fixed overnight in 4% PFA in PBS at 4 °C. The cells were washed twice with PBS, counted, and resuspended in PBS at a concentration of 1×10⁶ cells/ml. Cells (100,000) were attached to coated microscope slides (Shandon, cat#5991056) in a Shandon, Cytospin3 centrifuge at 500 rpm (low acceleration) for 5 min and dried overnight on a slide warmer at 37 °C. ISH was performed on the slides as described in the section 2.4.
2.6. Image acquisition and processing
ISH preparations were imaged under bright-field optics on an inverted microscope with DIC/phase-contrast optics. Cells were photographed at 4x, 10x, and 20x magnification. TIFF images were imported into an Open Microscopy Environment (OME) (Goldberg et al., 2005) server and manually annotated. Images were divided into 5 categories based on apparent signal strength, and four categories based on the type of staining pattern observed (Table 1). All images are available at the Jackson Laboratory Gene Expression Database (GXD) (http://www.informatics.jax.org) and the public OME site (http://ome.grc.nia.nih.gov).
Supplementary Material
Supplemental Text S1: ES cell in situ protocol
Acknowledgments
We would also like to thank Yayoi Toyooka and Hitoshi Niwa (RIKEN Center for Developmental Biology, Kobe, Japan) for sharing the information about heterogeneous expression of Zfp42/Rext1 gene in mouse ES cells. We would like to thank Michal Zalzman, Yulan Piao, Yong Qian, and Dawood Dudekula for technical assistance and discussion. We would also like to thank Ilya Goldberg and Harry Hochheiser for help in making data available through the OME. This research was supported by the Intramural Research Program of the NIH, National Institute on Aging.
Footnotes
Publisher's Disclaimer: This is a PDF file of an unedited manuscript that has been accepted for publication. As a service to our customers we are providing this early version of the manuscript. The manuscript will undergo copyediting, typesetting, and review of the resulting proof before it is published in its final citable form. Please note that during the production process errors may be discovered which could affect the content, and all legal disclaimers that apply to the journal pertain.
References
- Aiba K, Sharov AA, Carter MG, Foroni C, Vescovi AL, Ko MS. Defining a developmental path to neural fate by global expression profiling of mouse embryonic stem cells and adult neural stem/progenitor cells. Stem Cells. 2006;24:889–895. doi: 10.1634/stemcells.2005-0332. [DOI] [PubMed] [Google Scholar]
- Aida M, Chen Y, Nakajima K, Yamaguchi Y, Wada T, Handa H. Transcriptional pausing caused by NELF plays a dual role in regulating immediate-early expression of the junB gene. Mol Cell Biol. 2006;26:6094–6104. doi: 10.1128/MCB.02366-05. [DOI] [PMC free article] [PubMed] [Google Scholar]
- Ameri K, Harris AL. Activating transcription factor 4. Int J Biochem Cell Biol. 2007 doi: 10.1016/j.biocel.2007.01.020. [DOI] [PubMed] [Google Scholar]
- Ashburner M, Ball CA, Blake JA, Botstein D, Butler H, Cherry JM, Davis AP, Dolinski K, Dwight SS, Eppig JT, Harris MA, Hill DP, Issel-Tarver L, Kasarskis A, Lewis S, Matese JC, Richardson JE, Ringwald M, Rubin GM, Sherlock G. Gene ontology: tool for the unification of biology. The Gene Ontology Consortium. Nat Genet. 2000;25:25–29. doi: 10.1038/75556. [DOI] [PMC free article] [PubMed] [Google Scholar]
- Bortvin A, Eggan K, Skaletsky H, Akutsu H, Berry DL, Yanagimachi R, Page DC, Jaenisch R. Incomplete reactivation of Oct4-related genes in mouse embryos cloned from somatic nuclei. Development. 2003;130:1673–1680. doi: 10.1242/dev.00366. [DOI] [PubMed] [Google Scholar]
- Boyer LA, Lee TI, Cole MF, Johnstone SE, Levine SS, Zucker JP, Guenther MG, Kumar RM, Murray HL, Jenner RG, Gifford DK, Melton DA, Jaenisch R, Young RA. Core transcriptional regulatory circuitry in human embryonic stem cells. Cell. 2005;122:947–956. doi: 10.1016/j.cell.2005.08.020. [DOI] [PMC free article] [PubMed] [Google Scholar]
- Carter MG, Hamatani T, Sharov AA, Carmack CE, Qian Y, Aiba K, Ko NT, Dudekula DB, Brzoska PM, Hwang SS, Ko MS. In situ-synthesized novel microarray optimized for mouse stem cell and early developmental expression profiling. Genome Res. 2003;13:1011–1021. doi: 10.1101/gr.878903. [DOI] [PMC free article] [PubMed] [Google Scholar]
- Carter MG, Sharov AA, VanBuren V, Dudekula DB, Carmack CE, Nelson C, Ko MS. Transcript copy number estimation using a mouse whole-genome oligonucleotide microarray. Genome Biol. 2005;6:R61. doi: 10.1186/gb-2005-6-7-r61. [DOI] [PMC free article] [PubMed] [Google Scholar]
- Chambers I, Colby D, Robertson M, Nichols J, Lee S, Tweedie S, Smith A. Functional expression cloning of Nanog, a pluripotency sustaining factor in embryonic stem cells. Cell. 2003;113:643–655. doi: 10.1016/s0092-8674(03)00392-1. [DOI] [PubMed] [Google Scholar]
- Chong JA, Tapia-Ramirez J, Kim S, Toledo-Aral JJ, Zheng Y, Boutros MC, Altshuller YM, Frohman MA, Kraner SD, Mandel G. REST: a mammalian silencer protein that restricts sodium channel gene expression to neurons. Cell. 1995;80:949–957. doi: 10.1016/0092-8674(95)90298-8. [DOI] [PubMed] [Google Scholar]
- Chun JY, Han YJ, Ahn KY. Psx homeobox gene is X-linked and specifically expressed in trophoblast cells of mouse placenta. Dev Dyn. 1999;216:257–266. doi: 10.1002/(SICI)1097-0177(199911)216:3<257::AID-DVDY4>3.0.CO;2-0. [DOI] [PubMed] [Google Scholar]
- Cui L, Johkura K, Yue F, Ogiwara N, Okouchi Y, Asanuma K, Sasaki K. Spatial distribution and initial changes of SSEA-1 and other cell adhesion-related molecules on mouse embryonic stem cells before and during differentiation. J Histochem Cytochem. 2004;52:1447–1457. doi: 10.1369/jhc.3A6241.2004. [DOI] [PMC free article] [PubMed] [Google Scholar]
- De Arcangelis A, Georges-Labouesse E, Adams JC. Expression of fascin-1, the gene encoding the actin-bundling protein fascin-1, during mouse embryogenesis. Gene Expr Patterns. 2004;4:637–643. doi: 10.1016/j.modgep.2004.04.012. [DOI] [PubMed] [Google Scholar]
- DeGregori J, Johnson DG. Distinct and Overlapping Roles for E2F Family Members in Transcription, Proliferation and Apoptosis. Curr Mol Med. 2006;6:739–748. doi: 10.2174/1566524010606070739. [DOI] [PubMed] [Google Scholar]
- Falco G, Lee SL, Stanghellini I, Bassey UC, Hamatani T, Ko MS. Zscan4: A novel gene expressed exclusively in late 2-cell embryos and embryonic stem cells. Dev Biol. 2007 doi: 10.1016/j.ydbio.2007.05.003. [DOI] [PMC free article] [PubMed] [Google Scholar]
- Furusawa T, Ohkoshi K, Honda C, Takahashi S, Tokunaga T. Embryonic stem cells expressing both platelet endothelial cell adhesion molecule-1 and stage-specific embryonic antigen-1 differentiate predominantly into epiblast cells in a chimeric embryo. Biol Reprod. 2004;70:1452–1457. doi: 10.1095/biolreprod.103.024190. [DOI] [PubMed] [Google Scholar]
- Goldberg IG, Allan C, Burel JM, Creager D, Falconi A, Hochheiser H, Johnston J, Mellen J, Sorger PK, Swedlow JR. The Open Microscopy Environment (OME) Data Model and XML file: open tools for informatics and quantitative analysis in biological imaging. Genome Biol. 2005;6:R47. doi: 10.1186/gb-2005-6-5-r47. [DOI] [PMC free article] [PubMed] [Google Scholar]
- Han YJ, Park AR, Sung DY, Chun JY. Psx, a novel murine homeobox gene expressed in placenta. Gene. 1998;207:159–166. doi: 10.1016/s0378-1119(97)00620-3. [DOI] [PubMed] [Google Scholar]
- Hanna LA, Foreman RK, Tarasenko IA, Kessler DS, Labosky PA. Requirement for Foxd3 in maintaining pluripotent cells of the early mouse embryo. Genes Dev. 2002;16:2650–2661. doi: 10.1101/gad.1020502. [DOI] [PMC free article] [PubMed] [Google Scholar]
- Hosler BA, LaRosa GJ, Grippo JF, Gudas LJ. Expression of REX-1, a gene containing zinc finger motifs, is rapidly reduced by retinoic acid in F9 teratocarcinoma cells. Mol Cell Biol. 1989;9:5623–5629. doi: 10.1128/mcb.9.12.5623. [DOI] [PMC free article] [PubMed] [Google Scholar]
- Ivanova N, Dobrin R, Lu R, Kotenko I, Levorse J, DeCoste C, Schafer X, Lun Y, Lemischka IR. Dissecting self-renewal in stem cells with RNA interference. Nature. 2006;442:533–538. doi: 10.1038/nature04915. [DOI] [PubMed] [Google Scholar]
- Li ZJ, Wang ZZ, Zheng YZ, Xu B, Yang RC, Scadden DT, Han ZC. Kinetic expression of platelet endothelial cell adhesion molecule-1 (PECAM-1/CD31) during embryonic stem cell differentiation. J Cell Biochem. 2005;95:559–570. doi: 10.1002/jcb.20436. [DOI] [PubMed] [Google Scholar]
- Loh YH, Wu Q, Chew JL, Vega VB, Zhang W, Chen X, Bourque G, George J, Leong B, Liu J, Wong KY, Sung KW, Lee CW, Zhao XD, Chiu KP, Lipovich L, Kuznetsov VA, Robson P, Stanton LW, Wei CL, Ruan Y, Lim B, Ng HH. The Oct4 and Nanog transcription network regulates pluripotency in mouse embryonic stem cells. Nat Genet. 2006;38:431–440. doi: 10.1038/ng1760. [DOI] [PubMed] [Google Scholar]
- Maclean JA, 2nd, Chen MA, Wayne CM, Bruce SR, Rao M, Meistrich ML, Macleod C, Wilkinson MF. Rhox: a new homeobox gene cluster. Cell. 2005;120:369–382. doi: 10.1016/j.cell.2004.12.022. [DOI] [PubMed] [Google Scholar]
- MacLean JA, 2nd, Lorenzetti D, Hu Z, Salerno WJ, Miller J, Wilkinson MF. Rhox homeobox gene cluster: recent duplication of three family members. Genesis. 2006;44:122–129. doi: 10.1002/gene.20193. [DOI] [PubMed] [Google Scholar]
- Mariotti M, Manganini M, Maier JA. Modulation of WHSC2 expression in human endothelial cells. FEBS Lett. 2000;487:166–170. doi: 10.1016/s0014-5793(00)02335-8. [DOI] [PubMed] [Google Scholar]
- Matoba R, Niwa H, Masui S, Ohtsuka S, Carter MG, Sharov AA, Ko MS. Dissecting oct3/4-regulated gene networks in embryonic stem cells by expression profiling. PLoS ONE. 2006;1:e26. doi: 10.1371/journal.pone.0000026. [DOI] [PMC free article] [PubMed] [Google Scholar]
- Mitsui K, Tokuzawa Y, Itoh H, Segawa K, Murakami M, Takahashi K, Maruyama M, Maeda M, Yamanaka S. The homeoprotein Nanog is required for maintenance of pluripotency in mouse epiblast and ES cells. Cell. 2003;113:631–642. doi: 10.1016/s0092-8674(03)00393-3. [DOI] [PubMed] [Google Scholar]
- Mitsunaga K, Araki K, Mizusaki H, Morohashi K, Haruna K, Nakagata N, Giguere V, Yamamura K, Abe K. Loss of PGC-specific expression of the orphan nuclear receptor ERR-beta results in reduction of germ cell number in mouse embryos. Mech Dev. 2004;121:237–246. doi: 10.1016/j.mod.2004.01.006. [DOI] [PubMed] [Google Scholar]
- Nakatake Y, Fukui N, Iwamatsu Y, Masui S, Takahashi K, Yagi R, Yagi K, Miyazaki J, Matoba R, Ko MS, Niwa H. Klf4 cooperates with Oct3/4 and Sox2 to activate the Lefty1 core promoter in embryonic stem cells. Mol Cell Biol. 2006;26:7772–7782. doi: 10.1128/MCB.00468-06. [DOI] [PMC free article] [PubMed] [Google Scholar]
- Niwa H. How is pluripotency determined and maintained? Development. 2007;134:635–646. doi: 10.1242/dev.02787. [DOI] [PubMed] [Google Scholar]
- Payer B, Chuva de Sousa Lopes SM, Barton SC, Lee C, Saitou M, Surani MA. Generation of stella-GFP transgenic mice: a novel tool to study germ cell development. Genesis. 2006;44:75–83. doi: 10.1002/gene.20187. [DOI] [PubMed] [Google Scholar]
- Saitou M, Barton SC, Surani MA. A molecular programme for the specification of germ cell fate in mice. Nature. 2002;418:293–300. doi: 10.1038/nature00927. [DOI] [PubMed] [Google Scholar]
- Sato M, Kimura T, Kurokawa K, Fujita Y, Abe K, Masuhara M, Yasunaga T, Ryo A, Yamamoto M, Nakano T. Identification of PGC7, a new gene expressed specifically in preimplantation embryos and germ cells. Mech Dev. 2002;113:91–94. doi: 10.1016/s0925-4773(02)00002-3. [DOI] [PubMed] [Google Scholar]
- Sharov AA, Dudekula DB, Ko MS. Genome-wide assembly and analysis of alternative transcripts in mouse. Genome Res. 2005a;15:748–754. doi: 10.1101/gr.3269805. [DOI] [PMC free article] [PubMed] [Google Scholar]
- Sharov AA, Dudekula DB, Ko MS. A web-based tool for principal component and significance analysis of microarray data. Bioinformatics. 2005b;21:2548–2549. doi: 10.1093/bioinformatics/bti343. [DOI] [PubMed] [Google Scholar]
- Sharova LV, Sharov AA, Piao Y, Shaik N, Sullivan T, Stewart CL, Hogan BL, Ko MS. Global gene expression profiling reveals similarities and differences among mouse pluripotent stem cells of different origins and strains. Dev Biol. 2007 doi: 10.1016/j.ydbio.2007.05.004. [DOI] [PMC free article] [PubMed] [Google Scholar]
- Singh AM, Hamazaki T, Hankowski KE, Terada N. A Heterogeneous Expression Pattern for Nanog in Embryonic Stem Cells. Stem Cells. 2007 doi: 10.1634/stemcells.2007-0126. [DOI] [PubMed] [Google Scholar]
- Suzuki A, Raya A, Kawakami Y, Morita M, Matsui T, Nakashima K, Gage FH, Rodriguez-Esteban C, Belmonte JC. Maintenance of embryonic stem cell pluripotency by Nanog-mediated reversal of mesoderm specification. Nat Clin Pract Cardiovasc Med. 2006;3(Suppl 1):S114–122. doi: 10.1038/ncpcardio0442. [DOI] [PubMed] [Google Scholar]
- Takasaki N, Rankin T, Dean J. Normal gonadal development in mice lacking GPBOX, a homeobox protein expressed in germ cells at the onset of sexual dimorphism. Mol Cell Biol. 2001;21:8197–8202. doi: 10.1128/MCB.21.23.8197-8202.2001. [DOI] [PMC free article] [PubMed] [Google Scholar]
- Wright TJ, Costa JL, Naranjo C, Francis-West P, Altherr MR. Comparative analysis of a novel gene from the Wolf-Hirschhorn/Pitt-Rogers-Danks syndrome critical region. Genomics. 1999;59:203–212. doi: 10.1006/geno.1999.5871. [DOI] [PubMed] [Google Scholar]
- Wu CH, Lee C, Fan R, Smith MJ, Yamaguchi Y, Handa H, Gilmour DS. Molecular characterization of Drosophila NELF. Nucleic Acids Res. 2005;33:1269–1279. doi: 10.1093/nar/gki274. [DOI] [PMC free article] [PubMed] [Google Scholar]
- Yamaguchi Y, Takagi T, Wada T, Yano K, Furuya A, Sugimoto S, Hasegawa J, Handa H. NELF, a multisubunit complex containing RD, cooperates with DSIF to repress RNA polymerase II elongation. Cell. 1999;97:41–51. doi: 10.1016/s0092-8674(00)80713-8. [DOI] [PubMed] [Google Scholar]
- Yoshikawa T, Piao Y, Zhong J, Matoba R, Carter MG, Wang Y, Goldberg I, Ko MS. High-throughput screen for genes predominantly expressed in the ICM of mouse blastocysts by whole mount in situ hybridization. Gene Expr Patterns. 2006;6:213–224. doi: 10.1016/j.modgep.2005.06.003. [DOI] [PMC free article] [PubMed] [Google Scholar]
Associated Data
This section collects any data citations, data availability statements, or supplementary materials included in this article.
Supplementary Materials
Supplemental Text S1: ES cell in situ protocol