Abstract
Peptidases (proteolytic enzymes or proteases), their substrates and inhibitors are of great relevance to biology, medicine and biotechnology. The MEROPS database (http://merops.sanger.ac.uk) aims to fulfil the need for an integrated source of information about these. The organizational principle of the database is a hierarchical classification in which homologous sets of peptidases and protein inhibitors are grouped into protein species, which are grouped into families and in turn grouped into clans. Important additions to the database include newly written, concise text annotations for peptidase clans and the small molecule inhibitors that are outside the scope of the standard classification; displays to show peptidase specificity compiled from our collection of known substrate cleavages; tables of peptidase–inhibitor interactions; and dynamically generated alignments of representatives of each protein species at the family level. New ways to compare peptidase and inhibitor complements between any two organisms whose genomes have been completely sequenced, or between different strains or subspecies of the same organism, have been devised.
INTRODUCTION
The MEROPS database is a manually curated information resource for peptidases (also known as proteases, proteinases or proteolytic enzymes), their inhibitors and substrates. The database has been in existence since 1996 and can be found at http://merops.sanger.ac.uk. Releases are made quarterly.
Peptidases and protein inhibitors are arranged in the database according to a hierarchical classification. The classification is based on sequence comparisons of the domains known to be important for activity (known as the peptidase or inhibitor unit). A protein that has been sequenced and characterized biochemically is chosen as a representative (‘holotype’). All sequences that represent species variants of the holotype are grouped into a ‘protein species’. The sequences of statistically significant related protein species are grouped into a ‘family’. Families that are believed to have had a common ancestor, either because the tertiary structures of the proteins are similar or (in the case of peptidases) active site residues are in the same order in the sequence, are grouped into a ‘clan’ (1,2).
Statistics from release 7.8 (April 2007) of MEROPS are shown in Table 1 and compared with release 7.1 from July 2005. The number of peptidase sequences has more than doubled, whereas the numbers of protein families and clans has increased only marginally. This reflects the considerable effort being put into completing genome sequences. There has also been a significant increase (17%) in the number of peptidase species.
Table 1.
Counts of protein species, families and clans for peptidase and protein inhibitor homologues in the MEROPS database
| MEROPS 7.8 | MEROPS 7.1 | |||
|---|---|---|---|---|
| Peptidases | Inhibitors | Peptidases | Inhibitors | |
| Sequences | 66 524 | 4 912 | 30 090 | 3 690 |
| Protein species | 2 403 | 571 | 2 053 | 532 |
| Families | 185 | 53 | 180 | 53 |
| Clans | 51 | 33 | 39 | 32 |
CLAN SUMMARIES
We have expanded the text summaries to include clans of peptidases. A peptidase clan summary is structured under the headings: description, history (when and where the clan identifier was first published), contents of clan (a description of the types of peptidases contained within the clan), evidence (an explanation as to why the families are included in the same clan), catalytic mechanism, peptidase activity, protein fold (descriptions of the known tertiary structures for members of the clan and to which families they belong), homologous non-peptidase families (families of proteins other than peptidases that share a similar tertiary structure), evolution (pointing out possible relationships that may exist with peptidases in other clans or significant absences amongst organism kingdoms), activation mechanism and other databases (links to clans in the Pfam database (3) and superfamilies in the SCOP database (4)).
SUBSTRATE DISPLAYS
Specificity logos
One of the most important characteristics of a peptidase that distinguishes it from related peptidases is its action on substrates. For some peptidases, such as trypsin, the specificity is easily described because catalytic activity action is restricted to cleavage of lysyl or arginyl bonds. However, for many peptidases specificity is much more complex, and is difficult to define.
Schechter and Berger (5) introduced a naming convention that helps with the description of peptidase specificity. The peptide chain around the cleavage site of the substrate is assumed to thread through the active site of the peptidase so that each binding pocket of the peptidase is occupied by one amino acid, and many crystal structures of peptidase–inhibitor complexes tend to confirm this model. The residues of the substrate C-terminal to the site of cleavage (the ‘scissile bond’) are numbered P1′, P2′, P3′, etc. (the ‘prime side’), whereas those N-terminal to the scissile bond are numbered P1, P2, P3, etc. (the ‘non-prime side’). Each binding pocket of the peptidase (which may be lined with several amino acid side chains) on the prime side is numbered S1′, S2′, S3′, etc. and those on the non-prime side are numbered S1, S2, S3, etc. The number of important binding pockets (and therefore substrate residues) differs between peptidases. In trypsin, specificity is determined only by residues in P1 and P1′ (only arginine or lysine are acceptable in P1 and proline is not acceptable in P1′). Peptidases that have a specificity requirement beyond P1 or P1′ are said to have an ‘extended binding site’. Mitochondrial intermediate peptidase, which removes an N-terminal octapeptide targeting signal from proteins destined for the mitochondrial lumen, may have the longest extended binding site (6), but for most peptidases binding rarely exceeds P4.
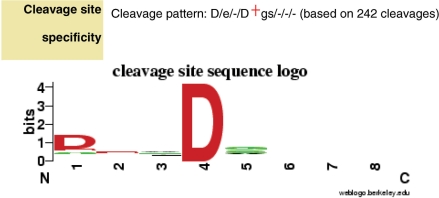
The MEROPS collection of cleavages in natural and synthetic substrates now exceeds 7000. For each cleavage we store up to four residues on either side of the scissile bond (residues P4–P4′). For any peptidase with more than ten known cleavages we now present a display that gives an indication of the amino acids preferred at its substrate-binding sites. This display uses the WebLogo software (7). For the purposes of this display, the eight residues P4–P4′ for all substrates of a peptidase are considered to be an alignment. The observed frequency of amino acids at each position is calculated as a bit score, with the maximum possible score being 4.32 bits. At each position, the single-letter code of an amino acid is shown if the bit score exceeds 0.1, and the height of the letter is proportional to the bit score. Acidic residues are shown in red, basic in blue, hydrophobic residues in black and others in green. Figure 1 shows the cleavage site sequence logo for caspase-3. The logo shows an absolute requirement for aspartate in P1 (position 4) and a preference for aspartate in P4, and this specificity has been confirmed by experimentation (8).
Figure 1.
Cleavage site sequence logo showing specificity for caspase-3. Amino acids preferred in positions P4–P4′ are shown in single-letter code. The specificity is shown as a string where each position is separated by a forward slash character and multiple letters in a position indicate a wide specificity for these amino acids. The scissile bond is shown by a red cross symbol. In the diagram, the height of the letter is proportional to the number of cleavage sites in which it is present. Positions P4–P4′ are numbered one to eight, with the scissile bond between residues four and five. Caspase-3, like most caspases, has a preference for Asp in P1 and a majority of substrates also have Asp in P4.
In addition to the logo, a text string describing the specificity is also shown (Figure 1). Where only one amino acid predominates at a position, it is shown in uppercase if the bit score exceeds 0.4. Where more than one amino acid exceeds 0.1 bits for a single position, a letter is shown in uppercase if the bit score exceeds 0.7.
SMALL MOLECULE INHIBITORS
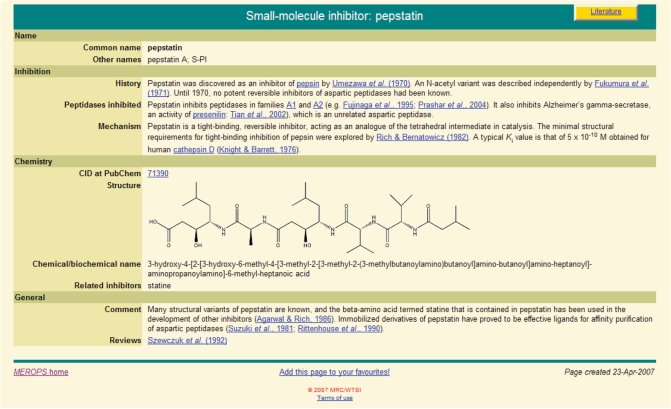
The MEROPS database has included protein inhibitors of peptidases since 2004. However, there are many other inhibitors that are not proteins, including peptides and synthetic inhibitors, which we term small molecule inhibitors (SMIs). These include many that are laboratory reagents used in the characterization of peptidases, and others that are drugs such as the inhibitors of the retropepsin of the HIV virus. Information about SMIs has now been collated and is presented within MEROPS. There is no satisfactory, single method to classify SMIs, so their names and alternative names are simply listed alphabetically. For many SMIs summaries have been written. Each summary contains a recommended name, other names including the chemical name, history, details of peptidases inhibited, a description of the mechanism of inhibition, an image of the chemical structure, a cross reference to the PubChem database (9), comments and recommended reviews. An example summary page for pepstatin is shown in Figure 2. In addition, a ‘Relevant Inhibitors’ field has been added to the peptidase summaries, which lists SMIs that are known to inhibit the peptidase or that do not inhibit even if expected to. Each item in the list has a link to the relevant SMI summary.
Figure 2.
Example SMI page. The summary page for the inhibitor pepstatin is shown.
INHIBITOR DISPLAYS
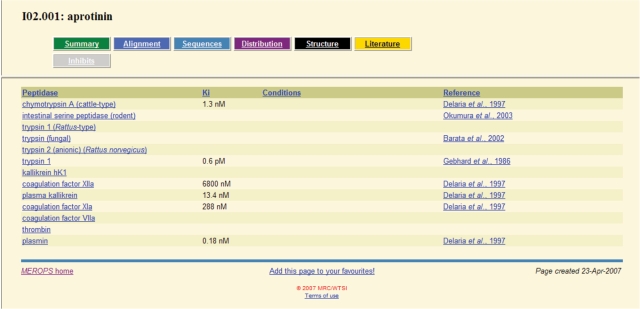
We have collected over 900 known peptidase–protein inhibitor interactions from the literature. At least one interaction with a peptidase is known for 375 inhibitor species. We now present a table of interactions for each inhibitor, which includes a link to relevant peptidase summary, a reference and some details such as a published Ki (dissociation constant) figure and conditions or comments about the interaction. An example is shown in Figure 3. A similar table is also presented for each peptidase, listing the inhibitors with which it interacts.
Figure 3.
Peptidase–inhibitor interactions for aprotinin.
COMPARATIVE GENOMICS
Comparison of peptidase/inhibitor complement between strains of an organism
It is commonplace for several strains of a bacterium to be subjected to genome sequencing. In MEROPS, we have always maintained a non-redundant sequence collection, and only one variant of a protein sequence is retained, unless there is evidence that the proteins are products of different genes. This has meant that for each bacterial protein we display only one sequence, even though variations may be known from several different strains. All proteins derived from the same species have been considered part of the same genomic complement, regardless of strain. This approach may hide unique expression of proteins that may have medical significance. For example, not all strains of Escherichia coli are pathogenic, and peptidases or inhibitors restricted to pathogenic strains may be of medical importance. Similarly, some proteins important for pathogenicity may be inactivated by residue replacements in non-pathogenic strains. To address this problem, whilst still maintaining our non-redundant sequence collection, we have made use of our nucleotide database sequence accession collection, which is now annotated below the species level (subspecies, strain, pathovar, etc.).
We now present two displays showing comparison of peptidases or inhibitors between strains of a prokaryote organism. The user is invited to select an organism from a list of prokaryotes with completed genomes. The first display shows clans and families and the number of sequences in each family for each strain. This enables the user to spot absences or additional members for the strain of interest. The second display is at the protein species level. Not only can absences or additional proteins be observed, but also we provide a dynamically generated alignment so that conservation of residues for the same protein from different strains can be assessed. The sequences are taken directly from the UniProt protein sequence database (10) and the alignment is generated by the MUSCLE software package (11).
To complement these changes, the genomes pages now show counts of peptidases and protein inhibitors at the strain level.
Comparison of peptidase/inhibitor complements between organisms
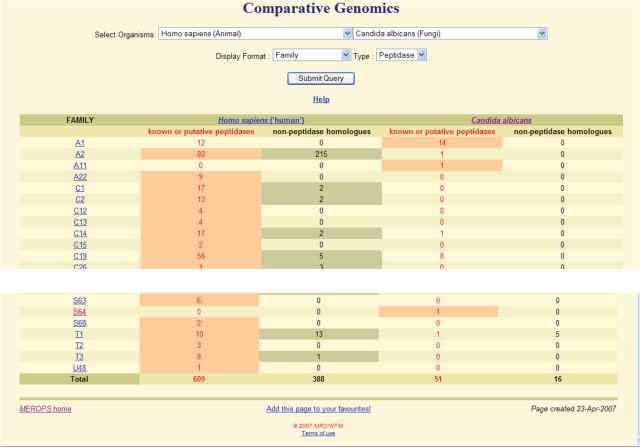
We have also developed a display so that comparisons can be made between any two organisms with completely sequenced genomes, not just prokaryotes. The comparison can be done at the family or protein species levels, and counts are shown of peptidase homologues for each species. Significant differences between the organisms are highlighted. At the family level, separate counts are shown for homologues presumed to be peptidases (i.e. possessing all active site residues) and those that are predicted to be non-peptidase homologues (with an unacceptable replacement of at least one active site residue). Figure 4 shows part of the comparison between human and the pathogenic fungus Candida albicans (the causative agent of thrush) at the family level. The only peptidase family present in C. albicans but absent in humans is S64, which includes the Ssy5 peptidase, a component of the pathways for the uptake of external amino acids; the peptidase activates the Stp1 transcription factor leading to production of an amino acid permease (12). This identifies the Ssy5 peptidase as a potential drug target, because no homologue exists in human and the equivalent gene has been shown to be essential in Saccharomyces cerevisiae by the Saccharomyces Genome Deletion Project (13).
Figure 4.
Comparison between the peptidase complements of the human and the C. albicans genomes. Only the top and bottom portions of the table are shown.
ALIGNMENTS AND TREES
Dynamic alignments for holotypes
With the completion of so many prokaryote and eukaryote genomes, the number of sequences within some families now exceeds a thousand. The alignments we generate can therefore be very large. However, within any family the number of proteins characterized well enough to be considered holotypes is still small. The family with most holotypes is S1, for which there are over 3000 sequences and 400 holotypes. So that the variability within a family can be more easily understood, we now generate an alignment of peptidase or inhibitor units just for the holotypes in each family. The MUSCLE software package (11) is used to generate each alignment. Active site residues, disulphide bridges, carbohydrate-attachment sites and transmembrane regions are highlighted.
New label keys for family alignments and trees
The label keys for the family alignments and trees are now generated dynamically. The content of each line has been altered and now shows the MEROPS identifier (linked to the relevant summary page), the organism name (linked to the relevant organism card), the recommended name (and any subset of that name), the MEROPS accession number for the sequence (linked to the sequence page), and the extent of the peptidase or inhibitor unit.
SUMMARY
The focus of the MEROPS database for the last 2 years has been towards the addition of further annotation at the protein species level. One peptidase species can be distinguished from another by several criteria, including its interactions with substrates and inhibitors, and we now include displays for both of these aspects. New tools enable the user compare peptidases and protein inhibitor species between strains of the same organism or between organisms.
AVAILABILITY
The database is freely available and can be accessed from http://merops.sanger.ac.uk. Our sequence databases in FastA format and versions of the database as either flat files or a compressed file of SQL statements for import into MySQL can be uploaded from our FTP site (ftp://ftp.sanger.ac.uk/pub/MEROPS).
ACKNOWLEDGEMENTS
We wish to thank the Wellcome Trust and the Medical Research Council for financial support. Funding to pay the Open Access publication charges for this article was provided by the Wellcome Trust.
Conflict of interest statement. None declared.
REFERENCES
- 1.Rawlings ND, Barrett AJ. Evolutionary families of peptidases. Biochem. J. 1993;290:205–218. doi: 10.1042/bj2900205. [DOI] [PMC free article] [PubMed] [Google Scholar]
- 2.Rawlings ND, Tolle DP, Barrett AJ. Evolutionary families of peptidase inhibitors. Biochem. J. 2004;378:705–716. doi: 10.1042/BJ20031825. [DOI] [PMC free article] [PubMed] [Google Scholar]
- 3.Finn RD, Mistry J, Schuster-Bockler B, Griffiths-Jones S, Hollich V, Lassmann T, Moxon S, Marshall M, et al. Pfam: clans, web tools and services. Nucleic Acids Res. 2006;34(Database issue):D247–D251. doi: 10.1093/nar/gkj149. [DOI] [PMC free article] [PubMed] [Google Scholar]
- 4.Andreeva A, Howorth D, Brenner SE, Hubbard TJ, Chothia C, Murzin AG. SCOP database in 2004: refinements integrate structure and sequence family data. Nucleic Acids Res. 2004;32(Database issue):D226–D229. doi: 10.1093/nar/gkh039. [DOI] [PMC free article] [PubMed] [Google Scholar]
- 5.Schechter I, Berger A. On the active site of proteases. 3. Mapping the active site of papain; specific peptide inhibitors of papain. Biochem. Biophys. Res. Commun. 1968;32:898–902. doi: 10.1016/0006-291x(68)90326-4. [DOI] [PubMed] [Google Scholar]
- 6.Branda S.S, Isaya G. Prediction and identification of new natural substrates of the yeast mitochondrial intermediate peptidase. J. Biol. Chem. 1995;270:27366–27373. doi: 10.1074/jbc.270.45.27366. [DOI] [PubMed] [Google Scholar]
- 7.Crooks GE, Hon G, Chandonia J.-M, Brenner SE. WebLogo: a sequence logo generator. Genome Res. 2004;14:1188–1190. doi: 10.1101/gr.849004. [DOI] [PMC free article] [PubMed] [Google Scholar]
- 8.Thornberry NA, Rano TA, Peterson EP, Rasper DM, Timkey T, Garcia-Calvo M, Houtzager VM, Nordstrom PA, et al. A combinatorial approach defines specificities of members of the caspase family and granzyme B. Functional relationships established for key mediators of apoptosis. J. Biol. Chem. 1997;272:17907–17911. doi: 10.1074/jbc.272.29.17907. [DOI] [PubMed] [Google Scholar]
- 9.Wheeler DL, Barrett T, Benson DA, Bryant SH, Canese K, Chetvernin V, Church DM, DiCuccio M, et al. Database resources of the National Center for Biotechnology Information. Nucleic Acids Res. 2007;35(Database issue):D5–D12. doi: 10.1093/nar/gkl1031. [DOI] [PMC free article] [PubMed] [Google Scholar]
- 10.Wu CH, Apweiler R, Bairoch A, Natale DA, Barker WC, Boeckmann B, Ferro S, Gasteiger E, et al. The Universal Protein Resource (UniProt): an expanding universe of protein information. Nucleic Acids Res. 2006;34(Database issue):D187–D191. doi: 10.1093/nar/gkj161. [DOI] [PMC free article] [PubMed] [Google Scholar]
- 11.Edgar RC. MUSCLE: a multiple sequence alignment method with reduced time and space complexity. BMC Bioinformatics. 2004;5:113. doi: 10.1186/1471-2105-5-113. [DOI] [PMC free article] [PubMed] [Google Scholar]
- 12.Abdel-Sater F, El Bakkoury M, Urrestarazu A, Vissers S, Andre B. Amino acid signaling in yeast: casein kinase I and the Ssy5 endoprotease are key determinants of endoproteolytic activation of the membrane-bound Stp1 transcription factor. Mol. Cell. Biol. 2004;24:9771–9785. doi: 10.1128/MCB.24.22.9771-9785.2004. [DOI] [PMC free article] [PubMed] [Google Scholar]
- 13.Wilson WA, Roach PJ. Saccharomyces gene deletion project: applications and use in the study of protein kinases and phosphatases. Meth. Enzymol. 2003;366:403–418. doi: 10.1016/s0076-6879(03)66030-1. [DOI] [PubMed] [Google Scholar]


