Abstract
FlyBase (http://flybase.org) is the primary resource for molecular and genetic information on the Drosophilidae. The database serves researchers of diverse backgrounds and interests, and offers several different query tools to provide efficient access to the data available and facilitate the discovery of significant relationships within the database. Recently, FlyBase has developed Interactions Browser and enhanced GBrowse, which are graphical query tools, and made improvements to the search tools QuickSearch and QueryBuilder. Furthermore, these search tools have been integrated with Batch Download and new analysis tools through a more flexible search results list, providing powerful ways of exploring the data in FlyBase.
INTRODUCTION
FlyBase is a comprehensive resource of information on the insect family Drosophilidae, and one of the major model organism database projects that support biomedical research (see http://www.nih.gov/science/models/). Although its principal focus is Drosophila melanogaster, which has been used for genetic research since the beginning of the 20th century (1), FlyBase also incorporates information on all Drosophilidae, including the 11 additional Drosophila species that were recently sequenced (2,3). The steady increase in publications relating to Drosophila in conjunction with the whole genome sequence and other high-throughput data has produced an extraordinary volume of data. An important priority for FlyBase over the last few years has been an extensive revision of data management methods, which resulted in the storage of practically all FlyBase data sets in a single relational database using the Chado schema (4). The new database was used to produce the FB2006_01 release of FlyBase in December 2006, which also included a major redesign of the user interface (5).
One of the key challenges facing any database is to enable the efficient retrieval of information, and also allow the discovery of relationships between different information in the database. The search tools that FlyBase has developed serve a number of distinct functions that enable the scientific community to take full advantage of the way the information is stored in the database. The simple search tools QuickSearch and Jump to Gene are designed to help users navigate to a report page where information related to the object is presented, such as the size of an mRNA transcript or the orthologs of a gene. Other tools, such as GBrowse and the new Interactions Browser, highlight relationships between objects through a graphical interface, while QueryBuilder provides users with the ability to perform complex multi-step queries across all fields and different data sets. In this article, we present an overview of the new and improved FlyBase search tools, which take advantage of the integration of molecular and genetic data curated from the literature with annotated gene models and reagents aligned to the sequence in the database, and discuss the most important new features, including how results can be passed between tools for further analysis.
GOOGLE™ FLYBASE, QUICKSEARCH AND JUMP TO GENE
A Google™ FlyBase site search is provided for searching documentation and other non-data-driven content of the FlyBase site. Although report pages are also searchable via Google™, this is typically an inefficient approach and does not allow the creation and manipulation of coherent sets of biologically related information. Google™ is blind to the underlying relationships of the data in FlyBase and without the ability to target a search to defined data types, a search, such as for the gene name cortex, or the symbol cnn, can produce many spurious hits.
FlyBase provides two simple search tools, QuickSearch on the homepage and Jump to Gene in the menu bar of every page, that use knowledge of data classes and common data entry points to either take you directly to a gene or other record, or to produce a short list of relevant options. Jump to Gene, which has no user-selected settings, attempts to identify a single best match based on unique identifiers, gene symbols or synonyms or gene name, in that order. QuickSearch is a little more sophisticated providing access to different data classes, and enabling expansion of the search to all species and all report text. One notable improvement to QuickSearch is that the symbol of a gene can now be entered under many data classes to list all objects of the data class that are associated with the gene. For instance, selecting ‘clones’ as the data class and entering ‘dpp’ will list all of the genomic and cDNA clones of the decapentaplegic gene. QuickSearch and Jump to Gene are highly effective tools and are the principal entry points to the FlyBase data for the majority of our users. However, these tools are primarily designed for speed and ease of use. More complex queries that target other data fields or integrate several search criteria can be accomplished with QueryBuilder.
QUERYBUILDER
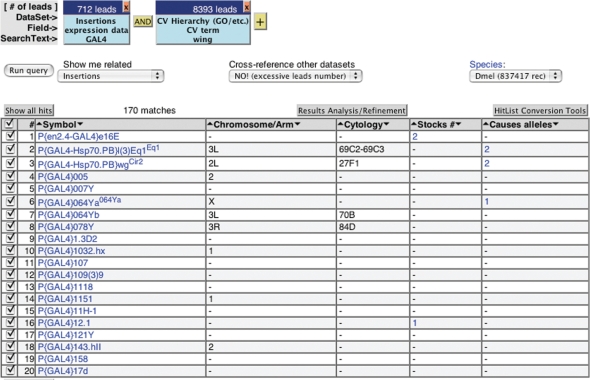
QueryBuilder supports sophisticated searches that take full advantage of how the data are stored in FlyBase. A search can be focused to a particular piece of data within a report page, such as the ‘mapped features and mutations’ associated with a gene, and Boolean operators can be used to combine two or more searches. This enables complex queries within and across different FlyBase data sets. For example, you can use QueryBuilder to find GAL4 insertions that are expressed in the wing (Figure 1).
Figure 1.
QueryBuilder results. The results of a two step QueryBuilder search to identify GAL4 insertions expressed in the wing or which are associated with wing phenotypes are shown. Each query leg appears at the top of the page. The columns in a hit list are dependent on the data class being searched. Each column can be sorted by clicking the small arrows on either side of the column header. Records are selected for further manipulation via the checkboxes at the left; all hits are selected by default.
A complex query comprised of several individual parts can be run at any stage of its construction to ensure that the chosen constraints are operating as expected at each step. The search results are shown in the form of a standard hit list, described below. If the number of leads found during the search is not excessive, QueryBuilder also displays buttons above the hit list that provide access to data related to the results of your initial search. For example, data sets related to a list of genes could include the alleles of those genes, related clones, and available stocks. Another useful option of QueryBuilder is that a list of FlyBase identifiers or valid symbols can be imported from an external file to use as a query segment. This provides an easy way to explore bulk data such as genes identified in a microarray experiment. For example, an uploaded list of identifiers can be used to retrieve genes data. The resulting data set can then be examined for the frequency of genes annotated with a given Molecular Function or Biological Process controlled vocabulary term by using the Results Analysis and Refinement tool of the hit list.
With the release of FlyBase FB2007_01 we revised the QueryBuilder interface to make it more intuitive to use. The search is now specified within a single window, which contains a series of tabs that lead you through the specification of a query term. All fields in a report are available for targeted searches and they are listed as they appear on the report pages to make them easier to understand. The help documentation describes many features of QueryBuilder, such as its ability to perform calculations on the data. A notable feature we would like to emphasize is that QueryBuilder can be used to refine a list of results generated by another search tool. A set of results can be exported to QueryBuilder as described under the hit list section, and then modified to refine the search by adding additional query segments. Thus, QueryBuilder is a very powerful tool that can be used in many different ways to explore the data in FlyBase and is now tightly integrated with other FlyBase query tools.
HIT LISTS
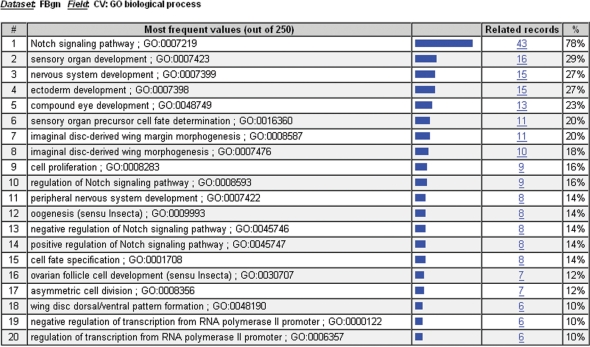
The search results page, the hit list, is presented when you perform any search that returns multiple hits (Figure 1). By default, all records are selected for inclusion in subsequent manipulations, but the checkboxes allow user-defined subsets to be created. The first data column links directly to the report for each record that matched your search. Other columns link to GBrowse or to searches that return hits directly related to that record. In addition to these links, the hit list provides a set of powerful tools for query refinement or batch processing. The ‘Show related’ drop-down menu enables you to see all objects of a particular class that are related to the hits selected in your list. For example, selecting ‘Clones’ from the ‘Show related’ menu of a genes search will return a list of clones that are related to the selected genes. The ‘Results Analysis/Refinement’ button provides the frequency of values within your selected hits for a predefined list of fields. Selecting ‘Biological Process’, for example, from the Results Analysis/Refinement tool for a list of genes involved in the Notch signaling pathway will result in a page listing the distribution of the different Biological Process controlled vocabulary terms associated with the list (Figure 2). Clicking on the number in the ‘Related records’ column will return the genes that make up that distribution bin. Lastly, the ‘HitList Conversion Tools’ button allows you to send the selected hits to the Batch Download tool or to a new QueryBuilder session for further advanced queries, to download IDs to a local file on your computer, or to view HTML tables of various third-party data sources linked to the hits in your result list.
Figure 2.
Results Analysis/Refinement Tool. The Results Analysis/Refinement Tool has been used to display the distribution of Biological Process controlled vocabulary terms applied to a list of the components of the Notch signaling pathway. The second column displays the term for which the distribution was created. The next three columns show a graphical display, the raw size, and the relative size of the term in the distribution. Clicking on the number in the ‘Related records’ column will return a hit list containing the individual records that make up that bin.
BATCH DOWNLOAD
The Batch Download tool provides bulk access to a variety of data and data formats, such as FASTA sequence data and XML files, for a specified list of unique IDs (secondary IDs, synonyms or full names are not allowed because they are not unique). IDs can be sent from a FlyBase hit list, uploaded from a local file, or entered manually. Notably, the Field Data output format provides access to two types of data: data from our set of precomputed flat files and data from the HTML reports. Any line from a precomputed file that matches the list of IDs you supplied can be downloaded using the precomputed file option. The HTML table option allows you to create a custom report with only the fields you want while preserving hyperlinks for direct navigation to other FlyBase data. Recently, the HTML table option has been improved by listing all fields as they appear on the report pages, and making them easier to identify by categorizing them as CV (controlled vocabulary), Symbol, Date or Text.
INTERACTIONS BROWSER
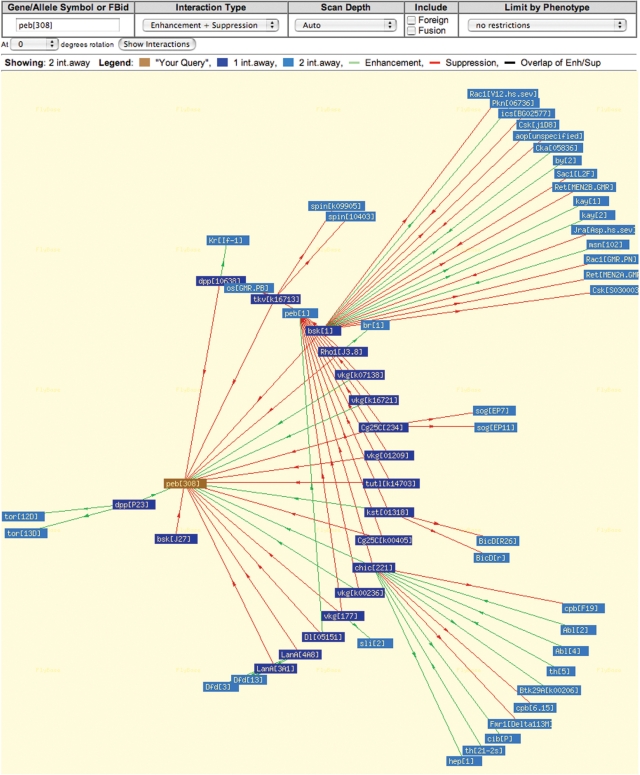
The Interactions Browser is a new program available under the ‘Tools’ menu that provides a graphical way of exploring the genetic interactions reported in the allele reports. The browser works in two modes: you can either search for the interactions of an allele (Figure 3), or the interactions of a gene. The latter will show the interactions of all alleles of the gene. Each node of an interaction diagram is a hyperlink, which enables you to navigate and browse the complex web of known genetic interactions. Placing your cursor over the center of a node activates a pop-up window that in the case of a network of gene interactions contains a summary of the function of that particular gene, while in the case of interactions between alleles shows the context in which the interactions of that allele have been reported.
Figure 3.
Interactions Browser. The options at the top of the page of the Interactions Browser permit the selection of different types of interaction data and adjustment of the scan depth, which refers to the number of interaction steps shown from the query. The ‘auto’ value set for the scan depth by default chooses a number based on the complexity of the data. In the diagram, the alleles or genes that interact directly with the query allele or gene are shown in dark blue, and alleles or genes that interact with them are shown in light blue if the scan depth is set to 2. The program uses different colored lines to indicate the type of interaction and arrows to denote the direction in which the interaction was recorded. In some interaction diagrams that have many alleles or genes, the symbols can overlap making it hard to identify them. To view this data the picture can be redrawn in another orientation by choosing a different rotation factor.
The Interactions Browser can also be invoked from the ‘Results Analysis/Refinement’ button above a hit list produced by another query tool to analyze the relationships between alleles or genes in the results list. In this case, every item in the list is treated as a primary query term and several diagrams will be drawn if the list of results contains distinct groups of alleles or genes that do not interact or share interaction partners. The Interactions Browser offers an intuitive way to learn about the genetic interactions known between alleles, and we hope it will suggest experiments when new interactions are discovered.
GBROWSE
GBrowse is a GMOD tool (6) that displays features of the genome aligned to the genomic sequence. By default, FlyBase presents a view of D. melanogaster that displays gene models, transcript and polypeptide data, natural transposon insertion sites, and cDNAs. These, and many additional tracks (67 options at present), are easily configured to create a customized view of the data. You can navigate to a specific location by entering a precise sequence range, or any valid FlyBase identifier for a gene, gene product or insertion in the ‘Landmark or Region’ box. ‘Advanced Search’ enables you to move to a particular cytological location. Additionally, FlyBase BLAST output includes GBrowse links that display each BLAST alignment as a highlighted feature in the context of neighboring gene models and other features of the region. This is an extremely useful entry path into the sequence data of species other than D. melanogaster, which in some cases is comprised of a large number of relatively short unlinked scaffolds.
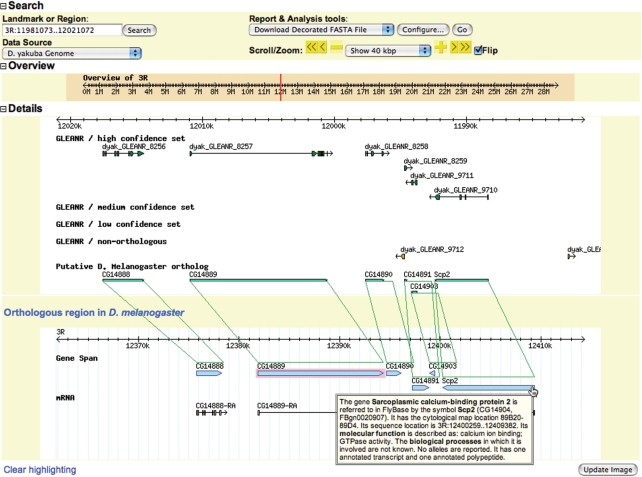
Development of FlyBase GBrowse over the last year has focused on facilitating exploration of the newly sequenced Drosophila species genomes. By adding ‘Similarity’ tracks to the D. melanogaster genome view you can use the resulting ortholog links to navigate to orthologs in the other species. You can also find an ortholog by selecting the species from the ‘Data Source’ menu and entering the D. melanogaster gene symbol or FBgn ID in the ‘Landmark or Region’ box. For genomes other than D. melanogaster GBrowse is configured by default to show two windows that indicate how the region displayed is related to D. melanogaster. The top window of this ‘OrthoView’ displays a representation of the genome of the selected species showing the predicted gene. If this window contains a putative ortholog, a second window will appear with the D. melanogaster genome aligned to the ortholog closest to the center of the upper window. The relationship between the genomes is shown by sets of green lines that connect the orthologs in the region displayed (Figure 4). Furthermore, we have added pop-ups to GBrowse to provide a gene summary when you mouse-over a gene span, and information on an insertion when you hover over the transgene insertion site. This is helpful if you are unfamiliar with a gene, or when viewing sequence ranges over 100 kbp, where the symbols of genes and insertions can become hard to read or may not be displayed at all. These enhancements to GBrowse not only make it easy to obtain information about genes and their orthologs, but also enable the identification of regions of the genomes of the newly sequenced species that appear to have undergone rearrangements.
Figure 4.
GBrowse. The ‘OrthoView’ of GBrowse shows an alignment of one of the newly sequenced Drosophila genomes with the genome of D. melanogaster. The alignment of putative orthologs within the region displayed is indicated by green lines connecting the two genome views. Information about the D. melanogaster genes displayed is provided in a pop-up window when you place your mouse over a gene span. Each gene and transcript within the D. melanogaster genome view is linked to a detailed report page and this function will be extended to the other genomes when report pages are created.
CONCLUSION
The tighter integration, additional features and improvement in usability of FlyBase search tools offer biologists many more options to analyze their results and discover relationships between genes and the different types of data available in the database. This is particularly important, as recently discussed by Zhong and Sternberg (7), given the increase in sequence data and the number of system-wide data sets available. FlyBase has adopted several strategies to integrate search tools and provide better data access. Search results are now treated as data sets that can be transferred between tools. This enables the results to be refined by adding additional criteria in QueryBuilder, or the creation of a customized view of specific data fields associated with results by using the ‘Field data’ option of the Batch Download tool. The latter option is particularly useful for rapidly comparing information across a set of results, such as the predicted molecular weight of proteins found in a search. In addition, the development of the Interactions Browser and enhancements to GBrowse, which both display relationships between objects in the database graphically, make it much easier for users to explore the data. All search tools are obviously limited by the quality of the data stored in the database, and we encourage the members of our user community to report any errors or omissions they find. In addition, when interpreting the results of a search, it is important to consider the nature of the underlying data. For example, the interactions shown for genes by the Interactions Browser represent the data of all alleles, which may include antimorphic or neomorphic alleles whose functions do not reflect the wild-type role of the gene. The improvements to the set of FlyBase query tools should enable users to fully exploit the information contained in the database and we hope that they will prove effective at generating new hypothesis and stimulating further experiments.
ACKNOWLEDGEMENTS
FlyBase is supported by the U.S. National Human Genome Research Institute, National Institutes of Health (P41 HG00739) and additional grants from the Indiana Genomics Initiative, USA and the Medical Research Council, UK (G05000293). Funding to pay the Open Access publication charges for this article was provided from the NIH grant (P41 HG00739) to FlyBase.
Conflict of interest statement. None declared.
REFERENCES
- 1.Sturtevant AH. A history of genetics, Harper and Row, New York. New York: Harper & Row; 1965. pp. 45–50. [Google Scholar]
- 2.Drosophila 12 Genomes Consortium. Evolution of genes and genomes on the Drosophila phylogeny. Nature. 2007;450:203–218. doi: 10.1038/nature06341. [DOI] [PubMed] [Google Scholar]
- 3.Stark A, Lin MF, Kheradpour P, Pedersen JS, Parts L, Carlson JW, Crosby MA, Rasmussen MD, Roy S, et al. Discovery of functional elements in 12 Drosophila genomes using evolutionary signatures. Nature. 2007;450:219–232. doi: 10.1038/nature06340. [DOI] [PMC free article] [PubMed] [Google Scholar]
- 4.Mungall CJ, Emmert DB. A Chado case study: an ontology-based modular schema for representing genome-associated biological information. Bioinformatics (Oxford, England) 2007;23:i337–i346. doi: 10.1093/bioinformatics/btm189. [DOI] [PubMed] [Google Scholar]
- 5.Crosby MA, Goodman JL, Strelets VB, Zhang P, Gelbart WM. FlyBase: genomes by the dozen. Nucleic Acids Res. 2007;35:D486–D491. doi: 10.1093/nar/gkl827. [DOI] [PMC free article] [PubMed] [Google Scholar]
- 6.Stein LD, Mungall C, Shu S, Caudy M, Mangone M, Day A, Nickerson E, Stajich JE, Harris TW, et al. The generic genome browser: a building block for a model organism system database. Genome Res. 2002;12:1599–1610. doi: 10.1101/gr.403602. [DOI] [PMC free article] [PubMed] [Google Scholar]
- 7.Zhong W, Sternberg PW. Automated data integration for developmental biological research. Development. 2007;134:3227–3238. doi: 10.1242/dev.001073. [DOI] [PubMed] [Google Scholar]


