Abstract
The PhosPhAt database provides a resource consolidating our current knowledge of mass spectrometry-based identified phosphorylation sites in Arabidopsis and combines it with phosphorylation site prediction specifically trained on experimentally identified Arabidopsis phosphorylation motifs. The database currently contains 1187 unique tryptic peptide sequences encompassing 1053 Arabidopsis proteins. Among the characterized phosphorylation sites, there are over 1000 with unambiguous site assignments, and nearly 500 for which the precise phosphorylation site could not be determined. The database is searchable by protein accession number, physical peptide characteristics, as well as by experimental conditions (tissue sampled, phosphopeptide enrichment method). For each protein, a phosphorylation site overview is presented in tabular form with detailed information on each identified phosphopeptide. We have utilized a set of 802 experimentally validated serine phosphorylation sites to develop a method for prediction of serine phosphorylation (pSer) in Arabidopsis. An analysis of the current annotated Arabidopsis proteome yielded in 27 782 predicted phosphoserine sites distributed across 17 035 proteins. These prediction results are summarized graphically in the database together with the experimental phosphorylation sites in a whole sequence context. The Arabidopsis Protein Phosphorylation Site Database (PhosPhAt) provides a valuable resource to the plant science community and can be accessed through the following link http://phosphat.mpimp-golm.mpg.de
INTRODUCTION
Phosphorylation is the most studied post-translational modification (PTM) involved in signaling. The principle of activation and inactivation of proteins by phosphorylation as well as the function of phosphorylated residues as docking sites for protein scaffolds and complex assemblies has been well characterized in the field of mammalian signal transduction (1–4). In the field of plant biology, the focus so far has been on the analysis of phosphorylation of specific proteins and protein families (5,6) and the study of very specific signaling pathways (7,8), mainly using genetic tools.
In recent years, several techniques have been developed and optimized to allow more large scale and high throughput analyses of protein phosphorylation by mass spectrometry (9–11). In recent years, a number of global studies of plant protein phosphorylation sites have been carried out on various tissues and under a variety of biological conditions ranging from biotic and abiotic stresses to changing nutrient environments (12–15). These datasets were made available in large supplementary or printed tables with different specific information for each peptide, making these large tables difficult to handle in comparative analyses. There is currently no resource in the plant field that collects such information and makes it available to the community in a readily searchable format, thereby providing the possibility for added value through combined and comparative data interpretation.
While a number of phosphorylation databases are available, these are generally concentrated on studies undertaken in mammalian and prokaryotic systems. Phosida (16) contains large scale data from in house studies of Homo sapien and Bacillus subtilis; The Phosphorylation Site Database (http://vigen.biochem.vt.edu/xpd/xpd.htm) contains phosphorylation information from prokaryotic organisms; Phospho.ELM (http://phospho.elm.eu.org/) contains validated phosphorylation sites from eukaryotic systems but is heavily biased towards mammalian systems, while PhosphoSite (http://www.phosphosite.org/) is a curated site that focuses on vertebrate systems. The model plant Arabidopsis thaliana is a significant focus of international plant research (http://www.masc-proteomics.org/ for A. thaliana proteomics) and is currently only poorly represented by existing phosphorylation databases. Therefore, we believe that the PhosPhAt service combining experimental results with pSer prediction will be a valuable addition to current phosphorylation databases and to the plant research community in general.
DATABASE STRUCTURE AND DESIGN
The PhosPhAt database uses a MySQL relational database operating on a Linux based operating system. The web-based graphical user interface allows the construction of SQL (structured query language) queries through standard HTML forms. Complex database queries are created with pull-down menus that retrieve data through purpose-built PHP scripts that interact with the MySQL tables in PhosPhAt.
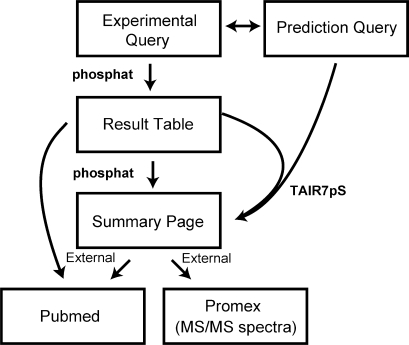
The database is comprised of two distinct tables (Figure 1): the first table (phosphat) contains the experimental phosphopeptide information and comprises data from several published large- and medium-scale phosphoproteomic analyses (9,12–15) as well as unpublished sites identified in authors’ labs. Each entry is a unique experimentally measured precursor ion (m/z) and not a composite entry. This is an important feature of the PhosPhAt database as it tracks each piece of experimental data, and provides links also to the actual experimental mass spectra deposited in PROMEX [http://promex.mpimp-golm.mpg.de; (17)]. With a link to this spectral library on the ‘Result Table’ users can download the precursor mass-to-charge ratio and the corresponding CID-spectrum. This data is crucial for the design of multiple reaction monitoring (MRM) experiments for targeted phosphopeptide-quantification on a triple quadrupole or ion trap mass spectrometer (10,18).
Figure 1.
Schematic diagram outlining the structure of the PhosPhAt service illustrating the two main query entry points to query experimental data and pSer prediction information. Both services merge into a common output at the ‘Summary Page’ on which the prediction results are displayed on top of the page and all experimental phosphopeptides for the given AGI code are listed below. In instances where no experimental phosphopeptides are available, only the prediction result will be displayed. External links to published references at PubMed and MS/MS data at the ProMex mass spectral library (17) are also shown.
The second table, the prediction table (TAIR7pS), contains pSer predictions for the entire Arabidopsis annotated proteome comprising 31 921 proteins (release 7 from25 April 2007) available from The Arabidopsis Information Resource [www.arabidopsis.org; (19)]. The prediction table contains precompiled pSer prediction scores for total of 928 449 serine residues.
Currently, the experimental data table contains 1187 defined tryptic peptides matching 1053 distinct proteins from the model plant A. thaliana. Phosphorylation sites are marked as ‘defined’ if the precise location of the phosphorylated amino acid has been unambiguously determined by mass spectrometric analysis. This usually implies manual interpretation of mass spectra and additional scoring algorithms (16). These ‘defined’ sites are marked with brackets and a lowercase p, e.g. (pS), (pT), (pY). Phosphorylation sites marked as ‘undefined’ were not clearly resolved by the mass spectrometric experiments. These sites are marked as lowercase letters in brackets, e.g. (s), (t), (y). Often, the ‘undefined’ sites are two putatively phosphorylated amino acids in close proximity in the peptide and the difference between these options could not be interpreted based on the mass spectrum. The ‘undefined’ sites are often only a subset of the serines, threonines, or tyrosines in the tryptic peptide. If no statement can be made on the location of the phosphorylation site, the modified tryptic peptide sequence is displayed with the remark ‘site not determined’.
DATABASE OVERVIEW
The entry page of the PhosPhAt database provides two general search strategies: (i) browsing multiple instances of experimental phosphorylation sites via the tab ‘Query Experimental Data’, and (ii) displaying a summary of phosphorylation site prediction of one locus with a concurrent display of experimental sites via the tab ‘Query Prediction Data’.
The query via ‘Experimental Data’ provides access to the experimentally verified phosphorylation sites by physical parameters of the peptide (charge state, number of modifications, mass accuracy), methodological aspects (enrichment method, digesting enzyme, mass analyzer), biological context (tissue, cellular compartment, experimental condition), or research group (published datasets, research groups). A list of proteins of interest can also be submitted using the AGI gene code format. The user will then be directed to the ‘Result Table’ (Figure 1) on which, depending on the query, all experimentally identified phosphorylated peptides are displayed for every protein in a tabular form. Each AGI code in the ‘Result Table’ provides a link to the ‘Summary Page’ outlining all experimental information for that locus as well as pSer prediction.
The ‘Summary Page’ details experimentally validated/identified peptides for a given AGI code with each phosphopeptide displayed in its own table. The database has been specifically designed to capture as much information as possible for each experimentally identified phosphopeptide and thus a 'composite' entry for each site has not been used. In many cases, site level redundancy in the form of multiple experimental phosphopeptide entries for one phosphorylation site can be observed on this page. Each phosphopeptide entry provides a link to MS/MS spectra housed in the ProMEX (17) database (if available; http://promex.mpimp-golm.mpg.de) as well as a link to the PubMed reference (if data published).
The ‘Query Prediction Data’ tab also serves as entry point to the database and allows queries using single AGI codes. This tab provides a direct link to the ‘Summary Page’ (Figure 1) where experimental and pSer predictions for the AGI code entry are outlined for the amino acid sequence of the retrieved entry. As outlined above, this page also provides a detailed breakdown of all phosphorylation modification data (if available) for this locus.
USING THE PhosPhAt DATABASE
To query experimental data, a series of pull down menus are available to access most of the data in the phosphat data table. The default setting for this query form will pull all entries (>3000) from the database. A more targeted query is the intended purpose of this form. For example, retrieving phosphopeptide data from a previously-published paper using a delta mass cut-off (a mass difference produced when data originally matched) and a matching score cut-off (score obtained for original match) is possible using the following steps:
Select a publication of interest from the ‘Published Reference’ pull-down menu, e.g. Niittylä et.al. (14).
Note: if the ‘Query Database’ button at the bottom of the form is selected now, this query alone will produce 97 hits.
Instigate a delta mass cut-off for this publication set, e.g. a relatively stringent range would be ±0.01 Da.
Note: using the ‘Query Database’ button now in combination with step (i) will produce 27 hits.
Choose a MOWSE score cut-off produced by the MS interrogation program Mascot (20) when the data was originally matched, e.g. 40 (a higher score is more stringent).
Hitting the ‘Query Database’ button at the bottom of the form for the final query component will produce six hits.
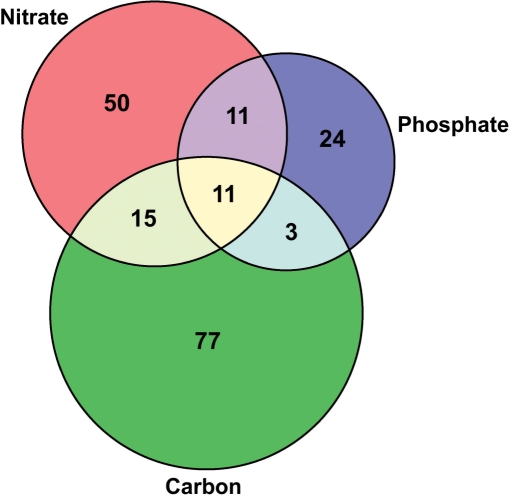
A more powerful and useful analysis of the data can be undertaken through the use of the experimental form selectors. The redundancy in phosphorylation site entries in the phosphat table allows the user to address information about phosphorylation sites experimentally identified under different biological conditions or in different tissues. For example, phosphopeptides sets for nitrate starvation and re-supply, phosphate starvation and re-supply, as well as carbon starvation and sucrose re-supply be obtained through the query form and compared (Figure 2). Such comparative analyses may help to assign biological functions to specific phosphorylation sites.
Figure 2.
Venn diagram of experimental phosphorylation sites retrieved from the PhosPhAt database for different nutrient stress experiments. The overlap between different experiments comprises mainly plasma membrane proton ATPases and aquaporins, the proteins unique for each condition include transporters and kinases among others. Nitrate: nitrate starvation and resupply; Phosphate: phosphate starvation and resupply; Carbon: carbon starvation and sucrose re-supply.
ARABIDOPSIS pSer PREDICTION
Protein phosphorylation is of paramount importance for understanding biochemical regulation. Because of restricted experimental approaches for in vivo-site determination, the computational prediction of phosphorylation sites is a complementary and helpful tool. Using the gathered experimentally-verified data from our database as a training set, we used a Support Vector Machine (SVM) approach to classify candidate serine sites (Supplementary Table 1; for detailed information on the prediction method, please refer to the Supplementary material). Computed SVM decision values greater than zero indicate a positive prediction of a phosphorylation event, while negative values predict serine residues not to be phosphorylated. Greater absolute decision values indicate greater confidence in the prediction. In the ‘Summary Page’, candidate serines are tagged with mouse-over information pop-up-boxes of experimental evidence as well as prediction results (SVM decision value). In the displayed sequence, serines are colored red if experimentally verified and they are underlined when positively predicted with a decision value > 0 by the computational classifier.
The TAIR7pS table comprises a total of 928 449 serine site motifs in 31 921 protein sequences. Of those, 27 782 serines distributed in 17 035 proteins (14 339 unique genes) were predicted to be phosphorylated with high confidence (decision value >1), which makes up approximately half of the annotated Arabidopsis proteome. For 176 442 serines, medium confidence (0 <decision value <1) was predicted and for 435 231 serines, the computed decision value was below −1 indicative of high-confidence negative predictions; i.e. no phosphorylation.
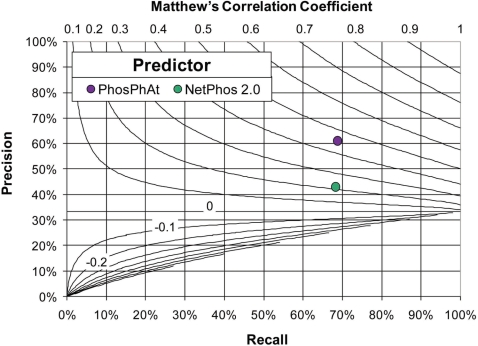
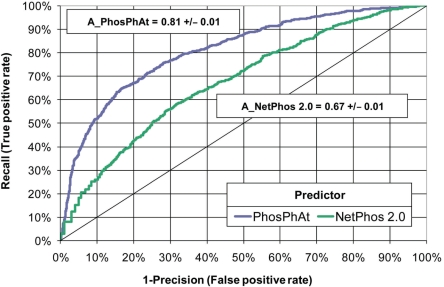
A comparison of the prediction performance of the plant-specific pSer predictor and the generic NetPhos 2.0 (21) reveals a significant improvement of recall, precision, as well as Matthew's correlation coefficient (CC) for Arabidopsis proteins (Figure 3). The CC reached with our plant-specific pSer predictor was 0.46 and, thus, significantly better than the CC for NetPhos 2.0 (CC = 0.22). In a 10-fold cross-validation test, 69% of phosphorylated serine sites from the training set were correctly recognized (Supplementary Table 1) compared to 68% recall for the NetPhos 2.0 server. Of the predicted sites, 61% were experimentally verified phosphoserine sites while the precision achieved with NetPhos 2.0 was 43%. The comparison of the receiver operating characteristic (ROC) curves revealed a highly significant improvement of the prediction performance with z-score of 24.1 according to the algorithm proposed by (22) corresponding to a P-value of 3.3E−128 in the limiting case of a normal distribution. The area under the ROC curve for the PhosPhAt plant-specific pSer predictor was 0.81 ± 0.01 and 0.67 ± 0.01 for NetPhos, respectively (Figure 4).
Figure 3.
Prediction performance of the pSer predictor in comparison to NetPhos 2.0 (21). The recall rate versus the associated precision is plotted. The curved lines indicate lines of equal correlation coefficient. In the diagram, improved classification performance is indicated for predictors falling into the upper right corner. Performance results for our classifier correspond to results obtained in the 10-fold cross-validation test (see Supplementary material for details.) The classifier NetPhos 2.0 was applied to our dataset without training; i.e. NetPhos 2.0 was applied to an independent dataset as it was technically not possible to perform a cross-validation for NetPhos 2.0. While the testing protocols differed, the results still suggest that a plant-specific predictor may yield better performance when applied to plant proteins than a generic predictor.
Figure 4.
Receiver operating characteristics curves of the prediction by pSer predictor in comparison to NetPhos 2.0 (21) (see Supplementary material for details). In the diagram, improved classification performance is indicated for predictors with increased area under the ROC. The area under the ROC curve was A1 = 0.81 ± 0.01 for the pSer predictor and A2 = 0.67 ± 0.01 for NetPhos and was significantly better with a z-score = (A1−A2)/SE(A1−A2) of 24.1 corresponding to a P-value of 3.3E−128 in the limiting case of a normal distribution according to the algorithm proposed in (22).
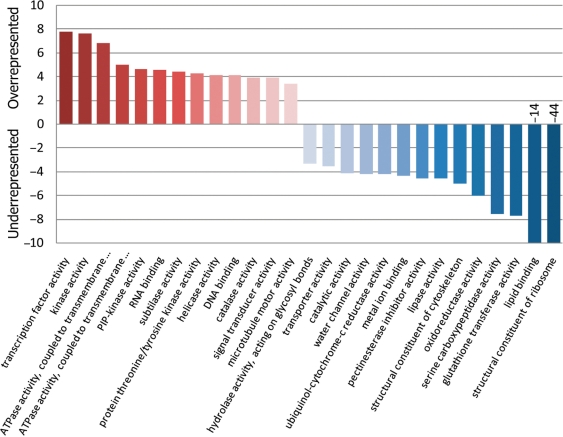
In order to test for over- and under-representation of predicted phosphorylation sites in different functional categories based on GO annotations (23), we applied the Fisher exact test to the GO-term classified prediction result. Proteins involved in regulatory and signaling processes are significantly overrepresented in the set of highly confident phosphorylated proteins while housekeeping and other enzymatic functions are underrepresented (Figure 5).
Figure 5.
Negative log(P-values) from Fisher exact test on the occurrences of GO: function terms associated with predicted phosphoproteins. P-values were corrected for multiple testing by using the False Discovery Rate (FDR) formalism (25). Overrepresented GO: terms are colored red, underrepresented blue. GO: terms were included if pFDR <0.001. GO annotations were taken from TAIR (19). To avoid training bias, phosphorylation sites used during the training of the classifier have been removed in the Fisher exact test. Only GO assignments with evidence categories: direct assay, mutant phenotype, physical and genetic interaction as well as sequence of structural similarity have been considered.
The predicted sites with highest decision values in combination with the experimental phosphorylation sites provide a powerful basis for further in-depth analysis of phosphorylation motifs in orthologous and paralogous proteins also between different organisms (24). Thus, our dataset provides a rich resource for computational biologists interested in the study of conservation of phosphorylation sites and discovery of such conserved sites across protein classes and plant species.
CONCLUSIONS
The PhosPhAt database has been initiated to provide a resource that consolidates our current knowledge of mass spectrometry-based identified phosphorylation sites in the model plant Arabidopsis. It is combined with a phosphoserine site prediction tool specifically trained on Arabidopsis serine phosphorylation site motifs. Thus, our database not only serves as a searchable knowledge base for experimentally-identified phosphorylation sites, but in addition also provides a powerful resource for the characterization and annotation of yet unidentified phosphoserine sites in Arabidopsis. The value of the PhosPhAt resource thus lies in the possibility for comparative analysis of experimental sets (Figure 2), confirmation of experimental phosphorylation sites by providing evidence from different published and unpublished sources, and in the implementation of prediction where experimental evidence is not (yet) available.
SUPPLEMENTARY DATA
Supplementary Data are available at NAR Online.
ACKNOWLEDGEMENTS
We would like to thank Wolfgang Engelsberger for providing feedback regarding the usability and design of the database. The authors would also like to thank Robert Schmidt for the rapid implementation of changes in the database website after review of the manuscript. This work has been supported by the Alexander von Humboldt Foundation through a Research Fellowship to J.L.H. and by the Australian Research Council through a Postdoctoral Fellowship to J.L.H. W.S. is supported by the Emmy-Noether Program of the Deutsche Forschungsgemeinschaft (DFG). Funding to pay the Open Access publication charges for this article was provided by the Max Planck Institute for Molecular Plant Physiology.
Conflict of interest statement. None declared.
REFERENCES
- 1.Chung HJ, Sehnke PC, Ferl RJ. The 14-3-3 proteins: cellular regulators of plant metabolism. Trends Plant Sci. 1999;4:367–371. doi: 10.1016/s1360-1385(99)01462-4. [DOI] [PubMed] [Google Scholar]
- 2.Yaffe MB. Phosphotyrosine-binding domains in signal transduction. Nat. Rev. Mol. Cell Biol. 2002;3:177–186. doi: 10.1038/nrm759. [DOI] [PubMed] [Google Scholar]
- 3.Pawson T. Specificity in signal transduction: from phosphotyrosine-SH2 domain interactions to complex cellular systems. Cell. 2004;116:191–203. doi: 10.1016/s0092-8674(03)01077-8. [DOI] [PubMed] [Google Scholar]
- 4.Pawson T, Gish GD. SH2 and SH3 domains: from structure to function. Cell. 1992;71:359–362. doi: 10.1016/0092-8674(92)90504-6. [DOI] [PubMed] [Google Scholar]
- 5.Camoni L, Iori V, Marra M, Aducci P. Phosphorylation-dependent interaction between plant plasma membrane H(+)ATPase and 14-3-3 proteins. J. Biol. Chem. 2000;275:99919–99923. doi: 10.1074/jbc.275.14.9919. [DOI] [PubMed] [Google Scholar]
- 6.Hrabak EM, Chan CW, Gribskov M, Harper JF, Choi JH, Halford N, Kudla J, Luan S, Nimmo HG, et al. The Arabidopsis CDPK-SnRK superfamily of protein kinases. Plant Physiol. 2003;132:666–680. doi: 10.1104/pp.102.011999. [DOI] [PMC free article] [PubMed] [Google Scholar]
- 7.Wang X, Goshe MB, Sonderblom EJ, Phinney BS, Kuchar JA, Li J, Asami T, Yoshida S, Huber SC, et al. Identification and functional analysis of in vivo phosphorylation sites of the Arabidopsis Brassinosteroid-insesnitive 1 receptor kinase. Plant Cell. 2005;17:1685–1703. doi: 10.1105/tpc.105.031393. [DOI] [PMC free article] [PubMed] [Google Scholar]
- 8.Yoshida S, Parniske M. Regulation of plant symbiosis receptor kinase through serine and threonine phosphorylation. J. Biol. Chem. 2005;280:9203–9209. doi: 10.1074/jbc.M411665200. [DOI] [PubMed] [Google Scholar]
- 9.Wolschin F, Weckwerth W. Combining metal oxide affinity chromatography (MOAC) and selective mass spectrometry for robust identification of in vivo protein phosphorylation sites. Plant Methods. 2005;1:1–10. doi: 10.1186/1746-4811-1-9. [DOI] [PMC free article] [PubMed] [Google Scholar]
- 10.Wolschin F, Lehmann U, Glinski M, Weckwerth W. An integrated strategy for identification and relative quantification of site-specific protein phosphorylation using liquid chromatography coupled to MS2/MS3. Rapid Commun. Mass Sp. 2005;19:3626–3632. doi: 10.1002/rcm.2236. [DOI] [PubMed] [Google Scholar]
- 11.Nühse TS, Stensballe A, Jensen ON, Peck J. Large-scale analysis of in vivo phosphorylated membrane proteins by immobilized metal ion affinity chromatography and mass spectrometry. Mol. Cell. Proteomics. 2003;2:1234–1243. doi: 10.1074/mcp.T300006-MCP200. [DOI] [PubMed] [Google Scholar]
- 12.Nühse TS, Stensballe A, Jensen ON, Peck SC. Phosphoproteomics of the Arabidopsis plasma membrane and a new phosphorylation site database. Plant Cell. 2004;16:2394–23405. doi: 10.1105/tpc.104.023150. [DOI] [PMC free article] [PubMed] [Google Scholar]
- 13.Benschop JJ, Mohammed S, O'Flaherty M, Heck AJ, Slijper M, Menke FL. Quantitative phospho-proteomics of early elicitor signalling in Arabidopsis. Mol. Cell. Proteomics. 2007;6:1705–1713. doi: 10.1074/mcp.M600429-MCP200. [DOI] [PubMed] [Google Scholar]
- 14.Niittylä T, Fuglsang AT, Palmgren MG, Frommer WB, Schulze WX. Temporal analysis of sucrose-induced phosphorylation changes in plasma membrane proteins of Arabidopsis. Mol. Cell. Proteomics. 2007;6:1711–1726. doi: 10.1074/mcp.M700164-MCP200. [DOI] [PubMed] [Google Scholar]
- 15.de la Fuente van Bentem S, Anrather D, Roitinger E, Djamei A, Hufnagl T, Barta A, Csaszar E, Dohnal I, Lecourieux D, et al. Phosphoproteomics reveals extensive in vivo phosphorylation of Arabidopsis proteins involved in RNA metabolism. Nucleic Acids Res. 2006;34:3267–3278. doi: 10.1093/nar/gkl429. [DOI] [PMC free article] [PubMed] [Google Scholar]
- 16.Olsen JV, Blagoev B, Gnad F, Macek B, Kumar C, Mortensen P, Mann M. Global, in vivo, and site-specific phosphorylation dynamics in signaling networks. Cell. 2006;127:635–648. doi: 10.1016/j.cell.2006.09.026. [DOI] [PubMed] [Google Scholar]
- 17.Hummel J, Niemann M, Wienkoop S, Schulze W, Steinhauser D, Selbig J, Walther D, Weckwerth W. ProMEX: a mass spectral reference database for proteins and protein phosphorylation sites. BMC Bioinformatics. 2007;8:216. doi: 10.1186/1471-2105-8-216. [DOI] [PMC free article] [PubMed] [Google Scholar]
- 18.Glinski M, Weckwerth W. Differential multisite phosphorylation of the trehalose-6-phosphate synthase gene family in Arabidopsis thaliana: a mass spectrometry-based process for multiparallel peptide library phosphorylation analysis. Mol. Cell. Proteomics. 2005;4:1614–1625. doi: 10.1074/mcp.M500134-MCP200. [DOI] [PubMed] [Google Scholar]
- 19.Huala E, Dickerman AW, Garcia-Hernandez M, Weems D, Reiser L, LaFond F, Hanley D, Kiphart D, Zhuang M, et al. The Arabidopsis Information Resource (TAIR): a comprehensive database and web-based information retrieval, analysis, and visualization system for a model plant. Nucleic Acids Res. 2001;29:102–105. doi: 10.1093/nar/29.1.102. [DOI] [PMC free article] [PubMed] [Google Scholar]
- 20.Perkins DN, Pappin D.JC, Creasy DM, Cottrell JS. Probability-based protein identification by searching sequence databases using mass spectrometry data. Electrophoresis. 1999;20:3551–3567. doi: 10.1002/(SICI)1522-2683(19991201)20:18<3551::AID-ELPS3551>3.0.CO;2-2. [DOI] [PubMed] [Google Scholar]
- 21.Blom N, Gammeltoft S, Brunak S. Sequence- and structure-based prediction of eucaryotic protein phosphorylation sites. J. Mol. Biol. 1999;294:1351–1362. doi: 10.1006/jmbi.1999.3310. [DOI] [PubMed] [Google Scholar]
- 22.Hanley JA, McNeil BJ. A method of comparing the areas under receiver operating characteristic curves derived from the same cases. Radiology. 1983;3:3. doi: 10.1148/radiology.148.3.6878708. [DOI] [PubMed] [Google Scholar]
- 23.Ashburner M, Ball CA, Blake JA, Botstein D, Butler H, Cherry JM, Davis AP, Dolinski K, Dwight SS, et al. Gene ontology: tool for the unification of biology. The Gene Ontology Consortium. Nat. Genet. 2000;25:25–29. doi: 10.1038/75556. [DOI] [PMC free article] [PubMed] [Google Scholar]
- 24.Weckwerth W, Selbig J. Scoring and identifying organism-specific functional patterns and putative phosphorylation sites in protein sequences using mutual information. Biochem. Bioph. Res. Co. 2003;307:516–521. doi: 10.1016/s0006-291x(03)01182-3. [DOI] [PubMed] [Google Scholar]
- 25.Benjamini Y, Hochberg Y. Controlling the false discovery rate: a practical and powerful approach to multiple testing. J. Roy. Stat. Soc. B. 1995;57:289–300. [Google Scholar]


