Abstract
We present a new database of computational hot spots in protein interfaces: HotSprint. Hot spots are residues comprising only a small fraction of interfaces yet accounting for the majority of the binding energy. HotSprint contains data for 35 776 protein interfaces among 49 512 protein interfaces extracted from the multi-chain structures in Protein Data Bank (PDB) as of February 2006. The conserved residues in interfaces with certain buried accessible solvent area (ASA) and complex ASA thresholds are flagged as computational hot spots. The predicted hot spots are observed to correlate with the experimental hot spots with an accuracy of 76%. Several machine-learning methods (SVM, Decision Trees and Decision Lists) are also applied to predict hot spots, results reveal that our empirical approach performs better than the others. A web interface for the HotSprint database allows users to browse and query the hot spots in protein interfaces. HotSprint is available at http://prism.ccbb.ku.edu.tr/hotsprint; and it provides information for interface residues that are functionally and structurally important as well as the evolutionary history and solvent accessibility of residues in interfaces.
INTRODUCTION
Protein interactions take place physically between interface residues of two complementary proteins. Studies focusing on protein interfaces have revealed that binding energies are not uniformly distributed along the protein interfaces. Instead, there are certain critical residues called ‘hot spots’. These residues comprise only a small fraction of interfaces yet account for the majority of the binding energy (1–3). These residues are observed to be critical for function and stability of the protein association (1). There are several sites collecting the experimental hot spots. Thorn and Bogan (4) deposited hot spots from alanine scanning mutagenesis experiments, in a database called ASEdb. BID is an effort to organize protein interaction data compiled from the literature and presents amino acids at the protein–protein binding interfaces (5). Yet, these servers provide hot spots for only a limited number of proteins.
Computational methods can introduce alternative approaches to experimental techniques to detect and catalog hot spots (6). Several groups have developed energy-based methods to predict hot spots (7–9). Molecular dynamics studies can also be used to investigate the energetic contributions of interface residues (10–12). While both energy and MD-based methods are very efficient, they are at the same time costly and not applicable in large-scale hot spot prediction.
Residues in protein interfaces (13) and functional sites (14) were observed to be mutating at a slower pace compared to the rest of the protein surface. There are several studies focusing on the detection of hot spots based on conservation. A very recent study based on sequence environment and evolutionary profile of residues predicts computational hot spots (15). Correlation between hot spot residues and structurally conserved residues were found to be remarkable (16–19). These hot spots are also found to be buried and tightly packed with other residues (18) resulting in densely packed clusters of networked hot spots, called ‘hot regions’.
Here, we present HotSprint, a database documenting computational hot spots in the protein interfaces combining conservation and solvent accessibility of residues in the protein interfaces. HotSprint contains protein interfaces extracted from the structures in Protein Data Bank (PDB) and is the first database, to our knowledge, which exploits sequence conservation to detect hot spots on a large scale. Total 49 512 interfaces are extracted from 34 817 PDB entries as of February 2006. Conserved residues of 35 776 protein interfaces are found using Rate4Site algorithm (20). NACCESS is used to obtain the solvent accessibility of residues (21). In summary, HotSprint marks residues that are highly conserved and tightly packed in protein interfaces as hot spots.
METHODOLOGY AND RESULTS
Interface datasets
The interfaces, used for the identification of the computational hot spots in the HotSprint, are taken from the updated version of interface dataset generated by Keskin et al. (22). Interfaces were generated by the atomic distance criteria: if the distance between any atoms of two residues, one from each chain, is less than the summation of their van der Waals radii plus a tolerance 0.5 Å, these residues are named as interface residues. If the distance between non-interacting and interacting residues in the same chain is smaller than 6 Å, the non-interacting residue is named a ‘nearby’ (neighboring) residue. Nearby residues are important for the information about the architecture of the interface and provided in our database. All 15 268 multi-chain PDB structures are used to extract two chain interfaces and then interfaces having less than 10 residues are eliminated. The resulting dataset contains 49 512 two-chained interfaces that are denoted by six-letter nomenclature where the first four letters denote the PDB ID, and the last two letters are the chain identifier.
Detection of computational hot spots in protein interfaces
HotSprint database can be accessed through a web interface where users can search for computational hot spots in protein interfaces. The evolutionarily conserved residues are found by Rate4Site algorithm (20). Rate4Site makes use of topology and branch lengths of the phylogenetic trees constructed from multiple sequence alignments (MSA) of proteins and estimates conservation rates of amino acids based on the empirical Bayesian rule. MSAs of proteins constituting interfaces are taken from HSSP (Homology-Derived Secondary Structure of Proteins) (23) database as of 14 January 2006. All MSAs obtained from HSSP are converted to FASTA format to be used in Rate4Site step. In addition, some residues are more frequently observed to be hot spots, so each of the 20 amino acids has a different propensity to be a hot spot. Hot spot propensities are used to rescale the conservation scores. Further, hot spots prefer to reside in protein cavities (24), therefore surface area accessibility of interface residues are incorporated into our hot spot scoring formula.
The computational hot spot score of ith residue in a chain is defined as pScorei = scorei x Pk, where scorei is the conservation score from Rate4Site (25), Pk is the propensity of residue type k (i.e, k = ALA, VAL, etc.) to be conserved in the interface (details are given in the Supplementary Data). For an amino acid in a protein interface to be considered as a computational hot spot, we propose that following formulation should be satisfied:
pScorei > t and ΔASA > tASA and ASAcomplex < tASAx
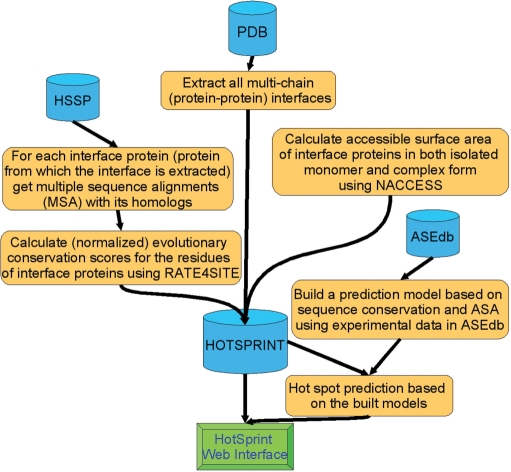
where t, tASA and tASAx are user-defined thresholds, the default values are set to 6.2, and 49 and 12 Å2, respectively. ΔASA is the ASA change of the residue upon complexation, ΔASA = ASAmonomer − ASAcomplex, ASA of the residue in the monomer and complex form, respectively. In ASA calculations, NACCESS (21) is used and buried ASAs of interface are calculated for each interface. Thus, this formulation combines amino acid conservation scores obtained from Rate4Site [scaled with amino acid conservation propensities (e.g. aromatic residues are observed to be hot spots independent of their sequence position)] and ASA of the residue. Figure 1 summarizes the flowchart to detect computational hot spots in interfaces.
Figure 1.
The flowchart of the procedure to predict hot spots and deposit them in the HotSPrint.
We have evaluated prediction performance of our formulation by comparing the results with the experimental hot spot data extracted from ASEdb (4). We assessed success of the formulations using the statistical analysis using ‘Accuracy’ and ‘f-measure’. Our formulation yields 76.83%, 60.1%, 86.56%, 63.06% and 65.69% for accuracy (percentage of correctly predicted hot spot and non-hot spot residues over all interface residues), sensitivity (ratio of correctly predicted hot spots to all hot spots residues on the interface), specificity (ratio of correctly predicted non-hot spots to all non-hot spot interface residues), positive predictive value (number of correctly predicted hot spots divided by number of interface residues predicted as hot spot) and f-measure [2 × sensitivity × ppv/(sensitivity + ppv) where ppv is the positive predictive value], respectively. Ofran and Rost recently developed a sequence environment and evolutionary profile-based method to predict computational hot spots (15). They considered residues contributing ≥2.5 kcal/mol as hot spots. When we adopt the same convention, their positive predictive value (referred as positive accuracy in their text) of ∼60%, outperforms ours (∼46%). However, our sensitivity (57%, coverage in their text) is remarkably higher than theirs (15%).
Web interface and querying the HotSprint database
HotSprint provides an easy query screen with three distinct query boxes: (i) hot spot search in protein interfaces for a given PDB ID, (ii) advanced search box and (iii) conservation and ASA querying of the complete protein (including non-interface residues). The computational hot spots in the interfaces can be identified based on one of the three options mentioned in Supplementary Data. One may either choose (i) the default hot spot criterion as defined in the Methods section (pScore + ASA, conservation score rescaled with conservation propensity + contribution of ASA), (ii) only conservation criterion (score) or (iii) conservation score rescaled with conservation propensity (pScore) in the query page.
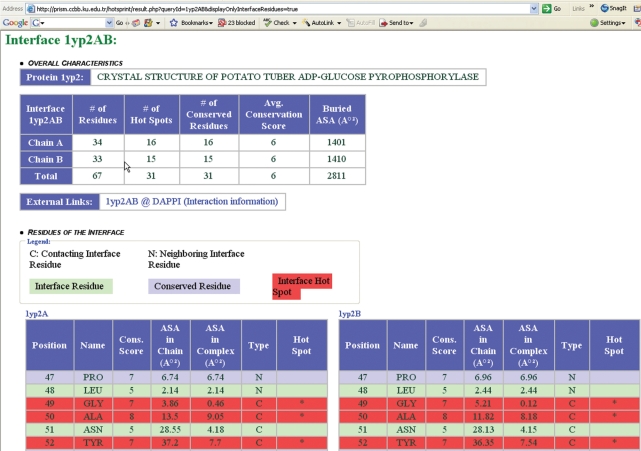
The first query box allows the user to fetch associated interfaces of a given protein using its PDB identifier. The default thresholds in these expressions can also be modified by the user. If there exists only a single interface associated with the input PDB identifier (e.g. for PDB ID: 1axd), then information for that interface (1axdAB) is displayed. However, there may be more than one interface extracted from that protein. In this case, interface identifiers of interfaces associated with that PDB are displayed (e.g. for the PDB ID 1yp2, four interfaces are available 1yp2AB, 1yp2AD, 1yp2BC and 1yp2CD). When one selects one of the interface identifiers listed, information for that interface is presented. Figure 2 demonstrates the result page yielded after querying the interface 1yp2AB among the associated interfaces of 1yp2.
Figure 2.
Interface information page for 1yp2AB Interface. Overall properties (number of computational hot spots, number of conserved residues, average conservation score, buried ASA and a link to interface information in the original dataset), individual residues and graphical representation of the interface are all displayed in this page. Using the link to the original dataset, users can get detailed information about interfaces: whether it is a biological or crystal interface, and interface amino acid composition. The graphical representation part contains snapshots of the interface and its hot spots from four different perspectives and a Jmol plugin is loaded in a new window when these images are clicked.
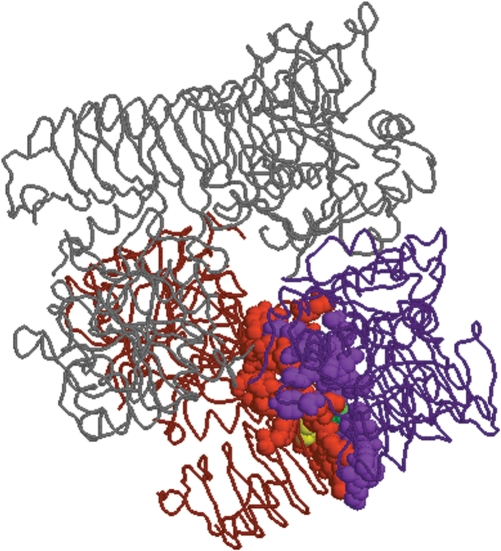
The page presenting interface information consists of three main sections. In the first section, overall properties of the interface such as number of computational hot spots on the interface, number of conserved residues on the interface, average conservation score of interface residues and buried ASA of the interface are presented. The next section lists residues of the interface along with their position, name, conservation score, ASA in monomer, ASA in complex, type (contacting interface residue, neighboring interface residue or none). A residue is highlighted with a red background if it is a computational hot spot. Static snapshots of the interface from four different perspectives are shown using Rasmol (26) at the bottom of the page (Figure 3). It is possible to include only contacting residues in the presented results using the check box at the bottom of the query box.
Figure 3.
One of the four snapshots displayed in HotSprint generated by Rasmol for interface 1yp2AB. An interface is composed of two sides (chain A and chain B of potato tuber ADP-glucose phyrophosphorylase with PDB ID 1yp2) from two interacting proteins. Interface residues are shown as balls whereas the rest of the protein is shown as the trace. The purple and red residues represent interface residues of the A and B chains of the interface, respectively. The yellow and green residues are predicted hot spots on the chains A and B, respectively.
The second query box allows advanced search with different options. One can find structures satisfying given criteria among all the structures stored in the database. Interfaces with certain number of computational hot spots, number of conserved residues and average conservation score can be fetched. Furthermore, one may also be interested in finding interfaces with specified conserved propensities or buried accessible surface areas (ASA) in a given range. For example, if interfaces with more than seven hot spots and which have 1000 Å2 ≤ ASA ≤ 2000 Å2 are queried, a table listing the interface IDs with respective properties is provided.
At the bottom resides the final query box that can be used to access residue information (position, name, conservation score, monomer ASA) of the whole protein including both the interface and non-interface residues. The results for the given structure identifier will be output by the server.
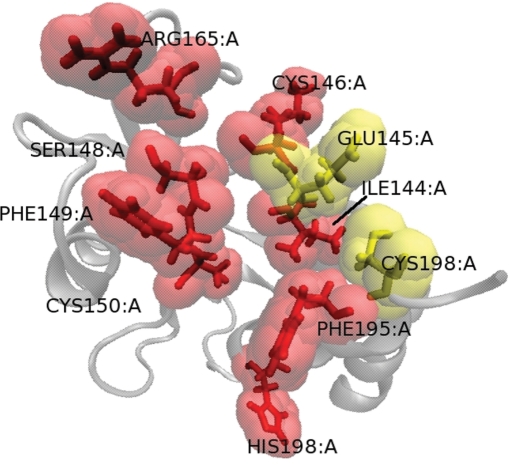
As a case study, we compare the experimental hot spots of the numb PTB domain with HotSprint predictions. Figure 4 displays the ribbon diagram of the numb PTB domain that is in complex with numb-associated kinase (NAK)-C (PDB ID: 1ddm) (27). Numb PTB domain is known to interact with a diverse set of peptides through a large hydrophobic cavity on its surface (28). The left figure presents the predicted hot spots by using pScore only, whereas the right panel illustrates the results when the pScore + ASA is used. Red and yellow residues are the identified as hot spots by alanine scanning substitutions on the protein complex. Considering only propensity scaled conservation scores of the residues (left figure) in the interface of 1ddmAB, 8 of the 10 experimentally identified hot spots (red residues) are predicted computationally. Including ASA further filters some of the hot spot predictions (5 of the 10 hot spots are predicted).
Figure 4.
View of numb protein phosphotyrosine binding (PTB) domain. Red and yellow residues are experimental hot spots. Red residues are correctly predicted by HotSprint. Left and right figures present the results for the prediction of hot spots using pScore and pScore + ASA, respectively. VMD (29) is used to graphically represent the protein.
CONCLUSION
In this article, a database of computational hot spots in protein interfaces (HotSprint) is introduced. 49 512 protein interfaces are extracted from the 34 817 structures in Protein Data Bank (PDB) as of February 2006. Conserved residues are mapped to the interfaces. We defined a hot spot as an interface residue that is conserved and buried in the complex form. Conserved residues of 35 776 protein interfaces deposited in the HotSprint. It is the first database, to our knowledge, which exploits sequence conservation to detect hot spots on a large scale. HotSprint highlights the residues that are highly conserved and tightly packed in protein interfaces. We believe study and characterization of hot spots will help to unravel insights of protein associations and will constitute an important step in understanding recognition and binding processes.
AVAILABILITY
HotSprint is available at http://prism.ccbb.ku.edu.tr/hotsprint. The dataset can be downloaded as a single SQL file from the website. A non-redundant subset of the database (40% homology with respect to BLAST) is also provided for retrieval.
ACKNOWLEDGEMENTS
This project has been funded in part with TUBITAK (Research Grant No 104T504) and O.K. has been granted with Turkish Academy of Sciences Young Investigator Programme (TUBA-GEBIP). The Open Access publication charges for this article were waived by the Oxford University Press.
Conflict of interest statement. None declared.
REFERENCES
- 1.Bogan AA, Thorn KS. Anatomy of hot spots in protein interfaces. J. Mol. Biol. 1998;280:1–9. doi: 10.1006/jmbi.1998.1843. [DOI] [PubMed] [Google Scholar]
- 2.Clackson T, Wells JA. A hot spot of binding energy in a hormone-receptor interface. Science. 1995;267:383–386. doi: 10.1126/science.7529940. [DOI] [PubMed] [Google Scholar]
- 3.Wells JA. Systematic mutational analyses of protein-protein interfaces. Methods Enzymol. 1991;202:390–411. doi: 10.1016/0076-6879(91)02020-a. [DOI] [PubMed] [Google Scholar]
- 4.Thorn KS, Bogan AA. ASEdb: a database of alanine mutations and their effects on the free energy of binding in protein interactions. Bioinformatics. 2001;17:284–285. doi: 10.1093/bioinformatics/17.3.284. [DOI] [PubMed] [Google Scholar]
- 5.Fischer TB, Arunachalam KV, Bailey D, Mangual V, Bakhru S, Russo R, Huang D, Paczkowski M, Lalchandani V, et al. The binding interface database (BID): a compilation of amino acid hot spots in protein interfaces. Bioinformatics. 2003;19:1453–1454. doi: 10.1093/bioinformatics/btg163. [DOI] [PubMed] [Google Scholar]
- 6.DeLano WL. Unraveling hot spots in binding interfaces: progress and challenges. Curr. Opin. Struct. Biol. 2002;12:14–20. doi: 10.1016/s0959-440x(02)00283-x. [DOI] [PubMed] [Google Scholar]
- 7.Gao Y, Wang R, Lai L. Structure-based method for analyzing protein-protein interfaces. J. Mol. Model. 2004;10:44–54. doi: 10.1007/s00894-003-0168-3. [DOI] [PubMed] [Google Scholar]
- 8.Guerois R, Nielsen JE, Serrano L. Predicting changes in the stability of proteins and protein complexes: a study of more than 1000 mutations. J. Mol. Biol. 2002;320:369–387. doi: 10.1016/S0022-2836(02)00442-4. [DOI] [PubMed] [Google Scholar]
- 9.Kortemme T, Baker D. A simple physical model for binding energy hot spots in protein-protein complexes. Proc. Natl Acad. Sci. USA. 2002;99:14116–14121. doi: 10.1073/pnas.202485799. [DOI] [PMC free article] [PubMed] [Google Scholar]
- 10.Gonzalez-Ruiz D, Gohlke H. Targeting protein-protein interactions with small molecules: challenges and perspectives for computational binding epitope detection and ligand finding. Curr. Med. Chem. 2006;13:2607–2625. doi: 10.2174/092986706778201530. [DOI] [PubMed] [Google Scholar]
- 11.Huo S, Massova I, Kollman PA. Computational alanine scanning of the 1:1 human growth hormone-receptor complex. J. Comput. Chem. 2002;23:15–27. doi: 10.1002/jcc.1153. [DOI] [PubMed] [Google Scholar]
- 12.Rajamani D, Thiel S, Vajda S, Camacho CJ. Anchor residues in protein-protein interactions. Proc. Natl Acad. Sci. USA. 2004;101:11287–11292. doi: 10.1073/pnas.0401942101. [DOI] [PMC free article] [PubMed] [Google Scholar]
- 13.Fraser HB, Hirsh AE, Steinmetz LM, Scharfe C, Feldman MW. Evolutionary rate in the protein interaction network. Science. 2002;296:750–752. doi: 10.1126/science.1068696. [DOI] [PubMed] [Google Scholar]
- 14.Panchenko AR, Kondrashov F, Bryant S. Prediction of functional sites by analysis of sequence and structure conservation. Protein Sci. 2004;13:884–892. doi: 10.1110/ps.03465504. [DOI] [PMC free article] [PubMed] [Google Scholar]
- 15.Ofran Y, Rost B. Protein-protein interaction hotspots carved into sequences. PLoS Comput. Biol. 2007;3:e119. doi: 10.1371/journal.pcbi.0030119. [DOI] [PMC free article] [PubMed] [Google Scholar]
- 16.Halperin I, Wolfson H, Nussinov R. Protein-protein interactions; coupling of structurally conserved residues and of hot spots across interfaces. Implications for docking. Structure. 2004;12:1027–1038. doi: 10.1016/j.str.2004.04.009. [DOI] [PubMed] [Google Scholar]
- 17.Hu Z, Ma B, Wolfson H, Nussinov R. Conservation of polar residues as hot spots at protein interfaces. Proteins. 2000;39:331–342. [PubMed] [Google Scholar]
- 18.Keskin O, Ma B, Nussinov R. Hot regions in protein – protein interactions: the organization and contribution of structurally conserved hot spot residues. J. Mol. Biol. 2005;345:1281–1294. doi: 10.1016/j.jmb.2004.10.077. [DOI] [PubMed] [Google Scholar]
- 19.Ma B, Elkayam T, Wolfson H, Nussinov R. Protein-protein interactions: structurally conserved residues distinguish between binding sites and exposed protein surfaces. Proc. Natl Acad. Sci. USA. 2003;100:5772–5777. doi: 10.1073/pnas.1030237100. [DOI] [PMC free article] [PubMed] [Google Scholar]
- 20.Pupko T, Bell RE, Mayrose I, Glaser F, Ben-Tal N. Rate4Site: an algorithmic tool for the identification of functional regions in proteins by surface mapping of evolutionary determinants within their homologues. Bioinformatics. 2002;18(Suppl. 1):S71–S77. doi: 10.1093/bioinformatics/18.suppl_1.s71. [DOI] [PubMed] [Google Scholar]
- 21.Hubbard SJ, Thornton JM. NACCESS, Computer Program, Department of Biochemistry and Molecular Biology. London: University College; 1993. [Google Scholar]
- 22.Keskin O, Tsai CJ, Wolfson H, Nussinov R. A new, structurally nonredundant, diverse data set of protein-protein interfaces and its implications. Protein Sci. 2004;13:1043–1055. doi: 10.1110/ps.03484604. [DOI] [PMC free article] [PubMed] [Google Scholar]
- 23.Sander C, Schneider R. Database of homology-derived protein structures and the structural meaning of sequence alignment. Proteins. 1991;9:56–68. doi: 10.1002/prot.340090107. [DOI] [PubMed] [Google Scholar]
- 24.Li X, Keskin O, Ma B, Nussinov R, Liang J. Protein-protein interactions: hot spots and structurally conserved residues often locate in complemented pockets that pre-organized in the unbound states: implications for docking. J. Mol. Biol. 2004;344:781–795. doi: 10.1016/j.jmb.2004.09.051. [DOI] [PubMed] [Google Scholar]
- 25.Glaser F, Pupko T, Paz I, Bell RE, Bechor-Shental D, Martz E, Ben-Tal N. ConSurf: identification of functional regions in proteins by surface-mapping of phylogenetic information. Bioinformatics. 2003;19:163–164. doi: 10.1093/bioinformatics/19.1.163. [DOI] [PubMed] [Google Scholar]
- 26.Sayle RA, Milner-White EJ. RASMOL: biomolecular graphics for all. Trends Biochem. Sci. 1995;20:374. doi: 10.1016/s0968-0004(00)89080-5. [DOI] [PubMed] [Google Scholar]
- 27.Zwahlen C, Li SC, Kay LE, Pawson T, Forman-Kay JD. Multiple modes of peptide recognition by the PTB domain of the cell fate determinant Numb. EMBO J. 2000;19:1505–1515. doi: 10.1093/emboj/19.7.1505. [DOI] [PMC free article] [PubMed] [Google Scholar]
- 28.Li SC, Zwahlen C, Vincent SJ, McGlade CJ, Kay LE, Pawson T, Forman-Kay JD. Structure of a Numb PTB domain-peptide complex suggests a basis for diverse binding specificity. Nat. Struct. Biol. 1998;5:1075–1083. doi: 10.1038/4185. [DOI] [PubMed] [Google Scholar]
- 29.Humphrey W, Dalke A, Schulten K. VMD – visual molecular dynamics. J. Mol. Graph. 1996;14:33–38. doi: 10.1016/0263-7855(96)00018-5. [DOI] [PubMed] [Google Scholar]


