

Abstract
Metallothioneins (MT) have been implicated in the protection of cells from oxidative stress. We studied the molecular mechanism of induction of MT-I and MT-II in response to restraint stress using a mouse model system in which the animals were restrained in well ventilated polypropylene tubes for 12 h each day (one cycle). Here, we show that MT-I and MT-II mRNA levels were elevated as much as 10–20-fold after just one cycle of this simple stress. Stress-mediated MT induction occurred at the transcriptional level. The level of MT mRNA correlated with the stress-induced increase, and not with the diurnal variation, in the level of serum glucocorticoid. Treatment of the mice with RU 486, a glucocorticoid receptor antagonist, prior to restraint stress inhibited MT induction by at least 50%. Furthermore, the glucocorticoid responsive element-binding activity in the liver nuclear extracts from the stressed mice was significantly higher than that in the control mice. The complex formations between the transcription factor Sp1, MTF1, or MLTF/ ARE and the respective specific oligonucleotides were not altered in the liver from the stressed mouse. The MT mRNA levels returned to the basal level at the end of nine cycles of stress, indicating habituation of the animals to restraint stress. At this stage, exposure of the animals to another type of stress, treatment with heavy metals, resulted in further induction of MT. These data indicate that glucocorticoid is the primary physiological factor responsible for MT induction following restraint stress, and the glucocorticoid receptor is the major transcription factor involved in this process.
Metallothionein (MT)1 genes that encode low molecular mass, cysteine-rich, heavy metal-binding proteins have been reported in a wide variety of organisms (for reviews, see Refs. 1-4). The members of the MT superfamily are usually devoid of aromatic amino acids, and each mole of the protein can bind up to 7–12 g atoms of transition metal through the abundant cysteine residues. Of the four isoforms of MT, MT-I and MT-II have been studied the most. Although detoxification of heavy metals has been considered an important function of MT, recent studies have suggested a significant role for MT-I and MT-II in copper homeostasis (1, 3, 5), as a donor of zinc for the zinc-dependent transcription factors (4), and as a free radical scavenger in the protection of cells against reactive oxygen intermediates (6, 7) and electrophilic anticancer drugs (8). These MT isoforms are transcriptionally induced in response to different stimuli that include steroid hormones, interleukins, phorbol esters, and interferons (1, 3). Several lines of evidence suggest that metallothioneins can protect cells from damage caused by a variety of agents. For example, overexpression of MT in cells diminishes the sensitivity of the cells to the compounds that generate free oxygen radicals (6, 7), DNA-damaging agents such as UV radiation, nitric oxide (2, 9, 10), and certain anticancer drugs (8, 11), whereas targeted disruption of the genes renders the cells significantly more sensitive to cadmium, the oxidant tert-butyl hydroperoxide, and the herbicide paraquat (12, 13). A recent study has shown that overproduction of MT selectively in the heart can protect transgenic mice from the cardiotoxic effects of the potent anticancer drug Adriamycin (14). Similarly, cells that are resistant to the anticancer drug cisplatin exhibit high levels of MT (11, 15). In general, the cells that are resistant to heavy metals and to free oxygen or hydroxyl radicals tolerate these insults by producing relatively high levels of MT. These studies have provided considerable impetus to study the molecular mechanisms of MT induction.
In addition to heavy metals and other agents, stress can also induce MT (16-19). The unique characteristic of this observation is that metallothionein can be induced in the absence of any external compounds. The induction of MT in response to restraint stress probably protects the tissues from the free radicals generated by stress-induced pro-inflammatory cytokines (20). Only a limited study has been done on the elucidation of the physiological factors involved in stress-mediated MT gene activation (16, 21). Although the levels of glucocorticoids and catecholamines are elevated in response to restraint stress (22, 23), their roles in the transcriptional control of stress-mediated MT induction have not been studied in depth. None of the scanty reports on MT induction under this condition have examined the MT mRNA levels in the tissues at different time intervals following stress. An important issue is whether the level of MT mRNA is restored to the control level after prolonged stress as a result of habituation of the animals to restraint stress. Furthermore, although almost all types of MT induction appear to be mediated by MT promoter activation, it has not been proven experimentally whether the level of MT mRNA augmented by stress occurs at the transcriptional or post-transcriptional level or both. The nature of the transcription factor(s) responsible for MT induction in response to stress has also not been explored.
Several factors are known to modulate transcription of MT genes. The most widely studied of these factors is MTF1, a 70–80-kDa polypeptide with six zinc fingers that is required for both basal and heavy metal- and oxygen-free radical-induced expression of MT (24-27). In addition to this protein, other well defined transcription factors such as Sp1 and USF/MLTF can bind to their cognate elements on the MT-I and MT-II genes (24, 28, 29). Their activation in response to different agents could have profound effects on the MT promoter activity. Two additional factors characterized in our laboratory, C′BP-1 (30) and C′BP-2 (31), interact with the MRE-c′ sequence (located between −135 and −110 with respect to the initiation site) on the MT-I gene and transactivate the MT-I promoter. Any one of the above factors could be involved in MT induction in response to physical stress. Since the cadmium-induced increase in MT mRNA levels does not appear to be mediated by direct activation of MTF1 (32), as opposed to its activation by zinc, the induction of MT by different stimuli may be brought about by the modification of distinct factors specific for each stimulus.
Studies on MT induction by physical stress usually subject the animals to complete immobilization for a relatively long period, which can lead to considerable trauma. We took advantage of a mouse model system developed in our laboratory (33) in which the mice were restrained in well ventilated polypropylene tubes for 12 h each day. The animals were free to move back and forth in the tube. The present study was undertaken to address the nature of the physiological factor, the molecular mechanism for the enhanced MT mRNA level, the nature of the transcription factor, and the potential habituation of the animals to stress with respect to altered MT expression. This investigation focused on the liver, where the maximal induction of MT was observed in the stressed animals.
MATERIALS AND METHODS
Induction of Stress and Drug Treatment of Mice
The 4–8-week-old inbred male mice (C57BL/6), maintained on a 12-h light/dark cycle (lights on at 0600 h), were usually subjected to restraint stress by keeping them in well ventilated 50-ml conical polypropylene tubes for 12 h each day (from 2100 h until 0900 h). During the restraining period, the mice did not have any access to food and water. At the end of each restraint cycle, the animals were allowed access to food and water ad libitum.
To identify the neuroendocrine factors mediating the restraint-induced increase in MT expression, the animals were implanted with 21-day continuous release pellets containing 0.5 mg/pellet RU 486 (a type II glucocorticoid receptor antagonist) or 0.5 mg/pellet nadolol (a catecholamine receptor antagonist) along with appropriate vehicle carrier pellets (all purchased from Innovative Research of America, Inc., Miami, FL). The optimal drug dosages were determined previously (34). The pellets released 1.2 mg of drug/kg/day. The doses above this level yielded the same result. The drugs were implanted subcutaneously using a 14-gauge trocar 3 days prior to restraint.
Isolation of Total RNA and Northern Blot Analysis
The livers from the control and restrained animals were frozen in liquid nitrogen immediately after removal, and total RNA was isolated by the guanidinium thiocyanate-acid phenol method and subjected to Northern blot analysis either using a random-primed, [α-32P]dCTP-labeled mouse MT-I minigene (pMT-IΔi) (35) or [α-32P]dATP-tailed deoxyoligonucleotides specific for mouse MT-I and MT-II (36). The blots were subjected to PhosphorImager analysis, and the 32P signal in each lane was quantitated by the Volume Analysis program (Molecular Dynamics, Inc.). The blots were also subjected to autoradiography. To verify that equal amounts of RNA were loaded onto each lane, the blots were stripped off the MT-I probe following the manufacturer's protocol and then reprobed with random-primed, [α-32P]dCTP-labeled rat glyceraldehyde-3-phosphate dehydrogenase (GAPDH) cDNA (37). To distinguish between MT-I and MT-I mRNAs, we used antisense oligonucleotides specific for mouse MT-I and MT-II (36). These oligonucleotides are labeled at the 3′-end with [α-32P]dATP catalyzed by terminal deoxynucleotidyltransferase.
Nuclear Run-on Transcription
The nuclei were isolated from the livers of the mice as described by Gorski et al. (38), and 5 × 10⁷ nuclei were incubated with ATP, GTP, CTP, and [α-32P]UTP at 30 °C for 10 min. The labeled RNA was isolated and used for hybridization overnight (5 × 10⁶ cpm/ml) in Rapid Hybridization Buffer (Amersham Pharmacia Biotech) to different plasmids immobilized on nylon membrane. To determine the specific changes in the level of the MT-I transcript, the plasmid DNA that contains GAPDH (a housekeeping gene), pBS/SK (the control vector), and MT-I genomic DNA were used. The signals in the slots containing the immobilized plasmids were measured by PhosphorImager analysis and quantitated as described above. Graphical representation of PhosphorImager data was performed using Kaleidagraph 3.0 (Synergy software).
Preparation of Nuclear Extracts
Nuclei were isolated from the liver as described by Gorski et al. (38), and nuclear extracts from the control and restrained mice were prepared according to the protocol of Wadzinski et al. (39). These extracts were adequate for the detection of the DNA-binding proteins by electrophoretic mobility shift assay (EMSA). The protein in the extracts was estimated using Bio-Rad protein assay reagent with bovine serum albumin as a standard.
Measurement of Serum Glucocorticoid
The serum corticosterone level was measured by radioimmunoassay using a 125I-labeled corticosterone kit (ICN Biochemical, Inc., Costa Mesa, CA) at different time points after releasing the animals from one cycle of stress. Serum samples from four to five mice were pooled for each glucocorticoid measurement. We have demonstrated that the experimental error in measuring corticosterone using a commercial kit is <10% (23).
Assay of the DNA-binding Activities of the Transcription Factors
The DNA-binding activities of some of the well characterized transcriptional activators for MT-I were measured by EMSA. The nuclear extracts were prepared from the livers of the control and stressed mice and incubated with [α-32P]dGTP-labeled specific oligonucleotides under optimal conditions. The DNA-protein complexes were separated by polyacrylamide gel electrophoresis under nondenaturing conditions, subjected to autoradiography, and quantitated by PhosphorImager analysis. The deoxyoligonucleotides used for EMSA correspond to MRE-d (40), MRE-s (40), Sp1 (Promega), MLTF/ARE (40), MLTF (Santa Cruz Biotechnology), and AP-1 (Promega). For GRE-binding activity, we used one of the two GRE consensus sequences located upstream of the mouse MT-I and MT-II genes (41), whose sequence is as follows (Sequence 1).
Sequence 1.

The underlined sequence corresponds to the GRE consensus for the mouse MT-I/MT-II gene. The mutant GRE was obtained from Santa Cruz Biotechnology.
RESULTS
Restraint Stress Induces MT Expression in the Livers of C57BL/6 Mice
We used Northern blot analysis to measure MT-I and MT-II mRNA levels in the livers of C57BL/6 mice restrained for different days and compared them with those of home-cage control mice (Fig. 1). Restraining for one cycle (12 h) dramatically increased MT-I and MT-II mRNA levels (Fig. 1A, compare lanes 1 and 2). PhosphorImager analysis of the Northern blots and quantitation of 32P signals (see “Materials and Methods”) showed ∼10- and 20-fold increases in the mRNA levels (Fig. 1B) for MT-I and MT-II, respectively. This enhanced level of MT-I and MT-II persisted for up to five cycles of restraint (Fig. 1A, lanes 3 and 4). The mRNA levels of both isoforms followed a similar pattern, although the level of MT-II was higher than that of MT-I. MT-I and MT-II mRNA levels started to fall after seven cycles (Fig. 1A, lane 5), and after nine cycles, they came down almost to the basal level (lane 6), suggesting habituation or adaptation of the animals to restraint stress with respect to induction of MT. We also measured the MT-III mRNA level in the livers of normal and restrained mice, but did not find any significant increase (data not shown). This is not surprising, as the expression of MT-III is largely confined to the brain (42).
Fig. 1.
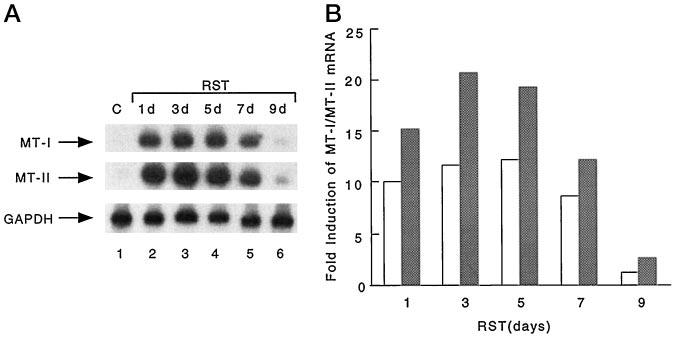
A, levels of MT-I and II mRNAs in the livers of mice restrained for different days. Total RNAs were isolated from the livers of normal mice and mice restrained for different days (see “Materials and Methods” for details). RNA (30 μg) was separated by formaldehyde-agarose (1.2%) gel electrophoresis, transferred to nylon membrane, and subjected to Northern blot analysis with a 32P-labeled antisense oligonucleotide specific for mouse MT-I (upper panel). The blot was washed and subjected to autoradiography and to PhosphorImager analysis to quantitate the signal. The blot was then stripped off the probe and rehybridized to a 32P-labeled antisense oligonucleotide specific for mouse MT-II (middle panel) and finally to random-primed, 32P-labeled GAPDH cDNA (lower panel). Lane 1 indicates the mRNA levels in normal mouse liver (control (C)), and lanes 2– 6 represent those in the livers of mice restrained for 1, 3, 5, 7, and 9 days (d), respectively. The lower panel shows the level of GAPDH mRNA in each lane. B, graphical representation of MT-I and MT-II mRNA induction after different cycles of restraint stress (RST). The 32P signal for MT-I/MT-II mRNA in the control liver normalized to that of GAPDH was arbitrarily assigned the value of 1. -Fold induction was calculated by comparing the MT-I/MT-II signal in each time point normalized to the GAPDH signal to that of the control value. The results are the mean of three independent experiments on pooled liver RNA from each group consisting of four to five animals. The open and cross-hatched bars represent the MT-I and MT-II mRNA levels, respectively.
The MT mRNA Level Correlates with the Glucocorticoid Level in the Livers of Mice Restrained for One Cycle
The basal level of MT-I mRNA in the livers of the untreated mice was markedly low (Fig. 2A, lane 1) and did not change significantly at different times of the day. Restraint stress can elevate serum glucocorticoid levels (23), and treatment with glucocorticoid is known to induce MT in cell culture and animals (43, 44). It was therefore logical to assume that the MT mRNA level will increase if it is regulated by glucocorticoid during restraint stress. To address this issue, we restrained mice for one cycle (1800 to 0600 h) and killed them at different times of the day following stress, and the liver MT-I mRNA levels were determined by Northern blot analysis. As anticipated, there was a significant increase in the liver MT-I mRNA level after one cycle of stress, as compared with that in untreated mice (Fig. 2A, compare lane 1 with lanes 2-4). The level of MT-I mRNA was highest at 0600 h, immediately after release from the restraint, and was 30-fold greater than the control level (Fig. 2A). The mRNA level then dropped gradually with time (compare Fig. 2A, lane 2 with lanes 3 and 4). The higher level of MT mRNA in this experiment compared with that observed in the time course study (Fig. 1) is due to the use of the MT-I minigene as a probe in the Northern blot assay (Fig. 2), which measures both MT-I and II mRNA levels. We also measured the serum corticosterone level at different times following one cycle of restraint stress (see “Materials and Methods”). The serum glucocorticoid level in the restrained mice was ∼3.5-fold higher than that in the control animals at the 0600-h time point. The glucocorticoid level started to decline thereafter and reached the minimal level at 1200 h, whereas in the untreated mice, it began to rise at this time. Interestingly, at 1200 h, the level of corticosterone in the restrained mice declined below that in the control mice. This apparent feedback regulation of the corticosterone level following restraint stress has been observed before (23). After 1200 h, the serum glucocorticoid level in the restrained mice began to rise and reached the same level as that in the untreated mice at 1800 h, probably due to circadian control of the glucocorticoid level. Because there was no further increase in the MT-I mRNA level at 1800 h, either in the restrained or control mice (Fig. 2A, compare lanes 3 and 4), these results indicate that MT-I expression is not controlled by circadian variation of glucocorticoid, but rather by the stress-induced elevation of the serum glucocorticoid level.
Fig. 2.
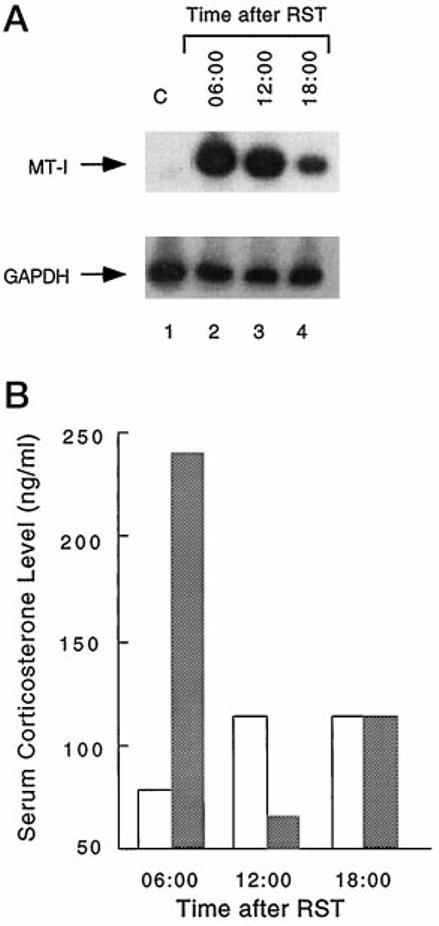
A, level of MT mRNA in the livers of restrained mice at different times of the day. Mice were restrained for 12 h (1800 to 0600 h), and total RNA was isolated from the livers at 0600, 1200, and 1800 h. RNA was isolated from the livers of control mice killed at the same time. Total RNA (30 μg) was subjected to Northern blot analysis with the random-primed, 32P-labeled MT-I minigene (BglII-HindIII fragment of the MT-I minigene), pMT-IΔi (upper panel). Since the MT-I mRNA level in normal mouse liver did not change during the day, only the 0600-h control (C) sample is shown (lane 1). Lanes 2–4 represent the MT-I mRNA levels in the livers of mice restrained for one cycle and killed at 0600, 1200, and 1800 h, respectively. The lower panel shows the level of GAPDH mRNA in each lane. B, serum corticosterone level at different times of the day in the control mice and mice restrained for one cycle. Blood was collected from each mouse (each group consisted of five animals for each time point) immediately before death, and the pooled sera from five mice were used to measure the corticosterone level by radioimmunoassay. The open and cross-hatched bars denote the corticosterone levels in the sera of the control and restrained mice, respectively. RST, restraint stress.
The Glucocorticoid Receptor Antagonist RU 486 Partially Blocks the Stress-induced Elevation of the MT mRNA Level, whereas the Catecholamine Receptor Antagonist Nadolol Has No Effect
We then investigated the nature of the physiological inducer for MT-I during restraint stress. It is known that stress activates the hypothalamus-pituitary-adrenal gland axis as a result of which plasma glucocorticoid and catecholamine levels are elevated (22, 23). These agents can, in turn, modulate expression of different target genes in various tissues depending on the availability of their receptors on target tissues. To determine which of these agents activates expression of MTs in the liver during restraint stress, a sustained release pellet of the type II glucocorticoid receptor antagonist RU 486 was implanted subcutaneously in the mice 3 days prior to restraint. As a control, the mice were implanted with the same pellet without the drug. After three cycles of restraint, the mice were killed, and total RNA isolated from the liver was subjected to Northern blot analysis with the MT-I minigene as a probe (Fig. 3A). As expected, there was a significant increase in the MT mRNA level after 3 days of restraint stress (Fig. 3A, compare lanes 1 and 2). The MT-I mRNA level in the livers of restrained mice mock-implanted without the drug was almost identical to that in the control (no implantation) restrained mice (Fig. 3A, lane 3), whereas the MT-I mRNA level decreased by at least 50% in the liver of restrained mice implanted with RU 486 (Fig. 3, A, lane 4; and B). This result clearly shows that the induction of MT-I or MT-II in response to stress is at least partially mediated by glucocorticoids.
Fig. 3.

A, level of MT mRNA in the livers of restrained mice implanted with the glucocorticoid receptor antagonist RU 486. Mice were implanted with RU 486 or a placebo 3 days before restraint. After three cycles of restraint, the liver RNA was isolated from these mice as well as normal and non-implanted restrained mice. Total RNA (30 μg) was subjected to Northern blot analysis with the MT-I minigene (upper panel) or GAPDH cDNA (lower panel) as a probe. Lanes 1–4 represent the mRNA levels in the livers of normal mice (Control), restrained mice (RST), restrained mice implanted with a placebo pellet (RST+PL), and restrained mice implanted with an RU 486 pellet (RST+RU), respectively. Since the MT-I minigene used in the Northern blot assay hybridizes to both MT-I and MT-II mRNAs as they are highly homologous, mRNA signals correspond to both isoforms (unlike the data represented in Fig. 1). B, graphical representation of the effect of RU 486 on the restraint stress-induced elevation of MT mRNA levels. The 32P signal for MT-I/MT-II mRNA in the control liver normalized to that of GAPDH was arbitrarily assigned the value of 1. -Fold induction was calculated by comparing the MT signal in each treatment group normalized to the GAPDH signal to that of the control value. Lanes 1–3 represent -fold induction of MT in the livers of restrained (RST), restrained placebo-implanted (RST+PL), and restrained RU 486-implanted (RST+RU) mice, respectively. The results are the mean of three independent experiments on pooled liver RNA from each group consisting of four to five animals. C, level of MT mRNA in the livers of restrained mice implanted with the catecholamine receptor antagonist nadolol. Mice were implanted with a sustained release pellet of nadolol or with a placebo 3 days prior to restraint, and after three cycles of stress, total RNA from the livers was subjected to Northern blot analysis with the MT-I minigene (upper panel) or GAPDH cDNA (lower panel) as a probe. Lanes 1–3 represent the mRNA levels in the nadolol-implanted control mice, restrained placebo-implanted mice (RST+PL), and restrained nadolol-implanted mice (RST+NAD), respectively.
Since MT induction in the liver in response to restraint stress was not completely blocked by the glucocorticoid receptor antagonist, it is likely that other factors released from the hypothalamus-pituitary-adrenal gland axis, namely catecholamines, might play a role in MT induction. It is known that administration of epinephrine and norepinephrine to animals can activate MT genes (1). To study the potential role of catecholamines in the induction of MT in response to stress, a sustained release pellet of nadolol, a β-adrenergic receptor antagonist, was implanted in the mice (34). The drug implanted in normal mice had no effect on the MT-I mRNA level (Fig. 3C, lane 1). The livers of mice implanted with a placebo (Fig. 3C, lane 2) or implanted with nadolol (lane 3) exhibited a similar level of MT mRNA (compare lane 1 with lanes 2 and 3). This study demonstrates that MT-I induction in the liver in response to stress is not mediated by the physiological effectors catecholamines and that glucocorticoid is a major physiological mediator of the stress-induced alteration of MT expression.
MT Induction in the Liver in Response to Restraint Stress Occurs at the Level of Transcription
Northern blot analysis, which determines the steady-state level of an mRNA, can be due to either transcriptional or post-transcriptional control mechanisms. The altered expression of MT-I and MT-II by different agents occurs primarily at the level of transcription (28, 45, 46). To establish that this mechanism is responsible for the augmented level of MT-I mRNA following restraint stress, a nuclear run-on transcription assay was performed. In this experiment, nuclei isolated from the livers of normal mice and mice restrained for one cycle were labeled with [α-32P]UTP, and the 32P-labeled RNA (identical counts/min) was hybridized to different plasmid DNAs immobilized on a nylon membrane (Fig. 4). The MT transcript level in the liver nuclei from the stressed mice was significantly (20-fold) higher than that in the control liver nuclei, whereas the GAPDH transcript level was identical in both control and restrained samples. This experiment demonstrates that the restraint stress-mediated induction of MT occurs largely at the level of transcription. Since the extent of stimulation (20-fold) of MT-I transcription is consistent with the stimulation observed by Northern blot analysis of RNA, the MT-I induction following restraint stress must occur largely at the transcriptional level.
Fig. 4. Transcription in isolated nuclei (run-on transcription) from the livers of control and restrained mice.

Nuclei isolated from the control mice and the mice restrained (RST) for one cycle were incubated with [α-32P]UTP, and total RNA containing the same counts/min was used as a probe to hybridize to different plasmid DNAs (see “Materials and Methods” for details). Lanes 1 and 2 represent 5 and 10 μg of pBS/SK vector plasmid, respectively; lanes 3 and 4 correspond to 5 and 10 μg of the plasmid containing mouse MT-I genomic DNA, respectively; and lanes 5 and 6 represent 5 and 10 μg of rat GAPDH cDNA, respectively.
The Glucocorticoid Receptor (GR) Is Significantly Activated in the Livers of Mice Subjected to Restraint Stress
As MT induction in response to restraint stress occurs primarily at the level of transcription, we next explored the transcription factors that are probably activated under this condition to facilitate MT expression. For this purpose, we measured the DNA-binding activities of the factors Sp1, MTF1, MLTF, and GR, which bind to and transactivate the MT-I promoter. Although the inducibility of mouse MT by direct administration of glucocorticoids in vivo has been known (43, 44), the glucocorticoid response element (GRE), which confers glucocorticoid response, was identified in the upstream region of the MT gene only recently (41). This element is located 7 kilobases upstream of the MT-I gene and 3 kilobases upstream of the MT-II gene and consists of two GRE consensus sequences separated by a few base pairs. The two GRE sequences present in the mouse MT promoter differ from the GRE consensus element (GGTACAnnnTGTTCT) in two or three positions, but can still bind to the recombinant GR and can also mediate dexamethasone-mediated activation of the MT genes in transfected cells (41). We synthesized a deoxyoligonucleotide spanning one of these GREs and used it as a probe in EMSA using nuclear extract from the liver. A specific DNA-protein complex was detected in the normal mouse liver nuclear extract (Fig. 5A, lane 1), which could be competed with a 100-fold molar excess of the wild-type GRE (lane 3), but not with the mutant GRE (lane 4). Compared with the control extract, there was 4-fold increase in the GRE-binding activity in the liver nuclear extract prepared from mice restrained for three cycles (Fig. 5A, compare lanes 1 and 2), which could be competed with the wild-type GRE (lane 5), but not with the mutant GRE (lane 6). We also measured the DNA-binding activities of three other factors by EMSA with specific oligonucleotides in the same nuclear extract. MTF1 is a factor required for basal as well as induced transcription of MT in response to heavy metals (24) and oxidative stress (40, 47). Its DNA-binding activity was measured in the liver nuclear extract with the MRE-d oligonucleotide. Since MRE-d contains the binding sites for both Sp1 and MTF1, two complexes corresponding to these factors were formed (Fig. 5B, compare lanes 1 and 2). Competitive EMSA with the unlabeled Sp1 oligonucleotide formed a complex containing only MTF1 (Fig. 5B, lanes 3 and 4), whereas competition with the MRE-s oligonucleotide (a variant form of MRE-d in which the Sp1 site is mutated and that selectively interacts with MTF1) produced the Sp1-specific complex (lanes 5 and 6). There was no significant change in the DNA-binding activities of the factors Sp1 and MTF1 in the nuclear extract from the restrained mouse liver (Fig. 5B, compare lanes 4 and 6 with lanes 3 and 5, respectively). MLTF is another factor that is involved in the constitutive expression of MT genes (29). It binds to the composite MLTF/ARE sequence of the MT-I promoter. In the liver nuclear extracts from the control and restrained mice, a prominent complex was detected with the MLTF/ARE oligonucleotide (Fig. 5C, lanes 1 and 2, respectively), which could be competed with the MLTF oligonucleotide (lane 3) or the MLTF/ARE oligonucleotide (lane 4), but not with the AP-1 consensus oligonucleotide (lane 5) or the MRE-s oligonucleotide (lane 6). These results show that MLTF is the only factor in the liver nuclear extract that binds to the MLTF/ARE sequence, and it was not significantly altered after restraining the mice (Fig. 5C, compare lanes 1 and 2). The higher activity in lane 6 is probably due to slight overloading of the sample, as the level of the MLTF complex in all other lanes was nearly identical. We conclude that among the factors that bind to and transactivate the MT-I promoter, only GR activity is significantly elevated in response to restraint stress.
Fig. 5. EMSA using liver nuclear extracts from normal and restrained mice and 32P-labeled MRE-d and MLTF/ARE oligonucleotides as probes.

Identical amounts (10 μg) of liver nuclear extracts from the control and restrained mice were incubated with the 32P-labeled oligonucleotides under optimal binding conditions (see “Materials and Methods” for details), and the DNA-protein complexes were separated by polyacrylamide (4% acrylamide) gel electrophoresis with 0.25× Tris borate/EDTA (for MRE-d) or 1× TG (for the GRE and MLTF/ARE) as running buffer. The gel was transferred to blotting paper, dried, and subjected to autoradiography and PhosphorImager analysis for quantitation. A, GRE-binding activities in liver nuclear extracts from the control (C) and restrained (R) mice. Lanes 1 and 2 indicate the complexes formed with 10 μg of the extracts from the control and restrained mice, respectively. Lanes 3 and 4 represent the complexes formed with the extract from the control mice after preincubation with a 100-fold excess of unlabeled wild-type (WT) and mutant (MUT) GREs, respectively. Lanes 5 and 6 denote the complexes formed with the nuclear extracts from the restrained mice after preincubation with an excess of wild-type and mutant GREs, respectively. GR indicates the specific glucocorticoid receptor complex. B, DNA-binding activities of MTF1 and Sp1 in the liver nuclear extracts from the control and restrained mice. Lanes 1 and 2 indicate the complexes formed with 10 μg of the extracts from the control and restrained mice, respectively. Lanes 3 and 4 represent the complexes formed with the extracts from the control and restrained mice after preincubation with a 100-fold excess of the unlabeled Sp1 consensus oligonucleotide, respectively. Lanes 5 and 6 denote the complexes formed with the extracts from the control and restrained mice after preincubation with a 100-fold excess of the MRE-s oligonucleotide, respectively. C, DNA-binding activities of USF/MLTF in the liver nuclear extracts from the control and restrained mice. Lanes 1 and 2 represent MLTF-oligonucleotide complexes formed with 10 μg of the extracts from control and restrained mice, respectively. Lanes 3–6 represent the complexes formed in restrained mouse extract after preincubation with a 100-fold molar excess of MLTF, MLTF/ARE, AP-1, and MRE-s oligonucleotides, respectively.
MT Is Induced in the Livers of Mice Habituated to Restraint Stress in Response to a Different Stress Condition
This study has shown that the mRNA levels of MT-I and MT-II returned to the basal level when restraint stress was prolonged for several cycles. This restoration of MT induction to the basal level suggests that these animals habituate to this stressor. The stimulus from the hypothalamus-pituitary-adrenal gland axis may subside after prolonged stress, as a result of which MT-I and MT-II genes are turned off. To test this possibility, we injected the mice restrained for 9 days and home-cage control mice with ZnSO4 and CdSO4. The control group was injected with the same volume of physiological saline. Normal mice injected with saline showed a very low level of MT-I mRNA (Fig. 6, lane 1), which increased significantly after treatment with zinc sulfate (lane 2) or cadmium sulfate (lane 3). Similarly, restrained mice injected with saline showed MT-I mRNA levels 2–3-fold higher than the control group (Fig. 6, compare lanes 1 and 4), and this level increased significantly after zinc (lane 5) or cadmium (lane 6) treatment. These results showed that after 9 days of restraint, the mice could still respond to a second stimulus or stressor.
Fig. 6. Level of MT-I mRNA in the livers of mice restrained for 9 days and then challenged with CdSO4 or ZnSO4.

Normal (Control) mice and restrained (RST) mice (9 days) were injected with physiological saline or with CdSO4 (15 μmol/kg of body weight) or ZnSO4 (50 μmol/kg of body weight) dissolved in saline. After 4 h, total RNA was isolated from the livers of these mice, and 30 μg of RNA was subjected to Northern blot analysis with MT-I cDNA (upper panel) or GAPDH cDNA (lower panel). Lanes 1–3 represent MT-I mRNA levels in the livers of normal mice injected with saline, ZnSO4, and CdSO4, respectively. Lanes 4–6 indicate mRNA levels in the livers of restrained mice injected with saline, ZnSO4, and CdSO4, respectively.
DISCUSSION
Previous studies on the stress-induced changes in MT expression used animals that were completely immobilized by fixing them to a board or enclosing them in a wrapping of metallic net (18, 19), whereas this investigation utilized a mouse model system that has been explored extensively for determining the neuroendocrinological changes under stress (20, 22, 23, 34, 48, 49). The merit of this model system is that the animals are free to move around, and the only restriction is the inability to turn around in the conical tube. Furthermore, the animals had free access to food and water after each cycle of restraint that lasted 12 h, which permitted us to explore the physiological adaptation after a few cycles of a particular type of stressor. Another advantage of this model system is that one can investigate in an animal system whether distinct molecular mechanism(s) exists for MT induction in response to a variety of physical and chemical stresses that are known to increase the level of MT.
Although the MT-I and MT-II levels are known to increase following complete immobilization stress (17, 18, 21), the molecular mechanisms of this induction have not been elucidated. We have demonstrated for the first time that MT induction by restraint stress occurs at the transcriptional level. It is unlikely that MT induction is also mediated by post-transcriptional control mechanisms, as the extent of stimulation observed by Northern blot analysis is similar to that observed in the nuclear run-on assay. To date, the potential adaptation or habituation of the animals with respect to MT induction in response to different types of stress has not been investigated. This study has shown that the mRNA levels of mouse metallothioneins I and II are dramatically elevated in the liver in response to a relatively simple physical stress condition and that the augmented level of MT mRNA returned to the constitutive level after several cycles of repeated stress. The precise mechanism(s) for this down-regulation is unclear. Interestingly, the mRNA levels increased again in response to a different stressor, exposure to heavy metals. The MT protein level also correlated well with alterations of the mRNA levels (data not shown). Under this condition, the mRNA levels of two other stress-inducible proteins, namely heme oxygenase I and hsp70, were not elevated (data not shown), although these genes, like MT, can be induced by cadmium (50, 51). To our knowledge, this is the first report of the habituation of animals to restraint stress with respect to MT expression.
There have been conflicting reports concerning the role of glucocorticoid in the stress-mediated increase in MT levels. Hidalgo et al. (21) reported that RU 486 treatment activates basal or stress-mediated increases in MT levels. Subsequently, the same investigators claimed that restraint stress-induced glucocorticoid augments MT mRNA synthesis (17). We have consistently observed that inhibition of GR activity suppresses stress-induced increases in the MT mRNA level by at least 50%. More important, the rise in the MT-I mRNA level is consistent with the stress-induced increase in the corticosterone level, rather than the diurnal fluctuations of the steroid hormone, suggesting regulation by the type II glucocorticoid receptor. To our knowledge, this is the first report showing that MT genes can be induced by physiological alteration of the level of corticosterone, the natural glucocorticoid for rodents. The role of glucocorticoid in the stress-mediated induction of MT was established by the rise in the blood corticosterone concentration after restraint, as well as by the partial block of MT induction as a result of prior treatment of the mice with the glucocorticoid receptor antagonist RU 486. Furthermore, the absence of MT induction after nine cycles of stress is consistent with the decrease in the serum glucocorticoid level after prolonged exposure to stress (23). Since the augmented MT expression is not inhibited by nadolol, a β-adrenergic receptor antagonist, the catecholamines are not likely to be involved in this process. Alternatively, the stress-mediated release of opioids may also contribute to the activation of the MT promoter under this condition. Further study is required to test the latter possibility.
This study also explored the nature of the transcription factor(s) that may be activated by restraint stress. Since glucocorticoids play a key role in MT induction by stress, it was logical to conceive that the glucocorticoid receptor may be activated following stress. Although it has been known for a long time that dexamethasone treatment of animals as well as cells in culture induces MT genes, the cis-acting sequence (GRE) regulating the expression was identified in the mouse promoter only recently (41). Either one of the two copies of the GRE located upstream of MT-II can bind to the recombinant GR and is solely responsible for dexamethasone-mediated activation of both MT genes. Using one of these GRE oligonucleotides, we have shown that the DNA-binding activity of the GR is enhanced 3–5-fold in liver extracts from the stressed animals. The DNA-binding activity of the GR was observed only with the oligonucleotide corresponding to the wild-type GRE, but not with the oligonucleotide corresponding to the mutant GRE and liver nuclear extracts, which further confirms the role of the GR in MT induction by restraint stress.
We also investigated whether the activities of other key transcription factors, e.g. Sp1 and USF/MLTF, are altered by stress. The DNA-binding activities were unaltered under this condition. MTF1 is another factor that has been established to have an important role in the basal and induced expression of MT. It was logical to study the effect of restraint stress on the activity of this factor. Surprisingly, this factor was not activated by this inducer. These data suggest that the mechanism of induction of MT by stress is distinct from that by chemical stress (e.g. heavy metals) that is mediated by MTF1. The glucocorticoid receptor appears to be the major factor positively regulated by restraint stress and is known to bind a specific glucocorticoid response element located upstream of the MT-I or MT-II gene. Recently, a mutant mouse strain was generated in which the DNA-binding activity of the GR was abolished without affecting the ligand binding and transactivating functions (52). These mice will a useful tool to study further the role of stress-induced release of glucocorticoid in induction of MTs and other immunomodulatory factors.
Acknowledgments
We are grateful to Dr. Richard Palmiter for providing the mouse MT-I clone and Dr. Pal Vaghy for advising us on the Kaleidagraph Program.
Footnotes
This work was supported in part by Grant CA 61321 from NCI (to S. T. J.) and by Grant R01-MH 46801 from the National Institute of Mental Health and Grant P01-AG 11585 from NIA (to J. F. S.).
The abbreviations used are: MT, metallothionein; GAPDH, glyceraldehyde-3-phosphate dehydrogenase; EMSA, electrophoretic mobility shift assay; GR, glucocorticoid receptor; GRE, glucocorticoid response element.
REFERENCES
- 1.Kagi JA. Methods Enzymol. 1991;205:613–626. doi: 10.1016/0076-6879(91)05145-l. [DOI] [PubMed] [Google Scholar]
- 2.Karin M. Cell. 1985;41:9–10. doi: 10.1016/0092-8674(85)90051-0. [DOI] [PubMed] [Google Scholar]
- 3.Moffatt P, Denizeau F. Drug Metab. Rev. 1997;29:261–307. doi: 10.3109/03602539709037585. [DOI] [PubMed] [Google Scholar]
- 4.Vallee BL. Neurochem. Int. 1995;27:23–33. doi: 10.1016/0197-0186(94)00165-q. [DOI] [PubMed] [Google Scholar]
- 5.Bremner I. Methods Enzymol. 1991;205:584–591. doi: 10.1016/0076-6879(91)05142-i. [DOI] [PubMed] [Google Scholar]
- 6.Pitt BR, Schwarz M, Woo ES, Yee E, Wasserloos K, Tran S, Weng W, Mannix RJ, Watkins SA, Tyurina YY, Tyurin VA, Kagan VE, Lazo JS. Am. J. Physiol. 1997;273:L856–L865. doi: 10.1152/ajplung.1997.273.4.L856. [DOI] [PubMed] [Google Scholar]
- 7.Schwarz MA, Lazo JS, Yalowich JC, Reynolds I, Kagan VE, Tyurin V, Kim YM, Watkins SC, Pitt BR. J. Biol. Chem. 1994;269:15238–15243. [PubMed] [Google Scholar]
- 8.Kelly SL, Basu A, Teicher BA, Hacker MP, Hamer DH, Lazo JS. Science. 1990;35:1813–1815. doi: 10.1126/science.3175622. [DOI] [PubMed] [Google Scholar]
- 9.Chubatsu LS, Meneghini M,R. Biochem. J. 1993;291:193–198. doi: 10.1042/bj2910193. [DOI] [PMC free article] [PubMed] [Google Scholar]
- 10.Schwarz MA, Lazo JS, Yalowich JC, Allen WP, Whitmore M, Bergonia HA, Tzeng E, Billiar TR, Robbins PD, Lancaster JR, Jr., Pitt BR. Proc. Natl. Acad. Sci. U. S. A. 1995;92:4452–4456. doi: 10.1073/pnas.92.10.4452. [DOI] [PMC free article] [PubMed] [Google Scholar]
- 11.Kasahara K, Fujiwara Y, Nishio K, Ohmori T, Sugimoto Y, Komiya K, Matsuda T, Saijo N. Cancer Res. 1991;51:3237–3242. [PubMed] [Google Scholar]
- 12.Lazo JS, Kondo Y, Dellapiazza D, Michalska AE, Choo KH, Pitt BR. J. Biol. Chem. 1995;270:5506–5510. doi: 10.1074/jbc.270.10.5506. [DOI] [PubMed] [Google Scholar]
- 13.Masters BA, Kelly EJ, Quaife CJ, Brinster RL, Palmiter RD. Proc. Natl. Acad. Sci. U. S. A. 1994;91:584–588. doi: 10.1073/pnas.91.2.584. [DOI] [PMC free article] [PubMed] [Google Scholar]
- 14.Kang YJ, Chen Y, Yu A, Voss-McCowan M, Epstein PN. J. Clin. Invest. 1997;100:1501–1506. doi: 10.1172/JCI119672. [DOI] [PMC free article] [PubMed] [Google Scholar]
- 15.Schilder RJ, Hall L, Monks A, Handel LM, Fornace AJ, Jr., Ozols RF, Fozo AT, Hamilton TC. Int. J. Cancer. 1990;45:416–422. doi: 10.1002/ijc.2910450306. [DOI] [PubMed] [Google Scholar]
- 16.Hidalgo J, Rhee SJ, Huang PC, Garvey JS. Horm. Metab. Res. 1992;24:233–236. doi: 10.1055/s-2007-1003300. [DOI] [PubMed] [Google Scholar]
- 17.Hidalgo J, Borras M, Garvey JS, Armario A. J. Neurochem. 1990;55:651–654. doi: 10.1111/j.1471-4159.1990.tb04182.x. [DOI] [PubMed] [Google Scholar]
- 18.Hidalgo J, Armario A, Flos R, Garvey JS. Experientia (Basel) 1986;42:1006–1010. doi: 10.1007/BF01940708. [DOI] [PubMed] [Google Scholar]
- 19.Belloso E, Hernandez J, Giralt M, Kille P, Hidalgo J. Neuroendocrinology. 1996;64:430–439. doi: 10.1159/000127149. [DOI] [PubMed] [Google Scholar]
- 20.Dobbs CM, Feng N, Beck FM, Sheridan JF. J. Immunol. 1996;157:1870–1877. [PubMed] [Google Scholar]
- 21.Hidalgo J, Giralt M, Garvey JS, Armario A. Am. J. Physiol. 1988;254:E71–E78. doi: 10.1152/ajpendo.1988.254.1.E71. [DOI] [PubMed] [Google Scholar]
- 22.Hermann G, Beck FM, Tovar CA, Malarkey WB, Allen C, Sheridan JF. J. Neuroimmunol. 1994;53:173–180. doi: 10.1016/0165-5728(94)90027-2. [DOI] [PubMed] [Google Scholar]
- 23.Hermann G, Tovar CA, Beck FM, Sheridan JF. J. Neuroimmunol. 1994;49:25–33. doi: 10.1016/0165-5728(94)90177-5. [DOI] [PubMed] [Google Scholar]
- 24.Heuchel R, Radtke F, Georgiev O, Stark G, Aguet M, Schaffner W. EMBO J. 1994;13:2870–2875. doi: 10.1002/j.1460-2075.1994.tb06581.x. [DOI] [PMC free article] [PubMed] [Google Scholar]
- 25.Radtke F, Heuchel R, Georgiev O, Hergersberg M, Gariglio M, Dembic Z, Schaffner W. EMBO J. 1993;12:1355–1362. doi: 10.1002/j.1460-2075.1993.tb05780.x. [DOI] [PMC free article] [PubMed] [Google Scholar]
- 26.Radtke F, Georgiev O, Muller HP, Brugnera E, Schaffner W. Nucleic Acids Res. 1995;23:2277–2286. doi: 10.1093/nar/23.12.2277. [DOI] [PMC free article] [PubMed] [Google Scholar]
- 27.Brugnera E, Georgiev O, Radtke F, Heuchel R, Baker E, Sutherland GR, Schaffner W. Nucleic Acids Res. 1994;22:3167–3173. doi: 10.1093/nar/22.15.3167. [DOI] [PMC free article] [PubMed] [Google Scholar]
- 28.Thiele DJ. Nucleic Acids Res. 1992;20:1183–1191. doi: 10.1093/nar/20.6.1183. [DOI] [PMC free article] [PubMed] [Google Scholar]
- 29.Carthew RW, Chodosh LA, Sharp PA. Genes Dev. 1987;1:973–980. doi: 10.1101/gad.1.9.973. [DOI] [PubMed] [Google Scholar]
- 30.Aniskovitch LP, Jacob ST. Arch. Biochem. Biophys. 1997;341:337–346. doi: 10.1006/abbi.1997.9976. [DOI] [PubMed] [Google Scholar]
- 31.Aniskovitch LP, Jacob ST. Oncogene. 1998;16:1475–1486. doi: 10.1038/sj.onc.1201659. [DOI] [PubMed] [Google Scholar]
- 32.Bittel D, Dalton TP, Samson SL-A, Gedamu L, Andrews GK. J. Biol. Chem. 1998;273:7127–7133. doi: 10.1074/jbc.273.12.7127. [DOI] [PubMed] [Google Scholar]
- 33.Sheridan JF, Feng N, Bonneau RH, Allen CM, Huneycutt BS, Glaser R. J. Neuroimmunol. 1991;31:245–255. doi: 10.1016/0165-5728(91)90046-a. [DOI] [PubMed] [Google Scholar]
- 34.Dobbs CM, Vasquez M, Glaser R, Sheridan JF. J. Neuroimmunol. 1993;48:151–160. doi: 10.1016/0165-5728(93)90187-4. [DOI] [PubMed] [Google Scholar]
- 35.Glanville N, Durnam JD, Palmiter RD. Nature. 1981;292:267–269. doi: 10.1038/292267a0. [DOI] [PubMed] [Google Scholar]
- 36.Choudhuri S, Kramer KK, Berman NE, Dalton TP, Andrews GK, Klassen KD. Toxicol. Appl. Pharmacol. 1994;131:144–154. doi: 10.1006/taap.1995.1056. [DOI] [PubMed] [Google Scholar]
- 37.Fort P, Piechaczyk M, El Sabrouty S, Dani C, Jeanteur P, Blanchard JM. Nucleic Acids Res. 1985;13:1431–1442. doi: 10.1093/nar/13.5.1431. [DOI] [PMC free article] [PubMed] [Google Scholar]
- 38.Gorski K, Carneiro M, Schibler U. Cell. 1986;47:767–776. doi: 10.1016/0092-8674(86)90519-2. [DOI] [PubMed] [Google Scholar]
- 39.Wadzinski BE, Wheat WH, Jaspres S, Peruski LF, Jr., Lickteig RL, Johnson GL, Klemm D. Mol. Cell. Biol. 1993;13:2822–2834. doi: 10.1128/mcb.13.5.2822. [DOI] [PMC free article] [PubMed] [Google Scholar]
- 40.Dalton TP, Li Q, Bittel D, Liang L, Andrews GK. J. Biol. Chem. 1996;271:26233–26241. doi: 10.1074/jbc.271.42.26233. [DOI] [PubMed] [Google Scholar]
- 41.Kelly EJ, Sandgren EP, Brinster RL, Palmiter RD. Proc. Natl. Acad. Sci. U. S. A. 1997;94:10045–10050. doi: 10.1073/pnas.94.19.10045. [DOI] [PMC free article] [PubMed] [Google Scholar]
- 42.Palmiter RD, Findley SD, Whitmore TE, Durnam DM. Proc. Natl. Acad. Sci. U. S. A. 1992;89:6333–6337. doi: 10.1073/pnas.89.14.6333. [DOI] [PMC free article] [PubMed] [Google Scholar]
- 43.Hager LJ, Palmiter RD. Nature. 1981;291:340–342. doi: 10.1038/291340a0. [DOI] [PubMed] [Google Scholar]
- 44.Mayo KE, Palmiter RD. J. Biol. Chem. 1981;256:2621–2624. [PubMed] [Google Scholar]
- 45.Hamer DH. Annu. Rev. Biochem. 1986;55:913–951. doi: 10.1146/annurev.bi.55.070186.004405. [DOI] [PubMed] [Google Scholar]
- 46.Palmiter RD. Experientia (Basel) 1987;52:63–80. doi: 10.1007/978-3-0348-6784-9_4. [DOI] [PubMed] [Google Scholar]
- 47.Gunes C, Heuchel R, Georgiev O, Lichtlen P, Bluthmann H, Marino S, Aguzzi A, Scaffner W. EMBO J. 1998;17:2846–2854. doi: 10.1093/emboj/17.10.2846. [DOI] [PMC free article] [PubMed] [Google Scholar]
- 48.Hermann G, Tovar CA, Beck FM, Allen C, Sheridan JF. J. Neuroimmunol. 1993;47:83–94. doi: 10.1016/0165-5728(93)90287-9. [DOI] [PubMed] [Google Scholar]
- 49.Hermann G, Beck FM, Sheridan JF. J. Neuroimmunol. 1995;56:179–186. doi: 10.1016/0165-5728(94)00145-e. [DOI] [PubMed] [Google Scholar]
- 50.Maines MD. FASEB J. 1988;2:2557–2568. [PubMed] [Google Scholar]
- 51.Mosser DD, Theodorakis NG, Morimoto RI. Mol. Cell. Biol. 1988;8:4736–4744. doi: 10.1128/mcb.8.11.4736. [DOI] [PMC free article] [PubMed] [Google Scholar]
- 52.Reichardt HM, Kaestner KH, Tuckermann J, Kretz O, Wessely O, Bock R, Gass P, Schmid W, Herrlich P, Angel P, Schutz G. Cell. 1998;93:531–541. doi: 10.1016/s0092-8674(00)81183-6. [DOI] [PubMed] [Google Scholar]