


Abstract
Oligonucleotides containing guanosine stretches associate into tetrameric structures stabilized by monovalent ions. In order to describe the sequence of reactions leading to association of four identical strands, we measured by NMR the formation and dissociation rates of (TGnT)4 quadruplexes (n = 3–6), their dissociation constants and the reaction orders for quadruplex formation. The quadruplex formation rates increase with the salt concentration but weakly depend on the nature (K+, Na+ or Li+) of the counter ions. The activation energies for quadruplex formation are negative. The quadruplex lifetimes strongly increase with the G-tract length and are much more longer in K+ solution than in Na+ or Li+ solutions. The reaction order for quadruplex formation is 3 in 0.125 M KCl and 4 in LiCl solutions. The kinetics measurements suggest that quadruplex formation proceeds step by step via sequential strand association into duplex and triplex intermediate species. Triplex formation is rate limiting in 0.125 M KCl solution. In LiCl, each step of the association process depends on the strand concentration. Parallel reactions to formation of the fully matched canonical quadruplex may result in kinetically trapped mismatched quadruplexes making the canonical quadruplex practically inaccessible in particular at low temperature in KCl solution.
INTRODUCTION
Two nucleic acid families can form tetrameric structures. The oligonucleotides containing stretches of at least two adjacent cytidines associate into a structure, the i-motif, formed by two parallel duplexes held by hemiprotonated C–C+ pairs and intercalated in each other (1). The G rich oligomers form four stranded structures maintained by stacked G-quartets (2–4). The G-quadruplexes and the i-motif have been the object of detailed structural studies (5), but the sequence of the reactions leading to the association of four strands into a tetrameric structure is not clear. The present article reports a kinetics study of the formation and dissociation of (TGnT)4 quadruplexes (n = 3–6) in KCl, NaCl and LiCl solutions and of (rUG4U)4 in NaCl solution, performed with the goal of describing their formation pathway. An equivalent study of the i-motif formation pathway is in preparation.
The (TGnT)4 quadruplexes are formed by four parallel strands bound together by n layers of G quartets (4). They include n − 1 monovalent cations bound between the G-quartets in the central cavity. This structure, that is readily identifiable by its NMR spectrum (6–8), is considered as the thermodynamically stable strand assembly. It will be designated as the ‘canonical quadruplex’.
It is unrealistic to imagine that quadruplex formation could result from the simultaneous collision of four strands. Quadruplex formation proceeds without doubt by step-wise strand association into elusive duplex or/and triplex structures. Nevertheless, there is no experimental evidence about the presence of such intermediate species. Kinetics experiments, including the measure of the quadruplex formation and dissociation rates, of the reaction order and equilibrium measurements of the quadruplex dissociation constant may provide information leading to the description of the association pathway.
Using gel filtration chromatography (9) and optical methods (10–15), previous kinetics studies have shown that strand association and quadruplex dissociation is extremely slow. A model for G-quadruplex formation involving association of two preformed duplexes was proposed on the basis of gel filtration chromatography experiments (9). NMR provides, by contrast with these methods, direct information about the nature of the multimers formed. Nevertheless, NMR has never been used to investigate the G-quadruplex formation kinetics. It will be shown that canonical quadruplex formation may go together with faster parallel reactions resulting in the apparition of quadruplex structures that are kinetically trapped in the early phase of the association reaction. The formation of the canonical quadruplex may be hindered in that case during periods exceeding any possibility of kinetics investigation. A rigorous control of the nature of the multimers formed is therefore a prerequisite condition to G-quadruplex kinetics investigation. For each oligonucleotide examined, we selected the experimental conditions (salt concentration, temperature) in which strand association leads to the formation of a single species: the canonical G-quadruplex. The description of the G-quadruplex formation pathway derived from these experiments is distinct of that initially proposed (9). Nevertheless, the data provided by the previous kinetics studies were a great help in the conception of the present study by allowing us to focus the NMR investigations in directions already explored.
MATERIALS AND METHODS
Oligonucleotides and NMR samples
The oligonucleotides were synthesized on a 10 μM scale and purified by chromatography on a DEAE column as previously reported (16). Depending on the cation used in the kinetics experiments, the deoxy oligonucleotides were dissolved after purification in 0.1 M Li+, Na+ or K+ hydroxide solutions in order to destroy any structure formed. The RNA sample was dissociated by heating at 95°C during 5 min. Afterwards, the oligonucleotides were dialyzed, first against water, then against 0.1 M LiCl, NaCl or KCl solutions and repeatedly against water. At last, the oligonucleotides were lyophilized and dissolved in water. The solution pH was adjusted to 6.5 with HCl and Li+, Na+ or K+ hydroxide. The strand concentration was determined using the A260 values provided by Mergny et al. (12). The NMR samples were usually buffered by Li+, Na+ or K+ phosphate 20 mM, pH 6.5. For the experiments performed at low salt concentration, the phosphate concentration was reduced to 2 mM. The monovalent cation concentration was adjusted by addition of 1 M Li+, Na+ or KCl solutions. Two microliters of a solution containing 100 mM dimethyl sulfoxide (DMSO) and Li+, Na+ or K+ acetate (50 mM) was added to each NMR sample. The chemical shift of the methyl protons of acetate provided a marker for pH determination (17). The DMSO NMR peak was used as an internal marker allowing normalization of spectra collected during the kinetics experiments. Ethylene diamine tetra acetic acid, Na+ form, was added to the RNA samples at the final concentration of 0.5 mM.
Association and dissociation rate measurements
To measure the quadruplex formation rates, the oligonucleotide solutions were melted at 100°C in the NMR tube and rapidly inserted into the NMR probe (17). The quadruplex dissociation time at 100°C may be extremely long in the presence of salt. In that case, the monovalent salt was added into the NMR tube immediately after melting. To measure the quadruplex dissociation rates, a small volume of a concentrated fully tetrameric oligonucleotide solution was diluted in the NMR tube immediately before the beginning of the experiment. The dilution buffer was degassed in order to avoid bubble formation during the experiments performed at high temperature. The NMR probe cannot be used at temperature higher than 80°C. In that case, the NMR samples were stored in a thermostated incubator and the monomer and quadruplex fractions were measured on spectra recorded at 75°C at different times during incubation.
The NMR experiments were performed on a 500 MHz Varian Inova spectrometer using the jump and return sequence for water suppression (18). The dead time to start the kinetics measurements was shorter than 3 min. Typically, the kinetic experiments were run overnight or during a weekend. Afterward, the NMR tube was sealed with parafilm and stored at controlled temperature in a thermostated incubator. Additional kinetics measurements were performed on the same sample after several days or weeks.
The tetramer and monomer fractions were determined from the area of several markers. The monomer and tetramer T methyl peaks provide the best markers due to their larger intensity. At high temperature, the well-resolved G N1H peaks were used as a marker of the quadruplex fractions. Depending on temperature and salt concentration, the T (H6) protons and several G (H8) protons belonging to the monomer and to the quadruplex were also used (Figure 1).
Figure 1.

Aromatic and methyl proton region of spectra recorded during the association kinetics of TG3T. The spectra were collected at different times right after melting of the oligonucleotide. The NMR peaks of the monomer are labeled ‘s’ and those of the quadruplex are labeled by the residue number according to Jin et al. (8). The line labeled by a star is that of acetate, a marker used to control the solution pH. The aromatic and methyl proton regions of the NMR spectrum show several well-resolved lines providing markers to measure the fraction of each species as a function of the time. The small chemical shifts observed for several NMR peaks of the monomer are indicated by dotted lines. They reflect a fast exchange situation between the monomer and an intermediate species, presumably (TG3T)2 (see text). Solution conditions: (TG3T) = 1.5 mM, T = 0°C, [K+] = 10 mM.
Determination of the reaction order of G tetramer formation
The reaction order for quadruplex (Q) formation is the value of the exponent of the monomer concentration (M) in the rate equation: 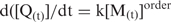 .
.
The half reaction time, τasso,M0 for strand association into a multimeric structure depends on a rate constant, k, on the initial strand concentration [M0] and on the reaction order:
| 1 |
The reaction order was determined from the slope, −(order−1), of the log–log plot of the half reaction time versus the oligonucleotide concentration. The error on τasso,M0 values evaluated by using different markers of the NMR spectra is ∼15%. We estimate that the error on the reaction order is comparable.
The quadruplex dissociation constant
The quadruplex dissociation constant in an oligonucleotide solution at concentration [M0] may be calculated from the monomer fraction at equilibrium, αeq, by:
The dimension of the dissociation constant is M3. It is more intelligible to express the quadruplex stability by Fi, the monomer concentration in equilibrium with the quadruplex when αeq = 0.5. It follows from this definition that the oligonucleotide concentration of a G-quadruplex solution at the melting temperature is 2 · Fi . Fi, that will be designated as the reduced dissociation constant is related to the quadruplex dissociation constant by: Fi = (Kdis/4)(1/3). The coherence of the tetramer and monomer equilibrium concentrations measured at different oligonucleotide concentrations was systematically controlled by checking that the tetramer concentration increases as the power of four of the monomer concentration.
Gel filtration chromatography
The stoichiometry of the structures formed by TGnT association was controlled at room temperature by high-pressure chromatography using a Synchropack GPC 100 column in 0.1 M Na or KCl elution solutions. The column was calibrated using TGnT monomers, deoxyduplexes containing from 6 to 16 bp and a tRNA sample.
RESULTS
Association kinetics
For each set of experimental condition (temperature, oligonucleotide concentration, nature and concentration of the monovalent cation) the monomer and quadruplex concentrations were measured as a function of the time and the tetramer reduced dissociation constant was determined from the evaluation of the concentration of each species at equilibrium.
The results related to TGnT association are sorted in two sub-sections according to a simple criterion: the presence or the absence during the association kinetics of any multimeric species different from the canonical quadruplex. In the first section, we present the experiments showing the formation of a single species: the canonical quadruplex. In that case, the half reaction times measured for monomer and quadruplex evolutions are identical. In the second sub section, we describe several experiments showing, or suggesting the formation of kinetically trapped quadruplexes distinct of the canonical quadruplexes. In that case, the evolution of the monomer concentration is much faster than that of the canonical quadruplex.
Formation kinetics of canonical (TGnT)4 quadruplexes
TG3T
Representative spectra collected during the formation of (TG3T)4 in a 1.5 mM TG3T solution initially monomeric are displayed in Figure 1. The spectra show only two species: the monomer, identified by comparison with the spectrum of a dilute TG3T sample at 70°C and the canonical tetramer. The sum of the monomer and tetramer fractions measured during the kinetics is close to one (Figure 2). This, together with the identity of the half reaction time of each species, 40 ± 5 min, establishes that formation of any other multimer is negligible. At equilibrium, the free strand proportion, αeq = 0.1, corresponds the reduced dissociation constant Fi = 7.2 × 10⁻⁵ M. Figure 2 shows that the half association times, τasso, measured versus the oligonucleotide concentration in 0.125 and 10 mM KCl solutions at 0°C vary as the power of −2 of the oligonucleotide concentration and thus establishes, Equation (1), that the reaction order for (TG3T)4 formation is 3. The half formation time of (TG3T)4 increases between 0 and 37°C with an activation energy of −36.2 kJ/mol (Figure S1). The reaction order is 3 in all this temperature range (Figure 3). The half formation time of (TG3T)4 decreases with the KCl concentration approximately as [KCl]−1.8 (Figure S2). The reaction order for (TG3T)4 formation in 37 mM KCl at 21°C is 3.2 ± 0.2.
Figure 2.

Formation kinetics of (TG3T)4. Left panel: evolution of the bound (open circles) and free (black circles) strand fractions during (TG3T)4 formation in KCl 10 mM at 0°C. The oligonucleotide concentration is 1.5 mM. Note that the timescale is logarithmic. The same half reaction time is measured for the free and bound strand fractions. The monomer proportion at equilibrium, αeq = 0.1, yields the reduced dissociation constant: Fi = 7.2 × 10⁻⁵ M. Right panel: half reaction time for (TG3T)4 formation versus the oligonucleotide concentration at 0°C in 0.125 M (black squares) and 10 mM (black circles) KCl. The lines drawn through the data points show that the half reaction time increases as power of −2 of the oligonucleotide concentration and therefore establishes that the reaction order is 3.
Figure 3.

Reaction order for G-quadruplex formation. Left panel: reaction orders versus temperature in 0.125 M salt solutions for formation of (TG3T)4 (squares), (TG4T)4 (circles), (rUG4U)4 (triangle) and (TG5T) 4 (diamond). The reaction order is 3 in KCl solution (blue) and 4 in LiCl solution (green) solution. In NaCl solution (red), the reaction order increases with temperature and depends on the G-tract length. Right panel: at 21°C, the reaction order for (TG4T)4 formation decreases as a function of the NaCl concentration.
In 0.125 M NaCl, the half formation time of (TG3T)4 at 0°C is about three times shorter than that measured in 0.125 M KCl. Due to the poor stability of (TG3T)4 in NaCl solution (Fi = 3 × 10⁻⁴ at 0°C) and to the fast association rate at high oligonucleotide concentration, the reaction order in NaCl solution, 3.5 ± 1, could not be determined with accuracy.
TG4T
In 0.125 M KCl solution, the formation rate of (TG4T)4 measured versus the oligonucleotide concentration between 0 and 72°C establishes that the reaction order is 3 (Figure S3). By contrast, in 5 mM KCl at 37°C, τasso vary as the power of −3 of the oligonucleotide concentration indicating that the reaction order is 4 (Figure S3).
In 0.125 M LiCl, the half formation time of (TG4T)4 is longer that in KCl solution (Figure 4). The variation of τasso versus the oligonucleotide concentration measured between 0 and 37°C shows that the reaction order for (TG4T)4 formation is 4 (Figures 3 and S3).
Figure 4.

Effect of temperature on the formation and dissociation half lifetime and on the reduced dissociation constant of (TG4T)4 in 0.125 M KCl, NaCl and LiCl. Upper panels: quadruplex lifetimes (triangles). Half formation times of the canonical quadruplex (open squares) and half association times of the TG4T monomer (black circles) measured in 10−4 M oligonucleotide solutions or extrapolated at 10−4 M from measures at higher oligonucleotide concentrations. The half lifetimes for canonical quadruplex formation and for monomer association are identical in the range of temperature where the formation of mismatched quadruplex is negligible (Table 1). Lower panel: reduced equilibrium constants derived from the monomer concentration at equilibrium (open circle). The crosses indicate the reduced equilibrium constants computed from the association and dissociation rates used in the numerical simulations.
In 0.125 M NaCl, the apparent reaction order increases with temperature from 3.2 ± 0.1 at 0°C up to 3.6 ± 0.1 at 50°C (Figure 3). It depends also on the NaCl concentration. At 21°C, the reaction order increases from 3.2 in 600 mM NaCl up to 4 in 37.5 mM NaCl (Figure 3). The half formation time of (TG4T)4 decreases with the NaCl concentration similarly to that of (TG3T)4 versus the KCl concentration (Figure S2).
TG5T
The spectra collected during the association kinetics of TG5T at 42 and 60°C in 0.125 M NaCl or LiCl shows also that the monomer and canonical quadruplex fractions vary simultaneously. The reaction order for (TG5T)4 formation at 42°C is 3 in NaCl and 4 in LiCl solution (Figure 3). The half formation times of (TG5T)4 and (TG4T)4 measured in 10−4 M oligonucleotide solutions at 60°C in 0.125 M NaCl are similar (Figures 4 and S1) but the activation energy for (TG5T)4 formation is about twice that measured for (TG4T)4 (Table 1).
Table 1.
Kinetics and equilibrium parameters for G-quadruplex formation and dissociation in 0.125 M salt
| Sequence | Salt | Aasso (min) | Easso (kJ/M) | Adisso (min) | Edisso (kJ/M) | Fi,42 (M) | Tm (°C) | τdisso, Tm (days) |
|---|---|---|---|---|---|---|---|---|
| TG3T | K | 6.2 × 10⁻¹⁰ | −36.2 | 6.7 × 1029 | 190.7 | 1.2 × 10⁻³ | 28 ± 3 | 2 ± 1 |
| TG4T | K | 10−19 | −93.1 | 2.8 × 1028 | 220.3 | 1.4 × 10⁻⁶ | 69 ± 4 | 112 ± 49 |
| TG4T | Na | 1.9 × 10⁻¹² | −50.4 | 4.8 × 1026 | 177.5 | 3.5 × 10⁻⁴ | 34 ± 4 | 2 ± 1 |
| TG4T | Li | 8.3 × 10⁻¹³ | −44.9 | 1.4 × 1028 | 185.9 | 5.4 × 10⁻⁴ | 24 ± 6 | 34 ± 22 |
| TG5T | Na | 6.7 × 10⁻²⁰ | −95.6 | 3 × 1050 | 365.6 | 3.1 × 10⁻⁷ | 73 ± 4 | 38 ± 22 |
| rUG4U | Na | 1.6 × 10⁻³⁰ | −163.2 | 2.6 × 1040 | 297 | 6 × 10⁻⁷ | 71 ± 5 | 50 ± 30 |
The quadruplex formation rates in 0.1 mM oligonucleotide solution are kasso,10−4 = Aassoexp(−Easso/RT) and the concentration independent quadruplex dissociation rate kdisso = Adissoexp(−Edisso/RT). Easso and Edisso are the activation energies for strand association and quadruplex dissociation. Fi,42 is the reduced dissociation constant at 42°C. Tm is the quadruplex equilibrium melting temperature in 10−4 M oligonucleotide solution (see text). τdisso,Tm is the quadruplex dissociation time at the melting temperature.
rUG4U
The reaction order for (rUG4U)4 formation in 0.125 M NaCl is 3.4 at 42°C and 3.8 at 60°C (Figure 3).
Parallel formation of mismatched and canonical quadruplexes
In a number of cases, we observed that one or several multimers are formed more rapidly than the canonical duplex. The formation of such structures is favored at low temperature, in the presence of KCl and by the G-tract length of the oligonucleotide sequences (Scheme 1).
Scheme 1.

Influence of the temperature on the formation of (rUG4U)4 and (TGnT)4 quadruplexes in 0.125 M Li+ (green), Na+ (red) and K+ (blue). Canonical quadruplex formation prevails in the temperature ranges indicated by heavy full lines. Strand association results predominantly in kinetically trapped mismatched structures in the temperature ranges indicated by heavy dotted lines. The thin colored lines indicate the temperature ranges where no data are available. The formation of mismatched structure increases with the G tract length, at low temperature and in K+ solution.
A clear example is shown on the spectra recorded during the association kinetics of TG5T at 42°C in 0.125 KCl. In the early stage of the experiment, the spectra show the accumulation of a species, Qx, distinct of the canonical tetramer, Q (Figure 5). Size exclusion chromatography experiments performed on samples took off the NMR tube at different times during the association kinetics show that the Q and Qx species are eluted as a single peak with the elution time expected for a tetramer. The strand arrangement in the Qx tetramer could not be determined due to its limited lifetime and poor spectral resolution. Qx may be a quadruplex with one or several slipped strands or with anti-parallel strands.
Figure 5.

TG5T association kinetics at 42°C in 0.125 M KCl. The oligonucleotide concentration is 0.1 mM. Left panel: The imino proton region of spectra recorded at different times during TG5T association reveals the formation of two quadruplexes. The blue dots show the imino protons of the canonical quadruplex. The G imino protons of a non-identified quadruplex are labeled by red dots. This species, presumably a mismatched quadruplex, is less stable than the canonical species but its formation rate is faster. It is therefore kinetically trapped in the early stage of the association kinetics. Right panel: evolution of the (TG5T) monomer concentration (black), of the mismatched (red) and canonical (blue) quadruplexes. The full lines showing the evolution of each species are computed according to a model involving two parallel reactions [Equation (2)].
In 10−4 M TG5T solution, the haft association time of the monomeric species is ∼500 min. The Qx fraction is maximal (fqx = 0.25) after 1 day. Afterward, fqx decreases at a rate nearly independent of the oligonucleotide concentration. After 1 month, fqx is <0.1. The half formation time of the canonical quadruplex, Q, about 8000 min is also nearly independent of the strand concentration, suggesting that Q formation in controlled by Qx dissociation. Experiments performed versus the oligonucleotide concentrations show that the reaction order for Q and Qx formation is 3 as in the case of (TG3T)4 and (TG4T)4 at the same KCl concentration.
A model involving two parallel reactions accounts for the time evolution of each species in 10−4 to 10−3 TG5T solutions.
 |
2 |
The fits displayed in Figure 5 were computed with the formation rates kon1 = 1/160 min−1 for Qx and kon2 = 1/700 min−1 for Q and with the Qx dissociation rate kof1 = 1/870 min−1. The predominance of the canonical quadruplex at equilibrium is due to its extremely long lifetime: 1/kof2 ≥ 1 year. According to Equation (2), the Qx fraction decreases versus time with a rate constant k = kof1 kon2/(kon1 + kon2). It may be noted that subsequently to Qx dissociation, the back reaction towards Qx is faster than Q formation, i.e. kon1 > kon2. For this reason the Qx fraction decreases with a time constant, ∼4600 min−1, longer than the Qx lifetime (Figure 5). This is a typical example of kinetics trapping, a phenomenon observed in parallels equilibrium when the formation rate of the less stable reaction product (Qx in this example) is faster than that of the thermodynamically stable species (Q in this example).
The NMR spectra recorded during the association kinetics of TG4T in 0.125 M KCl at temperature lower than 20°C, of rUG4U in 0.125 M NaCl at temperature lower than 42°C and of TG6T in 0.125 M Li+, Na+ and KCl solutions suggest also the formation of species distinct of the canonical quadruplex (Scheme 1). In these experiments, the good resolution of the monomer markers allowed an accurate determination of the monomer half association times, but it was impossible to determine the formation rates of the multimers due to the poor spectral resolution.
In 0.125 M KCl, the half association time of TG4T in 10−4 M solution is 5 min at 0°C (Figure 4). The spectra recorded during several weeks, show extremely broad multimer peaks and suggest that the equilibrium is reached. Gel filtration chromatography of aliquots removed from the NMR tube indicates that the structure(s) formed is (are) tetrameric. Nevertheless, after incubation at 42°C during 1 day and slow cooling (about 1°/h) at 4°C, one observes a well-resolved spectrum that may be assigned to the canonical tetramer, by comparison with published NMR spectra (6,7). This indicates that TG4T association at 0°C forms mismatched tetrameric structures that are kinetically trapped during extremely long periods. Dissociation of these structures at 42°C allows the formation of the canonical tetramer during the slow cooling procedure. The slope change observed around 20°C on the plot of the half association time of TG4T versus temperature (Figure 4) is likely the consequence of the faster formation rate of mismatched structures.
The association kinetics of TG6T in 0.125 M NaCl at 42°C is about 100 times faster than that of TG4T, but the NMR spectra recorded during TG6T association show the formation of at least three species that are still present after incubation during 4 weeks. In that case again, gel filtration experiments show that the species formed are tetrameric. After heating at 100°C and slow cooling to room temperature (about 1°C/h), one observes a well-resolved spectrum indicating the formation of a single symmetrical quadruplex, presumably the canonical species. In 0.125 M KCl, the same annealing procedure increases the proportion of one of the quadruplexes formed.
The observations reported in this sub section show that association of TGnT oligonucleotides may result in the formation of mismatched quadruplexes that are kinetically trapped. The length of the G tract favors the formation of these structures. They are preferentially formed at low temperature in the presence of KCl (Scheme 1).
Proton shifts during TGnT association
The spectra collected as a function of the time during TG3T and TG4T association at 0°C show that several NMR peaks of the monomer exhibit systematic chemical shifts simultaneously with the reduction of the monomer concentration whereas the frequency of the quadruplex NMR peaks remains unchanged. The shift amplitude is modest. The largest, 0.015 p.p.m., is always that of the low field T CH3 peak (1.73 p.p.m. on the TG3T spectra displayed in Figure 1). The shift amplitude decreases when the temperature increases and becomes negligible above 20°C. The shifts measured in 0.125 M KCl and NaCl are comparable. Using experiments performed versus time to follow the formation kinetics of TG4T in 40 μM to 1 mM oligonucleotide solutions, we measured, on all the spectra recorded versus time, the monomer T CH3 frequency and the monomer concentration. The plot of the T CH3 frequency versus the monomer concentration shows that, independently of the oligonucleotide concentration, the spectra recorded with comparable free monomer concentrations are similarly shifted (Figure 6). This shows that the shifts are related to the monomer concentration and therefore this suggest that they result of a fast exchange equilibrium between the monomer and a short-lived intermediate species.
Figure 6.

Chemical shifts of the low field methyl protons of the TG4T monomer versus the TG4T free monomer concentration. The shifts and the monomer concentrations were measured on spectra collected at different times during the formation of (TG4T)4 in oligonucleotide solutions containing 4 × 10⁻⁵ (open squares), 1.3 × 10⁻⁴ (black circles), 2 × 10⁻⁴ (open circles), 5 × 10⁻⁴ (black squares), 7 × 10⁻⁴ (black triangles) and 10−3 M (open triangles). The chemical shift variation versus the monomer concentration suggests fast exchange between the monomer and an intermediate species, presumably (TG4T)2. The monomer TCH3 frequency is estimated to 1.831 p.p.m. The computed solid lines were obtained by assuming dimer TCH3 frequencies of 1.5 and 1.6 p.p.m. and dimer dissociation constants of 6 × 10⁻³ M and 2 × 10⁻³ M−1. Solution conditions: T = 0°C, [Na+] = 0.125 M.
Tetramer dissociation kinetics
Tetramer dissociation opposes a one-order dissociation reaction to a multi-order formation reaction. Hence, the measured dissociation time depends on the oligonucleotide concentration and on the association and dissociation rate constants when dissociation at equilibrium is not achieved. In order to determine the quadruplex lifetimes, the dissociation kinetics experiments were always performed using solutions diluted in such a way that the quadruplex equilibrium fraction was <0.1. On this condition, the evolution of the tetramer concentrations during dissociation was satisfactorily fitted by a mono exponential function with a time constant independent of the oligonucleotide concentration.
The quadruplex lifetimes depend strongly on the nature of the counter ion and on the G-tract length (Figure 7). At 60°C, the lifetime of (TG4T)4 in 0.125 M NaCl, 12 min, is comparable to that measured in LiCl solution, 8 min. It is much more longer in 0.125 M KCl, about 2 years, as shown by the extrapolation of the lifetimes measured between 72 and 100°C. The activations energies measured for tetramer dissociation in 0.125 M K+, Na+ and LiCl solutions are listed in Table 1. The comparison of the lifetimes of (TG4T)4 and (TG3T)4 in 0.125 M KCl or of (TG4T)4 and (TG5T)4 in 0.125 M NaCl shows that addition of one residue to the G tract increases the tetramer lifetime by 5 to 6 magnitude orders (Figure 7). The lifetime at 60°C of (rUG4U)4 is about 105 times longer than that of the homologous DNA tetramer and its activation energy, 297 ± 30 kJ/M, is much higher (Table 1).
Figure 7.

Quadruplex lifetimes versus temperature in 0.125 M KCl (blue), NaCl (red) or LiCl (green). Left panel: (TG4T)4 (circles) and (TG3T)4 (squares) lifetimes. Central panel: (TG5T)4 (triangles) and (TG4T)4 (circles) lifetimes. Right panel: (TG4T)4 lifetime.
We also examined the effect of the NaCl concentration on the dissociation kinetics of (TG4T)4 and the effect of KCl on (TG3T)4 and (TG4T)4 dissociation. In agreement with previous observations (12), we observe that the lifetime of (TG4T)4 measured at 58°C in NaCl solutions ranging from 5 to 500 mM is independent of the NaCl concentration. By contrast, in KCl solution the lifetimes of (TG3T)4 (measured at 28°C) and of (TG4T)4 (measured at 86°C) decrease as the KCl concentration. Nevertheless, the quadruplex lifetimes measured at the lowest KCl concentration examined, 2 mM, are several magnitude orders longer than those measured in NaCl solution.
Tetramer stability
The reduced dissociation constants, Fi, displayed in Figures 4 and S1 were obtained from the free and bound strand concentrations measured on the last spectra recorded during the kinetics measurements. Table 1 shows that addition of one residue to the G tract decreases Fi by about 3 magnitude orders in NaCl as in KCl solution.
Fi measurements yield redundant information that may be independently computed from the dissociation and association rates. The comparison of the Fi values measured at equilibrium with those derived from the kinetics parameters provides a rigorous control of the coherence of the kinetics and equilibrium measurements. The G-quadruplex melting temperature, Tm,M0, in an oligonucleotide solution of concentration [M0] is the temperature for which the half association time, τasso,M0 is equal to the concentration independent dissociation half lifetime, τdisso. Furthermore, according to the Fi definition, the G-quadruplex reduced dissociation constant at the melting temperature is Fi = [M0]/2.
The quadruplex melting temperatures in 10−4 M oligonucleotide solution, Tm,10− 4, are determined in the upper panels of Figures 4 and S1 by the interception of the plots of  and τdisso versus temperature. The lower panels of Figures 4 and S1 show that the Fi values at temperature Tm,10−4 are close to 10−4/2 and thus establishes the consistency of the equilibrium and kinetic measurements.
DISCUSSION
The slow association and dissociation kinetics of the G-quadruplexes has been noticed since the very beginning of their discovery and repeatedly discussed and analyzed since that time (9–15). In fact, one should not be surprised by the slow formation rates of these structures. It is hardly conceivable that association of four dilute strands via a process involving unstable intermediate species into a structure requiring correct strand orientation and alignment could be fast. More surprising are the extraordinarily long tetramer lifetimes that extrapolate to million of years at 0°C as in the case of TG4T in KCl solution (Figure 7) and the huge activation energies for tetramer dissociation (Table 1) indicating that a quasi-insurmountable energetic barrier must be overcome to dissociate the quadruplex.
The association kinetics of TG5T in KCl shows how the fast formation rate of a mismatched species and its relatively long lifetime can make practically inaccessible the thermodynamically stable canonical quadruplex. With the exception of TG3T, this process seems to be the general rule between 0 and 20°C in KCl solution. The characterization of the structure(s) formed by strand association is for this reason essential to the interpretation of the G-tetramer formation kinetics.
The association process of TGnT oligonucleotides into canonical quadruplex
We determined for each oligonucleotide of the TGnT series the experimental conditions (salt concentration, temperature) leading to the formation of the canonical tetramer (Scheme 1). The model discussed in this section relies on the parameters (formation and dissociation time constants, reduced dissociation constants and reaction orders) obtained from these experiments.
The reaction order is the key parameter to determine a reaction pathway. In summary, we find that the order for quadruplex formation depends on the nature of the counter ion. In 0.125 KCl, the formation order is always 3 and it is always 4 in LiCl solution. It depends on the monovalent ion concentration and temperature. In NaCl solution, the order is 3, or close to 3, in conditions favorable to multimer stability (i.e. low temperature and high salt concentration). It is close to four at low NaCl (Figure 3) or KCl concentrations (Figures 3 and S3). The reaction order depends also on the G-tract length, as shown by the comparison of the reaction orders measured for (TG4T)4 (order 3.5) and (TG5T)4 (order 3) (Figure. 3).
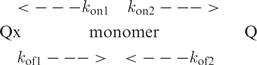
Two models accounting for quadruplex formation can be considered (19). The model initially proposed by Wyatt et al. (9) involves two steps: fast pre-equilibrium between monomer (M) and dimer (D) and duplex association into a quadruplex structure (Q).
 |
Where, kon and kof are the association and dissociation rates at each step. According to this model, the reaction order expected for Q formation is four if both steps are limiting. If duplex association into quadruplex is much faster that duplex dissociation, step 2 should be non limiting, resulting in a reaction order of two. But this scheme is by no way compatible with the association order of 3 measured for tetramer formation in KCl solution.
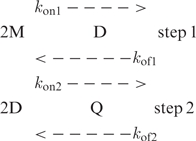
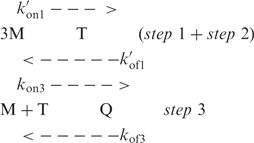
The second model involves step-by-step strand association into duplex, triplex (T) and quadruplex structures.
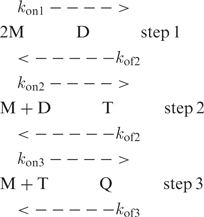 |
According to this scheme, the reaction order for Q formation is four if the reactants are in rapid pre-equilibrium at every step but it may be smaller if one step is non-limiting. Step 1 is obviously in rapid pre-equilibrium, otherwise accumulation of the D species should be observed and the reaction order should be ≤2. If step 2 is non-limiting, accumulation of the triplex species during the early stage of the kinetics should result in the apparition of new NMR peaks. From the absence of evidence in favor of this assumption we conclude that only step 3 may be non-limiting. The model proposed for G-quartet formation rely on the assumption that step 3 is non limiting in the experimental condition for which the reaction order is 3, i.e. (TG4T)4 formation in 0.125 M KCl, and limiting when the reaction order is four, i.e. (TG4T)4 formation in LiCl solution.
The quadruplex formation rate across step 3 may be expressed by:
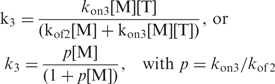 |
3 |
This expression shows immediately that step 3 is not limiting when M association to T is faster than T dissociation, i.e. when p[M] > 1. On the contrary, when p[M] < 1, the quadruplex formation rate across step3, k3 = p[M], should depend on the strand concentration thus resulting in reaction orders one unit larger. The model implies that the kon3/kof2 ratio is smaller in LiCl solution that in 0.125 M KCl solution. We have no argument to justify a large difference of the rates kon3 in K+ and Li+ solutions at the same concentration. On the contrary, the triplex lifetime, 1/kof2, may depend on the nature of the monovalent cation. Figure 7 shows that the lifetime of (TG4T)4 is 3 to 6 magnitude orders longer in K+ than in Li+ solution. It is obviously expected that the triplex lifetime is much more shorter than that of the quadruplex, but if it is similarly increased by K+ this could explain that step 3 is non-limiting and that the order for G-quadruplex formation is 3 in 0.125 M KCl solution.
In NaCl solution, the reaction order measured is close to 3 in conditions favorable to the stability of multimeric nucleic acid structures i.e. high NaCl concentration and low temperature. It is may be assumed that in these conditions, p[M] ≥ 1 (condition for reaction order 3) due to fast quadruplex formation and/or slow triplex dissociation. At low NaCl concentration, slower quadruplex formation and/or faster triplex dissociation resulting in reaction order close to 4 when p[M] ≤ 1. The observation that the formation order of (TG4T)4 is 3 in 0.125 M KCl and 4 in 5 mM KCl (Figure S3) may be similarly explained. At last, the difference observed in 0.125 M NaCl (Figure 3) between the formation orders of (TG4T)4 (order 3.5) and (TG5)4 (order 3) may reflect a longer lifetime of the intermediate triplex structure of TG5T.
The methyl shifts observed versus the free monomer concentration at 0°C (Figure 6) might be the consequence of the fast monomer-duplex pre-equilibrium at step 1. According to this assumption the methyl shift, δ, should depend on the monomer and dimer frequencies, δ1 and δ2 respectively, and on fdi the dimer fraction: δ = (1 − fdi)δ1 + (fdi)δ2. Here, fdi and the dimer dissociation constant, Kd = (1 − fdi))/([monomer] fdi)2, may be estimated from the plot of δ versus [monomer] if one knows δ1 and δ2. δ1 may be estimated to 1.831 p.p.m. from methyl frequency at the lowest monomer concentrations. The determination of δ2 requires shift measurements at high monomer concentrations that are impracticable due to fast tetramer formation (Figure 2, right panel). To estimate the range of the Kd values accounting for the measured shifts we tried different pairs of values for the δ2 and Kd parameters. The fits displayed on Figure 6 were obtained with δ2 = 1.6 and 1.5 p.p.m. and dimer dissociation constants Kd = 2 × 10⁻³ and 6 × 10⁻³ M−1.
Kinetic simulations performed, as described in Supplementary Data, by numerical integration are displayed in Figures 8 and S4.
Figure 8.

Simulation of the evolution of the monomeric TG4T fraction during (TG4T)4 formation and of the half association time TG4T in 0.125 M NaCl at 0°C. Left panel: the computed monomer fractions (red lines) are compared to the values measured in 10−4 (open circles) and 10−5 M (filled circles) TG4T solutions. The error bars were estimated by using different markers to measure the monomer fractions. Right panel: the half association lifetimes measured versus the oligonucleotide concentration (black squares) are compared to the computed values (red squares). The simulations were performed by numerical integration using the following parameters: 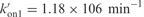 , kof3 = 5.35 × 10⁻⁸ min−1 (corresponding to quadruplex lifetime of 35.6 years estimated by extrapolation at 0°C of the lifetimes displayed in Figure 7. kon3 = 105. The
  ratio accounting for the observed 3.2 reaction order is 10−5. The computed monomer equilibrium fractions correspond to a reduced dissociation constant, Fi = 6.2 × 10⁻⁷, in agreement with the measured value (Figure 4).
Considering that the monomer and duplex are in fast pre-equilibrium, we can write:
 |
The kinetics experiments provide three independent parameters: τasso, τdisso and the reaction order. It is therefore impossible to determine the four rates of (step 1+step 2) and step3. The rate constant kof3 was identified with the inverse of the quadruplex lifetime (Figure 4 and Table 1) and  was varied to obtain a good agreement with the monomer and quadruplex fractions measured as a function of the time. kon3 and
  cannot be independently determined. Simulations performed with kon3 values smaller than 104 min−1 show accumulation of trimer fractions inconsistent with the experiments. kon3 was arbitrarily estimated to 105 min−1. The
  ratio was adjusted to account for the measured reaction order. Simulations performed with kon3 value larger than 105 min−1 displayed the same results when the
  rate was proportionally increased. Simulations of the evolution of the TG4T fraction during (TG4T)4 formation in NaCl at 0°C and in KCl at 72°C are displayed in Figures 8 and S4, respectively.
The interpretation of the G-quadruplex formation pathway requires duplex and triplex nucleation centers (D and T) but direct detection and structural investigation of these species are hopeless due to their extremely weak proportion. Molecular Dynamics (MD) calculation including Na+ ions performed to investigate the stability of duplex and triplex intermediate species show that the assembly of 2 or 3 dGGGG strands initially aligned as in the (dGGGG)4 canonical quadruplex is unstable and results in ‘cross like’ d(GGGG)2 and (dGGGG)3 structures that resist to several ns MD simulation (19).
Role of the monovalent ion concentration and temperature on the quadruplex formation rates
In addition to the surface ions that neutralize the backbone phosphorus, n − 1 monovalent ions located in the central cavity connect together the successive G quartets of (TGnT)4 quadruplexes (4,20). These monovalent cations have a crucial importance on the quadruplex stability. It seems clear that the preferred potassium coordination in the channel cavity with respect to the other monovalent cations is not directly related to the ions radius but to the lowest dehydration cost of the potassium ion (21,22).
In summary, we find, in agreement with previous investigations (12), that the (TGnT)4 half formation times increase with temperature and when the salt concentration decreases. First, it must be noted that the lifetime of the monovalent cations bound in the G-quartet cavity is extremely short by comparison with the time required for strand association. As shown by Hud et al. (21) the cations bound in the cavity of (G4T4G4)2 exchange with the bulk solvent cations at a rate faster than 10−3 s. In line with this result, we observed that addition of 0.1 M KCl to (TG4T)4 in 10 mM NaCl solution results within 3 min in spectral changes reflecting K+ binding. This clearly establishes that the monovalent cation-binding rate is not a limiting step of the G-quadruplex association pathway. Considering the electrostatic cost of bringing close together negatively charged strands into a multimeric species, it is predictable that the D and T formation rates are slower at low salt concentration. It is also likely that the lifetimes of the D and T intermediates are shorter at high temperature. Hence, high temperature and low salt concentration should reduce the D and T fractions thus resulting in slower quadruplex formation rates. The reduced amplitude at high temperature of the shifts assigned to fast equilibrium exchange between M and D is consistent with this interpretation.
One observes that the formation rates at 60°C of the canonical quadruplexes of (TG4T)4, (TG5T)4 and (rUG4U)4 are comparable within a factor smaller than 10. By contrast, at 0°C in 0.125 M NaCl, the association rates of TG5T and UG4U are about 104 times larger than that of TG4T (Figures 4 and S1). Fast strand association is systematically observed in the experimental conditions leading to formation of mismatched species. This indicates that the fast strand association rates observed for TG5T and UG4U at low temperature reflect the faster formation of mismatched structures. The formation of mismatched quadruplexes occurs possibly also in the case of TG3T in KCl and of TG4T NaCl solution, but due to their shorter lifetime they dissociate rapidly, living unchanged the monomer concentration which vary in that case simultaneously with the canonical quadruplex concentration.
Comparison with previous experimental studies
G-rich strand association into quadruplex structures was until now described by a two-step model: fast equilibrium between monomer and an unstable duplex species followed by duplex association. This model was initially proposed on the basis of the formation-dissociation kinetics of TTG4TT in a buffer containing 137 mM NaCl and 2.7 mM KCl measured by size exclusion chromatography (9). The results of a recent UV study were considered in good agreement with this model (12).
We show in the present study that this model cannot account for the reaction orders determined in the NMR experiments. Qualitatively, there is no marked difference in the monomer association rates and quadruplex dissociation rates determined by UV, chromatography and NMR. The interpretation of the NMR study diverges from that provided by previous studies: (i) about the evaluation of the quadruplex equilibrium constants; (ii) about the interpretation of the fast association rates reported for some oligonucleotides (TG5T, rUG4U, TG6T).
The evaluation of the monomer concentration at equilibrium is not directly accessible to UV measurements. Considering the extremely slow quadruplex dissociation kinetics, it was assumed in the UV study that G-quadruplex formation is ‘kinetically irreversible’ and that the monomer concentration at equilibrium is negligible. Implicitly, the same assumption was done in the chromatography study (9). Accordingly, the reaction order for tetramer formation was derived from the fit of the evolution of the monomer fraction versus time using a model supposing a non-reversible reaction. The reaction order estimated in the chromatography study was 3.8 ± 0.5. In the UV study, the reaction orders were found in the range of 3.4–4.1, in 0.1 M KCl or NaCl solutions.
In the model proposed in the present article, the reaction order for G-quadruplex formation may depend on the monomer concentration [Equation (3)]. The differences in the reaction orders could therefore reflect the difference of oligonucleotide concentration used in the experiments performed by each method. This does not seem the case if one considers that the range of oligonucleotide concentrations examined in the NMR (10–5000 μM), chromatography (100–500 μM) and UV experiments (5–500 μM) are comparable.
Considering the reduced dissociation constants derived from the NMR experiments, it is clear that the free strand concentration at equilibrium cannot be neglected. It follows that the fitting procedure used in the previous studies cannot yield a correct determination of the reaction order. In addition, we consider from our experience, that the fit of the reactant proportion as a function of the time is weakly sensitive to the value of the reaction order. For this reason, we systematically determined the reaction orders by measuring the half reaction times as a function of the oligonucleotide concentration (Figures 2 and S3). This method requires more experiments but it yields a more reliable determination of the reaction order.
The kinetics studies followed by UV detect essentially the evolution versus time of the monomer fraction. The absorbance change related to strand association is nearly insensitive to the nature of the multimer formed. The fast association rates measured by NMR at low temperature for rUG4U and TG6T are comparable to those reported in the UV study, but the NMR spectra shows consistently that fast association kinetics of these oligonucleotides do not lead to formation of the canonical quadruplexes but to non-identified mismatched tetrameric species kinetically trapped.
G-quadruplex stability and melting temperature
The slow association and dissociation rates of tetramolecular G-quadruplexes result in marked hysteresis of the UV melting-renaturation profiles making impracticable direct evaluation of the equilibrium melting temperatures (9,12).
The quadruplex equilibrium melting temperatures in 10−4 M oligonucleotide solutions may be determined by two different ways from Figures 4 and S1. As explained above, Tm in a 10−4 M solution is the temperature for which τasso,10−4 and τdisso are identical. Tm is also the temperature for which Fi = 10−4/2. The average Tm values and the difference of the values obtained by each method are listed in Table 1. The equilibrium melting temperatures are at least 20°C lower than the ‘non-equilibrium’ melting temperatures derived from melting experiments performed with a 0.18°C/min gradient (12). This difference is not surprising if one consider the G-quadruplex lifetimes at the melting temperature (2 days to 112 days, Table 1). It is noteworthy that the Tm computed for (TG4T)4 in NaCl solution, 32 ± 5°C, is consistent with the value, Tm ≈ 30°C, predicted by extrapolation of non-equilibrium melting temperature at infinitely slow temperature gradient (9).
CONCLUSION
The NMR study of the formation of G-quadruplex shows that association of TGnT strands can form multiple tetrameric assemblies. The fully matched canonical quadruplexes are certainly the most stable structures, nevertheless, the faster formation rate of mismatched species and their relatively long lifetimes results in kinetics trapping that may hinder formation of the thermodynamically stable structure during extraordinary long periods.
We have determined the experimental conditions in which the formation of such structures is negligible. The parameters derived from the association–dissociation measurements performed in these conditions show that the canonical quadruplexes are formed via a stepwise pathway involving fast monomer/duplex equilibrium and a triplex intermediate. Triplex formation is limiting in 0.125 M KCl solution, due most probably to triplex stabilization by K+. The formation rates of the canonical quadruplexes depend weakly on the nature of the ion and on the G-tract length. On the contrary, the canonical quadruplex lifetimes in K+ solution are 106 times longer than in Na+ or Li+ solutions and the addition of one G residue in the G-tract increase the lifetime by 4 magnitude orders.
SUPPLEMENTARY DATA
Supplementary Data are available at NAR Online.
ACKNOWLEDGEMENTS
Funding to pay the Open Access publication charges for this article was provided by CNRS.
Conflict of interest statement. None declared.
REFERENCES
- 1.Gehring K, Leroy J.-L, Guéron M. A tetrameric DNA structure with protonated cytidine-cytidine base pairs. Nature. 1993;363:561–565. doi: 10.1038/363561a0. [DOI] [PubMed] [Google Scholar]
- 2.Neidle S, Parkinson GN. The structure of telomeric DNA. Curr. Opin. Struct. Biol. 2003;13:275–283. doi: 10.1016/s0959-440x(03)00072-1. [DOI] [PubMed] [Google Scholar]
- 3.Burge S, Parkinson GN, Hazel P, Todd AK, Neidle S. Quadruplex DNA: sequence, topology and structure. Nucleic Acids Res. 2006;34:5402–5415. doi: 10.1093/nar/gkl655. [DOI] [PMC free article] [PubMed] [Google Scholar]
- 4.Davis JT. G-quartets 40 years later: from 5′-GMP to molecular biology and supramolecular chemistry. Angew. Chem. Int. Ed. Engl. 2004;43:668–698. doi: 10.1002/anie.200300589. [DOI] [PubMed] [Google Scholar]
- 5.Patel D, Bouaziz S, Kettani A, Wang Y. Structures of guanine-rich and cytosine rich quadruplexes formed by in vitro by telomeric, centromeric and triplets repeats desease DNA sequences. In: Neidel S, editor. Oxford Handbook of Nucleic Acid Structure. USA: Oxford University Press; 1999. pp. 390–452. [Google Scholar]
- 6.Aboul-ela F, Murchie AI, Lilley DM. NMR study of parallel-stranded formation by the hexadeoxynucleotide d(TG4T) Nature. 1992;360:280–282. doi: 10.1038/360280a0. [DOI] [PubMed] [Google Scholar]
- 7.Aboul-ela F, Murchie AI, Norman DG, Lilley DM. Solution structure of a parallel-stranded tetraplex formed by d(TG4T) in the presence of sodium ions by nuclear magnetic resonance spectroscopy. J. Mol. Biol. 1994;243:458–471. doi: 10.1006/jmbi.1994.1672. [DOI] [PubMed] [Google Scholar]
- 8.Jin R, Gaffney BL, Wang C, Jones RA, Breslauer,K.J. Thermodynamics and structure of a DNA tetraplex: a spectroscopic and calorimetric study of the tetramolecular complexes of d(TG3T) and d(TG3T2G3T) Proc. Natl Acad. Sci. USA. 1992;89:8832–8836. doi: 10.1073/pnas.89.18.8832. [DOI] [PMC free article] [PubMed] [Google Scholar]
- 9.Wyatt JR, Davis PW, Freier SM. Kinetics of G-quartet-mediated tetramer formation. Biochemistry. 1996;35:8002–8008. doi: 10.1021/bi960124h. [DOI] [PubMed] [Google Scholar]
- 10.Li W, Miyoshi D, Nakano,S., Sugimoto N. Structural competition involving G-quadruplex DNA and its complement. Biochemistry. 2003;42:11736–11744. doi: 10.1021/bi034168j. [DOI] [PubMed] [Google Scholar]
- 11.Merkina EE, Fox KR. Kinetic stability of intermolecular DNA quadruplexes. Biophys. J. 2005;89:365–373. doi: 10.1529/biophysj.105.061259. [DOI] [PMC free article] [PubMed] [Google Scholar]
- 12.Mergny JL, De Cian A, Ghelab A, Saccà B, Lacroix L. Kinetics of tetramolecular quadruplexes. Nucleic Acids Res. 2005;33:81–94. doi: 10.1093/nar/gki148. [DOI] [PMC free article] [PubMed] [Google Scholar]
- 13.Saccà B, Lacroix L, Mergny JL. The effect of chemical modifications on the thermal stability of different G-quadruplexes-forming oligonucleotides. Nucleic Acids Res. 2005;33:1182–1192. doi: 10.1093/nar/gki257. [DOI] [PMC free article] [PubMed] [Google Scholar]
- 14.Gros J, Rosu F, Amrane S, De Cian A, Gabelica V, Lacroix,L., Mergny J.-L. Guanines are a quartet's best friend: impact of base substitutions on the kinetics and stability of tetramolecular quadruplexes. Nucleic Acids Res. 2007;35:3064–3075. doi: 10.1093/nar/gkm111. [DOI] [PMC free article] [PubMed] [Google Scholar]
- 15.Hardin CC, Perry AG, White K. Thermodynamic and kinetic characterization of the dissociation and assembly of quadruplex nucleic acids. Biopolymers. 2001;56:147–194. doi: 10.1002/1097-0282(2000/2001)56:3<147::AID-BIP10011>3.0.CO;2-N. [DOI] [PubMed] [Google Scholar]
- 16.Leroy J.-L, Guéron M. Solution structure of the i-motif tetramers of d(TCC), d(5methylCCT) and d(T5methylCC): novel NOE connection between amino protons and sugar protons. Structure. 1995;3:101–120. doi: 10.1016/s0969-2126(01)00138-1. [DOI] [PubMed] [Google Scholar]
- 17.Canalia M, Leroy J.-L. Structure, internal motions and association-dissociation kinetics of the i-motif dimer of d(5mCCTCACTCC) Nucleic Acids Res. 2005;33:5471–5481. doi: 10.1093/nar/gki843. [DOI] [PMC free article] [PubMed] [Google Scholar]
- 18.Plateau P, Guéron M. Solvent signal suppression in NMR. J. Am. Chem. Soc. 1982;104:7310–7311. [Google Scholar]
- 19.Stefl R, Cheatham TE, Spackova N, Fadrna E, Berger I, Koca J, Sponer J. Formation pathways of a guanine-quadruplex DNA revealed by molecular dynamics and thermodynamic analysis of the substates. Biophys. J. 2003;85:1787–1804. doi: 10.1016/S0006-3495(03)74608-6. [DOI] [PMC free article] [PubMed] [Google Scholar]
- 20.Phillips K, Dauter Z, Murchie AI, Lilley DM, Luisi B. The crystal structure of a parallel-stranded guanine tetraplex at 0.95Å resolution. J. Mol. Biol. 1997;273:171–182. doi: 10.1006/jmbi.1997.1292. [DOI] [PubMed] [Google Scholar]
- 21.Hud NV, Smith FW, Anet FA, Feigon J. The selectivity for K+ versus Na+ in DNA quadruplexes is dominated by relative free energies of hydration: a thermodynamic analysis by 1H NMR. Biochemistry. 1996;35:15383–15390. doi: 10.1021/bi9620565. [DOI] [PubMed] [Google Scholar]
- 22.Wong A, Wu G. Selective binding of monovalent cations to the stacking G-quartet structure formed by guanosine 5′-monophosphate: a solid-state NMR study. J. Am. Chem. Soc. 2003;125:13895–13905. doi: 10.1021/ja0302174. [DOI] [PubMed] [Google Scholar]
Associated Data
This section collects any data citations, data availability statements, or supplementary materials included in this article.