


Abstract
DNA-binding drugs have numerous applications in the engineered gene regulation. However, the drug-DNA recognition mechanism is poorly understood. Drugs can recognize specific DNA sequences not only through direct contacts but also indirectly through sequence-dependent conformation, in a similar manner to the indirect readout mechanism in protein-DNA recognition. We used a knowledge-based technique that takes advantage of known DNA structures to evaluate the conformational energies. We built a dataset of non-redundant free B-DNA crystal structures to calculate the distributions of adjacent base-step and base-pair conformations, and estimated the effective harmonic potentials of mean force (PMF). These PMFs were used to calculate the conformational energy of drug-DNA complexes, and the Z-score as a measure of the binding specificity. Comparing the Z-scores for drug-DNA complexes with those for free DNA structures with the same sequence, we observed that in several cases the Z-scores became more negative upon drug binding. Furthermore, the specificity is position-dependent within the drug-bound region of DNA. These results suggest that DNA conformation plays an important role in the drug-DNA recognition. The presented method provides a tool for the analysis of drug-DNA recognition and can facilitate the development of drugs for targeting a specific DNA sequence.
INTRODUCTION
The control of the gene expression by DNA-binding drugs is of great interest in molecular biology and medicine since the capability of some drugs to switch on or off the gene expression can help in the treatments of genetic diseases, infections by antibiotic-resistant bacteria, or cancer (1–3).
The drug discovery process requires large collections of molecules, which are initially tested with high throughput screening (4,5). Therefore, it is interesting to provide methods that eliminate as early as possible the poor drug candidates. This screening includes approaches such as ADMET (absorption, distribution, metabolism, excretion and toxicity) (6). Tools, such as the Lipinski rule of five (7), help to filter non-oral bioavailable drug candidates. However, additional tools are needed to predict the drug specificity accurately, which motivated the present study.
Whereas the first golden era of cancer drug development was marked by the discovery of the therapeutic activity of the first DNA alkylating agent (8), the second golden era aims to provide targeted therapies designed specifically to tackle the molecular abnormalities responsible for cancer (9). In this sense it is important to provide tools that estimate the DNA sequence-dependent specificity of the DNA binding drugs. For example, if a drug binds in an indiscriminate way to many DNA sequences, this could have a fatal consequence since it can modify the expression of vital gene products. The sequence-dependent specificity plays a key role in the search of ‘the right medicine to the right patient’ of the individualized medicine with pharmacogenomics (10,11). The specificity of the drug-DNA binding is a key point in the drug design since many compounds obtained by structure-based drug design show inappropriate ADMET properties (12). Finally, the X-ray analysis of the drug-DNA crystal structures does not provide quantitative estimates of the relative importance of the molecular contacts or of the relative contributions of specific and non-specific interactions to the total affinity of specific DNA binding (13,14). Therefore, it would be interesting to provide a tool, as the one proposed here, for quantifying the binding specificity.
The mechanisms of drug binding to proteins and to DNA may share some similarities, along with some differences. Traditionally, drug-protein binding is explained by either the Fischer's ‘lock and key’ principle (15) or the Koshland's ‘induced fit’ model (16). The extrapolation of such models to drug-DNA complexes is not straightforward since the DNA has no formal active sites, unlike the enzymes (17). More recently, dynamic models, such as the ‘pre-existing equilibrium/conformational selection’ model, have been proposed to explain the conformational changes involved in signal transmission between protein functional sites (18) and between protein-drug complexes. While in the induced fit mechanism, the ligand is proposed to induce a conformational change by interaction, the preexisting equilibrium hypothesis postulates that the native state of a protein is defined by an ensemble of closely related conformations that coexist at equilibrium, and that the ligand binds selectively to an active conformation (18). In this sense, our studies on molecular dynamics of DNA structures (19) have shown that the DNA structures fluctuate around some equilibrium points, and some of these points could be in favor of conformations that facilitate ligand binding (of drugs or proteins).
For the analysis of the drug-DNA binding specificity, we also use an analogy with the direct and indirect readout mechanisms in protein-DNA recognition (20). The regulatory proteins recognize specific DNA sequences mainly by the way of direct readout through base-amino acid contact, and indirect readout through DNA conformation and flexibility. In the direct readout, the free energy of the intermolecular interaction between bases and amino acids determines the stability and specificity of the protein-DNA complex. In the indirect readout, the change in the intramolecular conformational energy of DNA upon complex formation determines the sequence specificity. Similar to proteins, a drug may use direct and indirect readout to recognize a specific sequence. We concentrate our study on the indirect readout mechanism in drug-DNA recognition through sequence-dependent DNA conformation. A number of drugs have already been designed to bind specific short DNA sequences (Table 2 in Supplementary Data).
The analysis of sequence-dependent conformational energy of DNA can provide helpful hints in the design of DNA-binding drugs that modify the DNA conformational state. According to the common practice in DNA structural analysis (21,22), we approximate the DNA molecule as an elastic object with several degrees of freedom between adjacent rigid bases. We define the base step as a group of two consecutive base pairs in a double-stranded helical DNA structure. The local conformation of the DNA is identified at each location of a base-pair (from complementary strands) in terms of known deformations. The base-step conformations describe the stacking geometry of a dinucleotide step from a local perspective (21–23) (see Figure 5 in Supplementary Data). Each of these degrees of freedom is characterized by a degree of flexibility. The observed deformations, compared with an average structure, are related to the conformational energy. We adopt a knowledge-based method using the analysis of known free DNA structures to derive statistical potentials of the DNA conformational energy.
The total conformational energy of DNA can be approximated with a weighted summation of all the base-pair and base-step energies. Olson et al. (24) used a harmonic function to calculate the conformational energy along each base-step conformational parameter. We obtained the force constants from covariance matrices between the 12 conformational parameters generalizing the method of Olson et al. (24) for the 6 base-step conformational parameters from a dataset of free B-DNA crystal structures, and quantified the specificity of the indirect readout by using a sequence-structure threading method (20). During the sequence-structure threading, the original sequence in the DNA structure was replaced by random sequences to calculate a Z-score, i.e. the energy with respect to the mean, normalized by the standard deviation, as a specificity measure. We used free B-DNA crystal structures with the same DNA sequence as known drug-DNA complexes to calculate the Z-score as a reference. This enabled us to evaluate the specificity of drug-DNA complex in comparison with the corresponding free DNA structure.
MATERIALS AND METHODS
Data selection
The drug-DNA complex crystal structures were taken from the annotated list of the Nucleic Acid Database (NDB http://ndbserver.rutgers.edu) (25) (Table 3 in Supplementary Data). The annotated lists with the information about the type of the drug (intercalator or groove binders) are also from the NDB. The binding mode was automatically detected by the method introduced below. To build a reference set of experimental free B-DNA crystal structures, we used the corresponding annotated list from NDB (Table 4 in Supplementary Data).
For each file in each list, we chose the first biological unit structure and downloaded its file from the Biological Units repository of Protein Data Bank (PDB) (http://www.rcsb.org/pdb/) (26). The 3DNA software (23) was used to obtain the base-pair and base-step conformational parameters. For potential of mean force (PMF) calculation, we built a dataset of non-redundant free B-DNA crystal structures, clustering the DNA sequences and selecting the structure with the best resolution for the clusters with more than one structure of the same sequence. The dataset was pre-filtered by applying the following criteria (27). Eliminate the non-B-DNA base steps (these were discriminated using the projection of the phosphorus atom onto the z-axis of the dimer middle frame (23,28)); delete anomalous configuration with outlier values in their conformational coordinates to eliminate kinks and other defective structural states; eliminate the non-standard bases (bases different from A, C, G, T). For the calculation of PMF, we took only a half of the symmetric structure in repeated and palindromic sequences; eliminate the 5′ and 3′ DNA terminals to reduce the boundary effects; and delete the base steps that are not in blocks of 3 consecutive steps, to consider local DNA regions without intercalated distortions.
Automatic classification of drug-DNA binding modes
To facilitate the DNA-drug binding analysis, we automated the classification of the binding modes with a function of the contacts of the drug with different regions of DNA. We consider that there exists a contact between a drug atom and a DNA atom when the inter-atomic distance is <3.5 Å. We classified the DNA atoms into four local regions (minor groove, major groove, backbone and rest), as shown in Figure 1. The binding mode is defined as the argument that maximizes the function:
| (1) |
where #cov is the total number of covalent links in the DNA-drug complex (obtained as the number of links with the heteroatoms (HETATM) and atoms in the CONECT field of the PDB file), and #min, #maj and #int are the total numbers of drug contacts with the minor groove, major groove and intercalator atoms. The number of contacts with intercalator atoms, #int, is defined as #min + #maj + #res, where #res is the total number of contacts with the rest of the atoms not belonging to any of the DNA local regions defined in Figure 1. The numbers in the denominators of Equation (1) are normalization factors that account for the number of atoms of each local region in every DNA base pair. The additional intercalator factor 1.5 used in the normalization of the total number of intercalation contacts accounts for the fact that the intercalating drugs can make contacts with the two consecutive base pairs between which they insert themselves. In a simple approximation of uniform rise values for all base steps, the normalization factor for the intercalator atoms should be two since a drug atom can make contacts with the lower and the upper bases of the interstep space. However, the drug atoms do not always make contacts with the two base pairs that circumvent them. Thus, the value 1.5 for the intercalator was adjusted empirically.
Figure 1.

Classification of the non-hydrogen atoms of the four DNA standard bases according to the type of contacts in DNA-drug complexes. The atoms involved in minor groove contacts are represented in red, the atoms involved in major groove contacts in blue, the atoms involved in backbone contacts in black and the rest of the atoms in green. The contact-influencing region of each atom is shown with equispaced concentric circles with radii ranging from 1 Å to 3.5 Å.
Derivations of conformational energies and Z-scores
In contrast to our previous approach for the case of free DNA structures (19), we calculated the energy taking into account not only the base-step conformational state but also the base-pair conformation. The conformational energies of each central dinucleotide are estimated by approximating the energy of the fluctuations of each type s of 10 unique base steps (see bottom Figure 5 in Supplementary Data), with a harmonic function as in Olson et al. (24).
| (2) |
where  is the minimum energy and the
  elastic constants impeding the deformations of the given dinucleotide d base step of type s. The 6-dimensional PMF Fs for each type s can be calculated based on the quasi-inverse-harmonic analysis from the covariance matrix of conformational fluctuations (24). For more detailed description, see Supplementary Data.
Setting arbitrarily the minimum value energies equal to 0, the total base-step energy of the structure is  , where LD is the number of dinucleotide pairs. Whereas the building blocks to calculate the base-step conformational energy are dinucleotides, for the base pairs they are mononucleotides. For the base-pair conformational coordinates p of each mononucleotide m (see top Figure 5 in Supplementary Data), we apply also Equation (2), substituting the base-step coordinates of each dinucleotide s(d) by the base-pair coordinates of each mononucleotide p(m). The base-pair PMF Fp can be calculated from the covariance matrix similarly. We denote the total base-pair energy of the structure as
  , where LM is the number of mononucleotide pairs (the sequence length).
Once the base-pair and base-step energies are calculated, we combine them to calculate the total energy. However, the statistical potentials derived from different kinds of datasets cannot be simply added to create the total potential because the derivation of these empirical energies is based on different statistics (total number of data, average and standard deviation). Thus, the energy scales may be different and a simple summation is not allowed. Instead, we must combine their potentials with a weighting factor c. Thus, we define the total conformational energy E of the structure as the weighted sum of base-step Es and base-pair Ep conformational energies:
| (3) |
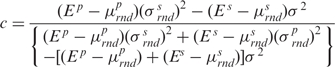
where the weighting coefficient c ranges between 0 and 1. This coefficient is determined by maximizing the magnitude of total Z-score, i.e. in the sequence-structure threading method, the Z-score is calculated from random sequences rnd, and a value of c is sought that produces the highest total Z-score. The value of c that fulfils that requirement is determined by the following equation:
 |
(4) |
where  are the average and the standard deviation of the base-pair energies,
  and
and  are the average and the standard deviation of the base-step energies, and σ2 is the covariance of base-pair and base-step energies
  . For the set of drug-DNA crystal structures chosen in the Section “Data selection”, the average value of c is 0.72 with standard deviation 0.21. A detailed explanation of the algorithm for the Z-score calculations by sequence-structure threading is shown in Supplementary Data.
RESULTS AND DISCUSSION
Automatic classification of the drug-DNA binding modes
The drug-DNA binding modes are commonly classified into two categories: (i) Covalent binding (e.g. acridine), (ii) Non-covalent binding, subdivided into two binding modes: intercalative binding (e.g. nogalamycin), and groove binding (e.g. berenil). X-ray diffraction and nuclear magnetic resonance (NMR) spectroscopy are not straight forward to determine the binding mode since the results of these structural techniques are often precluded by lack of site-specificity, rapid exchange or multiple binding modes (13). Our automatic classification method of the drug-DNA binding mode compared with the annotated list from NDB of 195 drug-DNA crystal structures proved successful in the classification of almost all the structures, except for 7 PDB structures (Table 5 in Supplementary Data). Interestingly, the incorrectly classified structures have some covalent bindings, even though not all of them are annotated as covalent drugs. Thus, this method is very useful for classifying the binding mode without looking at the detailed structure, and for correlating the structure and specificity in drug-DNA recognition.
Hoechst 33 258, berenil and 4′,6-diamidino-2-phenylindole (DAPI) bind preferentially to the minor groove of AT sequences but can also interact with GC sequences by a mechanism that remains so far controversial (29). Electric linear dichroism data support the hypothesis that such drugs interact with GC sites via a non-classical intercalation process (29). Our binding mode prediction is based only on the crystal structure and for all the available crystal structures of Hoechst 33 258, berenil and DAPI, it predicts groove-binding mode. This does not mean that the real binding mode is always the same as observed in a crystal; techniques such as electric linear dichroism (29) or NMR(30) provide a dynamic view of the underlying physical mechanism that is absent in the crystal studies. Nevertheless, our binding mode prediction method can give insight (when the coordinates of crystal structures are available) into the binding mode analysis.
Conformational energy Z-scores by sequence-structure threading
To analyze the conformational properties of drug-DNA complexes, we collected structures with different drugs binding to the same DNA sequence, and used the above method to classify automatically the drug binding modes. We analyzed the capability of the PMF matrices calculated with different types of conformational coordinates (base pair, base steps and the combination of both) to estimate the binding specificity of drug-DNA complexes. Figure 2 shows the results for the intercalator and groove binder drugs. The difference, Z − Zp, between the base-pair-based Z-score, Zp, and the Z-scores based on the combination of conformational coordinates, Z, is shown in Figure 2b. The base-pair-based PMF shows in almost all of the cases worse specificity than the PMF based on the combination of conformational coordinates. Therefore, base pairs alone are not very reliable to estimate specificities. The combination of base pair with the base-step conformational coordinates has a positive effect on the specificity since generally the Z-scores obtained from the combination of coordinates show higher specificity (larger negative Z-scores) than the base-step-based Z-scores (Figure 2c).
Figure 2.

Contribution of the Z-scores from different types of PMFs to the global specificity of the binding modes. (a) Z-scores obtained with PMF from the combination of base pairs and base steps (circle), base pairs (plus symbol) and base steps (square). The horizontal lines mark the Z-score averages for the combination of base pairs and base steps (black), base pairs (red) and base steps (blue). (b) Z-scores obtained from the combination of base pairs and base steps, Z, minus Z-scores obtained only with base pair coordinates, Zp. (c) Z-scores obtained from the combination of base pairs, Z, minus Z-scores obtained only with base-step coordinates, Zs.
This result indicates that the base-step and base-pair energies contain independent information. If both the energies were totally dependent or correlated, the magnitude of the total Z-score would not increase. The energy of base pair was assumed to be additive with respect to each base, whereas the energy of base steps was derived from base step, i.e. dinucleotide cooperative effect is involved in the latter. Therefore, we expect that the total Z-score would increase by the combination of the energies. Figure 2 shows that the magnitude of the total Z-score calculated for many drug-DNA complexes, in which the Z-scores for base pair and base steps are both negative, did indeed increase. Therefore, in the rest of this work we analyze the PMF calculated as a combination of base-pair and base-step conformational coordinates to analyze the specificity of the drug-DNA binding.
We tested the extent to which the energy corresponding to the large deformations in DNA induced by drug binding can be treated with harmonic models, and performed the Jarque–Bera hypothesis test to check for the normality (31) of the conformational energy landscape of each drug-DNA complex. The energy landscape is obtained applying the sequence-structure threading method for each drug-DNA complex (see Supplementary Data). For each of 1000 random sequences, we calculate the weighted sum of conformational energies, using Equation (3).
For each 1000-dimensional energy vector obtained with the sequence-structure threading method, we applied the Jarque–Bera hypothesis test for composite normality with significance level α = 0.1%. The critical values are computed with N Monte-Carlo simulations, where N was chosen large enough to ensure that the Monte-Carlo standard error  is <0.01. We obtained that 38.1% of the intercalators possess a Gaussian energy landscape (the average of their p-values is 0.02), whereas 62.2% of the groove binders have a Gaussian distribution (and the average of their p-values is 0.09). These results mean that in a significant percentage of the cases (slightly over the half), the conformational energy of the drug-DNA complexes behaves in a harmonic way. Thus, it might not be possible to apply the present harmonic models if large deformations are involved. The result also showed that the groove binder drug complexes behave in a more harmonic way than the intercalator drug complexes.
We analyzed the DNA conformational changes induced by the drug interactions. The covalent binding drugs change dramatically the DNA conformations in such a way that the harmonic PMF hypothesis may not be applicable for the distorted region. Also, intercalators may deform DNA in a potentially non-harmonic manner by changing sugars puckers and backbone sub-states. This was corroborated by the Jarque–Bera hypothesis test of composite normality over the conformational energy landscape obtained with the sequence-structure threading method, which revealed that in the analyzed crystal structures the groove binder drug-DNA complexes have much higher percentage of Gaussian energy landscape (62.2%) than the intercalator drug-DNA complexes (38.1%). Nevertheless, the Z-scores can be calculated for almost all of the intercalating drug structures available in the NDB. The groove-binding drugs do not significantly perturb the DNA structure. The Z-scores are shown in Tables 6 (groove binders) and 7 (intercalators) in Supplementary Data and in panel (a) of Figure 2. This panel also shows that the Z-scores obtained with PMF from the combination of base pairs and base steps of the groove binder drug-DNA complexes are smaller (more specific) than the Z-scores of the intercalator drug-DNA complexes. The average (and standard deviation) of the groove binder drug-DNA complexes is −2.47 (1.11), whereas for the intercalators is −1.29 (1.28). Although the application of the harmonic PMF to intercalators is less reliable, this result implies that the conformational state of the DNA after binding is less specific than in the case of the groove binder drugs. This result is indeed in agreement with experimental results, which have shown that intercalators do not generally have a pronounced interaction with specific base sequences (32).
The DNA sequence itself may bias the Z-score. Thus, we searched the NDB for free B-DNA crystal structures with the same DNA sequence as that of the drug-DNA complexes, and compared their conformational states and Z-scores. To remove the effect of self-contributions in the free B-DNA structures, we carried out a jack-knife procedure: when deriving the Z-score of each free B-DNA structure, we recalculated the PMF matrices using a dataset from which we removed the corresponding structure. The structures with the same sequence are grouped in a cluster. For every cluster of free B-DNA crystal structures with the same DNA sequence as the drug-bound DNA, we calculated the average of the Z-scores and we picked up from the annotated list in the NDB the structures with minimum and maximum Z-score values. The results for the cases in which drug binding is more specific than free structures (in terms of average Z-score) are summarized in Table 1, and the rest of the cases are shown in Table 8 in Supplementary Data. Almost all the drug-DNA complex structures for which a free B-DNA crystal structure was found in NDB are groove binders. The most populated group of DNA sequence in Table 1 is 5′-CGCGAATTCGCG-3′ (37 drug-DNA complexes and 25 B-DNA crystal structures) since the determination of this dodecamer structure was a milestone in structural biology (33).
Table 1.
Z-scores of the drug dataset and Z-scores of the available free PDB structures with the same DNA sequence as the drug-bound DNA
| Sequence | Drug | PDB | Z | PDBm | Zm | PDBM | ZM | N | Zave |
|---|---|---|---|---|---|---|---|---|---|
| CCAATTGG | Netropsin | 1z8v | −2.85 | 431d | −2.84 | 431d | −2.84 | 1 | −2.84 |
| CCAGGCCTGG | Imidazole-pyrrole | 365d | −2.68 | 1cw9 | −3.16 | 1bd1 | −1.77 | 5 | −2.50 |
| CGCATATTTGCG | Tri-benzimidazole | 459d | −2.49 | 458d | −2.00 | 458d | −2.00 | 1 | −2.00 |
| CGCGAATTCGCG | m-iodo Hoechst | 443d | −3.43 | 428d | −4.18 | 270d | −2.24 | 25 | −3.33 |
| CGCGAATTCGCG | m-iodo Hoechst | 449d | −3.51 | 428d | −4.18 | 270d | −2.24 | 25 | −3.33 |
| CGCGAATTCGCG | Benzimidazole | 453d | −3.65 | 428d | −4.18 | 270d | −2.24 | 25 | −3.33 |
| CGCGAATTCGCG | Benzimidazole | 1ftd | −3.57 | 428d | −4.18 | 270d | −2.24 | 25 | −3.33 |
| CGCGAATTCGCG | Benzimidazole | 1qv4 | −3.33 | 428d | −4.18 | 270d | −2.24 | 25 | −3.33 |
| CGCGAATTCGCG | Thiophene diamidine | 1vzk | −3.67 | 428d | −4.18 | 270d | −2.24 | 25 | −3.33 |
| CGCGAATTCGCG | Propamidine | 1prp | −3.54 | 428d | −4.18 | 270d | −2.24 | 25 | −3.33 |
| CGCGAATTCGCG | Oxapentamidine | 166d | −3.52 | 428d | −4.18 | 270d | −2.24 | 25 | −3.33 |
| CGCGAATTCGCG | Netropsin | 6bna | −3.86 | 428d | −4.18 | 270d | −2.24 | 25 | −3.33 |
| CGCGAATTCGCG | Netropsin | 101d | −3.54 | 428d | −4.18 | 270d | −2.24 | 25 | −3.33 |
| GCGCGC | Triostin | 0dac | −2.78 | 1d97 | −1.69 | 1d97 | −1.69 | 1 | −1.69 |
| GCGTACGC | Quinoxaline | 1pfe | −3.97 | 253d | −2.43 | 253d | −2.43 | 1 | −2.43 |
| GCGTACGC | Echinomycin | 1xvk | −2.88 | 253d | −2.43 | 253d | −2.43 | 1 | −2.43 |
| GTATATAC | Netropsin | 473d | 1.63 | 446d | 1.77 | 446d | 1.77 | 1 | 1.77 |
Notes: The columns PDB and Z show the PDB file name of the DNA-drug complex and the respective Z-score value; PDBm and Zm give the PDB file name of the free B-DNA crystal structure and the Z-score with the minimum Z-score value; PDBM and ZM show the PDB file name and Z-score value of the free B-DNA crystal structure with the maximum Z-score. The column N shows the number of the free B-DNA crystal structures with the same DNA sequence, and the column Zave shows the average of the Z-scores of all the free B-DNA crystal structures with the same DNA sequence as the drug-bound DNA.
In general there is more variability in Z-scores of free B-DNA structures than in drug-bound DNA with the same sequence, since the free B-DNA is more flexible in its conformational state than in the DNA structures bound by a drug, that constraints the DNA movements. In several cases, the drug-DNA complexes give higher specificity (more negative Z-score) than the average value of the Z-scores corresponding to free B-DNA crystal structures with the same DNA sequence (column Zave). This indicates that the DNA conformation plays an important role in the recognition by such drugs.
The Z-scores of the drug-DNA complex structures for which an analogous free B-DNA crystal structure in NDB with the same DNA sequences was not found are shown in Supplementary Data (Table 6 for groove binders and Table 7 for intercalators). In almost all the drug-DNA complexes, the Z-scores are negative, indicating that the DNA conformational state after the drug binding still depends on the DNA sequence. In the absence of a free DNA structure, we cannot estimate the significance of the DNA conformation for the specificity of drug-DNA recognition. Nevertheless, the sequence dependence of the DNA conformational state may play an important role in the DNA recognition by some drugs (see the next section), in addition to the direct interactions between drugs and DNA.
We also calculated the Z-scores using PMFs derived from the drug-bound structures and using the jack-knife method we compared them with the values obtained with PMFs derived from free B-DNA structures. We obtained mean absolute errors (MAE) of 0.749, 0.669 and 0.702 for base pair, base steps and the combination of both, respectively. These results indicate that the PFMs derived from free B-DNA and from drug-DNA binding crystal structures are not equivalent. One of the reasons of such divergence is that we need to relax the constraint of using only steps with B conformation to produce enough number of samples (at least six) for each conformational state, while deriving the PFMs from drug-bound structures. It would be interesting to improve the specificity in our approach by deriving PMSs from intercalator and groove binder drug complexes independently. However, the aforementioned lack of data limits such technique at present.
Visualization of the position-dependent Z-scores with ‘worm’ graphs
The conformational energies and Z-scores can be calculated not only for the whole DNA sequence but also for each base pair and for each base step of the DNA strands. This enables us to obtain more detailed information of the way the conformational changes affect the energy distribution within the DNA structure. The Z-scores of the conformational energy for each base pair and each base step show how specific is the dependence of a conformational state on the sequence of its building bases.
To get an insight into the contribution of specificity associated with sequence and conformation within a given DNA structure in a more visual manner, we use ‘worm’ graphs (19). The ‘worm’ graphs show the distribution of the specificity mapped on the 3D structure of the DNA strand in a color codification. In these graphs, the C1 atoms of the nucleotides are used to represent the DNA backbone. These atoms are drawn as spheres, with the color representing the Z-score value of the corresponding base pair. The base steps are represented by cylinders connecting the spheres that represent the base pairs. The radii of the cross sections of the cylinders are half of the radii of the adjoining spheres, the color codifying the value of the base-step Z-scores; high Z-scores (low specificity) in red and low Z-scores (high specificity) in blue. The global Z-scores of the drug-DNA complexes can be larger than of the free DNA with the same sequence, but the ‘worm’ graphs reveal the exact position of the DNA structure contributing to the binding specificity as shown in the following examples.
Imidazole-pyrrole-hydroxypyrrole polyamide
Polyamides containing imidazole and pyrrole carboxamides are the synthetic counterpart with promising anticancer properties (34) of the natural netropsin and distamycin A, two antiviral drugs. The left panels of Figure 3 show the Z-score distribution of a DNA structure with sequence 5′-CCAGTACTGG-3′ bound by imidazole-pyrrole-hydroxypyrrole (Im/Py/Hp) polyamide (top), and the Z-score distribution of the corresponding free B-DNA crystal structure with minimum Z-scores (bottom). The comparison of the two panels shows that although in this case the drug binding increases the global conformational energy Z-scores, the drug binding reduces the Z-scores along local regions that expand further from the vicinity of the native sequence, T-A, to which the drug was designed to bind. In particular, it reduces the Z-score of the T-base pair energy with respect to the free DNA structure with minimum energy. The binding process produces a slight reduction in the global conformational energy Z-scores, but more dramatic distortion happens to the base-step Z-score distribution.
Figure 3.

‘Worm’ graph representations of drug-DNA crystal structures (top) and the corresponding free B-DNA crystal structures (bottom). The color codifies the Z-score value of the energy in each dinucleotide step (the blue color indicates high specificity and the red, low). The tube passes across the backbone formed by the C1 carbons of each nucleotide. The terminal bases are represented with black spheres and the terminal steps, for which the Z-scores are not calculated, with thin black lines. The subindices 5 and 3 stand for terminals 5′ and 3′ of the DNA sequences. The ligands and the heteroatoms are shown as ball and stick models. The color bar in the bottom represents the color codification of the Z-scores of the conformational energies.
m-Iodo, p-methoxy Hoechst
Halogenated DNA precursors are important in cancer radiotherapy since they sensitize local DNA regions to both UV and ionization radiation resulting in the subsequent DNA strand breakage. This mechanism is the basis for the radiosensitizer drug design, in which a halogen atom is incorporated into a minor groove-binding ligand. The drug m-iodo, p-methoxy Hoechst is a good example of this concept (35).
The right panels of Figure 3 show the Z-score distribution of a DNA structure with a sequence 5′-CGCGAATTCGCG-3′ bound by m-iodo, p-methoxy Hoechst (top), and the Z-score distribution of the corresponding free B-DNA crystal structure with maximum Z-scores (bottom). m-Iodo, p-methoxy Hoechst is designed to bind to T-A sequences. The comparison between the drug-bound and the drug-free conformational states shows that the base-pair and base-step Z-score energies of the central T-A bound by the drug are very similar in the bound structure and in the free B-DNA structure with minimum global Z-scores. But in the neighborhood of the T-A, the base-pair and base-step Z-score energies are lower for the drug-DNA complex. This drug also induces a reduction in the base-step Z-scores in the vicinity of the binding region.
Echinomycin
Echinomycin (also known as quinomycin A) is a depsipeptide antibiotic and the canonical representative of the quinoxaline antibiotics that are antitumor agents and act by binding to DNA via the mechanism of bi-functional intercalation, interfering with both replication and transcription (36). The top-left panel of Figure 4 shows the Z-score distribution of a DNA structure with sequence 5′-ACGTACGT-3′ bound by echinomycin. The structure has the expected (36) Hoogsteen pairing for the T-A base pairs flanking the intercalating chromophores, and Watson–Crick pairing for both C-G base pairs enclosed by the drug. The Hoogsteen pair has less specificity (higher Z-scores) than the C-G base pairs. These results agree with the fact that echinomycin has long been known to bind best to GC-rich DNAs (37), and with the idea that echinomycin induces structural changes in regions, surrounding its binding site, and that these changes can be cooperatively propagated over several turns of the DNA helix (38). Various enzymatic and chemical probes have confirmed that echinomycin can induce DNA structural changes in regions remote from their actual binding sites (37).
Figure 4.

‘Worm’ graph representations of drug-DNA crystal structures without corresponding free B-DNA crystal structures. The color codification is the same as in Figure 3.
Chromomycin A3
Chromomycin A3 (also known as aburamycin B and toyomycin) is a glycosidic antineoplastic antibiotic of the aureolic family used clinically in cancer therapies. It reversibly binds to G-C base pairs in the minor groove of DNA, thereby inhibiting RNA synthesis (39). It is a potent inhibitor of neuronal apoptosis induced by oxidative stress, by a mechanism proposed to be due to the inhibition of the binding of transcription factors Sp1 and Sp3 to their cognate ‘G-C’ box (40).
The top-right panel of Figure 4 shows the Z-score distribution along a DNA structure with sequence 5′-TTGGCCAA-3′ bound by chromomycin A3. The central G-C pair has high specificity that is reduced gradually in the strand tails, which could be due to both the lowest specificity of the A and T bases, and the boundary effect in the strand terminals.
Idarubicin
Idarubicin (Idamycin®) is an analog of daunorubicin but 5 to 6 times more potent and less cardiotoxic than daunorubicin. The mechanism of action of the anthracyclines (doxorubicin, daunorubicin and idarubicin) is poorly understood. Cytotoxicity is generally attributed to intercalation of the drug into DNA and inhibition of DNA topoisomerase II activity resulting in double- and single-strand DNA breaks. Idarubicin is used to treat a broad spectrum of solid and hematologic cancers (41).
The bottom-left panel of Figure 4 shows the Z-score distribution of a DNA structure with sequence 5′-CGATCG-3′bound by idarubicin. The A-T base pairs not involved in the intercalation display a low buckle angle, which differs from those of the base pairs affected by the drug intercalation. This is reflected in the lower specificity of the central A and T base pairs (greener spheres). At the intercalation steps, the idarubicin molecules unwind the DNA, the helical twist angles between A(3)-T(10)/T(4)-A(9) decrease by almost 7.5° from the B-DNA standard value of 36° (42), shown in the ‘worm’ graph with bluer cylinders between the A and the T bases.
Daunorubicin
Daunorubicin (or daunomycin) as idarubicin is a chemotherapy agent of the anthracycline family. It is most commonly used to treat specific types of leukemia. On binding to DNA, daunomycin intercalates, with its daunosamine residue directed towards the minor groove. It has the highest preference for the two adjacent G/C base pairs flanked on the 5′ side by an A/T base pair (43). Daunomycin effectively binds to every 3 base pairs and induces a local unwinding angle of 11°, but has negligible distortion of helical conformation (44). The bottom-right panel of Figure 4 shows the Z-score distribution of a DNA structure with sequence 5′-CGCGCG-3′ bound by daunorubicin and is very similar to that of the other anthracycline (idarubicin) in the left panel.
The above examples show how the compensation of the increments and decrements of the local Z-scores sometimes masks the distribution of the conformational change due to the drug binding, producing similar global Z-scores. Therefore, it is important to analyze the Z-score distribution along the DNA structure, and tools like the ‘worm’ graphs help to accomplish such a task. Before binding of drug, the free DNA structures have an approximately uniform Z-score distribution. After binding, this distribution acquires more contrast. We can interpret the decrease in the Z-scores (increase of specificity) upon binding as a result of DNA conformational changes more suitable for the specific binding of the drug. The increase in the Z-scores means a local loss of specificity, which could be due to the extra strain caused by direct interactions between drug and DNA. The drug binding not only affects the closest bases, changing their conformational states, but also induces long-range changes in the conformational energies. Similar phenomenon is well known from the indirect readout mechanism in protein-DNA complexes, where protein binding induces distortion of the DNA conformation (45). The direct and indirect readouts can be viewed as intermolecular and intramolecular processes, respectively (46), and their balance may be important for both protein-DNA and drug-DNA recognitions.
CONCLUSIONS
When drugs bind to DNA, they usually change the DNA conformation to some degree. However, changes in DNA conformation and global energy may not be directly relevant to the sequence specificity. What is important in the drug-DNA recognition process is the sequence dependence of conformation and energy, which may be very subtle. The sequence-structure threading technique enabled us to estimate the Z-scores of the conformational energy as a measure of the sequence specificity.
The calculated Z-scores from knowledge-based PMF were generally negative for both intercalators and DNA groove binders, indicating that the indirect readout through the sequence-dependent conformational energy of DNA can potentially contribute to the sequence specificity of drug-DNA complex. The more negative Z-scores for the groove binding drugs with respect to the intercalating drugs are in agreement with previous experimental results (32), in which intercalating drugs are not very specific, but the groove bindings are significantly specific.
We have compared the Z-scores of groove-binding drugs in complex with DNA and the corresponding free B-DNA with the same sequence. We found that for several cases the Z-scores of drug-DNA complexes are more negative than those of the free B-DNAs. For other drugs, both values are comparable or the Z-scores of the free B-DNAs are more negative. We examined the context-dependence of the conformational energy and the Z-scores within those drug-DNA structures, by calculating the distribution of Z-scores as illustrated with the ‘worm’ graphs, and showed that the conformational changes of DNA caused by the drug binding changes significantly the Z-score distribution within the DNA structures, even if the overall Z-score is not changed significantly. Thus, these results indicate that drugs may use the conformational change of DNA induced by the binding to increase the specificity to recognize specific sequences in an indirect manner.
We have proposed computational tools for the quantification of the binding specificity, together with the automatic classification of the drug-DNA binding mode. These tools can help in the high-throughput screening of possible drug candidates and in the new drugs design, which may complement drug-DNA direct readout PMF of Ge et al. (47).
The aim of our work was to examine the sequence dependence of the conformational energy of DNA in drug-DNA complexes, but not to estimate the binding free energy of drug-DNA interactions. In order to estimate the binding free energy, it is also necessary to evaluate the interaction energies between drug and DNA, and solvation energy, in addition to the conformational energies of DNA computed here. For example, the enthalpy–entropy compensation phenomena observed by the Breslauer group in netropsin or distamycin binding to homo or alternating AT sequences (48) might not be explained without including the effect of water in the drug-DNA complexes.
Our approach for the analysis of the specificity of the conformational state and its context-dependency can be used to study the drug-DNA recognition process since the essential movements occurring in free B-DNA should be similar to those necessary to deform DNA in complexes.
Since Jarque–Bera hypothesis test of composite normality of the energy conformational landscape reveals that the harmonic hypothesis is not always applicable, especially when large deformations are involved, we plan in future research to develop PMF based on non-harmonic models with higher application spectrum.
SUPPLEMENTARY DATA
Supplementary Data are available at NAR Online.
ACKNOWLEDGEMENTS
M.J.A.-B. acknowledges the Japanese Society for the Promotion of Science (JSPS) for supporting him in this research. This work is supported in part by Grants-in-Aid for Scientific Research 16014219 and 16041235 (A. Sarai) from the Ministry of Education, Culture, Sports, Science and Technology of Japan. We thank Drs Kono and Fujii for discussion of knowledge-based analysis and computer simulations of DNA structures, which greatly contributed to the concept of protein-DNA recognition mechanism. Funding to pay the Open Access publication charges for this article was provided by Grants-in-Aid for Scientific Research 16014219 and 16041235 (A. Sarai) from the Ministry of Education, Culture, Sports, Science and Technology of Japan.
Conflict of interest statement. None declared.
REFERENCES
- 1.Bischoff G, Hoffmann S. DNA-binding of drugs used in medical therapies. Curr. Med. Chem. 2002;9:321–348. doi: 10.2174/0929867023371085. [DOI] [PubMed] [Google Scholar]
- 2.Darnell JE. Transcription factors as targets for cancer therapy. Nat. Rev. Cancer. 2002;2:740–749. doi: 10.1038/nrc906. [DOI] [PubMed] [Google Scholar]
- 3.Hurley LH. DNA and its associated processes as targets for cancer therapy. Nat. Rev. Cancer. 2002;2:188–200. doi: 10.1038/nrc749. [DOI] [PubMed] [Google Scholar]
- 4.Rishton GM. Reactive compounds and in vitro false positives in HTS. Drug Discov. Today. 1997;2:382–384. [Google Scholar]
- 5.Sirois S, Hatzakis G, Wei D, Du Q, Chou KC. Assessment of chemical libraries for their druggability. Comput. Biol. Chem. 2005;29:55–67. doi: 10.1016/j.compbiolchem.2004.11.003. [DOI] [PubMed] [Google Scholar]
- 6.Lin J, Sahakian DC, de Morais SM, Xu JJ, Polzer RJ, Winter SM. The role of absorption, distribution, metabolism, excretion and toxicity in drug discovery. Curr. Top. Med. Chem. 2003;3:1125–1154. doi: 10.2174/1568026033452096. [DOI] [PubMed] [Google Scholar]
- 7.Lipinski CA, Lombardo F, Dominy BW, Feeney PJ. Experimental and computational approaches to estimate solubility and permeability in drug discovery and development settings. Adv. Drug Deliv. Rev. 1997;23:3–25. doi: 10.1016/s0169-409x(00)00129-0. [DOI] [PubMed] [Google Scholar]
- 8.Chabner BA, Roberts T., Jr Chemotherapy and the war on cancer. Nat. Rev. Cancer. 2005;5:65–72. doi: 10.1038/nrc1529. [DOI] [PubMed] [Google Scholar]
- 9.Workman P. Genomics and the second golden era of cancer drug development. Mol. Biosyst. 2005;1:17–26. doi: 10.1039/b501751n. [DOI] [PubMed] [Google Scholar]
- 10.Evans WE, Relling MV. Moving towards individualized medicine with pharmacogenomics. Nature. 2004;429:464–468. doi: 10.1038/nature02626. [DOI] [PubMed] [Google Scholar]
- 11.Eichelbaum M, Ingelman-Sundberg M, Evans WE. Pharmacogenomics and individualized drug therapy. Annu. Rev. Med. 2006;57:119–137. doi: 10.1146/annurev.med.56.082103.104724. [DOI] [PubMed] [Google Scholar]
- 12.Terfloth L. Drug Design. In: Gasteiger J, Engel T, editors. Chemoinformatics: A Textbook. 1st edn. London: Wiley-VCH; 2003. pp. 593–618. Chapter 10.4. [Google Scholar]
- 13.Coury JE, McFail-Isom L, Williams LD, Bottomley LA. A novel assay for drug-DNA binding mode, affinity, and exclusion number: scanning force microscopy. Proc. Natl Acad. Sci. USA. 1996;93:12283–12286. doi: 10.1073/pnas.93.22.12283. [DOI] [PMC free article] [PubMed] [Google Scholar]
- 14.Ishchenko AA, Vasilenko NL, Sinitsina OI, Yamkovov VI, Fedorova OS, Douglas KT, Nevinsky GA. Thermodynamic, kinetic, and structural basis for recognition and repair of 8-oxoguanine in DNA by Fpg protein from Escherichia coli. Biochemistry. 2002;41:7540–7548. doi: 10.1021/bi0121297. [DOI] [PubMed] [Google Scholar]
- 15.Fischer E. Einfluss der Configuration auf die Wirkung den Enzyme. Ber. Dtsch. Chem. Ges. 1894;27:2985–2993. [Google Scholar]
- 16.Koshland DE., Jr Application of a theory of enzyme specificity to protein synthesis. Proc. Natl Acad. Sci. USA. 1958;44:98–104. doi: 10.1073/pnas.44.2.98. [DOI] [PMC free article] [PubMed] [Google Scholar]
- 17.Shaik SA, Ahmed SR, Jayaram B. A molecular thermodynamic view of DNA-drug interactions: a case study of 25 minor-groove binders. Arch. Biochem. Biophys. 2004;429:81–99. doi: 10.1016/j.abb.2004.05.019. [DOI] [PubMed] [Google Scholar]
- 18.Tobi D, Bahar I. Structural changes involved in protein binding correlate with intrinsic motions of proteins in the unbound state. Proc. Natl Acad. Sci. USA. 2005;102:18908–18913. doi: 10.1073/pnas.0507603102. [DOI] [PMC free article] [PubMed] [Google Scholar]
- 19.Araúzo-Bravo MJ, Fujii S, Kono H, Ahmad S, Sarai A. Sequence-dependent conformational energy of DNA derived from molecular dynamics simulations: toward understanding the indirect readout mechanism in protein-DNA recognition. J. Am. Chem. Soc. 2005;127:16074–16089. doi: 10.1021/ja053241l. [DOI] [PubMed] [Google Scholar]
- 20.Sarai A, Kono H. Protein-DNA recognition patterns and predictions. Ann. Rev. Biophys. Biomol. Struct. 2005;34:379–398. doi: 10.1146/annurev.biophys.34.040204.144537. [DOI] [PubMed] [Google Scholar]
- 21.Olson WK, Bansal M, Burley SK, Dickerson E, Gerstein M, Harvey EC, Heinemann U, Lu XJ, Neidle S, Shakked Z, Sklenar H, Suzuki M, Tung CS, Westhof E, Wolberger C, Berman HM. A standard reference frame for the description of nucleic acid base pair geometry. J. Mol. Biol. 2001;313:229–237. doi: 10.1006/jmbi.2001.4987. [DOI] [PubMed] [Google Scholar]
- 22.Dickerson RE, Bansal M, Calladine CR, Diekmann S, Hunter WN, Kennard O, Kitzing E, Lavery R, Nelson HCM, Olson WK, Saenger W. Definitions and nomenclature of nucleic acid structure parameters. Nucleic Acids Res. 1989;17:1797–1803. doi: 10.1093/nar/17.5.1797. [DOI] [PMC free article] [PubMed] [Google Scholar]
- 23.Lu XJ, Olson WK. A software package for the analysis, rebuilding and visualization of three-dimensional nucleic acid structures. Nucleic Acids Res. 2003;31:5108–5121. doi: 10.1093/nar/gkg680. [DOI] [PMC free article] [PubMed] [Google Scholar]
- 24.Olson WK, Gorin AA, Lu XJ, Hock LM, Zhurkin VB. DNA sequence-dependent deformability deduced from protein-DNA crystal complexes. Proc. Natl Acad. Sci. USA. 1998;95:11163–11168. doi: 10.1073/pnas.95.19.11163. [DOI] [PMC free article] [PubMed] [Google Scholar]
- 25.Berman HM, Olson WK, Beveridge DL, Westbrook J, Gelbin A, Demeny T, Hsieh SH, Srinivasan AR, Schneider B. The nucleic acid database. A comprehensive relational database of three-dimensional structures of nucleic acids. Biophys. J. 1992;63:751–759. doi: 10.1016/S0006-3495(92)81649-1. [DOI] [PMC free article] [PubMed] [Google Scholar]
- 26.Deshpande N, Addess KJ, Bluhm WF, Merino-Ott JC, Townsend-Merino W, Zhang Q, Knezevich C, Lie L, Chen L, Feng Z, Kramer-Green R, Flippen-Anderson JL, Westbrook J, Berman HM, Bourne PE. The RCSB Protein Data Bank: a redesigned query system and relational database based on the mmCIF schema. Nucleic Acids Res. 2005;33:D233–237. doi: 10.1093/nar/gki057. [DOI] [PMC free article] [PubMed] [Google Scholar]
- 27.Araúzo-Bravo MJ, Sarai A. Knowledge-based prediction of DNA atomic structure from nucleic sequence. Genome Inform. Ser. 2005;16:12–21. [PubMed] [Google Scholar]
- 28.Lu XJ, Shakked Z, Olson WK. A-form conformational motifs in ligand-bound DNA structures. J. Mol. Biol. 2000;300:819–840. doi: 10.1006/jmbi.2000.3690. [DOI] [PubMed] [Google Scholar]
- 29.Colson P, Houssier C, Bailly C. Use of electric linear dichroism and competition experiments with intercalating drugs to investigate the mode of binding of Hoechst 33258, berenil and DAPI to GC sequences. J. Biomol. Struct. Dyn. 1995;13:351–66. doi: 10.1080/07391102.1995.10508845. [DOI] [PubMed] [Google Scholar]
- 30.Trotta E, D’Ambrosio E, Ravagnan G, Paci M. Evidence for DAPI intercalation in CG sites of DNA oligomer [d(CGACGTCG)]2: a 1H NMR study. Nucleic Acids Res. 1995;23:1333–1340. doi: 10.1093/nar/23.8.1333. [DOI] [PMC free article] [PubMed] [Google Scholar]
- 31.Jarque CM, Bera AK. A test for normality of observations and regression residuals, Int. Stat. Rev. 1987;55:1–10. [Google Scholar]
- 32.Waring MJ. In: The Molecular Basis of Antibiotic Action. Gale EF, Cundlife E, Richmond MH, Reynolds PE, Waring MJ, editors. 2nd edn, Wiley, London; 1981. p. 287. [Google Scholar]
- 33.Drew HR, Wing RM, Takano T, Broka C, Tanaka S, Itakura K, Dickerson RE. Structure of a B-DNA dodecamer: conformation and dynamics. Proc. Natl Acad. Sci. USA. 1981;78:2179–2183. doi: 10.1073/pnas.78.4.2179. [DOI] [PMC free article] [PubMed] [Google Scholar]
- 34.O'Hare CC, Mack D, Tandon M, Sharma SK, Lown JW, Kopka ML, Dickerson RE, Hartley JA. DNA sequence recognition in the minor groove by crosslinked polyamides: the effect of N-terminal head group and linker length on binding affinity and specificity. Proc. Natl Acad. Sci. USA. 2002;99:72–77. doi: 10.1073/pnas.012588799. [DOI] [PMC free article] [PubMed] [Google Scholar]
- 35.Squire CJ, Baker LJ, Clark GR, Martin RF, White J. Structures of m-iodo Hoechst–DNA complexes in crystals with reduced solvent content: implications for minor groove binder drug design. Nucleic Acid Res. 2000;28:1252–1258. doi: 10.1093/nar/28.5.1252. [DOI] [PMC free article] [PubMed] [Google Scholar]
- 36.Cuesta-Seijo JA, Sheldrick GM. Structures of complexes between echinomycin and duplex DNA. Acta Cryst. 2005;D61:442–448. doi: 10.1107/S090744490500137X. [DOI] [PubMed] [Google Scholar]
- 37.Laurence PGW, Waring MJ. The binding of echinomycin to deoxyribonucleic acid. Biochem. J. 1976;157:721–740. doi: 10.1042/bj1570721. [DOI] [PMC free article] [PubMed] [Google Scholar]
- 38.Fox KR, Kentebe E. Echinomycin binding to the sequence CG(AT)nCG alters the structure of the central AT region. Nucleic Acids Res. 1990;18:1957–1963. doi: 10.1093/nar/18.8.1957. [DOI] [PMC free article] [PubMed] [Google Scholar]
- 39.Hou M-H, Robinson H, Gao Y-G, Wang A.H.-J. Crystal structure of the [Mg2+-(chromomycin A3)2]–d(TTGGCCAA)2 complex reveals GGCC binding specificity of the drug dimer chelated by a metal ion. Nucleic Acids Res. 2004;32:2214–2222. doi: 10.1093/nar/gkh549. [DOI] [PMC free article] [PubMed] [Google Scholar]
- 40.Chatterjee S, Zaman K, Ryu H, Conforto A, Ratan RR. Sequence-selective DNA binding drugs mithramycin A and chromomycin A3 are potent inhibitors of neuronal apoptosis induced by oxidative stress and DNA damage in cortical neurons. Ann. Neurol. 2001;49:345–354. [PubMed] [Google Scholar]
- 41.Hollingshead LM, Faulds D. Idarubicin: a review of its pharmacodynamic and pharcokinetic properties and therapeutic potential in the chemotherapy of cancer. Drugs. 1991;42:690–719. doi: 10.2165/00003495-199142040-00010. [DOI] [PubMed] [Google Scholar]
- 42.Dautant A, d’Estaintot BL, Gallois B, Brown T, Hunter WN. A trigonal form of the idarubicin:d(CGATCG) complex; crystal and molecular structure at 2.0 Å resolution. Nucleic Acids Res. 1995;23:1710–1716. doi: 10.1093/nar/23.10.1710. [DOI] [PMC free article] [PubMed] [Google Scholar]
- 43.Capranico G, Buteffi E, Zunino F. Change of the sequence specificity of daunorubicin-stimulated topoisomerase II. DNA cleavage by epimerization of the amino group of the sugar moiety. Cancer Res. 1995;55:312–317. [PubMed] [Google Scholar]
- 44.Wang AH-J, Gao Y-G, Liaw Y-C, Li Y-K. Formaldehyde cross-links daunorubicin and DNA efficiently: HPLC and X-ray diffraction studies. Biochemistry. 1991;30:3812–3815. doi: 10.1021/bi00230a002. [DOI] [PubMed] [Google Scholar]
- 45.Kalodimos CG, Biris N, Bonvin AMJJ, Levandoski M, Guennuegues M, Boelens R, Kaptein R. Structure and flexibility adaptation in nonspecific and specific protein-DNA complexes. Science. 2004;305:386–389. doi: 10.1126/science.1097064. [DOI] [PubMed] [Google Scholar]
- 46.Gromiha MM, Siebers JG, Selvaraj S, Kono H, Sarai A. Intermolecular and intramolecular readout mechanisms in protein-DNA recognition. J. Mol. Biol. 2004;337:285–294. doi: 10.1016/j.jmb.2004.01.033. [DOI] [PubMed] [Google Scholar]
- 47.Ge W, Schneider B, Olson WK. Knowledge-based elastic potentials for docking drugs or proteins with nucleic acids. Biophys. J. 2005;88:1166–1190. doi: 10.1529/biophysj.104.043612. [DOI] [PMC free article] [PubMed] [Google Scholar]
- 48.Breslauer KJ, Remeta DP, Chou W.-Y, Ferrante R, Curry J, Zaunczkowski D, Snyder JG, Marky LA. Enthalpy-entropy compensations in drug-DNA binding studies (thermodynamic driving forces/drug-induced changes/probes of DNA conformation) Proc. Natl Acad. Sci. USA. 1987;84:8922–8926. doi: 10.1073/pnas.84.24.8922. [DOI] [PMC free article] [PubMed] [Google Scholar]