


Abstract
Transcription regulation typically involves the binding of proteins over long distances on multiple DNA sites that are brought close to each other by the formation of DNA loops. The inherent complexity of assembling regulatory complexes on looped DNA challenges the understanding of even the simplest genetic systems, including the prototypical lac operon. Here we implement a scalable approach based on thermodynamic molecular properties to model ab initio systems regulated through multiple DNA sites with looping. We show that this approach applied to the lac operon accurately predicts the system behavior for a wide range of cellular conditions, which include the transcription rate over five orders of magnitude as a function of the repressor concentration for wild type and all seven combinations of deletions of three operators, as well as the observed induction curves for cells with and without active catabolite activator protein. Our results provide new insights into the detailed functioning of the lac operon and reveal an efficient avenue to incorporate the required underlying molecular complexity into fully predictive models of gene regulation.
INTRODUCTION
Control of localized events on DNA by proteins bound at distal sites is intimately linked to DNA looping. DNA flexibility plays an important role in mediating long-range interactions (1), allowing proteins bound to nonadjacent DNA sites to come close to each other. This strategy is widely used in eukaryotic enhancers (2) to integrate multiple signals into the control of the transcriptional machinery (2,3), to the extent that transcription regulation through DNA looping is nowadays considered to be the rule rather than the exception (4,5). DNA looping can also be formed by single-protein complexes, including the regulators of many bacterial operons, such as ara, gal, and lac operons (6), and human proteins involved in cancer, such as retinoic X receptor (RXR) (7) and p53 (8). The presence of DNA looping with single- and multi-protein complexes is important not only for transcription regulation but also for many other cellular processes, including DNA replication (9), recombination (10), nucleosome positioning (11), and telomere maintenance (12).
To date, there is only limited understanding of the factors that drive macromolecular assembly on looped DNA, especially when multiple binding sites and loops are involved (1,13). A notable example is the lac operon in Escherichia coli, which is still far from being completely understood despite being one of the systems that led to discovery of gene regulation (14).
The E. coli lac operon is the genetic system that regulates and produces the enzymes needed to metabolize lactose (14). The response to lactose is controlled by the lac repressor (15) that can bind to O1, the main operator, thus preventing the RNA polymerase from binding to the promoter and transcribing three genes used in lactose metabolism. There are also two auxiliary operators, O2 and O3, to which the repressor can also bind, but not prevent transcription (Figure 1). Elimination of either one auxiliary operator has only minor effects; yet simultaneous elimination of both of them reduces the repression level by a factor 100 (16). This effect results from the ability of the lac repressor, a tetramer with two dimeric DNA-binding domains, to bind simultaneously to two operators and loop the intervening DNA. Thus, the main operator and at least one auxiliary operator suffice to form DNA loops that substantially increase the ability of the repressor to bind the main operator. Beyond increasing the repression level, it is not clear to what extent DNA looping shapes the properties of transcription regulation and the effects that having three instead of two operators has on the behavior of the system. Recent phenomenological analyses of the lac operon (17,18) have been able to fit the experimental data, but the type of predictive power that allows one to go from the molecular properties to the observed physiological behavior is still missing.
Figure 1.

Operators controlling expression of the lacZ, lacY, and lacA genes in the lac operon. (A) Location of the main (O1) and the two auxiliary (O2 and O3) operators, shown as orange rectangles on the thick black segment representing DNA. Binding of the lac repressor to O1 prevents transcription of the three lacZYA genes. (B, C) The bidentate repressor can bind to any of the three operators and simultaneously to any two of them by looping the intervening DNA, resulting in different protein–DNA complexes. Two of the three possible loops are shown: (B) one lac repressor (shown in red) loops DNA by binding simultaneously to O1 and O3 (loop L13) whereas another repressor binds to O2; (C) only one repressor is bound to DNA, forming a loop between O1 and O2 (loop L12). In both cases, the lacZYA genes are repressed. The different contributions to the free energy of the lac repressor–DNA complexes, which include positional (p), interaction (e1, e2, and e3), and conformational (cL12, cL13, and cL23) contributions, are explicitly indicated in these two cases.
Here we implement a scalable quantitative computational approach to analyze systems regulated through multiple DNA sites with looping. This approach applied to the lac operon allows us to accurately predict ab initio the transcription rate over five orders of magnitude for wild type and seven mutants accounting for all the combinations of deletions of the three operators and the observed induction curves of the system for different cellular conditions, such as in the presence or absence of active catabolite activator protein (CAP). In the case of transcription, ab initio, or from first principles, refers to the properties of the molecular events upon which gene regulation is built. Here the properties of the molecular events are characterized through previously determined free energies.
METHODS
To incorporate the relevant molecular properties into a quantitative model of transcription regulation, we have used a statistical thermodynamics approach. Following the approach of Ref. (19), we consider a decomposition of the free energy of the protein–DNA complex into positional, interaction, and conformational contributions. In short, the positional free energy, p, accounts for the cost of bringing the lac repressor to its DNA-binding site in the protein–DNA complex; interaction free energies, e, arise from the physical contact between the repressor DNA-binding domains and the different operator sites; and conformational free energies, c, account for changes in conformation, including the formation of DNA loops (Figure 1). All these contributions to the free energy can be collected to obtain the free energy ΔG(s) of a given state s of the protein–DNA complex. The advantage of this approach is that it provides the free energies of a large number of different states from just the individual properties of the interactions and components. Here, different states account for the different ways in which the repressors can bind the three operators.
The free energy of a state s is connected to the equilibrium probability Ps of such state through the statistical thermodynamics relationship  , where
  is the partition function, which serves as normalization factor, and RT is the gas constant times the absolute temperature (20).
Straightforward application of the traditional thermodynamic approach (21) in a general framework is of limited use because the number of states that must be considered typically increases exponentially with the number of components (13). For instance, just the binding of the lac repressor to three DNA sites would lead to eight states, including states with zero, one, two, and three repressors bound to DNA. If DNA looping is taken into account, the number of states increases to 14. It has become clear recently that it is possible to overcome this limitation and express the free energy of all these states in a compact form by using binary variables (13). By extending the approach of Ref. (13) to consider multiple loops in the lac operon, we obtain
 |
where s1, s2, and s3 are binary variables that indicate whether (si = 1, for i = 1,2,3) or not (si = 0, for i = 1,2,3) a repressor is bound to O1, O2, and O3, respectively; and sL12, sL13, and sL23 are binary variables that indicate whether (sLij = 1, for ij = 12,13,23) or not (sLij = 0, for ij = 12,13,23) DNA forms the loops O1-O2, O1-O3, and O2-O3, respectively. For instance, using the notation s ≡ (s1, s2, s3, sL12, sL13, sL23) the state shown in Figure 1B is specified by s = (1,1,1,0,1,0) and that of Figure 1C, by s = (1,1,0,1,0,0). The subscripts of the different contributions to the free energy have the same meaning as those of the corresponding binary variables. In this case, with three interaction and three conformational free energies, it is possible to obtain the free energy of 14 states for different repressor concentrations. The dependence on the repressor concentration, n, enters the free energy through the positional free energy :  , where po is the positional free energy at 1 M concentration. An important advantage of the binary variable description is that it can straightforwardly implement ‘logical conditions’. For instance, the infinity in the last term of the free energy implements that two loops that share one operator cannot be present simultaneously by assigning an infinite free energy to those states.
The experimental observations, as summarized in Ref. (22), indicate that in the lac operon, transcription is completely abolished when the repressor is bound to O1. If O1 is free, transcription takes place either at an activated maximum rate τmax when O3 is free or at basal reduced rate χτmax when O3 is occupied. The reduction from the activated state by a factor χ arises because binding of the repressor to O3 prevents CAP, also known as cAMP Receptor Protein (CRP), from contacting the RNA polymerase and activating transcription (22). Activation is achieved when CAP bound to cyclic AMP (cAMP) binds between O3 and O1, contacts the RNA polymerase, and stabilizes its binding to the promoter (23,24). All these experimental facts can be accounted for by the transcription rate τ(s) expressed in terms of binary variables as
which provides a mathematical expression for the observed transcription control (22,25).
The concise mathematical expressions ΔG(s) and τ(s) completely specify the thermodynamic and transcriptional properties of the system. In particular, the repression level, defined as the maximum transcription over the actual average transcription rate, is given by  , where the average transcription rate follows from
  . Thus, with this approach, it is possible to obtain a compact description for both the DNA–repressor complex and the control of transcription that scales linearly with the number of regulatory elements (13).
RESULTS
Our model accurately reproduces the observed behavior of the lac operon (22) in quantitative detail over five orders of magnitude of the repression level for three repressor concentrations and eight strains with all the possible combinations of operator deletions (Figure 2). The values of the parameters used are the same as those previously reported (1) except for two small variations. One of the changes is a 0.35 kcal/mol shift in the affinity of the repressor for the operators. This difference falls within the typical variation for different experimental conditions. The other change is a decrease of 0.9 kcal/mol in the free energy of forming the O1-O3 loop. This decrease is consistent with stabilization of the loop by binding of CAP to its DNA site between O1 and O3, which has been estimated to be within −0.8 kcal/mol and −1.4 kcal/mol with an average value of −1.1 kcal/mol (26) and is similar to the values obtained for other proteins that bend DNA, such as the HU protein (27). Note that the experiments used to infer the free energies of looping (28,29) were performed with artificial constructs that did not contain the CAP-binding site within the loop. We have also observed that the experimental repression levels are better accounted for if the deletion of O1 is not considered to be complete. Explicitly, we infer that the binding of the repressor is not completely abolished but reduced by ∼5 kcal/mol, which is consistent with the mutation of just three base pairs of the operator (22). This strong reduction of affinity would be virtually indistinguishable from a complete deletion in a single operator setup, but it is not so in a multi-loop configuration.
Figure 2.

Repression level as a function of the repressor concentration for WT and all seven combinations of deletions of three operators. The repression levels in the presence of active CAP were obtained for WT and seven mutants accounting for all the combinations of deletions of the three operators. For each of the eight cases, the results of the model (red curves) as a function of the repressor concentration are compared with the experimental data (shaded blue squares) (22) available for three concentrations corresponding to 10 (WT cells), 50, and 900 repressors per cell. The particular set of WT or deleted (X) operators is indicated for each curve; for instance, O3-O1-O2 corresponds to WT lac operon and X-X-X, to the mutant with all three operators deleted. The excellent agreement indicates that the model not only captures the repression values quantitatively but also the shapes of the curves, which are very different depending on the mutant. The values of the parameters used are: e1=−27.8 kcal/mol, e2=−26.3 kcal/mol, e3=−24.1 kcal/mol, cL12 = 23.35 kcal/mol, cL13 = 22.05 kcal/mol, cL23 = 23.50 kcal/mol, p°= 15 kcal/mol, and χ = 0.03. A deleted operator is modeled by increasing its free energy by 5 kcal/mol. The two repression levels represented by broken squares in the graphs for O3-O1-O2 and O3-O1-X were not accurately measured in the experiments, as described by the authors in a subsequent publication (16).
The approach we have developed can straightforwardly be extended to study the induction curves of the lac operon, which provide the steady-state transcription rate as a function of the inducer concentration. Inducers, such as allolactose in the natural environment and isopropyl-β-d-thiogalactoside (IPTG) in typical experimental setups, bind to the repressor and impair its function (Figure 3). Specifically, each of the four identical monomeric components of the repressor can bind independently an inducer molecule. Each of the two dimers that form the tetrameric lac repressor has a DNA-binding domain. Binding of either one or two inducer molecules to a dimeric unit strongly reduces its affinity for operator DNA. Therefore, with one or two inducer molecules in the same dimeric domain, the repressor can bind strongly to one operator but cannot loop DNA; with two or more inducer molecules in different domains, strong operator binding is also abolished (Figure 3).
Figure 3.
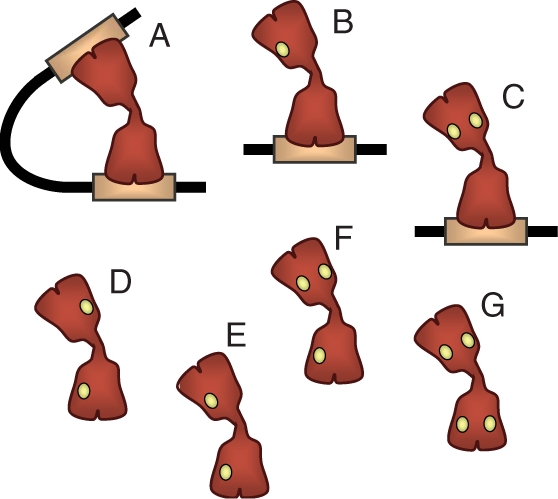
Inducer binding to the lac repressor. An inducer molecule, such as IPTG, can bind independently to each of the four identical monomeric units that form the lac repressor and impair its function. Without IPTG bound, each of the two dimers of the tetrameric repressor (in red) has a functional DNA-binding domain and can bind strongly to the operators (orange rectangle) and loop the intervening DNA (A). With one or two IPTG molecules (small yellow circles) bound to the same domain, the repressor can bind strongly to one operator but cannot loop DNA (B,C). With two or more IPTG molecules bound to different domains of the repressor, strong operator binding is abolished (D,E,F,G).
Our model accurately reproduces the observed in vivo induction properties of the lac operon when we consider as functional repressors only those that do not have any inducer bound. This approximation is very good because the simultaneous binding of a repressor to two operators on looped DNA is much stronger (∼600 times) than the binding to a single operator and because the repressor concentration is very low, about ten repressors per cell (see below for a more general treatment). Thus, the concentration of functional repressors is given by  , where nT is the total repressor concentration, PF is the probability that a monomer of the tetrameric repressor is not bound to IPTG, and
  is the probability that no IPTG molecule is bound to the repressor. The probability for a repressor monomer to be free of IPTG follows from
  , where [I] is the intracellular IPTG concentration and Ki is the inducer-repressor equilibrium dissociation constant (30). It is important to note that in vitro studies have found that IPTG can bind cooperatively when the operator DNA concentration is at least 100 nM (31). In vivo, however, as in the experiments considered here, such high operator concentrations are never reached (one operator per E. coli cell corresponds to a concentration of ∼1.5 nM).
For the reported value of Ki (30) and the previous values of the parameters, without any free parameter, our model reproduces exactly the experimentally observed induction curves (17) of cells with active CAP (Figure 4A; lower dashed red curve labeled ‘CAP’). The model, however, does not accurately reproduce the experimental data (Figure 4A; upper dashed red curve labeled ‘No CAP’) for induction of the lac operon without active CAP. We modeled this condition with the inferred value of the free energy of forming the O1-O3 loop in the absence of active CAP and with 
 , which considers that there is no activated transcription.
Figure 4.
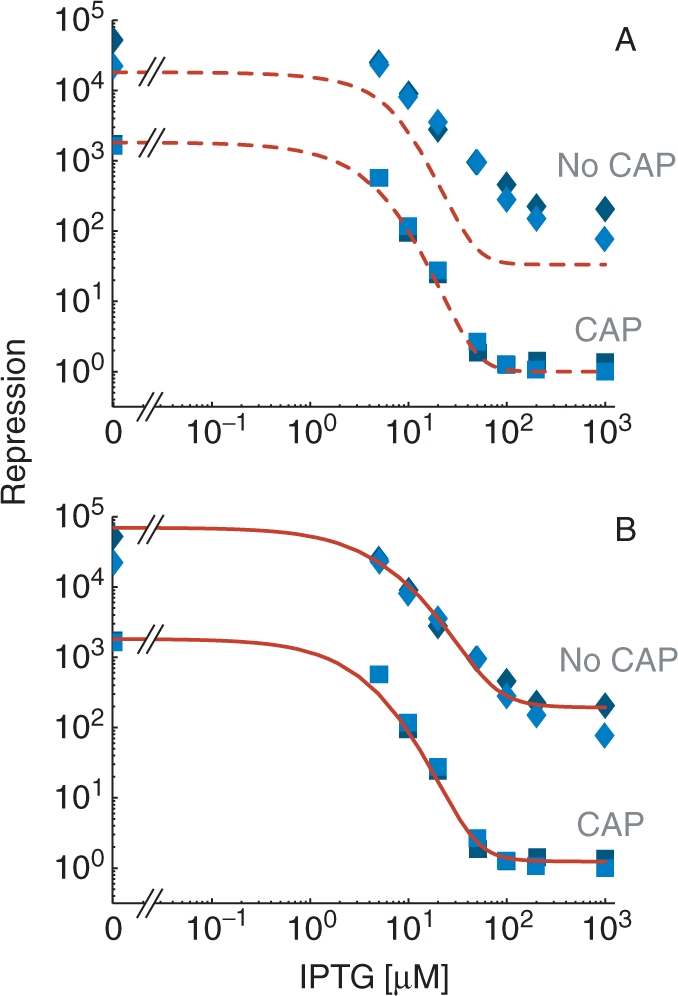
Induction curves of the lac operon for cellular conditions with and without active CAP. (A) The repression level in the presence of active CAP (lower curves labeled ‘CAP’) was obtained as a function of the concentration of the inducer IPTG for the model given by ΔG(s), τ(s), and  (dashed red lines) and compared with the experimental data from Ref. (17) (blue squares). The values of the parameters are the same as in Figure 2, with additional parameters KI = 6.9μM and nT = 15 nM. In the absence of active CAP (upper curves, labeled ‘No CAP’), the model (dashed red lines) does not accurately reproduce the experimental data from Ref. (17) (blue diamonds). We consider that without active CAP, in addition to a reduced transcription
  , the formation of the O1-O3 loop is 0.9 kcal/mol more costly (c'L13 = 22.95 kcal/mol) than with CAP. (B) The excellent agreement with induction experiments in the absence of active CAP is recovered when the model is generalized to include an arbitrary number of repressor molecules per cell through the expressions ΔGF(s), τF(s), n, nd, and ni, with same values of the parameters as in panel A, with the additional parameter r = 2.8 kcal/mol and 200 repressors per cell (nT = 300 nM) (upper continuous red line). In the presence of active CAP, the generalized model (lower continuous red line) recovers the results in panel A for low number of repressors (nT = 15 nM).
Previous studies based on phenomenological models have shown that, it is possible to fit the experimental results by assuming that the absence of active CAP reduces the effects of looping in repression by a factor ∼10 (17). However, such a factor appears to be extremely high because half of the contribution to repression comes from the O1-O2 loop, which is not affected by CAP. Therefore, within the current molecular view of the lac operon, the absence of CAP could only reduce the effects of looping by a factor ∼2 at most. Another possibility not considered so far is to assume a different repressor concentration, which has been found to depend on the binding of CAP in the regulatory region through the post-transcriptional effects of the SsrA system (32).
In the general case that accounts for arbitrary repressor concentrations, we need to consider also the concentration of repressors with one, 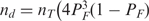
 , and two,
  , inducer-impaired DNA-binding domains (Figure 3). The concentration ni needs to be considered explicitly because the inducer substantially reduces the binding of the repressor to operator DNA but it does not abolish it completely (33). This ‘residual’ binding is taken into account by an offset r in the free energy of interaction with the operators. The expression of the free energy for the binding of the three repressor types is given by
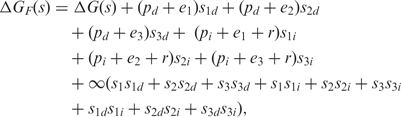 |
where d and i subscripts refer to the binding of repressors with one and two impaired DNA-binding domains, respectively. The corresponding positional free energies are given by  and
and  . The term RTln2 in the expression of pd takes into account that only one of the two DNA-binding domains is available for binding. The infinity in the last term implements that an operator cannot be occupied simultaneously by more than one repressor, which can be a repressor with zero, one, or two inducer-impaired DNA-binding domains. Note that other possible states, such as those accounting for looping of a repressor with inducer bound, are not taken into account because they are energetically very unfavorable for the observed large values of r.
Now, s ≡(s1, s2, s3, sL12, sL13, sL23, s1d, s2d, s3d, s1i, s2i, s3i) specifies the state of the protein–DNA complex through the values of 12 binary variables. The number of states has increased from 14 to 76 but the only additional parameter is r, which has been measured experimentally (r = 2.8 kcal/mol) using operator fragment binding analysis (33).
The control of transcription is as follows: occupancy of O1 by any repressor type always prevents transcription, and occupancy of O3 prevents activated transcription when active CAP is present (if active CAP is absent, there is never activated transcription). Therefore, the mathematical expression of the transcription rate in the presence of active CAP is
and in the absence of active CAP is
Note that these expressions use the fact that only one of the variables s1, s1d, s1i and only one of the variables s3, s3d, s3i can be one at a given time.
The experimental data in the absence of active CAP is reproduced in detail just by setting the repressor concentration to 300 nM, equivalent to 200 repressors per cell (Figure 4B; upper full red curve labeled ‘No CAP’). This repressor concentration is 10 times higher than that of wild type with active CAP but 4.5 times smaller than that of the mutants studied in Ref. (22) that express 900 repressors per cell. In the presence of active CAP, the results obtained are in excellent agreement with both the experimental data (Figure 4B; lower full red curve labeled ‘CAP’) and the low-repressor concentration model (Figure 4A; lower dashed red curve labeled ‘CAP’). Thus, the general model accurately reproduces the experimental observations in the whole range of IPTG concentrations and cellular conditions with and without active CAP.
DISCUSSION
Regulation of gene expression by the assembly of protein–DNA complexes is strongly dependent on networks of molecular interactions that extend beyond simple binding events. A key issue is, therefore, to understand how the underlying molecular complexity shapes gene expression and controls the cellular behavior. Here we have shown that, in the case of the lac operon, incorporation of the molecular details—such as the presence of multiple DNA loops, the stabilization of loops by DNA-binding proteins, and residual binding of inducer-inactivated repressors and deleted sites—is crucial for the development of fully predictive models. Our results illustrate how to accurately infer the effects of multiple distal DNA-binding sites from the thermodynamic properties of the molecular components and provide new insights into the detailed functioning of the lac operon, including the role of CAP and the effects of the inducer.
Two key features of the thermodynamic approach we have implemented are the decomposition of the free energy of protein–DNA complexes into different modular contributions and the description of the different molecular states through binary variables. These two features taken together lead to concise mathematical expressions that completely specify the thermodynamic and transcriptional properties of all the states of the protein–DNA complex from just a few molecular parameters. In this way, we are able to circumvent one of the major issues that have precluded the development of computational approaches to study complex gene regulation systems; namely, the individual specification of the properties of all the potential states of the complex, which typically results in large itemized lists that increase exponentially with the number of interactions and components (13,34,35). Here we have shown explicitly with the lac operon that our approach can successfully be scaled up to include multiple molecular species, binding sites, and DNA loops.
Fully predictive computational approaches able to efficiently address multiple complex interactions, like the one we have implemented here, are becoming increasingly important not only for understanding gene regulation in natural systems but also for designing synthetic genetic networks with multiple components (36,37). This type of computational approaches is especially important because complex systems can reveal the effects of molecular details that were hidden in simpler setups used to characterize the components (38).
ACKNOWLEDGEMENTS
Funding to pay the Open Access publication charges for this article was provided by the Sloan-Kettering Institute for Cancer Research.
Conflict of interest statement. None declared.
REFERENCES
- 1.Saiz L, Vilar JMG. DNA looping: the consequences and its control. Curr. Opin. Struct. Biol. 2006;16:344–350. doi: 10.1016/j.sbi.2006.05.008. [DOI] [PubMed] [Google Scholar]
- 2.Maston GA, Evans SK, Green MR. Transcriptional regulatory elements in the human genome. Annu. Rev. Genomics Hum. Genet. 2006;7:29–59. doi: 10.1146/annurev.genom.7.080505.115623. [DOI] [PubMed] [Google Scholar]
- 3.Tolhuis B, Palstra RJ, Splinter E, Grosveld F, de Laat W. Looping and interaction between hypersensitive sites in the active beta-globin locus. Mol. Cell. 2002;10:1453–1465. doi: 10.1016/s1097-2765(02)00781-5. [DOI] [PubMed] [Google Scholar]
- 4.Alberts B. Molecular Biology of the Cell. 4th. New York: Garland Science; 2002. [Google Scholar]
- 5.Blackwood EM, Kadonaga JT. Going the distance: a current view of enhancer action. Science. 1998;281:60–63. doi: 10.1126/science.281.5373.60. [DOI] [PubMed] [Google Scholar]
- 6.Schleif R. DNA looping. Annu. Rev. Biochem. 1992;61:223–199. doi: 10.1146/annurev.bi.61.070192.001215. [DOI] [PubMed] [Google Scholar]
- 7.Yasmin R, Yeung KT, Chung RH, Gaczynska ME, Osmulski PA, Noy N. DNA-looping by RXR tetramers permits transcriptional regulation “at a distance”. J. Mol. Biol. 2004;343:327–338. doi: 10.1016/j.jmb.2004.08.070. [DOI] [PubMed] [Google Scholar]
- 8.Stenger JE, Tegtmeyer P, Mayr GA, Reed M, Wang Y, Wang P, Hough PV, Mastrangelo IA. p53 oligomerization and DNA looping are linked with transcriptional activation. EMBO J. 1994;13:6011–6020. doi: 10.1002/j.1460-2075.1994.tb06947.x. [DOI] [PMC free article] [PubMed] [Google Scholar]
- 9.Su W, Middleton T, Sugden B, Echols H. DNA looping between the origin of replication of Epstein-Barr virus and its enhancer site: stabilization of an origin complex with Epstein-Barr nuclear antigen 1. Proc. Natl Acad. Sci. USA. 1991;88:10870–10874. doi: 10.1073/pnas.88.23.10870. [DOI] [PMC free article] [PubMed] [Google Scholar]
- 10.Grindley ND, Whiteson KL, Rice PA. Mechanisms of site-specific recombination. Annu. Rev. Biochem. 2006;75:567–605. doi: 10.1146/annurev.biochem.73.011303.073908. [DOI] [PubMed] [Google Scholar]
- 11.Segal E, Fondufe-Mittendorf Y, Chen L, Thastrom A, Field Y, Moore IK, Wang JP, Widom J. A genomic code for nucleosome positioning. Nature. 2006;442:772–778. doi: 10.1038/nature04979. [DOI] [PMC free article] [PubMed] [Google Scholar]
- 12.de Lange T. T-loops and the origin of telomeres. Nat. Rev. Mol. Cell Biol. 2004;5:323–329. doi: 10.1038/nrm1359. [DOI] [PubMed] [Google Scholar]
- 13.Saiz L, Vilar JMG. Stochastic dynamics of macromolecular-assembly networks. Mol. Syst. Biol. 2006;2 doi: 10.1038/msb4100061. 2006.0024. [DOI] [PMC free article] [PubMed] [Google Scholar]
- 14.Müller-Hill B. The lac Operon: A Short History of a Genetic Paradigm. Berlin, New York: Walter de Gruyter; 1996. [Google Scholar]
- 15.Lewis M, Chang G, Horton NC, Kercher MA, Pace HC, Schumacher MA, Brennan RG, Lu P. Crystal structure of the lactose operon repressor and its complexes with DNA and inducer. Science. 1996;271:1247–1254. doi: 10.1126/science.271.5253.1247. [DOI] [PubMed] [Google Scholar]
- 16.Oehler S, Amouyal M, Kolkhof P, von Wilcken-Bergmann B, Muller-Hill B. Quality and position of the three lac operators of E. coli define efficiency of repression. EMBO J. 1994;13:3348–3355. doi: 10.1002/j.1460-2075.1994.tb06637.x. [DOI] [PMC free article] [PubMed] [Google Scholar]
- 17.Kuhlman T, Zhang Z, Saier MH, Jr, Hwa T. Combinatorial transcriptional control of the lactose operon of Escherichia coli. Proc. Natl Acad. Sci. USA. 2007;104:6043–6048. doi: 10.1073/pnas.0606717104. [DOI] [PMC free article] [PubMed] [Google Scholar]
- 18.Narang A. Effect of DNA looping on the induction kinetics of the lac operon. J. Theor. Biol. 2007;247:695–712. doi: 10.1016/j.jtbi.2007.03.030. [DOI] [PubMed] [Google Scholar]
- 19.Vilar JMG, Saiz L. DNA looping in gene regulation: from the assembly of macromolecular complexes to the control of transcriptional noise. Curr. Opin. Genet. Dev. 2005;15:136–144. doi: 10.1016/j.gde.2005.02.005. [DOI] [PubMed] [Google Scholar]
- 20.Hill TL. An Introduction to Statistical Thermodynamics. Addison-Wesley, Reading, Massachusetts; 1960. [Google Scholar]
- 21.Ackers GK, Johnson AD, Shea MA. Quantitative model for gene regulation by lambda phage repressor. Proc. Natl Acad. Sci. USA. 1982;79:1129–1133. doi: 10.1073/pnas.79.4.1129. [DOI] [PMC free article] [PubMed] [Google Scholar]
- 22.Oehler S, Eismann ER, Kramer H, Muller-Hill B. The three operators of the lac operon cooperate in repression. EMBO J. 1990;9:973–979. doi: 10.1002/j.1460-2075.1990.tb08199.x. [DOI] [PMC free article] [PubMed] [Google Scholar]
- 23.Benoff B, Yang H, Lawson CL, Parkinson G, Liu J, Blatter E, Ebright YW, Berman HM, Ebright RH. Structural basis of transcription activation: the CAP-alpha CTD-DNA complex. Science. 2002;297:1562–1566. doi: 10.1126/science.1076376. [DOI] [PubMed] [Google Scholar]
- 24.Busby S, Ebright RH. Transcription activation by catabolite activator protein (CAP) J. Mol. Biol. 1999;293:199–213. doi: 10.1006/jmbi.1999.3161. [DOI] [PubMed] [Google Scholar]
- 25.Setty Y, Mayo AE, Surette MG, Alon U. Detailed map of a cis-regulatory input function. Proc. Natl Acad. Sci. USA. 2003;100:7702–7707. doi: 10.1073/pnas.1230759100. [DOI] [PMC free article] [PubMed] [Google Scholar]
- 26.Hudson JM, Fried MG. Co-operative interactions between the catabolite gene activator protein and the lac repressor at the lactose promoter. J. Mol. Biol. 1990;214:381–396. doi: 10.1016/0022-2836(90)90188-R. [DOI] [PubMed] [Google Scholar]
- 27.Saiz L, Vilar JMG. Multilevel deconstruction of the in vivo behavior of looped DNA-protein complexes. PLoS ONE. 2007;2:e355. doi: 10.1371/journal.pone.0000355. [DOI] [PMC free article] [PubMed] [Google Scholar]
- 28.Muller J, Oehler S, Muller-Hill B. Repression of lac promoter as a function of distance, phase and quality of an auxiliary lac operator. J. Mol. Biol. 1996;257:21–29. doi: 10.1006/jmbi.1996.0143. [DOI] [PubMed] [Google Scholar]
- 29.Saiz L, Rubi JM, Vilar JMG. Inferring the in vivo looping properties of DNA. Proc. Natl Acad. Sci. USA. 2005;102:17642–17645. doi: 10.1073/pnas.0505693102. [DOI] [PMC free article] [PubMed] [Google Scholar]
- 30.Oehler S, Alberti S, Muller-Hill B. Induction of the lac promoter in the absence of DNA loops and the stoichiometry of induction. Nucleic Acids Res. 2006;34:606–612. doi: 10.1093/nar/gkj453. [DOI] [PMC free article] [PubMed] [Google Scholar]
- 31.Swint-Kruse L, Matthews KS. Thermodynamics, protein modification, and molecular dynamics in characterizing lactose repressor protein: strategies for complex analyses of protein structure-function. Meth. enzymol. 2004;379:188–209. doi: 10.1016/S0076-6879(04)79011-4. [DOI] [PubMed] [Google Scholar]
- 32.Abo T, Inada T, Ogawa K, Aiba H. SsrA-mediated tagging and proteolysis of LacI and its role in the regulation of lac operon. EMBO J. 2000;19:3762–3769. doi: 10.1093/emboj/19.14.3762. [DOI] [PMC free article] [PubMed] [Google Scholar]
- 33.Horton N, Lewis M, Lu P. Escherichia coli lac repressor-lac operator interaction and the influence of allosteric effectors. J. Mol. Biol. 1997;265:1–7. doi: 10.1006/jmbi.1996.0706. [DOI] [PubMed] [Google Scholar]
- 34.Borisov NM, Markevich NI, Hoek JB, Kholodenko BN. Signaling through receptors and scaffolds: independent interactions reduce combinatorial complexity. Biophys. J. 2005;89:951–966. doi: 10.1529/biophysj.105.060533. [DOI] [PMC free article] [PubMed] [Google Scholar]
- 35.Bray D, Duke T. Conformational spread: the propagation of allosteric states in large multiprotein complexes. Annu. Rev. Biophys. Biomol. Struct. 2004;33:53–73. doi: 10.1146/annurev.biophys.33.110502.132703. [DOI] [PubMed] [Google Scholar]
- 36.Guet CC, Elowitz MB, Hsing W, Leibler S. Combinatorial synthesis of genetic networks. Science. 2002;296:1466–1470. doi: 10.1126/science.1067407. [DOI] [PubMed] [Google Scholar]
- 37.Guido NJ, Wang X, Adalsteinsson D, McMillen D, Hasty J, Cantor CR, Elston TC, Collins JJ. A bottom-up approach to gene regulation. Nature. 2006;439:856–860. doi: 10.1038/nature04473. [DOI] [PubMed] [Google Scholar]
- 38.Vilar JMG. Modularizing gene regulation. Mol. Syst. Biol. 2006;2 doi: 10.1038/msb4100058. 2006.0016. [DOI] [PMC free article] [PubMed] [Google Scholar]