Abstract
As demonstrated by anatomical and physiological studies, the cerebral cortex consists of groups of cortical modules, each comprising populations of neurons with similar functional properties. This functional modularity exists in both sensory and association neocortices. However, the role of such cortical modules in perceptual and cognitive behavior is unknown. To aid in the examination of this issue we have applied the high spatial resolution optical imaging methodology to the study of awake, behaving animals. In this paper, we report the optical imaging of orientation domains and blob structures, approximately 100–200 μm in size, in visual cortex of the awake and behaving monkey. By overcoming the spatial limitations of other existing imaging methods, optical imaging will permit the study of a wide variety of cortical functions at the columnar level, including motor and cognitive functions traditionally studied with positron-emission tomography or functional MRI techniques.
Optical imaging of intrinsic cortical signals detects areal differences in tissue reflectance that are caused by changes in blood oxygenation driven by functionally specific neural activity (1). This method has enabled the visualization of functional organizations in visual (2–6), auditory (7), and somatosensory (8, 9) cortical areas. However, because it has been applied almost exclusively to anesthetized preparations, this method has been limited to the study of passive activations of these sensory systems. Thus, factors that affect sensory and perceptual processes, such as attention, arousal, and motivation, have been beyond the scope of optical imaging, as have been motor and cognitive phenomena. To adapt this method for use in the awake, behaving animal requires methods that minimize noise sources that may easily obscure the small size of functionally driven changes in optical reflectance (<0.1%). These noise sources include mechanical motion, such as that arising from the animal’s movements, and greater variation in physiological parameters in the awake animal that introduce variability in blood flow. In a previous study, Grinvald and colleagues (10) were successful in using optical imaging methods to map ocular dominance columns, which are 400–500 μm in width, in V1 of the awake, untrained monkey. In this paper, using advances we have made in mechanical, surgical, and analytical methods (unpublished work), we report the imaging of 100- to 200-μm functional domains in the visual cortex of the awake, trained macaque monkey.
MATERIALS AND METHODS
Subjects.
Five adult monkeys were used in this study. The monkeys were individually housed and maintained on a water deprivation regimen. Care of the monkeys was in accordance with the Yale Animal Care and Use Committee.
Surgery.
For optical imaging sessions under anesthesia (see ref. 11), animals were anesthetized (sodium pentothal 1–2 mg/kg per hr) and paralyzed (vecuronium bromide 100 μg/kg per hr) and implanted with optical chambers. Animals then were implanted with a head-restraint post. Before imaging in the awake animal, a craniotomy and durotomy were opened on each side, and a clear artificial dura was implanted (12).
Behavioral Tasks.
Monkeys were trained to sit still and fixate while head-restrained in a custom-designed, rigid testing apparatus. During alternating fixation periods, drifting horizontal or vertical lines were displayed on the computer monitor, each for 2.2–2.5 sec. Stimuli were presented either binocularly or monocularly by using a mechanical shutter placed in front of the eye. Eye position was monitored by using an IR eye tracking system (ISCAN, Cambridge, MA). Imaging sessions began in trained monkeys after monkeys were able to maintain fixation for up to several seconds. During this task, the camera (Imager 2001) was positioned on a rigid camera mount over the chamber, the cortex was illuminated with 630-nm wavelength light, and images were acquired.
Data Analysis.
All analyses were conducted on a UNIX computer system. Software was developed for alignment of images acquired in different sessions. Analyses included first-frame subtraction, derivative analyses, and subtraction analyses. Time series for individual stimuli were acquired by comparing each frame with the stimulus onset frame.
RESULTS AND DISCUSSION
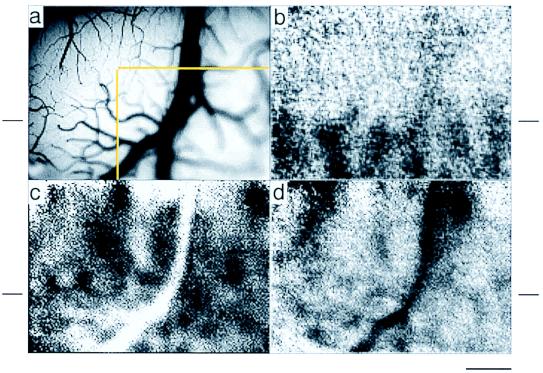
To compare activations obtained in the awake animal with that in the anesthetized animal, we first obtained optical images of known functional organization in visual cortex in the anesthetized animal. These standard optical imaging procedures involve stabilization of brain pulsations with an optical chamber filled with a lightweight silicone oil (cf. refs. 1 and 11). To minimize variability in blood flow patterns, image acquisition normally is synchronized with respiratory and cardiac cycles. As a test of the feasibility of imaging in the awake animal, we imaged without such synchronization in the anesthetized animal. Fig. 1 illustrates the region overlying an anesthetized macaque visual cortex (a) in which images of V1 ocular dominance columns (b), orientation domains in V1 and V2 (c), and thick and thin stripes in V2 (d) were obtained (cf. refs. 2 and 11). Typical of imaging in anesthetized monkey visual cortex, 10–20 trials were sufficient for obtaining these images. Thus, despite lack of physiological synchronization, it is still possible to obtain optical images of small functional domains in visual cortex (cf. ref. 10).
Figure 1.
Optical imaging of functional organization in the visual cortex of the anesthetized monkey. Synchronization to respiratory or cardiac cycles was not used. Sum of 20 trials. (a) Blood vessel map of imaged area of visual cortex. Yellow outline indicates part of region shown in Fig. 2. (b) Ocular dominance map revealing alternating left eye (dark) and right eye (light) ocular dominance columns in V1. This map delineates the sharp border between V1 and V2 (indicated by short horizontal line beside each panel). (c) Orientation map generated by subtracting images acquired during presentation of drifting horizontal gratings (dark patches) from those acquired during presentation of drifting vertical gratings (light patches). As previously shown (2, 11, 13), small orientation domains (100–200 μm) are mapped in V1, while those in V2 are significantly larger and overlay the thick and pale stripes. (d) General activation map, obtained in response to binocular presentation of low spatial frequency stimuli, reveals thick and thin stripes in V2. (Scale bar = 1 mm.)
To further assess the feasibility of conducting optical recordings in the awake monkey, images were obtained in the same monkey in the awake, but untrained state. The monkey was surgically implanted with optical chambers over visual cortices and head-restraint hardware. After recovery, and before behavioral training, we reimaged the same cortical area. A mechanical shutter was placed in front of one eye, and images obtained during monocular and binocular viewing were compared. During imaging, the monkey looked around freely and was manually rewarded for looking at the computer monitor on which drifting horizontal and vertical gratings or lines were shown. Because the animal was naive to behavioral training, many images were distorted by motion artifacts associated with the animal’s body movements. Under these conditions, only 16 of 52 total trials were usable. A noisy ocular dominance map in V1 was obtained (not shown), but we were unable to obtain any other functional maps. Thus, the signal variability and motion artifact in the awake, untrained animal is sufficiently large to prevent the mapping of smaller functional areas such as orientation domains or blobs.
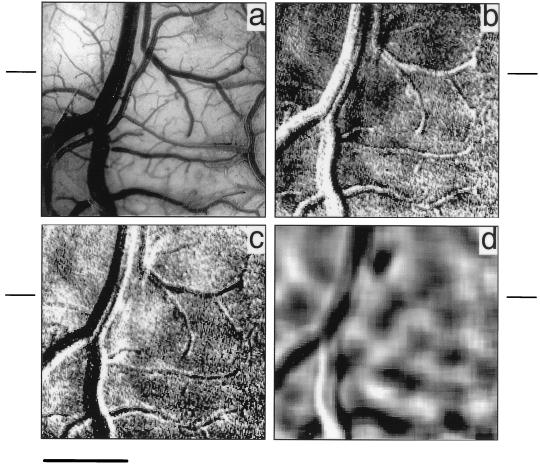
To reduce motion artifacts and minimize signal variability, we trained the monkey to sit calmly and to fixate on a small, centrally placed dot on a computer monitor for several seconds at a time. During such fixation, horizontal and vertical line stimuli were presented on the monitor. After reaching a satisfactory level of performance on this fixation task, we again recorded from the same visual area in this trained monkey (Fig. 2a). In contrast to the maps obtained during the untrained state, this imaging session yielded clear orientation maps in V1 and V2. Fig. 2b is a map obtained during the presentation of horizontal drifting lines; dark domains are regions responsive to horizontal stimuli and light regions are those less activated by horizontal stimuli. A similarly obtained map in response to vertical drifting lines is shown in Fig. 2c, where dark regions are those with strong vertical responsiveness. Note the complementary patterns of these two maps, where dark areas of activation elicited from horizontal stimuli in Fig. 2b overlay light patches in the vertical activation map in Fig. 2c. Fig. 2d is a subtraction image (horizontal minus vertical), where dark regions are associated with horizontally responsive domains and light regions with vertically responsive domains. In contrast to maps obtained in the untrained animal, of 52 trials, all produced usable maps and were summed to produce the images in Fig. 2 b–d. Consistent with results obtained in the anesthetized animal, these imaged orientation domains are approximately 200 μm in size (scale bar = 1 mm).
Figure 2.
Optical imaging of functional organization in the awake and trained monkey. Sum of 52 trials. (a) Blood vessel map of imaged area (see yellow outline in Fig. 1). (b) Horizontal single-condition map (subtracting images acquired during end of stimulus period from beginning), generated from presentation of horizontal drifting lines. (c) Vertical single-condition map generated from presentation of vertical drifting lines. (d) Horizontal (dark) vs. vertical (light) differential map; low-passed. (Scale bar = 1 mm.)
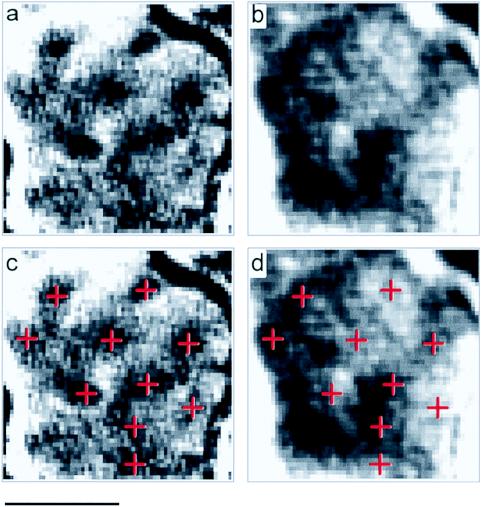
Another prominent feature of primate primary visual cortex is the so-called cytochrome oxidase blobs. These structures, which measure approximately 200 μm in size, contain cells with prominent color selectivity and low spatial frequency preferences (14, 15). These can be visualized in the anesthetized monkey by imaging for low spatial frequencies, monocularity, or color (2). We used a similar strategy to image blobs in the awake animal. In a second animal, which also was trained on the fixation task, we imaged visual cortex by using horizontal and vertical low spatial frequency gratings presented to one or both eyes. Fig. 3a illustrates the map resulting from a subtraction of images obtained during monocular and binocular stimulation. The activated punctate domains (indicated by crosses in Fig. 3c) are consistent in size (100–200 μm) and spacing to the blobs previously described in V1 (e.g., ref. 1) and align with the center of ocular dominance columns (Fig. 3b, compare Fig. 3 c and d, cf. ref. 2). Thus, the location, size, and spacing of these domains indicate that they are V1 blob activations.
Figure 3.
Optical imaging of blob domains in V1 of the awake, trained monkey. (a) A monocular (dark) vs. binocular (light) subtraction revealing punctate regions of activation, measuring 100–200 μm in size. Sum of two trials. (b) Ocular dominance bands (diagonally oriented alternating dark and light bands) in V1 demonstrated by mapping activation through left eye (dark regions). (c) Blob locations are indicated by crosses. Sum of two trials. (d) Crosses align along centers of ocular dominance bands. (Scale bar = 1 mm.)
We have shown that optical imaging of intrinsic cortical signals can be used to visualize functional modules as small as 100–200 μm in size in the awake, behaving monkey. This finding builds on the work of Grinvald and colleagues (10), who were the first to image ocular dominance columns (approximately 400–500 μm in size) in the awake animal.† In their untrained animal, 48 of 1,280 trials for each eye were selected to obtain these maps, thus requiring many more trials for sufficient signal relative to noise. We have found that in a well-trained animal, accompanied by sufficient mechanical and biological noise reduction and optimized analyses, even the small orientation domains can be visualized. Furthermore these signals can be obtained without post hoc selection of images for analysis.
This advance in optical recording methodology ushers in exciting possibilities for examining functional modules in the neocortex, the organization and size of which are yet unknown in many cortical areas. This relatively noninvasive, high spatial resolution approach is well-suited for studying the functional modularity of a wide variety of cortical areas, from sensory (14, 16–18) to association (19–21) neocortices. Thus, optical imaging promises to shed light on the neuroanatomy of many cortical functions, ranging from sensory and motor functions to cognitive functions such as attention, learning, and memory. Together with other imaging methods, such as functional MRI and positron-emission tomography, intrinsic signal imaging may forge a critical link between a large body of work in the nonhuman primate and brain imaging studies in humans (cf. refs. 22 and 23).
Acknowledgments
We thank Daniel Ts’o and Geoffrey Ghose for providing original image analysis software, Neil Guo for making significant improvements to old analysis software and generating new software, and Francine L. Healy for outstanding technical support. This work was supported by National Institutes of Health Grants F32 MH12186 (N.V.), R37 MH38546 (P.S.G.-R.), and R01 EY11744 (C.P.H. and A.W.R.), a Brown-Coxe Fellowship (B.M.R.), and the Sloan Foundation (A.W.R.).
Footnotes
Grinvald and colleagues have also recently optically recorded orientation domains in the awake monkey (personal communication).
References
- 1.Grinvald A, Frostig R D, Lieke E, Hildesheim R. Physiol Rev. 1988;68:1285–1366. doi: 10.1152/physrev.1988.68.4.1285. [DOI] [PubMed] [Google Scholar]
- 2.Ts’o D Y, Frostig R D, Lieke E E, Grinvald A. Science. 1990;249:417–420. doi: 10.1126/science.2165630. [DOI] [PubMed] [Google Scholar]
- 3.Bonhoeffer T, Grinvald A. Nature (London) 1991;353:429–431. doi: 10.1038/353429a0. [DOI] [PubMed] [Google Scholar]
- 4.Weliky M, Kandler K, Fitzpatrick D, Katz L C. Neuron. 1995;15:541–552. doi: 10.1016/0896-6273(95)90143-4. [DOI] [PubMed] [Google Scholar]
- 5.Chapman B, Stryker M P, Bonhoeffer T. J Neurosci. 1996;16:6443–6453. doi: 10.1523/JNEUROSCI.16-20-06443.1996. [DOI] [PMC free article] [PubMed] [Google Scholar]
- 6.Sheth B R, Sharma J, Rao S C, Sur M. Science. 1996;274:2110–2115. doi: 10.1126/science.274.5295.2110. [DOI] [PubMed] [Google Scholar]
- 7.Bakin J S, Kwon M C, Masino S A, Weinberger N M, Frostig R D. Cereb Cortex. 1996;6:120–130. doi: 10.1093/cercor/6.2.120. [DOI] [PubMed] [Google Scholar]
- 8.Masino S A, Kwon M C, Dory Y, Frostig R D. Proc. Natl Acad Sci USA. 1993;90:9998–10002. doi: 10.1073/pnas.90.21.9998. [DOI] [PMC free article] [PubMed] [Google Scholar]
- 9.Tommerdahl M, Delemos K A, Favorov O V, Metz C B, Viereck C J, Jr, Whitsel B L. J Neurophysiol. 1998;80:3272–3283. doi: 10.1152/jn.1998.80.6.3272. [DOI] [PubMed] [Google Scholar]
- 10.Grinvald A, Frostig R D, Siegel R M, Bartfeld E. Proc Natl Acad Sci USA. 1991;88:11559–11563. doi: 10.1073/pnas.88.24.11559. [DOI] [PMC free article] [PubMed] [Google Scholar]
- 11.Roe A W, Ts’o D Y. J Neurosci. 1995;15:3689–3715. doi: 10.1523/JNEUROSCI.15-05-03689.1995. [DOI] [PMC free article] [PubMed] [Google Scholar]
- 12.Sakas D E, Charnvises K, Borges L F, Zervas N T. J Neurosurg. 1990;73:936–941. doi: 10.3171/jns.1990.73.6.0936. [DOI] [PubMed] [Google Scholar]
- 13.Malach R, Tootell R B H, Malonek D. Cereb Cortex. 1994;4:151–165. doi: 10.1093/cercor/4.2.151. [DOI] [PubMed] [Google Scholar]
- 14.Livingstone M S, Hubel D H. J Neurosci. 1984;4:309–356. doi: 10.1523/JNEUROSCI.04-01-00309.1984. [DOI] [PMC free article] [PubMed] [Google Scholar]
- 15.Edwards D P, Purpura K P, Kaplan E. Vision Res. 1995;35:1501–1523. doi: 10.1016/0042-6989(94)00253-i. [DOI] [PubMed] [Google Scholar]
- 16.DeYoe E A, Felleman D J, Van Essen D C, McClendon E. Nature (London) 1994;371:151–154. doi: 10.1038/371151a0. [DOI] [PubMed] [Google Scholar]
- 17.Geesaman B J, Born R T, Andersen R A, Tootell R B. Cereb Cortex. 1997;7:749–757. doi: 10.1093/cercor/7.8.749. [DOI] [PubMed] [Google Scholar]
- 18.Fujita I, Tanaka K, Ito M, Cheng K. Nature (London) 1992;360:343–346. doi: 10.1038/360343a0. [DOI] [PubMed] [Google Scholar]
- 19.Goldman P S, Nauta W J H. Brain Res. 1977;122:393–413. doi: 10.1016/0006-8993(77)90453-x. [DOI] [PubMed] [Google Scholar]
- 20.Mountcastle V B, Lynch J C, Georgopoulos A, Sakata H, Acuna C. J Neurophysiol. 1975;38:871–907. doi: 10.1152/jn.1975.38.4.871. [DOI] [PubMed] [Google Scholar]
- 21.Friedman H R, Goldman-Rakic P S. J Neurosci. 1994;14:2775–2788. doi: 10.1523/JNEUROSCI.14-05-02775.1994. [DOI] [PMC free article] [PubMed] [Google Scholar]
- 22.Stefanacci L, Reber P, Costanza J, Wong E, Buxton R, Zola S, Squire L, Albright T. Neuron. 1998;20:1051–1057. doi: 10.1016/s0896-6273(00)80485-7. [DOI] [PubMed] [Google Scholar]
- 23.Dubowitz D J, Chen D-Y, Atkinson D J, Grieve K L, Gillikin B, Bradley W G, Jr, Andersen R A. NeuroReport. 1998;9:2213–2218. doi: 10.1097/00001756-199807130-00012. [DOI] [PubMed] [Google Scholar]


