

Abstract
The role of disulfide bridges in the structure, stability, and folding pathways of proteins has been the subject of wide interest in the fields of protein design and engineering. However, the relative importance of entropic and enthalpic contributions for the stabilization of proteins provided by disulfides is not always clear. Here, we perform a detailed analysis of the role of disulfides in the conformational stability of human Interleukin-4 (IL4), a four-helix bundle protein. In order to evaluate the contribution of two out of the three disulfides to the structure and stability of IL4, two IL4 mutants, C3T-IL4 and C24T-IL4, were used. NMR and ANS binding experiments were compatible with altered dynamics and an increase of the nonpolar solvent-accessible surface area of the folded state of the mutant proteins. Chemical and thermal unfolding experiments followed by fluorescence and circular dichroism revealed that both mutant proteins have lower conformational stability than the wild-type protein. Transition temperatures of unfolding decreased 14°C for C3T-IL4 and 10°C for C24T-IL4, when compared to WT-IL4, and the conformational stability, at 25°C, decreased 4.9 kcal/mol for C3T-IL4 and 3.2 kcal/mol for C24T-IL4. Interestingly, both the enthalpy and the entropy of unfolding, at the transition temperature, decreased in the mutant proteins. Moreover, a smaller change in heat capacity of unfolding was also observed for the mutants. Thus, disulfide bridges in IL4 play a critical role in maintaining the thermodynamic stability and core packing of the helix bundle.
Keywords: Interleukin-4, four-helix bundle, conformational stability, disulfide bridges, urea, thermal unfolding, enthalpy, entropy
Interleukin-4 (IL4) is a multifunctional hematopoietic cytokine mainly produced by activated T-cells, thymocytes, mast cells, and basophils. IL4 interacts with several immune cells including B- and T-lymphocytes, monocytes, macrophages, mast cells, myeloid and erythroid progenitors, fibroblasts, and endothelial cells (Duschl and Sebald 1996). Hematopoietic cytokines are pleiotropic and participate in a complex, and still not completely understood, network of cellular signaling. IL4 plays a major role in regulating the immune response in common allergies like rhinitis, conjunctivitis, or dermatitis; in more serious inflammations like allergic asthma; and in immune responses associated with cancer and AIDS.
The large family of hematopoietic cytokines is divided into three structural groups: short chain, long chain, and interferons. IL4 is a short-chain cytokine, sharing structural features with IL2 and the colony stimulating factors GM-CSF and M-CSF. IL4 has 129 amino acid residues, organized in a four-helix bundle with an up–up–down–down topology, a short anti-parallel β-sheet, and three disulfide bridges (Walter et al. 1992; Powers et al. 1993; Redfield et al. 1994). The disulfides formed by cysteine residues C3–C127, C24–C65, and C46–C99 are very much conserved among IL4 variants from different mammals and therefore may play an important role in preserving the structure and stability of this cytokine. Disulfide C3–C127 covalently links the two protein termini, C24–C65 links the two long loops AB and BC, and C46–C99 joins loop CD to helix B (Fig. 1).
Figure 1.

Ribbon representation of the tridimensional structure of human Interleukin-4, showing the four helices labeled A to D, a small anti-parallel β-sheet (arrows), and the three disulfide bridges C3–C127, C24–C65, and C46–C99. The representation was created with the program MOLSCRIPT (Kraulis 1991) using the coordinates of the NMR solution structure (1itm.pdb; Redfield et al. 1994).
Four-helix bundles are very common super-secondary structural motifs and have been associated with different biological functions, ranging from cell signaling and nucleic acid binding to electron transfer. The stability and elegance of this structural motif have been explored as a model for de novo design of proteins of pharmaceutical and nutritional interest. Several factors contribute to the stability of the bundle, namely, the hydrophobic effect that governs the formation of the core between the four amphipathic helices, the interaction between the helical macrodipoles in an anti-parallel orientation, and the size and composition of the loops between helices.
Although helical bundles are common among the hematopoietic cytokines, individual proteins differ considerably in amino acid sequence. Nevertheless, a pattern of conservation of disulfide bonds is found among cytokines, normally presenting one to three disulfides. The preservation of these structural elements during evolution proves their relevance for packing and stability of the native protein fold. In extracellular proteins, cysteine residues appear frequently in even numbers and are the second most conserved residues in proteins, only surpassed by tryptophan residues (Thornton 1981). Interestingly, proteins that act as toxins have several disulfide bridges to ensure their thermodynamic stability and resistance to proteolysis (Nayak et al. 1999).
Disulfide formation has been shown to be essential in determining the acquisition of the native fold of some proteins, with bovine pancreatic trypsin inhibitor (BPTI) the best studied example (Creighton 1974, 1997). Additionally, in several known cases, disulfide reduction leads to protein unfolding, indicating that disulfides are required for maintenance of the native conformation. Disulfide bridges were initially proposed to stabilize proteins by decreasing the conformational entropy of the denatured state (Schellman 1987; Pace et al. 1988). According to this model, the chain entropy model, the introduction of a disulfide may produce an increase in conformational stability [ΔG(H2O)] of up to 5 kcal/mol, at 25°C (Pace et al. 1988). However, Doig and Williams (1991) showed that the presence of a disulfide cross-link disfavors folding entropically but favors it enthalpically to a larger extent. Furthermore, other authors have specifically attributed the variation in unfolding energetics, in the presence of disulfides, to changes in the enthalpy of the native state (Kuroki et al. 1992; Hinck et al. 1996).
The present work assesses the effect of disulfide removal on the conformational stability of human Inter-leukin-4. To this end, two IL4 variants—C3T-IL4 and C24T-IL4 (Kruse et al. 1991)—were used, and alterations in their structure and thermodynamic stability were evaluated. Although the secondary structure of the mutant proteins is not significantly affected, these proteins seem to have a less well-packed protein core. For C3T-IL4 and C24T-IL4, the conformational stability [ΔG(H2O)], at 25°C, relative to wild type, decreases 4.9 and 3.2 kcal/mol, respectively. Additionally, the enthalpy (ΔHm) and entropy (ΔSm) of unfolding, at the transition temperature, and the change in heat capacity associated with protein unfolding (ΔCp) were also found to decrease in the mutant proteins.
Results and Discussion
Effect on protein structure and activity
Structural changes in Interleukin-4 upon disulfide removal were qualitatively evaluated by NMR, CD, and intrinsic fluorescence of wild-type (WT) and variants lacking one of the three disulfides of the normal protein. Figure 2 shows [1H-15N]HSQC NMR spectra of WT-IL4 and C24T-IL4, which lacks disulfide C24–C65. The C24T-IL4 spectrum (Fig. 2B) exhibits many chemical shift changes, when compared with the WT-IL4 spectrum (Fig. 2A). These spectral changes may indicate differences in protein structure and/or dynamics. However, the far-UV CD spectra of these proteins are superimposable (Fig. 3B), implying very similar secondary structures. Moreover, intrinsic fluorescence of WT-IL4 and C24T-IL4 shows overlapping emission spectra (Fig. 3A), indicating similar chemical environments around the single tryptophan residue (W91). Thus, the average native structures of WT-IL4 and C24T-IL4 must be very similar, and the differences observed in the NMR spectra may be due to local structural alterations and/or significant changes in protein dynamics. In fact, preliminary T1 and T2 NMR relaxation measurements on 15N-labeled C24T-IL4 (data not shown) allowed the identification of differences in the dynamics of some regions of this protein variant relative to WT-IL4.
Figure 2.
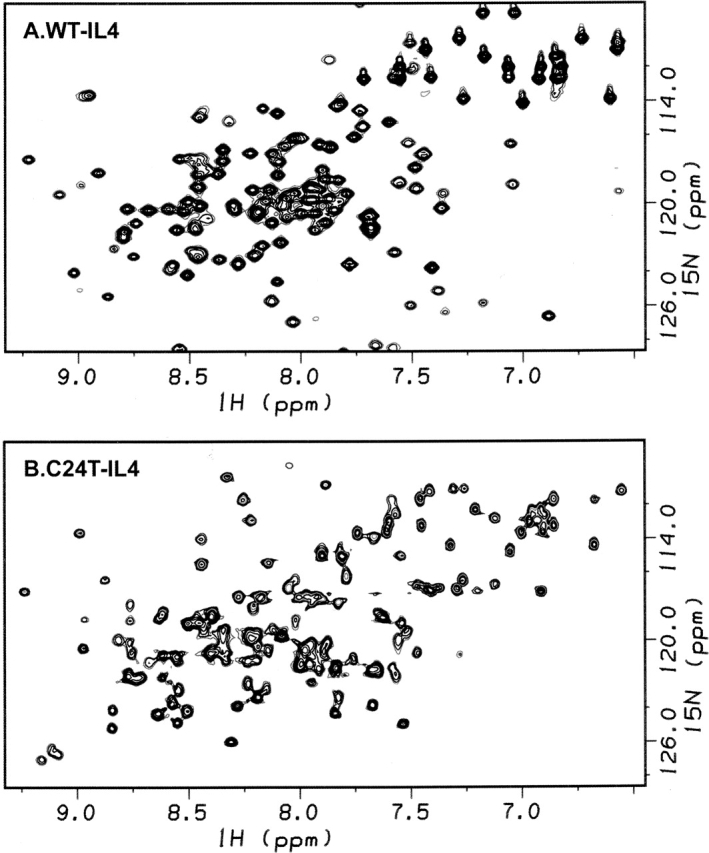
[1H-15N]HSQC NMR spectra of WT-IL4 (A) and C24T-IL4 (B) in 25 mM d3-acetic acid, 90% H2O, and 10% D2O (pH 5.1) at 25°C. The protein concentration was ~2 mM in both cases, and spectra were run at a 1H frequency of 500 MHz.
Figure 3.
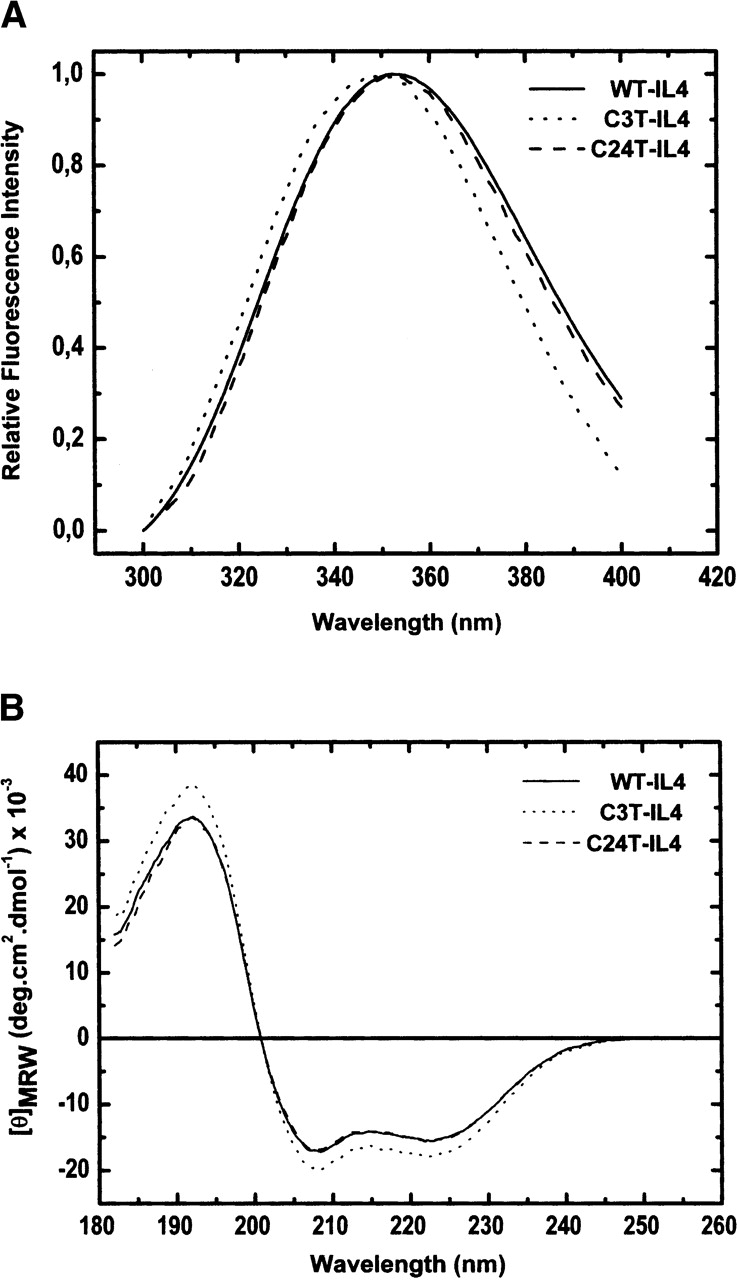
Fluorescence emission spectra (A) and far-UV CD spectra (B) of WT-, C3T-, and C24T-IL4, in 10 mM sodium phosphate buffer (pH 6.0) at 25°C. WT- and C24T-IL4 show fluorescence emission maxima at 352 nm, and C3T-IL4 at 347 nm. The double negative peak at 208 and 222 nm in the CD spectra indicates a high content of α-helix in the three proteins.
The role of disulfide C3–C127 was evaluated using the variant C3T-IL4. Although, the low solubility of this protein, at pH 5.1, precluded the NMR analysis, fluorescence and CD spectra showed significant differences for this protein. The fluorescence emission spectrum shows a 5-nm blue-shift in the C3T-IL4 emission maximum (Fig. 3A), indicating a more hydrophobic, less solvent-exposed environment for W91. Furthermore, an increase in the helical content is observed for C3T-IL4, as judged by the more intense peaks at 192, 208, and 222 nm, in the CD spectrum (Fig. 3B).
Quantitative analysis of the far-UV CD spectra, using the program CONTIN (EMBL-DA07) (Provencher 1982), produced an α-helical content of 57% for WT-IL4 and C24T-IL4, in agreement with the NMR solution structure of WT-IL4 (Redfield et al. 1994). According to this structure, 74 out of 129 residues form the four α-helices of the bundle. In contrast, for C3T-IL4, an α-helical content of 63% was obtained. Such an increase implies the recruitment of nearly eight more residues to extend pre-existing helices or to form new helices. Deletion of disulfide bridge C3–C127, which ties the two protein termini, may provide a less constrained environment and therefore facilitate the elongation of helices A and D toward the N terminus and the C terminus, respectively. Thus, fluorescence and CD indicate that the average structures of C24T- and WT-IL4 are very similar. However, in the case of C3T-IL4, a less solvent-exposed tryptophan residue (W91) and slightly longer A and D helices are suggested.
In order to evaluate the functional integrity of the mutant proteins, on and off rate constants were measured by surface plasmon resonance (Table 1). Dissociation constants, determined from the ratio of the rate constants, indicate a 15%–25% decrease on binding affinity of C3T- and C24T-IL4 for the α-chain receptor of human IL4 (IL4Rα). This small decrease may reflect the structural and dynamic changes observed in the native state of the mutant proteins, but it must be kept in mind that both the wild-type and the mutant proteins have extremely high affinities for the α-chain receptor. Thus, the small structural changes observed in the mutant proteins do not significantly alter the intermolecular interactions with the α-chain receptor of human IL4.
Table 1.
Rate constants and binding affinities of three IL4 variants to the α–chain receptor of human IL4 (IL4Rα) measured by surface plasmon resonance
| WT-IL4 | C3T-IL4 | C24T-IL4 | |
| kon (M−1 sec−1) | (2.3 ± 0.1)×107 | (1.6 ± 0.08) × 107 | (2.0 ± 0.1)×·107 |
| koff (sec−1) | (1.3 ± 6 0.6)×10−3 | (1.1 ± 0.5) × 10−3 | (1.5 ± 0.6)×·10−3 |
| Kd (M) | 5.6 × 10⁻¹¹ | 6.9 × 10⁻¹¹ | 7.5 × 10⁻¹¹ |
Effect on hydrophobic surface exposure
In order to elucidate the effect of disulfide bridges on the structural compactness of the folded state of IL4, we have performed ANS binding experiments with WT-, C24T-, and C3T-IL4 (Fig. 4). It is known that ANS binds to hydrophobic patches and crevices of many proteins, and has been commonly used to detect partially folded protein conformations. Titration of WT-IL4 with ANS shifts the emission maximum of the probe from 520 nm, the characteristic wavelength of the free probe in aqueous solution, to 490 nm (Fig. 4A). In the case of the mutant proteins, a much larger blue shift to 473 and 475 nm is observed for C3T-IL4 and C24T-IL4, respectively. Binding affinities of ANS to the three proteins were obtained from the titration curves (Fig. 4B). Apparent dissociation constants (Kd), assuming a simple protein–ligand binding equilibrium, were determined by nonlinear least squares fitting of Equations 1 and 2 (Materials and Methods) to the titration data (Fig. 4B). The titration curves fit well a one-site binding model, and the dissociation constants indicate decreasing affinity for ANS in the following order: C24T-IL4 (Kd = 2.9 μM) ≈ C3T-IL4 (Kd = 4.7 μM) ≫ WT-IL4 (Kd > 35 μM). Both the ANS emission maxima and the ANS dissociation constants show that the mutant proteins have a higher tendency to bind the fluorescent probe than the wild-type protein. This indicates that IL4 variants lacking one disulfide bridge expose a larger hydrophobic surface to the solvent. Despite the maintenance of the overall secondary structure content, the increase in hydrophobic surface exposure may reveal a less compact or a more accessible hydrophobic core, due, for example, to larger conformational fluctuations in the mutant proteins.
Figure 4.
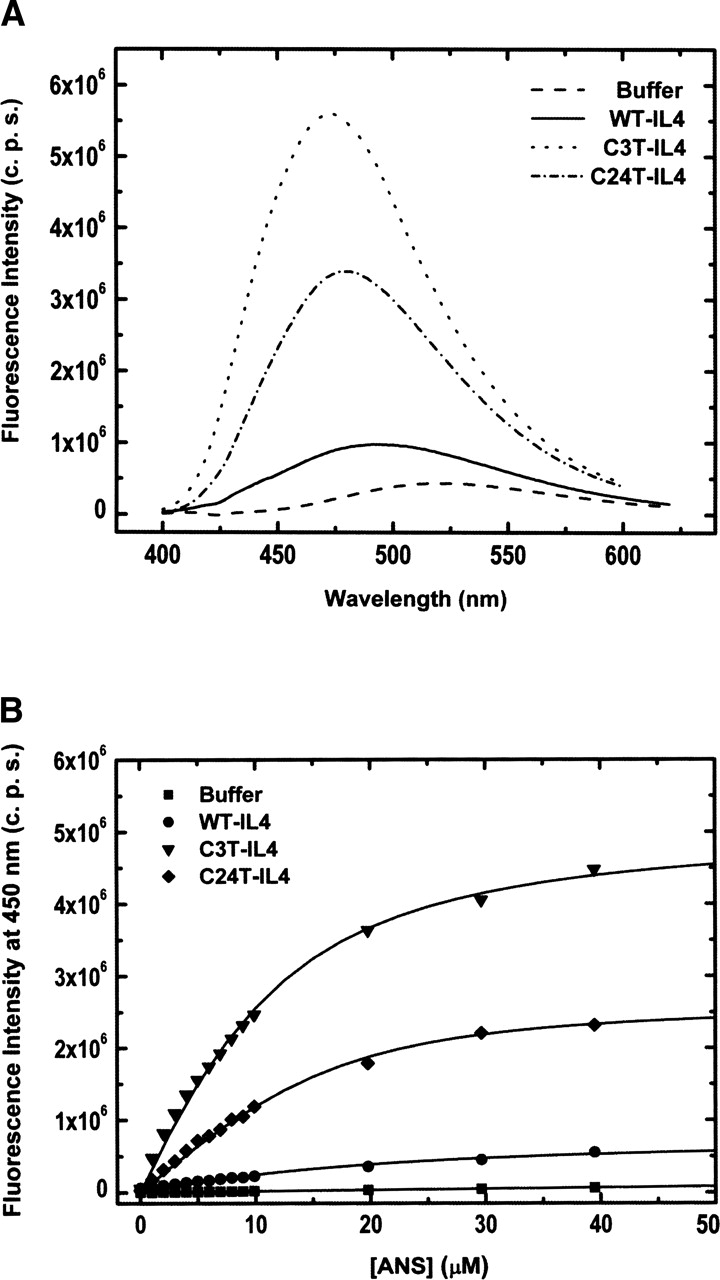
Titration of Interleukin-4 variants with ANS, followed by fluorescence spectroscopy. (A) Fluorescence emission spectra of 50 μM ANS free in solution and in the presence of 10 μM WT-, C3T-, and C24T-IL4. When bound to the IL4 mutants, the fluorescence intensity of the probe increases significantly and the emission maximum blue-shifts from 520 nm to ~475 nm. (B) ANS titration curves in 10 mM sodium phosphate (pH 6.0) at 25°C, using excitation and emission wavelengths of 370 and 450 nm, respectively. The lines are nonlinear least squares fits of Equations 1 and 2 (Materials and Methods) to the experimental data.
Chemical unfolding
Interleukin-4 has a single tryptophan residue (W91). Upon unfolding, the emission maximum of the three IL4 variants studied shifts to 356 nm, and the fluorescence intensity increases. These spectral changes allowed us to determine the thermodynamic stability of WT-, C3T-, and C24T-IL4, using isothermal urea-induced unfolding experiments, at temperatures ranging from 0.5°C to 40°C. As an example, Figure 5 shows the equilibrium unfolding curves obtained for the three IL4 variants at 25°C. All unfolding curves obtained fit well a two-state unfolding model (Equation 3, Materials and Methods). ΔG(H2O), the free energy change in the absence of denaturant, and m, the cooperativity of the unfolding transition, were obtained as fitting parameters, at each temperature studied (Table 2). At 25°C, the values obtained for the conformational stability [ΔG(H2O)] of WT-, C24T-, and C3T-IL4 are 9.3, 6.0, and 4.3 kcal/mol, respectively (Table 2). This relationship for the conformational stability of the three proteins was observed throughout the entire range of temperatures studied, with WT-IL4 the most stable protein and C3T-IL4 the less stable (Table 2). The urea concentration at the midpoint of the unfolding curve (Cm) shows a similar pattern, with the highest value for WT-IL4 and the lowest for C3T-IL4, at all temperatures. Thus, the absence of disulfide C3–C127 or C24–C65 produces proteins with lower conformational stability than the wild-type protein.
Figure 5.

Chemical unfolding profiles of WT-IL4, C3T-IL4, and C24T-IL4, at 25°C, followed by intrinsic protein fluorescence. Fluorescence intensity was monitored at excitation and emission wavelengths of 280 and 380 nm, respectively. Protein concentrations were 10 μM, in 10 mM sodium phosphate (pH 6.0). Protein samples were incubated for 20 h at several urea concentrations. The lines are nonlinear least squares fits of Equation 3 (Materials and Methods) to the experimental data.
Table 2.
Stability parameters obtained from urea unfolding curves of WT-, C3T-, and C24T-IL4, at several temperatures
| WT-IL4 | C3T-IL4 | C24T-IL4 | |||||||
| T (°C) | ΔGa | mb | Cmc | ΔGa | mb | Cmc | ΔGa | mb | Cmc |
| 0.5 | — | — | — | 4.0 ± 0.2 | 1.1 ± 0.08 | 3.6 ± 0.3 | — | — | — |
| 5.0 | 8.5 ± 0.4 | 1.5 ± 0.07 | 5.7 ± 0.4 | 4.3 ± 0.4 | 1.1 ± 0.10 | 3.9 ± 0.4 | 6.0 ± 0.5 | 1.4 ± 0.11 | 4.3 ± 0.3 |
| 10.0 | — | — | — | 4.6 ± 0.3 | 1.2 ± 0.08 | 3.8 ± 0.3 | — | — | — |
| 15.0 | 9.4 ± 0.6 | 1.4 ± 0.10 | 6.7 ± 0.6 | 4.4 ± 0.4 | 1.0 ± 0.10 | 4.4 ± 0.5 | 6.4 ± 0.4 | 1.2 ± 0.08 | 5.3 ± 0.4 |
| 20.0 | 9.2 ± 0.3 | 1.2 ± 0.05 | 7.7 ± 0.4 | 4.6 ± 0.2 | 1.0 ± 0.05 | 4.6 ± 0.2 | 6.1 ± 0.4 | 1.1 ± 0.08 | 5.5 ± 0.4 |
| 25.0 | 9.3 ± 0.4 | 1.2 ± 0.08 | 7.8 ± 0.6 | 4.3 ± 0.5 | 0.9 ± 0.12 | 4.8 ± 0.6 | 6.0 ± 0.4 | 1.0 ± 0.07 | 6.0 ± 0.4 |
| 30.0 | 8.9 ± 0.4 | 1.1 ± 0.06 | 8.1 ± 0.6 | 4.3 ± 0.3 | 0.9 ± 0.07 | 4.8 ± 0.4 | 5.9 ± 0.4 | 1.0 ± 0.07 | 5.9 ± 0.4 |
| 35.0 | 9.1 ± 0.5 | 1.1 ± 0.07 | 8.3 ± 0.7 | — | — | — | — | — | — |
| 40.0 | 8.4 ± 0.5 | 1.1 ± 0.07 | 7.6 ± 0.7 | — | — | — | — | — | — |
a From Equation 3 (Materials and Methods), in kilocalories per mole.
b From Equation 3 (Materials and Methods), in kilocalories per mole per molar (moles per liter).
c Midpoint of the urea unfolding curve calculated as ΔG(H2O)/m, in molar (moles per liter).
The m value, the dependence of ΔG on the denaturant concentration, is higher for WT-IL4 at most of the temperatures tested. m is a key parameter in chemical unfolding reactions, and it is considered proportional to the protein surface newly exposed to the solvent upon unfolding, with the hydrophobic surface having a larger contribution, especially when urea is used as denaturant (Myers et al. 1995). In general, deletion of one disulfide leads to a more open denatured state and consequently implies larger variations of the surface exposed to the solvent upon unfolding. In these cases, a larger m value for the variants lacking the disulfide bond is expected. However, for IL4, the absence of disulfides C3–C127 or C24–C65 leads to small variations and, for most temperatures, smaller m values relative to WT-IL4. This may indicate that an augmented surface area is already solvent-exposed in the folded state of the mutant proteins, compensating the increase in the solvent-accessible surface area of the denatured state. In this context, disulfide bonds in IL4 may be essential in restricting hydrophobic surface accessibility in the native state. This, in fact, agrees with the ANS binding results presented before (Fig. 4), which point to an increase in the hydrophobic surface exposed to the solvent in the folded state of the mutant proteins.
We have also performed GdmCl-induced unfolding experiments of WT-IL4 (data not shown) at 25°C and obtained a lower conformational stability value (ΔG(H2O) = 4.5 kcal/mol), in close agreement with what was previously reported in the literature (Domingues et al. 1999). The decrease of ΔG(H2O) determined by GdmCl-unfolding may reflect the influence of electrostatic interactions on the conformational stability of the protein (Monera et al. 1994), nonlinear dependence of ΔG on GdmCl concentration (Alonso and Dill 1991), or different unfolded states associated with the two denaturants (Pace et al. 1990). Nevertheless, studies of the conformational stability of other structurally similar hematopoietic cytokines reported values of ΔG(H2O) close to the ones determined here for WT-IL4 based on urea-unfolding experiments. The short-chain cytokine G-CSF composed by a four-helix bundle and having no disulfide bridges has a conformational stability of 9.4 kcal/mol, in 100 mM NaPi, 200 mM NaCl (pH 7.0) at 25°C (Bishop et al. 2001). Additionally, the long-chain cytokine Human Growth Hormone constituted by a four-helix bundle and two disulfide bridges shows a ΔG(H2O) of 14.5 kcal/mol in 20 mM HEPES (pH 7.5) at 25°C (Brems et al. 1990), and Interferon-γ has a ΔG(H2O) of 8.3 kcal/mol in 10 mM NaPi (pH 6.8) at 25 °C (Beldarrain et al. 1999).
Thermal unfolding
The thermal stability of WT-IL4 and the mutant proteins C3T-IL4 and C24T-IL4 was evaluated by far-UV CD spectroscopy. Figure 6 shows the thermal unfolding profiles of the three proteins, monitored as a function of the CD signal (Ellipticity at 222 nm, θ222) with increasing temperature. The transition temperatures of unfolding (Tm) were determined as the inflection points of the curves, calculated from the derivatives of the unfolding profiles. The Tm obtained for WT-IL4 (83.8°C) is considerably higher than those obtained for the mutant proteins: 70.0°C and 73.5°C for C3T-IL4 and C24T-IL4, respectively.
Figure 6.
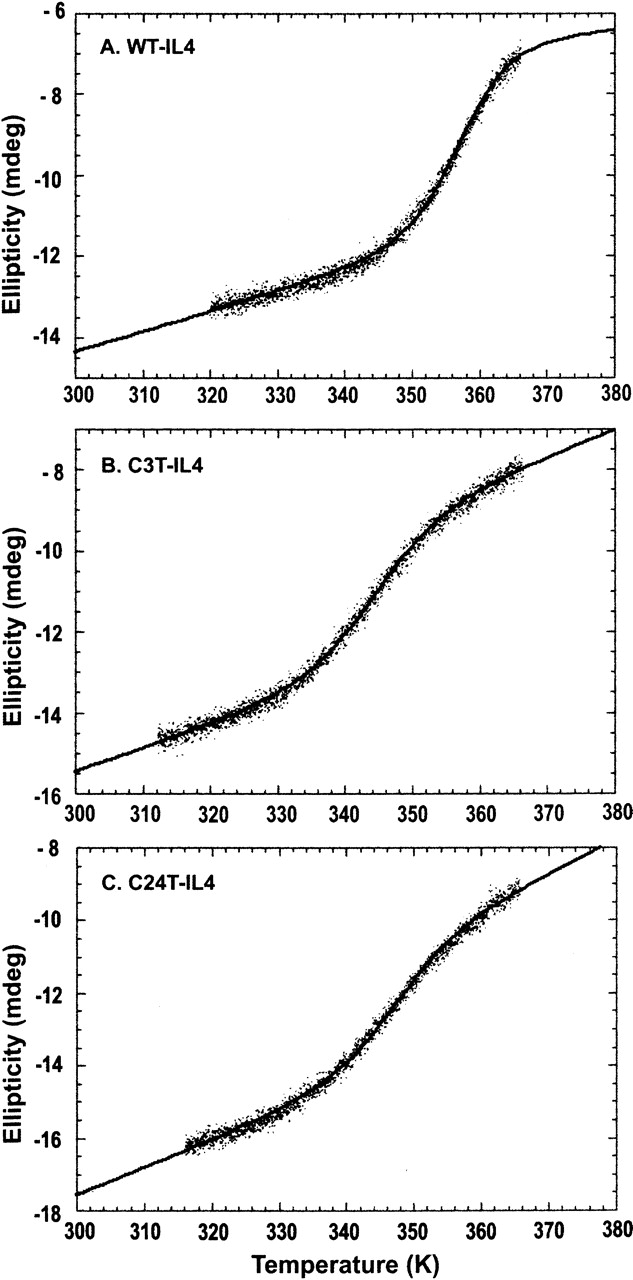
Thermal unfolding profiles of WT-IL4 (A), C3T-IL4 (B), and C24T-IL4 (C), followed by circular dichroism (CD). The ellipticity at 222 nm was monitored as a function of the temperature in the CD cuvette, every 5 sec, using a linear temperature ramp of 0.33°C/min. Protein concentrations were 6–8 μM in 10 mM sodium phosphate (pH 6.0). The lines are nonlinear least squares fits of Equation 7 (Materials and Methods) to the experimental data.
The thermal unfolding profiles also allowed the determination of the equilibrium constant (Keq) and ΔG of unfolding in the transition region, that is, for tempera tures close to Tm, using Equation 5 (Materials and Methods). These values of ΔG, in combination with the values of ΔG(H2O) obtained in the chemical unfolding experiments, were used to define the shape of the conformational stability curve (detailed in the next section).
Attempts to perform thermal unfolding experiments followed by the intrinsic fluorescence of W91 were unsuccessful. The quenching effects caused by increasing temperature masked the variation in fluorescence intensity associated with the protein unfolding process.
Temperature dependence of the conformational stability
The conformational stability curve (i.e., the dependence of ΔG of unfolding with the temperature) completely describes the thermodynamic behavior of the unfolding equilibrium of a protein. This curve may be constructed, using a noncalorimetric procedure, combining chemical and thermal unfolding data (Pace and Laurents 1989; Pace and Scholtz 1997). The ΔG(H2O) values from the urea unfolding experiments and the ΔG values in the transition region obtained from the thermal unfolding experiments were plotted together against the temperature (T) (Fig. 7). These experimental points were then fitted by a modified version of the Gibbs-Helmholtz equation (Equation 6, Materials and Methods) to provide estimates of the enthalpy of unfolding at the transition temperature (ΔHm) and the excess heat capacity of unfolding (ΔCP) for each protein. Table 3 lists the thermodynamic parameters obtained for WT-, C3T-, and C24T-IL4.
Figure 7.

Conformational stability curves for WT-, C3T-, and C24T-IL4. Each curve combines the conformational stability values obtained in urea-induced unfolding experiments (filled symbols) and the conformational stability values in the transition region obtained in the thermal unfolding experiments (open symbols). The lines represent nonlinear least squares fits of the modified Gibbs-Helmholtz equation (Equation 6, Materials and Methods) to the experimental data. The fits allow the determination of ΔH at the transition temperature (ΔHm) and ΔCP associated with the unfolding process of each protein (Table 3).
Table 3.
Thermodynamic parameters obtained from the stability curves of WT-, C3T-, and C24T-IL4
| ΔG(H2O)c (kcal/mol) | ||||||||
| Variant | Tma (°C) | TSb (°C) | 25°C | 37°C | ΔHmd (kcal/mol) | ΔSme (cal/mol K) | ΔCPf (kcal/mol K) | ΔG(TS)g (kcal/mol) |
| WT-IL4 | 83.8 | 20.8 | 9.3 | 8.7 | 102 | 286 | 1.47 | 9.3 |
| C3T-IL4 | 70.0 | 16.8 | 4.4 | 3.9 | 56.9 | 166 | 0.99 | 4.5 |
| C24T-IL4 | 73.5 | 14.2 | 6.1 | 5.3 | 71.0 | 205 | 1.09 | 6.3 |
aTm, transition temperature obtained from the thermal unfolding profiles.
bTS, temperature of maximal stability, calculated with Equation 8 (Materials and Methods).
c ΔG(H2O), free energy change at 25°C and 37°C obtained from the Gibbs-Helmholtz equation (Equation 6), using the determined parameters Tm, ΔHm, and ΔCP.
d ΔHm, enthalpy change at the transition temperature Tm, obtained from the fit of the Gibbs-Helmholtz equation (Equation 6) to the experimental data in Figure 7.
e ΔSm, entropy change at the transition temperature Tm, determined as the ratio ΔHm/Tm.
f ΔCP, heat capacity change, obtained from the fit of the Gibbs-Helmholtz equation (Equation 6) to the experimental data in Figure 7.
g ΔG(TS), free energy change at the temperature of maximal stability TS.
As a final test of the data treatment carried out, the parameters ΔHm, ΔCP, and Tm (Table 3) were used in Equation 7 (Materials and Methods) to fit the experimental thermal unfolding profiles to a two-state equilibrium (Fig. 6). The fits describe quite well the experimental behavior, suggesting that the thermodynamic parameters determined by different methods (thermal and chemical unfolding followed by far-UV CD and fluorescence) are the manifestation of a two-state unfolding equilibrium.
Privalov and coworkers (Privalov and Khechinashvili 1974) have used calorimetric methods to demonstrate that the change in heat capacity (ΔCP) associated with protein unfolding, at constant pressure, is large, is positive, and may be considered approximately constant within the commonly used experimental temperature range. Several studies have successfully correlated unfolding ΔCP values with the solvent-accessible surface area newly exposed on unfolding, with the nonpolar surface having a larger influence (Livingstone et al. 1991; Spolar et al. 1992). Consequently, for the IL4 mutants lacking one disulfide bridge, an increase in ΔCP of unfolding, reflecting a larger increase on surface area newly exposed to the solvent, should be expected. Never-theless, the ΔCP values obtained for the three proteins are 1.5 kcal/mol K−1 for WT-IL4, 0.99 kcal/mol K−1 for C3T-IL4, and 1.1 kcal/mol K−1 for C24T-IL4 (Table 3). These differences in ΔCP are in complete agreement with the results obtained for the m values, determined from the urea-unfolding data (Table 2). In fact, for proteins undergoing a simple two-state unfolding mechanism, the amount of surface area newly exposed to the solvent upon unfolding determines both the m values and ΔCP (Myers et al. 1995). The decrease in ΔCP of unfolding for the mutant proteins may be explained by conformational changes in the native state of the IL4 mutants relatively to WT-IL4. The lack of disulfides C3–C127 in C3T-IL4 and C24–C65 in C24T-IL4 may produce more open or more dynamic structures in the folded state and therefore a more accessible protein core, as was also suggested by the ANS binding data. A folded state with a more accessible protein core may lead to a smaller increase in the surface area exposed upon unfolding. Additionally, the ΔCP of unfolding found for the mutant proteins is slightly smaller than what is expected for monomeric globular proteins, which normally range from 1.29 to 1.94 kcal/mol K−1 (Makhatadze and Privalov 1995). Some previous reports indicate that the deletion of disulfide bonds can either maintain the ΔCP values unaltered (Cooper et al. 1992) or lead to increases or decreases in ΔCP (Kuroki et al. 1992). It is therefore difficult to predict the variation of this parameter within a group of analogous proteins. However, in IL4, the lack of disulfide C3–C127 or C24–C65 leads to decreases in urea-unfolding m values and ΔCP values. Therefore, the absence of disulfide bonds in IL4 seems to influence the globular packing of the native state.
The values obtained for the enthalpy and entropy of unfolding for each IL4 variant were found to be in the expected range for globular proteins (Makhatadze and Privalov 1995). WT-IL4 has a ΔHm of 102 kcal/mol, whereas C3T-IL4 and C24T-IL4 have ΔHm values of 56.9 kcal/mol and 71.0 kcal/mol, respectively (Table 3). The ΔHm found for WT-IL4 is high, suggesting an extensive loss of favorable intramolecular and protein–solvent interactions accompanying protein unfolding. The lower ΔHm values obtained for the IL4 mutants may be associated with a smaller number of or weaker intramolecular interactions in the folded state, as a consequence of a more open conformation or looser core packing.
The entropy of unfolding at the transition temperature (ΔSm) for WT-IL4 is 286 cal/mol K−1, for C3T-IL4 is 166 cal/mol K−1, and for C24T-IL4 is 205 cal/mol K−1 (Table 3). The entropy change for protein unfolding has two main opposing contributions: the decrease in hydration entropy and the increase in configurational entropy (ΔSunf = ΔSconfig + ΔShyd; with ΔSconfig > 0 and ΔShyd < 0). Therefore, two explanations may be put forward to justify the decrease of ΔSm in the mutant proteins: an increase in configurational entropy of the folded state, or a decrease in hydration entropy of the denatured state. Upon deletion of a disulfide bond, it is natural to assume that both native and denatured states become less conformationally restricted, and consequently the configurational entropy of both states increases. Nevertheless, only a larger increase in configurational entropy of the native state would justify the decrease in the ΔSm observed for the mutants. However, it is more likely that, in the absence of disulfides, the configurational entropy of the denatured state suffers a larger increase than the configurational entropy of the native state. In this case, the decrease in ΔSm of unfolding observed for the IL4 mutant proteins must result from a large decrease in the hydration entropy of unfolding (ΔShyd becomes more negative). Most likely, this decrease in hydration entropy of unfolding is mainly governed by a decrease in the hydration entropy of the denatured state, due to the exposure of a larger hydrophobic surface area. Thus, the smaller experimental ΔSm of the mutant IL4 proteins may reflect the larger nonpolar surface area exposed to the solvent in the denatured state of the mutant proteins, overcoming the contribution of the increase in conformational freedom of the denatured state.
The determination of the thermodynamic parameters (ΔHm, ΔSm, Tm, and ΔCP) for the three IL4 variants allows the calculation of ΔG, ΔH, and ΔS of unfolding in the range of temperatures where ΔCP is assumed constant (Equations 6, 9, and 10, Materials and Methods). Although the ΔG(H2O) values are lower at 37°C than at 25°C, the relative order of the conformational stability is maintained among the IL4 variants (Table 3). The IL4 mutant proteins are always thermodynamically less stable than the wild-type protein, and C3T-IL4 is considerably less stable than C24T-IL4. WT-IL4 has a ΔG(H2O)37°C of 8.7 kcal/mol, whereas at 37°C, C3T-IL4 and C24T-IL4 have conformational stabilities of 3.9 and 5.3 kcal/mol, respectively. It is important to note that even apparently small differences in the conformational stability of a protein may have important consequences in its function and solution behavior.
The temperature of maximal stability (TS) was determined from the stability curve and Equation 8 (Materials and Methods). TS is the temperature at which the change in entropy of unfolding is zero and the Gibbs free energy change reaches its maximal value [ΔG(TS)]. Studies on the solubility of small organic molecules and nonpolar amino acids in water have indicated that the hydrophobic effect is maximal at 20°C (Privalov and Gill 1988). Proteins with globular folds strongly determined by the hydrophobic effect do show temperatures of maximal stability in the range of 20° ± 8°C. TS deviations from 20°C are attributed to weak hydrophobic effects and/or the presence of strong electrostatic interactions (Kumar et al. 2002). The temperatures of maximal stability (TS) found for the IL4 variants studied are 20.8°C, 16.8°C, and 14.2°C for WT-, C3T-, and C24T-IL4, respectively. Although within the range of TS values expected for globular proteins, the lower TS might suggest a smaller contribution of the hydrophobic effect for the conformational stability of the IL4 variants lacking one disulfide bond, again in agreement with other stability parameters and structural observations we made.
Conclusions
WT-IL4 is a thermodynamically stable protein with conformational stability at 25°C [ΔG(H2O)] of 9.3 kcal/mol, transition temperature (Tm) of 83.8°C, and temperature of maximal stability (TS) of 20.8°C. Although the two native disulfide bridges understudy (C3–C127 and C24–C65) play an important role in the thermodynamic and structural stability of IL-4, disulfide C3–C127has a predominant role.
Far-UV CD and intrinsic fluorescence studies on C24T-IL4 suggest a global fold similar to the wild-type protein. Although the average wild-type structure is maintained in C24T-IL4, the absence of disulfide C24–C65 produces a protein with lower thermodynamic stability and a more solvent-accessible protein core, as indicated by the ANS binding studies and several thermodynamic parameters. Additionally, preliminary NMR relaxation measurements on 15N-labeled C24T-IL4 also suggest changes in the dynamic behavior of this mutant protein. These changes in dynamics may justify the large chemical shift differences observed in the [1H-15N]HSQC NMR spectra (Fig. 1).
The absence of disulfide C3–C127, which links the two protein termini in WT-IL4, induces more dramatic changes in what concerns protein structure and stability than the absence of disulfide C24–C65. In fact, C3T-IL4 shows a 5-nm blue-shift of the fluorescence emission maximum, indicating a more hydrophobic environment for the single tryptophan residue (W91). Furthermore, an increase in the helical content is observed for C3T-IL4, as judged by far-UV CD, probably because of the elongation of α-helices A and D by nearly a turn. ANS binding experiments indicate a larger hydrophobic surface accessible to the solvent in the native state of C3T-IL4, when compared to C24T- and WT-IL4. Thus, from a structural point of view, disulfide C3–C127 seems to impose significant conformational restraints on the global fold of IL4.
Protein conformational stability (ΔG(H2O)) is lowered in C24T-IL4 and C3T-IL4, throughout the experimental range of temperatures tested. At 25°C, the conformational stability decreases by 3.2 kcal/mol in C24T-IL4 and 4.9 kcal/mol in C3T-IL4, when compared with WT-IL4. The transition temperature (Tm) decreases by 10.3°C in C24T-IL4 and 13.8°C in C3T-IL4, and the temperature of maximal stability (TS) decreases by 6.6°C and 4.0°C in C24T- and C3T-IL4, respectively. These changes are the consequence of enthalpic and entropic contributions. The experimentally determined thermodynamic parameters ΔHm, ΔSm, and ΔCP are reduced in C24T-IL4 and C3T-IL4 (Table 3). The decrease in unfolding enthalpy (ΔHm) of the mutant proteins may be attributed to the loss or weakening of intramolecular and protein–solvent interactions in the native state, whereas the decrease in the entropy of unfolding (ΔSm) may be mainly associated with a decrease in the hydration entropy of the denatured state. Additionally, the decrease in the change of heat capacity of unfolding (ΔCP) may result from an increase in the heat capacity of the folded state, due to a larger solvent-accessible surface area in this state of the mutant proteins.
Taken together, our results indicate that the folded state of the IL4 variants lacking one disulfide bridge, in particular C3T-IL4, hasa protein core less well packed, looser, and more accessible to the solvent. Furthermore, the decrease in conformational stability of the IL4 variants seems to be mostly determined by enthalpic contributions in the native state and entropic contributions in the denatured state. Moreover, while the decrease in ΔHm of the mutant proteins contributes to the decrease in conformational stability, the decrease in ΔSm has, in fact, a stabilizing effect.
Interestingly, the structural and stability differences observed for the IL4 mutants do have consequences in functional terms. Cell proliferation assays performed with C3T-IL4 and C24T-IL4 showed a three to five times decrease in protein activity (Kruse et al. 1991). Additionally, binding constants indicate a small decrease in binding affinity of the IL4 variants for the α-chain receptor. These relatively small decreases in binding affinity and biological activity of C3T- and C24T-IL4 may, in fact, reflect the structural and dynamic changes observed in the native state of these proteins.
Materials and methods
Materials
Recombinant human IL4 and the mutant proteins C3T-IL4 and C24T-IL4 were produced in Escherichia coli K12 JM103 recA−. The proteins were refolded from inclusion bodies and purified as described previously (Kruse et al. 1991). Purified IL4 samples were lyophilized and stored at −20°C. Uniformly 15 N-labeled proteins were produced by growing E. coli in M9 minimum medium containing 15N-ammonium chloride as the sole nitrogen source. The recombinant proteins were tested for activity by surface plasmon resonance in a BIAcore 2000 system, using an immobilized α-chain domain of the IL4 receptor (IL4Rα) at a density of 15–20 pg/mm2 in a CM5 biosensor.
Protein concentrations were determined spectrophotometrically at 278 nm, using an extinction coefficient of 9370 M−1 cm−1 (or ɛ2780.1% = 0.625 mg−1 cm2) (Windsor et al. 1991). Quality control of the protein samples was routinely performed by analytical size exclusion chromatography (SEC) and poly-acrylamide gel electrophoresis in denaturing conditions (SDS-PAGE), in particular to control for the absence of dimers in the samples of IL4 mutants with a single free thiol (–SH) group.
Guanidine hydrochloride, urea, and 8-anilino-1-naphtalene-sulphonic acid (ANS) were of the highest purity commercially available and were purchased from Sigma Chemical Company. 15N-ammonium chloride was acquired from Cambridge Isotope Laboratories.
Circular dichroism
Circular dichroism experiments were performed on a Jasco J720 CD spectropolarimeter calibrated with d-10-camphorsul-fonic acid. Far-UV CD spectra were recorded between 260 and 182 nm using a 1-mm pathlength cuvette. Protein concentrations ranged from 6.0 to 8.0 μM, in 10 mM sodium phosphate buffer (pH 6.0). CD spectra were run with a step-resolution of 0.2 nm, a scan speed of 50 nm/min, and using a bandwidth of 1.0 nm. The spectra were averaged over four scans and corrected by subtraction of the buffer signal. The results are expressed as the mean residue ellipticity [θ]MRW, defined as [θ]MRW = θobs(0.1MRW)/(lc), where θobs is the observed ellipticity in millidegrees, MRW is the mean residue weight, c is the concentration in milligrams per milliliter, and l is the length of the light path in centimeters. Protein secondary structure was estimated from the far-UV CD spectra using the program CONTIN (EMBL-DA07) (Provencher 1982).
Thermal unfolding experiments were followed by far-UV CD, monitoring the change in ellipticity at 222 nm. Thermal unfolding was accomplished increasing the temperature of the sample in the CD cuvette at a rate of 0.33°C/min, using a programmable water circulating bath, Haake F6. The sample temperature was constantly monitored, using a thermal couple inserted in the solution and connected to a digital thermometer, Digi-Sense (Cole-Parmer Instrument Company). The experiments were carried out in a cylindrical cuvette with an optical pathlength of 1 mm, at an acquisition frequency of 1/5 sec−1 and using a bandwidth of 1.0 nm. Protein concentrations varied between 6.5 μM and 8.2 μM. Transitions were monitored by the change in the CD signal at 222 nm. Reversibility of the unfolding transitions was confirmed by the overlap of the CD spectra of native and renatured proteins. The CD spectra of renatured proteins were obtained by cooling the denatured samples to 40°C, at a rate of 1.22°C/min.
Fluorescence spectroscopy
Fluorescence experiments were performed on a SPEX Industries Fluorolog fluorescence spectrometer equipped with a thermostatted cell compartment.
Titrations with 8-anilino-1-naphtalenesulphonic acid (ANS) were performed making microliter additions of concentrated ANS solutions to the protein samples. Protein concentrations varied between 10.0 and 16.0 μM, and the ANS final concentrations between 1 and 50 μM, in 10 mM sodium phosphate buffer (pH 6.0). Final sample dilutions never exceeded 2%. ANS fluorescence spectra were monitored between 400 and 600 nm, at 25°C, using an excitation wavelength of 370 nm.
Intrinsic fluorescence emission spectra were obtained at a controlled temperature, using an excitation wavelength of 295 nm. Urea-induced unfolding experiments were performed by dilution of stock solutions of IL4 variants to a final concentration of 10.0 μM in the presence of increasing concentrations of denaturant, in 10 mM sodium phosphate buffer (pH 6.0). Fresh stock solutions of urea were prepared gravimetrically and its final concentration calculated according to Pace and Scholtz (1997). Protein samples with urea were incubated at a controlled temperature for up to 24 h. The reversibility of the unfolding process was confirmed by extensive dialysis of urea-denatured samples against 10 mM sodium phosphate buffer (pH 6.0) and compared with native samples by gel filtration chromatography and fluorescence. The IL4 urea-unfolding profiles were constructed plotting the fluorescence intensity at 380 nm against urea concentration.
Accessible surface area calculations
Solvent-accessible surface area calculations were performed using the coordinates of the average NMR structure (Redfield et al. 1994) or the X-ray structure (Walter et al. 1992) of WT-IL4 and the program GRASP with a 1.40 Å probe radius (Nicholls et al. 1991).
NMR experiments
NMR experiments were carried out on 2.0 mM samples of 15N-labeled recombinant human WT-IL4 or C24T-IL4, dissolved in 25 mM D3-acetic acid in 90% H2O, 10% D2O (pH 5.1). The experiments were run at 25°C on a Varian Unity Inova 500 NMR spectrometer, operating at 500 MHz for 1H and 50.7 MHz for 15N. Two-dimensional sensitivity-enhanced [1H-15N] HSQC experiments (Kay et al. 1992) were collected with 64 complex points in t1 (15N) and 1024 complex points in t2 (1H) and sweep widths of 1600 Hz in F1 and 6000 Hz in F2. Broadband decoupling during acquisition was achieved with GARP. NMR data were processed with the program FELIX (Accelrys, Inc.) running on Silicon Graphics workstations.
Data analysis
ANS binding experiments
ANS titration data were analyzed according to a simple binding equilibrium defined by a single dissociation constant (Kd). The experimental data were fitted by the isothermal binding curve given by Equation 1:
 |
(1) |
with y, the degree of saturation, given by:
 |
(2) |
where ΔFi = (Fobs − Fmin) represents the difference between the fluorescence intensity after each ANS addition (Fobs) and the fluorescence intensity in the absence of ANS (Fmin); and ΔFmax = (Fmax − Fmin) represents the maximum variation of fluorescence intensity, with Fmax the fluorescence intensity when the protein is completely saturated with ANS. [P]total is the total protein concentration and [L]total is the total ligand concentration after each ANS addition.
Equation 1 is also applicable to a binding equilibrium with n binding sites, as long as these sites are equivalent and independent. In this case, [P]total represents the total concentration of binding sites and may be replaced in Equation 1 by n[C]total, where n stands for the number of binding sites per protein molecule and [C]total stands for the total protein concentration in solution.
Nonlinear least-squares fitting of the experimental data with Equations 1 and 2 was performed with the program Kaleida-Graph (Synergy Software). The dissociation constant (Kd), the number of binding sites (n), and the maximum variation of fluorescence intensity (ΔFmax) were used as fitting parameters.
Chemical unfolding experiments
Equilbrium chemical unfolding curves were analyzed using a two-state model [Native (N) → Unfolded (U)]. The experimentally observed spectroscopic property (y) as a function of urea concentration is the result of contributions from both the native (N) and the unfolded (U) protein populations, and may be directly related to the equilibrium constant and the free energy change [ΔG(H2O)] for unfolding by Equation 3, according to the linear extrapolation model (LEM) (Santoro and Bolen 1988):
 |
(3) |
where YN and mN, YU and mU are the intercept and slope of the pre- and post-transition baselines, R is the gas constant, and T is the absolute temperature. The free energy change in the absence of denaturant [ΔG(H2O)] and m, the dependence of the free energy (ΔG) on the concentration of denaturant, were determined by a nonlinear least squares fit of Equation 3 to the unfolding data, using the program Origin (OriginLab Corporation). The concentration of denaturant at the transition midpoint (Cm) was also determined for each unfolding profile with Equation 4:
 |
(4) |
Thermal unfolding experiments and stability curves
Thermal unfolding experiments were followed by far-UV CD, monitoring the change in ellipticity at 222 nm as a function of temperature. These thermal unfolding curves were used to determine the transition temperatures of thermal unfolding (Tm) and to estimate the free energy change of unfolding (ΔG) at temperatures close to Tm. The transition temperatures were estimated as the inflection points of the thermal unfolding curves, obtained from their second derivatives. The free energy changes of unfolding (ΔG) in the transition region were determined with Equation 5:
 |
(5) |
where θobs is the ellipticity at 222 nm, monitored during the thermal unfolding experiment, and θN and θU are the ellipticities, at each temperature of the transition region, extrapolated from the linear dependence of the pre- and post-transition regions and representing the native and unfolded states, respectively.
The thermodynamic parameters ΔHm and ΔCP for protein unfolding were determined from a nonlinear least squares fit of the modified Gibbs-Helmholtz equation (Equation 6) to a plot of ΔG versus absolute temperature (T), using the ΔG values determined from the urea-induced and temperature-induced unfolding experiments (Pace and Laurents 1989; Pace and Scholtz 1997).
 |
(6) |
In order to check the validity of the two-state unfolding equilibrium approach, the parameters Tm, ΔHm, and ΔCP were used in Equation 7 to fit the experimental thermal unfolding profiles to a two-state equilibrium. The fits described quite well the experimental behavior, suggesting that the thermodynamic parameters determined by thermal and chemical unfolding experiments and followed by far-UV CD and fluorescence are the manifestation of a two-state unfolding equilibrium.
 |
(7) |
YN, mN, YU, and mU in Equation 7 are fitting parameters describing the linear dependence of the spectroscopic signal (Y) with temperature, in the pre- and post-transition regions.
With the parameters ΔHm, ΔCP, and Tm determined for each IL4 variant, the temperatures of maximal stability (TS) were obtained with Equation 8:
 |
(8) |
Assuming that the change in heat capacity (ΔCP) of unfolding is independent of the temperature, in the narrow range of temperatures experimentally used (Schellman 1987), the change of enthalpy (ΔH) and entropy (ΔS) of unfolding may be determined at different temperatures by Equations 9 and 10:
 |
(9) |
 |
(10) |
Acknowledgments
This work was supported in part by Grant POCTI/BIO/35685/2000 (FEDER, QCAIII, Portugal) (to R.M.M.B.), Doctoral Fellowship SFRH/BD/3279/2000 (to D.C.V.), and Research Assistant Fellowship AI/05/02 (to J.R.R.). We also thank the technical assistance of Christian Söder.
Abbreviations
ANS, 8-anilino-1-naphthalenesulfonate
C24T-IL4, Interleukin-4 with cysteine 24 replaced by threonine
C3T-IL4, Inter-leukin-4 with cysteine 3 replaced by threonine
CD, circular dichroism
G-CSF, granulocyte colony stimulating factor
GdmCl, guanidinium chloride
GM-CSF, granulocyte-macrophage colony stimulating factor
IL2, Interleukin-2
IL4, Interleukin-4
NMR, nuclear magnetic resonance
WT-IL4, wild type Interleukin-4
ΔCp, change in heat capacity upon protein unfolding
ΔG(H2O), conformational stability
ΔHm, enthalpy change of unfolding at the transition temperature
ΔSm, entropy change of unfolding at the transition temperature
SASA, solvent-accessible surface area
Tm, transition temperature of unfolding
TS, temperature of maximal stability
Article and publication are at http://www.proteinscience.org/cgi/doi/10.1110/ps.051593306.
References
- Alonso, D.O.V. and Dill, K.A. 1991. Solvent denaturation and stabilization of globular proteins. Biochemistry 30: 5974–5985. [DOI] [PubMed] [Google Scholar]
- Beldarrain, A., Lopez-Lacomba, J.L., Furrazola, G., Barberia, D., and Cortijo, M. 1999. Thermal denaturation of human γ-interferon. A calorimetric and spectroscopic study. Biochemistry 38: 7865–7873. [DOI] [PubMed] [Google Scholar]
- Bishop, B., Koay, D.C., Sartorelli, A.C., and Regan, L. 2001. Reengineering granulocyte colony-stimulating factor for enhanced stability. J. Biol. Chem. 276: 33465–33470. [DOI] [PubMed] [Google Scholar]
- Brems, D.N., Brown, P.L., and Becker, G.W. 1990. Equilibrium denaturation of human growth hormone and its cysteine-modified forms. J. Biol. Chem. 265: 5504–5511. [PubMed] [Google Scholar]
- Cooper, A., Eyles, S.J., Radford, S.E., and Dobson, C.M. 1992. Thermo-dynamic consequences of the removal of a disulphide bridge from hen lysozyme. J. Mol. Biol. 225: 939–943. [DOI] [PubMed] [Google Scholar]
- Creighton, T.E. 1974. Intermediates in the refolding of reduced pancreatic trypsin inhibitor. J. Mol. Biol. 87: 579–602. [DOI] [PubMed] [Google Scholar]
- ———. 1997. Protein folding coupled to disulphide bond formation. Biol. Chem. 378: 731–744. [DOI] [PubMed] [Google Scholar]
- Doig, A.J. and Williams, D.H. 1991. Is the hydrophobic effect stabilizing or destabilizing in proteins? The contribution of disulphide bonds to protein stability. J. Mol. Biol. 217: 389–398. [DOI] [PubMed] [Google Scholar]
- Domingues, H., Cregut, D., Sebald, W., Oschkinat, H., and Serrano, L. 1999. Rational design of a GCN4-derived mimetic of interleukin-4. Nat. Struct. Biol. 6: 652–656. [DOI] [PubMed] [Google Scholar]
- Duschl, A. and Sebald, W. 1996. Transmembrane and intracellular signalling by interleukin-4: Receptor dimerization and beyond. Eur. Cytokine Netw. 7: 37–49. [PubMed] [Google Scholar]
- Hinck, A.P., Truckses, D.M., and Markley, J.L. 1996. Engineered disulfide bonds in staphylococcal nuclease: Effects on the stability and conformation of the folded protein. Biochemistry 35: 10328–10338. [DOI] [PubMed] [Google Scholar]
- Kay, L., Keifer, P., and Saarinen, T. 1992. Pure absorption gradient enhanced heteronuclear single quantum correlation spectroscopy with improved sensitivity. J. Am. Chem. Soc. 114: 10663–10665. [Google Scholar]
- Kraulis, P.J. 1991. MOLSCRIPT: A program to produce both detailed and schematic plots of protein structures. J. Appl. Crystallogr. 24: 946–950. [Google Scholar]
- Kruse, N., Lehrnbecher, T., and Sebald, W. 1991. Site-directed mutagenesis reveals the importance of disulfide bridges and aromatic residues for structure and proliferative activity of human interleukin-4. FEBS Lett. 286: 58–60. [DOI] [PubMed] [Google Scholar]
- Kumar, S., Tsai, C.J., and Nussinov, R. 2002. Maximal stabilities of reversible two-state proteins. Biochemistry 41: 5359–5374. [DOI] [PubMed] [Google Scholar]
- Kuroki, R., Inaka, K., Taniyama, Y., Kidokoro, S., Matsushima, M., Kikuchi, M., and Yutani, K. 1992. Enthalpic destabilization of a mutant human lysozyme lacking a disulfide bridge between cysteine- 77 and cysteine-95. Biochemistry 31: 8323–8328. [DOI] [PubMed] [Google Scholar]
- Livingstone, J.R., Spolar, R.S., and Record, M.T. 1991. Contribution to the thermodynamics of protein folding from the reduction in water-accessible surface area. Biochemistry 30: 4237–4244. [DOI] [PubMed] [Google Scholar]
- Makhatadze, G.I. and Privalov, P.L. 1995. Energetics of protein structure. Adv. Protein Chem. 47: 307–417. [DOI] [PubMed] [Google Scholar]
- Monera, O.D., Kay, C.M., and Hodges, R.S. 1994. Protein denaturation with guanidine hydrochloride or urea provides a different estimate of stability depending on the contributions of electrostatic interactions. Protein Sci. 3: 1984–1991. [DOI] [PMC free article] [PubMed] [Google Scholar]
- Myers, J.K., Pace, C.N., and Scholtz, J.M. 1995. Denaturant m values and heat capacity changes: Relation to changes in accessible surface areas of protein unfolding. Protein Sci. 4: 2138–2148. [DOI] [PMC free article] [PubMed] [Google Scholar]
- Nayak, S.K., Rathore, D., and Batra, J.K. 1999. Role of individual cysteine residues and disulfide bonds in the structure and function of Aspergillus ribonucleolytic toxin restrictocin. Biochemistry 38: 10052–10058. [DOI] [PubMed] [Google Scholar]
- Nicholls, A., Sharp, K.A., and Honig, B. 1991. Protein folding and association: Insights from the interfacial and thermodynamic properties of hydrocarbons. Proteins 11: 281–296. [DOI] [PubMed] [Google Scholar]
- Pace, C.N. and Laurents, D.V. 1989. A new method for determining the heat capacity change for protein folding. Biochemistry 28: 2520–2525. [DOI] [PubMed] [Google Scholar]
- Pace, C.N. and Scholtz, J.M. 1997. Measuring the conformational stability of a protein. In Protein structure: A practical approach, 2nd ed. (ed. T.E. Creighton ), pp. 299–321. Oxford University Press, New York.
- Pace, C.N., Grimsley, G.R., Thomson, J.A., and Barnett, B.J. 1988. Conformational stability and activity of ribonuclease T1 with zero, one, and two intact disulfide bonds. J. Biol. Chem. 263: 11820–11825. [PubMed] [Google Scholar]
- Pace, C.N., Laurents, D.V., and Thomson, J.A. 1990. pH dependence of the urea and guanidine hydrochloride denaturation of ribonuclease A and ribonuclease T1. Biochemistry 29: 2564–2572. [DOI] [PubMed] [Google Scholar]
- Powers, R., Garrett, D.S., March, C.J., Frieden, E.A., Gronenborn, A.M., and Clore, G.M. 1993. The high-resolution, three-dimensional solution structure of human interleukin-4 determined by multidimensional heteronuclear magnetic resonance spectroscopy. Biochemistry 32: 6744–6762. [DOI] [PubMed] [Google Scholar]
- Privalov, P.L. and Gill, S.J. 1988. Stability of protein structure and hydrophobic interaction. Adv. Protein Chem. 39: 191–234. [DOI] [PubMed] [Google Scholar]
- Privalov, P.L. and Khechinashvili, N.N. 1974. A thermodynamic approach to the problem of stabilization of globular protein structure: A calorimetric study. J. Mol. Biol. 86: 665–684. [DOI] [PubMed] [Google Scholar]
- Provencher, S.W. 1982. CONTIN: A general purpose constrained regularization program for inverting noisy linear algebraic and integral equations. Comput. Phys. Commun. 27: 229–242. [Google Scholar]
- Redfield, C., Smith, L.J., Boyd, J., Lawrence, G.M., Edwards, R.G., Gershater, C.J., Smith, R.A., and Dobson, C.M. 1994. Analysis of the solution structure of human interleukin-4 determined by heteronuclear three-dimensional nuclear magnetic resonance techniques. J. Mol. Biol. 238: 23–41. [DOI] [PubMed] [Google Scholar]
- Santoro, M.M. and Bolen, D.W. 1988. Unfolding free energy changes determined by the linear extrapolation method. 1. Unfolding of phenylmethanesulfonyl α-chymotrypsin using different denaturants. Biochemistry 27: 8063–8068. [DOI] [PubMed] [Google Scholar]
- Schellman, J.A. 1987. The thermodynamic stability of proteins. Annu. Rev. Biophys. Biophys. Chem. 16: 115–137. [DOI] [PubMed] [Google Scholar]
- Spolar, R.S., Livingstone, J.R., and Record, M.T. 1992. Use of liquid hydrocarbon and amide transfer data to estimate contributions to thermodynamic functions of protein folding from the removal of non-polar and polar surfaces from water. Biochemistry 31: 3947–3955. [DOI] [PubMed] [Google Scholar]
- Thornton, J.M. 1981. Disulphide bridges in globular proteins. J. Mol. Biol. 151: 261–287. [DOI] [PubMed] [Google Scholar]
- Walter, M.R., Cook, W.J., Zhao, B.G., Cameron, R.P., Ealick, S.E., Walter, R.L., Reichert, P., Nagabhushan, T.L., Trotta, P.P., and Bugg, C.E. 1992. Crystal structure of recombinant human interleukin- 4. J. Biol. Chem. 267: 20371–20376. [DOI] [PubMed] [Google Scholar]
- Windsor, W.T., Syto, R., Le, H.V., and Trotta, P.P. 1991. Analysis of the conformation and stability of Escherichia coli derived recombinant human interleukin-4 by circular dichroism. Biochemistry 30: 1259–1264. [DOI] [PubMed] [Google Scholar]