

Abstract
The fluorescence quenching of drFP583 (DsRed) protein by metal ions was investigated. CuSO4 reversibly and pH dependently quenched the red emission at 583 nm of drFP583. The copper binding constant was 15 mM. Following random mutagenesis, blue- and red-shifted mutants of drFP583 were generated, and their metal sensing properties were examined. Mutant gRF possessed properties similar to green fluorescent protein and had a 18 mM copper binding constant. Mutant Rmu162 had an extraordinary red-shifted emission peak at 620 nm. A third mutant, Rmu13, had dual emission peaks at 500 nm and 583 nm and possessed the properties of a copper sensor with a binding constant of 11 mM.
Keywords: red fluorescent protein; fluorescence quenching; copper ion; random mutagenesis; drFP583, DsRed
DrFP583 (DsRed) is a bright red fluorescent protein cloned from reef coral (Matz et al. 1999) and has excitation and emission maxima at 558 and 583 nm, respectively. The red emission of drFP583 has opened up a new field for multicolor labeling and FRET applications (Mizuno et al. 2001; Verkhusha et al. 2001). Despite a very low level of amino acid sequence identity to avGFP (24%–30%), the overall fold of DsRed is virtually identical to that of avGFP, consisting of a slightly irregular 11-stranded β-barrel (β-can). AvGFP cloned from the jellyfish Aequorea victoria (Prasher et al. 1992) has been shown to be largely monomeric in aqueous solutions. In contrast, both sedimentation (Baird et al. 2000; Vrzheshch et al. 2000) and crystallographic studies (Wall et al. 2000; Yarbrough et al. 2001) have revealed that drFP583 forms an obligate tetramer (Baird et al. 2000). Engineering of metal-binding sites into avGFP variants through structure-based rational design has been reported (Richmond et al. 2000; Jensen et al. 2001). However, structure-based approaches may not necessarily produce the optimal metal sensors because of our limited understanding of the direct and/or indirect interactions of amino acid residues with the chromophore. We have utilized the alternate approach of screening a random mutagenesis library of drFP583 to identify potential metal sensors. We first isolated red- and blue-shifted mutants and then examined their metal ion binding ability via fluorescence quenching efficiency.
Results and Discussion
Spectral properties of drFP583 and its mutants
A library of mutant drFP583 was constructed by utilizing the cDNA of drFP583 as a template for random error-prone PCR and transformed into Escherichia coli. An average of 1000 colonies per plate and total of 100,000 colonies were screened. Most of the colonies had no color or developed color very slowly (>5 d). Five bright colonies that produced different colors were selected for further analysis, and the proteins of these mutants were expressed and purified. These mutant proteins are denoted as follows: gRF, Rmu 74, Rmu 80, Rmu162, and Rmu13. DrFP583 was also expressed and purified as a control. The molecular mass and purity of each protein sample was tested by using SDS-PAGE and mass spectrometry. Both indicated purity >98% for each sample (data not shown). Spectroscopically, gRF, Rmu 74, and Rmu 80 showed a single absorbance peak at 480, 552, and 564 nm, respectively. Mutant Rmu162 possessed a major absorbance peak at 596 nm and a minor peak at 513 nm. Rmu13 possessed a major absorption peak at 487 nm and a minor peak at 558 nm, even after complete maturation. Molar extinction coefficients of these peaks were determined independently.
For the determination of quantum yield, the emission spectra of the mutants were measured by using their respective excitation maxima and dividing the intensity by the maximum emission of drFP583. Since the absorbance peak of gRF is very far from and does not overlap with that of drFP583, the quantum yield of gRF was obtained by using EGFP as reference. Upon excitation at 460 nm, drFP583, Rmu74, and Rmu80 all exhibited a minor peak at 500 nm, and their major emission peaks were at 583, 579, and 593 nm, respectively. In contrast, gRF exhibited only one emission peak at 496 nm. The emission spectra of the mutant proteins were also examined by using an excitation wavelength of 540 nm. At this excitation wavelength, drFP583, Rmu 74, and Rmu 80 yielded a three- to fivefold increased fluorescence intensity at their major peaks. gRF yielded a broader peak at 583 nm, but the fluorescence intensity of this peak was 150-fold weaker than the peak at 496 nm; thus, gRF exhibits both green and red emission but the green emission dominates (data not shown). The stability of each mutant protein at different pH values was also examined. Rmu74 was found to be an acid-resistant mutant. At pH 3.3, drFP583 has no absorbance at 558 nm and a novel broader peak at 390 nm, whereas for Rmu74 there is only a 10% decrease in absorbance at 552 nm (data not shown). Positions of amino acid substitution of the selected mutants and their optical properties are summarized in Table 1.
Table 1.
Summary of spectroscopic properties of drFP583 mutants

Fluorescence changes induced by metal ions
Experiments were undertaken to characterize the effect of metal ion concentration on fluorescence, specifically Na+, K+, Mg2+, Ca2+, Cr2+, Mn2+, Fe2+, Co2+, Ni2+, Cu2+, and Zn2+. These metal ions were added to the screening buffer to final concentration of 10 μM. Emission spectra in the presence and absence of metal ion were obtained by excitation at the maximum excitation wavelengths of each mutant, drFP583, and EGFP. No effects from Na+, K+, Mg2+, and Ca2+ were observed (data not shown). The greatest percentage quenching occurred with Cu2+ for drFP583, Rmu13, and gRF, while EGFP showed modest quenching (Fig. 1). Rmu74, Rmu80, and Rmu162 also displayed modest quenching by copper (data not shown). Upon excitation at 475 nm, mature Rmu13 exhibited two fluorescence emission peaks, 500 (green) and 580 nm (red). The percentage quenching of the red fluorescence and the green fluorescence was different, 66% versus 22%, respectively (see also Fig. 2B).
Figure 1.

Quenching effect of metal ions on protein fluorescence. Emission spectra of fluorescent proteins with and without 10 μM metal ion were obtained at room temperature utilizing the peak excitation wavelength of each respective protein. The percentage of fluorescence quenching was calculated by using the following equation: Quenching % = {Em(0) − Em(10)}/ Em(0) × 100%, where Em(0) and Em(10) are the emission intensities at the maximum emission peaks in the absence and presence of 10 μM metal ion. In the presence of 10 μM Cu2+, the fluorescence of drFP583 was quenched 78%, gRF by 62%, and Rmu13 by 66% at 583 nm (red) and 22% at 500 nm (green).
Figure 2.

Titration of drFP583 and Rmu13 with Cu2+. Emission spectra of drFP583 (A) and Rmu13 (C) were obtained by excitation at 540 and 460 nm, respectively, in the presence of 0, 1, 3, 30, 100, and 200 mM Cu2+. (B,D) The change in quenching was integrated over a wavelength range of 560–600 nm and is plotted against copper concentration. 1.0 on the ordinate indicates 100% change in observed fluorescence. The binding curves represent the best fit of Equations 1 and 2. The residuals of the fit are shown below.
Assessment of copper–protein interactions by fluorescence quenching
drFP583 and Rmu13 were titrated with 1–200 μM Cu2+. The fluorescence intensity of both drFP583 and Rmu13 decreased upon the addition of copper (Fig. 2A,C), and the rate of binding was faster than the manual mixing dead time. Protein aggregation was noted at copper concentrations >200 mM. The two emission peaks of Rmu13 displayed different copper sensing activity. The decrease in emission intensity at 580 nm (red) was not accompanied by a decrease in emission intensity at 500 nm (green) until the concentration of Cu2+ reached 5 μM. At copper concentrations >5 μM, the green emission decreased 10%–30%, whereas red emission decreased by 50%–90%.
The change in quenching was plotted against total copper concentration (Fig. 2B,D). Binding affinities and stoichiometries for copper binding to the various proteins and peptides were quantified by fitting of the conventional model expressed in Equations 1 and 2 to the fluorescence data in Figure 2,
where F is the measured fluorescence after normalization, F 0 is the fluorescence in the absence of copper, and ΔF is the fluorescence change caused by copper binding. The concentration of the protein–copper complex, [bound], is described in Equation 2,
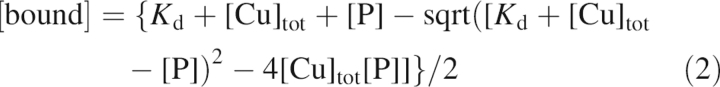 |
where K d is the dissociation constant of the copper binding site(s), [Cu]tot is total copper concentration, and [P] is protein concentration. The model that best fits the data has the protein concentration set to the concentration of monomers (0.5 μM) (i.e., one copper binding site/monomer). The fitted values of K d were calculated to be 14.80 ± 1.68 and 10.90 ± 1.74 μM for drFP583 and Rmu13, respectively. Small deviations between model and data were apparent in the residual plots (Fig. 2B,D, lower panels). Similar experiments were performed with gRF and a copper binding constant of 18.30 ± 1.84 mM was obtained (data not shown). Sumner et al. (2006) recently reported the copper binding constant of DrFP583 to be 0.5 mM, compared with the 15 mM binding constant reported here. This apparent discrepancy is likely a result of the differences in analysis. Sumner et al. (2006) used the equation: F = F o − ΔF/(K d/[Cu]) −1), where F, F 0, and ΔF are the observed fluorescence, initial fluorescence, and the fluorescence change, respectively. This analysis assumes that free copper can be approximated as being equal to total copper. Our analysis does not incorporate this approximation and allowed us to fit the data with F 0, ΔF, and K d as free parameters.
To test the reversibility of quenching, increasing concentrations of EDTA from 0.1 to 10 mM were added to the fluorescent protein solutions previously quenched by 200 μM CuSO4. More than 90% of the fluorescence of drFP583 was recovered when the concentration of EDTA reached 1 mM; the rate of recovery is in the minutes timescale (data not shown).
Plausible copper binding domain probed by chemical modification
To determine the pH dependence of copper-induced fluorescence quenching, drFP583 was diluted into 50 mM Tris-acetate, 200 μM CuCl2, and 100 mM NaCl (pH 5.5–10.3), and fluorescence was measured at each pH. As shown in Figure 3, fluorescence intensity changed dramatically between pH 6 and 9 when copper was included in the solution. The pH dependence was modeled as a simple equilibrium between two species that differed in the ionization state of a single group with pKa of 7.8. This value is close to the typical side chain pKa of either a cysteine or histidine residue.
Figure 3.

pH dependence of the fluorescence intensity of drFP583. Emission intensity of drFP583 excitation at 550 nm was measured in Tris-acetate buffer at various pHs in the absence (diamonds) and presence (circles) of 250 μM Cu2+ and was integrated over a wavelength range of 560–600 nm and plotted against pH. Data were normalized to the value obtained at pH at 10.3.
Cys117 is the only Cys residue in the drFP583 monomer. To determine whether or not this Cys is a copper ligand, cysteine-specific chemical modification by iodoacetateamide was performed. Two microliters of drFP583 stock solution (77 μM) was diluted to 50 μL in 50 mM Tris (pH 7.9) with 5 mM iodoacetamide and incubated at room temperature for 0, 12, and 72 h, and then the reaction was diluted 100-fold with 50 mM Tris-acetate (pH 7.1). After iodoacetamide treatment, the K d for copper binding was increased to >100 μM (data not shown).
To probe the role of His residues in copper binding, we used the histidine-specific modifier DEPC. drFP583 (3 μM) was incubated with 0.5 mM freshly diluted DEPC in 20 mM MES (pH 6.5) and 75 mM NaCl at 20°C for 10, 30, and 120 min. Samples were diluted and measured as described above. No remarkable difference was observed compared with the control (data not shown). Both mass spectrometry and amino acid analysis (data not shown) support these results. In sum, the pH titration and chemical modification experiments implicate Cys117 as a copper binding ligand in drFP583.
Possible applications of Rmu13 as a copper sensor
Rmu13 can be used as a copper sensor to determine the concentration of Cu2+ between 0.1 and 100 μM in vitro and/or in vivo. Several neurodegenerative diseases, such as Alzheimer's disease, Prion disease, and amyotrophic lateral sclerosis, display the hallmark presence of aggregated protein deposits. One common feature that has been discovered for each protein deposition mechanism in each of these neurodegenerative diseases is that binding of Cu2+ facilitates the aggregation process. (Brown et al. 1997; Atwood et al.1998, 2000; Cherny et al. 2001; Qin et al. 2002, 2003; Rakhit et al. 2002). Rmu13 could be used to investigate the copper content of protein aggregates in these and other diseases; however, the copper binding affinity will need to be increased for in vivo applications.
Materials and methods
Random mutagenesis and colony screening
The drFP583-pRSETB expression plasmid was constructed as described elsewhere (Mizuno et al. 2001) and used as a template for random error-prone PCR (Cadwell and Joyce 1994) with primers that were immediately upstream and downstream of the drFP583 coding sequence. The resulting mutagenic PCR products were digested first with DpnI and then BamHI and EcoRI (NEB) and subcloned into pRSETB (Invitrogen). The mutagenic library was introduced into E. coli JM109 [DE3], plated on LB plates containing 100 μg/mL ampicillin, and incubated overnight at 37°C. The resultant colonies were incubated an additional 2 to 3 d at room temperature and screened using a homemade fluorescence image-analyzing system (Sawano and Miyawaki 2000). Finally, emission and or excitation spectra for individual targeted colonies were obtained by using optic fibers directly connected to a SPEX Fluoromax spectrofluorometer (HORIBA group). Once selected, the mutant colonies were individually picked by hand into LB/ampicillin medium for plasmid preparation. The drFP583 mutant sequences were analyzed by dye-terminator dideoxy sequencing by the ATDC, Brain Science Institute, RIKEN. Our numbering of amino acids conforms to the wild-type sequence of drFP583 (Matz et al. 1999).
Bacterial expression and protein purification
Expression of drFP583 mutants in E. coli and their purification were carried out as previously reported (Matz et al. 1999; Baird et al. 2000). The temperature and time of incubation after addition of IPTG were optimized for expression. Wild type and mutants were incubated for 24 h at 37°C, with the exception of mutants Rmu80 and RF162, which were incubated for 48 h at 30°C. Protein isolated from Cobalt affinity resin (BD Biosciences Clontech) was treated with enterokinase (Invitrogen) to remove the N-terminal histidine tag. Samples were reapplied to Cobalt affinity resin to exclude uncut protein and then further purified by using Superdex 75 HR 10/30 (Pharmacia Biotech). Samples were exchanged into 20 mM HEPES-KOH (pH 7.9), concentrated by filtration (Microcon-30, Amicon) and flash-frozen in liquid nitrogen and stored at −80°C until use. Mass Spectrometry and SDS-PAGE confirmed protein purity and molecular mass. Protein concentration was determined by using Bradford assay kit (Bio-Rad) with BSA as the standard.
Spectroscopic studies
For the calculation of molar extinction coefficient and fluorescence quantum yields, the absorption and emission spectra were acquired in 50 mM HEPES (pH 7.9), at room temperature using a U3310 spectrophotometer (Hitachi) and a F2500 fluorescence spectrophotometer (Hitachi). Fluorescence quantum yields of all mutants except gRF were determined by comparison to the drFP583 protein; for gRF, EGFP was used as standard. For the metal ion titration studies, fluorescence measurements were made using a Photon Technology International QM-1 fluorescence spectrophotometer with temperature controlled at 20°C. The bandwidth of both the excitation and emission slits was 4 nm.
Metal ion screening and titration
Metal ion screening was performed on solutions containing 0.2 μM of each fluorescent protein in Quenching Buffer (QB; 50 mM HEPES-KOH at pH 7.9, 100 mM NaCl, 1 mM MgCl2, 1 μg/mL BSA). One microliter of each 10 mM metal solution was added to 1 mL of the above buffer, and fluorescence was measured for each.
Copper titration experiments were carried out to determine the apparent binding constant. Concentrated fluorescence protein diluted with QB and CuSO4 was added stepwise in the same cell from 0.1 μM to a final concentration of 200 μM CuSO4, and the emission intensity was recorded immediately by excitation at 540 nm for drFP583, 480 nm for Rmu13, separately. Fluorescent intensity between 560 and 600 nm was integrated and plotted against copper concentration. Protein was titrated with a concentrated copper stock such that sample dilution was never >1%.
pH dependence of copper quenching
A series of buffers were prepared with pH ranging between 3.8 and 10.5 in 30 mM Tris, 30 mM acetate acid, and 100 mM NaCl. Proteins were concentrated in weakly buffered solutions and adjusted to the appropriate pH in the absence and presence of 250 μM CuSO4. Fluorescence emission was measured using the maximum excitation values of each fluorescent protein, and fluorescence intensity between 560 and 600 nm was integrated and plotted against pH.
Chemical modification and amino acid analysis
For cysteine modification, 3 μM drFP583 in 50 mM Tris-Cl (pH 7.8) and 75 mM NaCl was incubated with 5 mM iodoacetamide at room temperature for 0, 24, and 72 h. For carbethoxylation of the imidazole ring of histidine residues, 3 μM protein was reacted with 5 mM freshly diluted DEPC in 20 mM MES (pH 6.5) and 75 mM NaCl at 20°C for 0, 0.5, and 6 h. Following a 100-fold dilution using 50 mM Tris-acetate (pH 6.1), copper titration was performed on each sample. Amino acid analysis was performed on aliquots of each reacted sample to determine separately the amount of carboxy methyl cysteine or histidine.
Acknowledgments
We thank Sylvia Ho for helpful discussions. This work was supported by grants from the Neuromuscular Research Partnership of CIHR, Muscular Dystrophy Canada, and the ALS Society of Canada (A.C.).
Footnotes
Reprint requests to: Avijit Chakrabartty, Ontario Cancer Institute and Department of Medical Biophysics, University of Toronto, 101 College Street, Toronto, Ontario M5G 1L7, Canada; e-mail: chakrab@uhnres.utoronto.ca; fax: (416) 581-7555.
Article and publication are at http://www.proteinscience.org/cgi/doi/10.1110/ps.062239206.
Abbreviations: BSA, bovine serum albumin; DEPC, diethyl pyrocarbonate; FRET, fluorescence resonance energy transfer; IPTG, isopropyl β-d-galactopyranoside.
References
- Atwood, C.S., Moir, R.D., Huang, X., Scarpa, R.C., Bacarra, N.M.E., Romano, D.M., Hartshorn, M.A., Rudolph, R.T., Bush, A.I. 1998. Dramatic aggregation of Alzheimer Ab by Cu(II) is induced by conditions representing physiological acidosis. J. Biol. Chem. 273: 12817–12826. [DOI] [PubMed] [Google Scholar]
- Atwood, C.S., Scarpa, R.C., Huang, X., Moir, R.D., Jones, W.D., Fairlie, D.P., Anzi, R.E., Bush, A.I. 2000. Characterization of copper interactions with Alzheimer amyloid β peptides. Identification of an attomolar-affinity copper binding site on amyloid β1-42. J. Neurochem. 75: 1219–1233. [DOI] [PubMed] [Google Scholar]
- Baird, G.S., Zacharias, D.A., Tsien, R.Y. 2000. Biochemical, mutagenesis, and oligomerization of DsRed, a red fluorescent protein from coral. Proc. Natl. Acad. Sci. 97: 11984–11989. [DOI] [PMC free article] [PubMed] [Google Scholar]
- Brown, D.R., Qin, K., Herms, J.W., Madlung, A., Manson, J., Strome, R., Fraser, P.E., Kruck, T., Bohlen, A., Schulz-Schaeffer, W. et al. 1997. The cellular prion protein binds copper in vivo. Nature 390: 684–687. [DOI] [PubMed] [Google Scholar]
- Cadwell, R.C. and Joyce, G.F. 1994. Mutagenic PCR. PCR Methods Appl. 3: S136–S140. [DOI] [PubMed] [Google Scholar]
- Cherny, R.A., Atwood, C.S., Xilinas, M.E., Gray, D.N., Jones, W.D., McLean, C.A., Barnham, K.J., Volitakis, I., Fraser, F.W., Kim, Y.S. et al. 2001. Treatment with a copper-zinc chelator markedly and rapidly inhibits β-amyloid accumulation in Alzheimer's disease transgenic mice. Neuron 30: 665–676. [DOI] [PubMed] [Google Scholar]
- Jensen, K.K., Martini, L., Schwartz, T.W. 2001. Enhanced fluorescence energy transfer between spectral variants of green fluorescent protein through zinc-site engineering. Biochemistry 40: 938–945. [DOI] [PubMed] [Google Scholar]
- Matz, M.V., Fradkov, A.F., Labas, Y.A., Savitsky, A.P., Zaraisky, A.G., Markelov, M.L., Lukyanov, S.A. 1999. Fluorescent proteins from nonbioluminescent Anthozao species. Nat. Biotechnol. 17: 969–973. [DOI] [PubMed] [Google Scholar]
- Mizuno, H., Sawano, A., Eli, P., Hama, H., Miyawaki, A. 2001. Red fluorescent protein from discosoma as a fusion tag and a partner for fluorescence resonance energy transfer. Biochemistry 40: 2502–2510. [DOI] [PubMed] [Google Scholar]
- Prasher, D.C., Eckenrode, V.K., Ward, W.W., Prendergast, F.G., Cormier, M.J. 1992. Primary structure of the Aequorea victoria green-fluorescent protein. Gene 111: 229–233. [DOI] [PubMed] [Google Scholar]
- Qin, K., Yang, Y., Mastrangelo, P., Westaway, D. 2002. Mapping Cu(II) binding sites in prion proteins by diethyl pyrocarbonate modification and matrix-assisted laser desorption ionization-time of flight (MALDI-TOF) mass spectrometric footprinting. J. Biol. Chem. 277: 1981–1990. [DOI] [PubMed] [Google Scholar]
- Qin, K., Coomaraswamy, J., Mastrangelo, P., Yang, Y., Lugowski, S., Petromilli, C., Prusiner, S.B., Fraser, P.E., Goldberg, J.M., Chakrabartty, A. et al. 2003. The PrP-like protein Doppel binds copper. J. Biol. Chem. 278: 8888–8896. [DOI] [PubMed] [Google Scholar]
- Rakhit, R., Cunningham, P., Furtos-Matei, A., Dahan, S., Qi, X.F., Crow, J.P., Cashman, N.R., Kondejewski, L.H., Chakrabartty, A. 2002. Oxidation-induced misfolding and aggregation of superoxide dismutase and its implications for amyotrophic lateral sclerosis. J. Biol. Chem. 277: 47551–47556. [DOI] [PubMed] [Google Scholar]
- Richmond, T.A., Takahashi, T.T., Shimkhada, R., Bernsdorf, J. 2000. Engineered metal biding sites on green fluorescence protein. Biochem. Biophys. Res. Commun. 268: 462–465. [DOI] [PubMed] [Google Scholar]
- Sawano, A. and Miyawaki, A. 2000. Directed evolution of green fluorescent protein by a new versatile PCR strategy for site-directed and semi-random mutagenesis. Nucleic Acids Res. 28:–e78. [DOI] [PMC free article] [PubMed]
- Sumner, J.P., Westerberg, N.M., Stoddard, A.K., Hurst, T.K., Cramer, M., Thompson, R.B., Fierke, C.A., Kopelman, R. 2006. DsRed as a highly sensitive, selective, and reversible fluorescence-based biosensor for both Cu+ and Cu2+ ions. Biosens. Bioelectron. 21: 1302–1308. [DOI] [PubMed] [Google Scholar]
- Verkhusha, V.V., Otsuna, H., Awasaki, T., Oda, H., Tsukita, S., Ito, K. 2001. An enhanced mutant of red fluorescent protein DsRed for double labeling and developmental timer of neural fiber bundle formation. J. Biol. Chem. 276: 29621–29624. [DOI] [PubMed] [Google Scholar]
- Vrzheshch, P.V., Akovbian, N.A., Varfolomeyev, S.D., Verkhusha, V.V. 2000. Denaturation and partial renaturation of a tightly tetramerized DsRed protein under mildly acidic conditions. FEBS Lett. 487: 203–208. [DOI] [PubMed] [Google Scholar]
- Wall, M.A., Socolich, M., Ranganathan, R. 2000. The structural basis for red fluorescence in the tetrameric GFP homolog DsRed. Nat. Struct. Biol. 7: 1133–1138. [DOI] [PubMed] [Google Scholar]
- Yarbrough, D., Wachter, R.M., Kallio, K., Maltz, M.V., Remington, S.J. 2001. Refined crystal structure of DsRed, a red fluorescent protein from coral, at 2.0-Å resolution. Proc. Natl. Acad. Sci. 98: 462–467. [DOI] [PMC free article] [PubMed] [Google Scholar]