

Abstract
Microtubule-associated protein/microtubule affinity-regulating kinases (MARKs)/PAR-1 are common regulators of cell polarity that are conserved from nematode to human. All of these kinases have a highly conserved C-terminal domain, which is termed the kinase-associated domain 1 (KA1), although its function is unknown. In this study, we determined the solution structure of the KA1 domain of mouse MARK3 by NMR spectroscopy. We found that ∼50 additional residues preceding the previously defined KA1 domain are required for its proper folding. The newly defined KA1 domain adopts a compact α+β structure with a βαββββα topology. We also found a characteristic hydrophobic, concave surface surrounded by positively charged residues. This concave surface includes the highly conserved Glu-Leu-Lys-Leu motif at the C terminus, indicating that it is important for the function of the KA1 domain.
Keywords: MARK, C-TAK1, KA1, ELKL, nuclear magnetic resonance, solution structure
Microtubules and their associated proteins (MAPs) play a key role in a dynamic network that involves the regulation of cell shape and cell polarity during differentiation, chromosome partitioning at mitosis, and intracellular transport (Maccioni and Cambiazo 1995; Drewes et al. 1998; Ebneth et al. 1999; Marx et al. 2000; Manabe et al. 2002; Drewes 2004). During these processes, the binding of tau and MAPs to microtubules is controlled by their phosphorylation state, which is meditated by microtubule-associated protein/microtubule affinity-regulating kinases (MARKs) (Mercken et al. 1995; Sato-Harada et al. 1996; Illenberger et al. 1996; Andersen 1998; Drewes et al. 1998; Li et al. 2003; Trinczek et al. 2004).
MARKs are known to phosphorylate MAPs on their tubulin binding sites and consequently induce their detachment from microtubules (Drewes et al. 1998). Previous reports revealed that hyperexpression of MARKs in cells causes disruptions of the cellular microtubule network, leading to immediate cell death (Drewes et al. 1998; Doerflinger et al. 2003). On the other hand, hyperphosphorylation of a specific serine residue in tau by MARKs was observed in the brains of Alzheimer's disease patients (Bondareff et al. 1995; Yanagisawa et al. 1999; Gong et al. 2000; Eidenmüller et al. 2000; Planel et al. 2001, 2004; Okawa et al. 2003; Brich et al. 2003). Putative orthologs of the mammalian MARKs exist in various organisms, including partitioning-defective 1 (PAR-1) in Caenorhabditis elegans (Kemphues et al. 1988; Guo and Kemphues 1995), dPAR-1 in Drosophila melanogaster (Shulman et al. 2000; Tomancak et al. 2000; Cox et al. 2001), and xPAR-1 in Xenopus laevis (Ossipova et al. 2002). These kinases are also reportedly involved in various biological functions (Kemphues et al. 1988; Guo and Kemphues 1995; Shulman et al. 2000; Tomancak et al. 2000; Cox et al. 2001; Ossipova et al. 2002).
The MARK/PAR-1 family proteins contain three conserved domains: an N-terminal catalytic domain, a central ubiquitin-associated (UBA) domain, and a C-terminal domain, which was termed the kinase-associated domain 1 (KA1) (Barral et al. 1999; Nikolaou et al. 2002; Ossipova et al. 2002; Timm et al. 2003; Tassan and Le Goff 2004). The KA1 domain was previously defined as comprising ∼50 amino acid residues by the Pfam database (accession no. PF02149), and all of the KA1 domains are localized at the C terminus and end in the highly conserved Glu-Leu-Lys-Leu motif, termed the ELKL motif (Espinosa and Navarro 1998; Bessone et al. 1999). This domain has also been found in many other kinase proteins, such as kin1, pEg3, MELK (maternal embryonic leucine zipper kinase), and SnRK1 (Snf1-related protein kinase 1). Although the precise function of the KA1 domain is not known, several studies have suggested that this domain is involved in protein localization. For example, Guo and Kemphues (1996) reported that although C. elegans PAR-1 is known to localize asymmetrically in embryo cells, this localization is not detected in embryo cells depleted of nonmuscle myosin II heavy chain (NMY-2). They investigated the NMY-2-binding site of C. elegans PAR-1 and found that the C-terminal region, including the KA1 domain, of C. elegans PAR-1 binds NMY-2. In addition, Chartrain et al. (2006) recently reported that, when they lack the C-terminal region including the KA1 domain, the subcellular localizations of the Xenopus and human pEg3 proteins are different from those of the full-length pEg3 proteins during mitosis. On the other hand, in Saccharomyces cerevisiae KIN2 or human MELK, the C-terminal region reportedly acts as an autoinhibitory domain for the N-terminal kinase domain (Beullens et al. 2005; Elbert et al. 2005). Their results also showed that the KA1 domain is necessary for this autoinhibition.
In this study, we determined the structure of the KA1 domain of mouse MARK3 by NMR spectroscopy. We found that an additional N-terminal region preceding the previously defined KA1 domain is needed for the proper folding of this domain. The correct domain boundary of the KA1 domain was defined by a multiple sequence alignment based on the structure.
Results and Discussion
Identification of the KA1 structural region
We first expressed the mouse MARK3 C-terminal region, including residues Asp704–Leu753, which was previously defined as the KA1 domain in the Pfam database. However, we were unable to obtain a soluble sample suitable for the structure determination (data not shown). Hence, we synthesized several constructs with different lengths of additional N-terminal sequence and finally obtained a soluble construct (Asp674–Leu753). This construct also includes the native-His affinity tag sequence with the TEV protease cleavage site (MKDHLIHNVHKEEHAHAHNKDYDIPTTENLYFQGSSGSSG) at the N terminus and six additional residues derived from the expression vector (SGPSSG) at the C terminus. After affinity purification, we tried to cleave the N-terminal native-His affinity tag using TEV protease, but this construct could not be cleaved (data not shown). Therefore, we investigated the structure of this construct without cleavage, and found that the N-terminal tag sequence forms an artificial β strand (β1′) and that the additional C-terminal six residues derived from the expression vector interact with this artificial β-strand (this structure is described in detail later).
Since these artifacts seemed to affect the intrinsic structure of the KA1 domain, we further extended the N terminus of the KA1 domain up to Arg659 and removed the six C-terminal residues derived from the expression vector. In the case of this new construct (Arg659–Leu753), the N-terminal native-His affinity tag sequence was completely cleaved by TEV protease after affinity purification. Therefore, we used this KA1 domain construct (Arg659–Leu753) for the final structure determination. The resultant protein was composed of 102 residues, including the N-terminal tag sequence (GSSGSSG; seven residues).
Based on these results, we redefined this final KA1 construct (Arg659–Leu753) as the KA1 domain. We refer to the other two KA1 constructs (Asp704–Leu753 and Asp674–Leu753) as the Pfam-defined KA1 (Asp704–Leu753) and the truncated KA1 (Asp674–Leu753), respectively.
Resonance assignments and structural description
The NMR resonances were assigned by using the conventional triple-resonance technique (Wüthrich 1986; Ikura et al. 1990; Bax et al. 1994; Cavanagh et al. 1996; Kay 1997). The backbone resonance assignments were almost complete. Tertiary structures of the KA1 domain were calculated by using the CYANA software package (Güntert et al. 1997; Herrmann et al. 2002; Jee and Güntert 2003; Güntert 2004), based on a total of 1520 NOE-derived distance restraints and 84 backbone torsion angle restraints (▶). The backbone superposition of the ensemble of the 20 lowest target-function structures is shown in ▶. The root mean square deviation (RMSD) from the mean structure was 0.53 ± 0.09 Å for the backbone atoms and 0.97 ± 0.07 Å for all heavy (non-hydrogen) atoms in the well-ordered region (residues Lys665–Leu753). The structural statistics of the KA1 domain are summarized in ▶.
Table 1.
Summary of conformational constraints and statistics of the final 20 structures of the KA1 domain of mouse MARK3

Figure 1.

The solution structure of the KA1 domain of mouse MARK3. (A) Stereoview of the backbone superposition of the 20 lowest-energy structures of the KA1 domain. The region corresponding to the sequence derived from the expression vector is colored yellow. The N and C termini are labeled. (B) Ribbon diagram of the structure of the KA1 domain. The β-strands and α-helices are colored green and red, respectively. The side chain heavy atoms of the aromatic (Trp662, Phe730), hydrophobic (Val728, Leu751, Leu753), positively charged (Arg729, Lys752), and negatively charged (Glu750) residues are shown in green, yellow, blue, and red, respectively. The orientation is the same as that in A.
The KA1 domain adopts an α + β sandwich fold, which consists of two side-by-side α-helices (α1, Pro672–Ala685; α2, Ser737–Glu750) and a five-stranded antiparallel β-sheet (β1, Thr667–Ser668; β2, Asp689–Glu694; β3, Leu697–His702; β4, Val711–Lys719; β5, Asn726–Arg732) (▶, ▶). The packing of these secondary structures is stabilized by the hydrophobic interactions involving residues Met675 (α1), Ile679 (α1), Val682 (α1), Leu683 (α1), Leu698 (β3), Cys700 (β3), Trp713 (β4), Met715 (β4), Val728 (β5), and Ile747 (α2).
At the C terminus, the residues in the ELKL motif are well fixed between β1 and α1, with the side chains of the two Leu residues on the inside and those of the Glu and Lys residues on the outside (▶). These two hydrophobic residues (Leu751 and Leu753) interact with Phe730 and Val728 of β5, respectively, indicating that these residues stabilize the interaction between α2 and β5 (▶). Therefore, the highly conserved ELKL motif is important for the proper folding of the KA1 domain structure.
On the other hand, only two residues (Thr667–Ser668) of the N-terminal region preceding α1 make a short β-strand (β1) with β5, and most of the N-terminal region forms an extended conformation (▶). This characteristic structure is stabilized by the interaction between the bulky side chain of Trp662 and the aliphatic region of Arg729 (▶). These N- and C-terminal regions are located on one side of the structure of the KA1 domain, and this side has a characteristic concave surface, which is a putative functional site, as described later.
A structural similarity search using DALI (Holm and Sander 1995) revealed that the KA1 domain shares weak structural homology with the N-terminal domain of the TATA-box binding protein (TBP; Protein Data Bank [PDB] accession code 1YTB; Kim et al. 1993), with a Z-score of 4.6 and a sequence identity of 6%. However, their electrostatic potential surfaces are quite different (data not shown). Furthermore, the residues of the TBP N-terminal domain, which directly interact with the TATA-box DNA, are not conserved in the KA1 domain (data not shown). Therefore, the KA1 domain belongs to a distinct family from that of the TBP domain.
In conclusion, our structural study of the mouse MARK3 KA1 domain revealed that the actual KA1 domain is composed of ∼100 amino acid residues, including the previously Pfam-defined KA1 (Asp704–Leu753).
Novel multiple sequence alignment of the MARK KA1 domain
As described above, we determined the solution structure of the KA1 domain of mouse MARK3. Surprisingly, our results showed that a 95-amino-acid residue sequence, which is about twice as long as that of the Pfam-defined KA1 (∼50 amino acid residues), is required for the proper folding of the KA1 domain. We also performed a BLAST search with the sequence of the KA1 domain region (total 95 amino acid residues) of mouse MARK3 against the mouse genome data set at Ensembl (http://www.ensembl.org) and found that this region consists of only one exon (Ensembl Transcript ID ENSMUST00000084953). This result also indicates that the N-terminal extended region is necessary for the KA1 domain. To support this conclusion, we searched a nonredundant sequence database using PSI-BLAST (Altschul et al. 1997), based on the KA1 domain sequence of mouse MARK3. We found that the MARK/PAR-1, kin1, and MELK family proteins, but not the SnRK1 family proteins, could be detected by using this KA1 domain sequence (data not shown). Hence, we created a new profile hidden Markov model (HMM) of the KA1 domain sequences of the MARK/PAR-1, kin1, and MELK protein families, using the HMMER package (Eddy 1998), and then searched the nonredundant sequence database using the hmmsearch program with this new profile. Based on these results, we aligned the KA1 domain sequences, including the additional N-terminal residues (▶). Our results showed that the N-terminal regions of the KA1 domain are well conserved among the MARK/PAR-1, kin1, and MELK protein families, whereas the corresponding regions of the SnRK1 protein family are not conserved (▶). The N-terminal hydrophobic residues (Met675, Ile679, Val682, Leu683, Leu698, and Cys700), which are involved in the hydrophobic core of the KA1 domain of mouse MARK3, are particularly well conserved among the MARK/PAR-1, kin1, and MELK protein families, whereas these residues are not conserved in the SnRK1 protein family. Furthermore, the PAPIA system (Akiyama et al. 1998), a secondary structure prediction program, indicated that the region corresponding to α1 of the KA1 domain has an extended conformation in the case of the SnRK1 family proteins (data not shown). These results suggest that the KA1 domain of the SnRK1 family proteins belongs to a distinct domain family from those of the MARK/PAR-1, kin1, and MELK family proteins. In addition, the SnRK1 family proteins are found only in plants, while the MARK/PAR-1, kin1, and MELK family proteins are not found in plants (referenced in the Pfam database), indicating that the structure and the function of the KA1 domains of the SnRK1 family proteins are different from those of the MARK/PAR-1, kin1, and MELK family proteins.
Figure 2.

Multiple sequence alignment of the KA1 domain. Sequence alignment of the KA1 domains of proteins from Mus musculus (Mm), Homo sapiens (Hs), Xenopus laevis (Xl), Rattus norvegicus (Rn), Danio rerio (Dr), Caenorhabditis elegans (Ce), Haemonchus contortus (Hc), Drosophila melanogaster (Dm), Anopheles gambiae str. PEST (Ag), Schistosoma japonicum (Sj), Eremothecium gossypii (Eg), Saccharomyces cerevisiae (Sc), Schizosaccharomyces pombe (Sp), Neurospora crassa (Nc), Oryza sativa (Os), Hordeum vulgare (Hv), Lycopersicon esculentum (Le), Solanum tuberosum (St), Nicotiana tabacum (Nt), Cucumis sativus (Cs), Arabidopsis thaliana (At), Glycine max (Gm), Secale cereale (Sec), and Zea mays (Zm). The SwissProt/TrEMBL accession numbers are given in parentheses. The residue numbers of mouse MARK3 are shown at the top. The secondary structure elements of the KA1 domain of mouse MARK3 are indicated. The names of the MARK/PAR-1 family proteins, kin1 family proteins, MELK family proteins, and SnRK1 family proteins are shaded in pink, yellow, green, and gray, respectively. Aromatic residues are shaded in green, hydrophobic residues are yellow, positively charged residues are blue, negatively charged residues are red, and proline residues are magenta. Conserved surface residues in the KA1 domains, except for those of the SnRK1 protein family, are marked with #.
In conclusion, we propose that only the KA1 domain of the MARK/PAR-1, kin1, and MELK family proteins should be termed the “KA1 domain,” and the corresponding region of the SnRK1 family proteins belongs to a distinct domain family.
Possible binding site of the KA1 domain
By mapping the highly conserved residues among the MARK/PAR-1/kin1/MELK family members onto the KA1 structure by using the ConSurf program (Glaser et al. 2003), we found that the highly conserved residues are clustered on one side of the structure formed by the N-terminal region, β4, β5, and the N-terminal half of α2 (▶). This side has a characteristic hydrophobic, concave surface, which is surrounded by conserved, positively charged residues Figs. (▶, ▶). Since the C-terminal region including the KA1 domain has been suggested to be involved in the subcellular localization of the MARK/PAR-1/kin1/MELK family proteins, the characteristic concave surface may be the binding site for negatively charged regions of cytoskeletal proteins. For example, the C-terminal region containing the KA1 domain of C. elegans PAR-1 binds to the rod tail region of NMY-2 (Guo and Kemphues 1996), which is suggested to be negatively charged (Wendt et al. 2001). Alternatively, this characteristic concave surface may bind to its own negatively charged region, since the KA1 domains of S. cerevisiae KIN2 and human MELK may be necessary for the autoinhibitory regulation of the kinase activity (Beullens et al. 2005; Elbert et al. 2005). Recently, Panneerselvam et al. (2006) reported the crystal structure of the N-terminal catalytic and central UBA domains of human MARK2. Their results showed that the UBA domain binds to the kinase domain and that the linker region between the two domains is exposed to the solvent. This linker contains the cluster of negatively charged residues, which are well conserved in the MARK/PAR-1 family proteins (Panneerselvam et al. 2006). The kin1 family proteins have neither the conserved linker region nor the UBA domain, and the MELK family proteins have only the UBA-like domain (Beullens et al. 2005), but these two family proteins have sequences that are rich in negatively charged residues at the position following the N-terminal catalytic domain (data not shown). Therefore, we suggest that the KA1 domain interacts with the negatively charged region following the catalytic domain, in order to regulate the kinase activity of the MARK/PAR-1/kin1/MELK family proteins.
Figure 3.
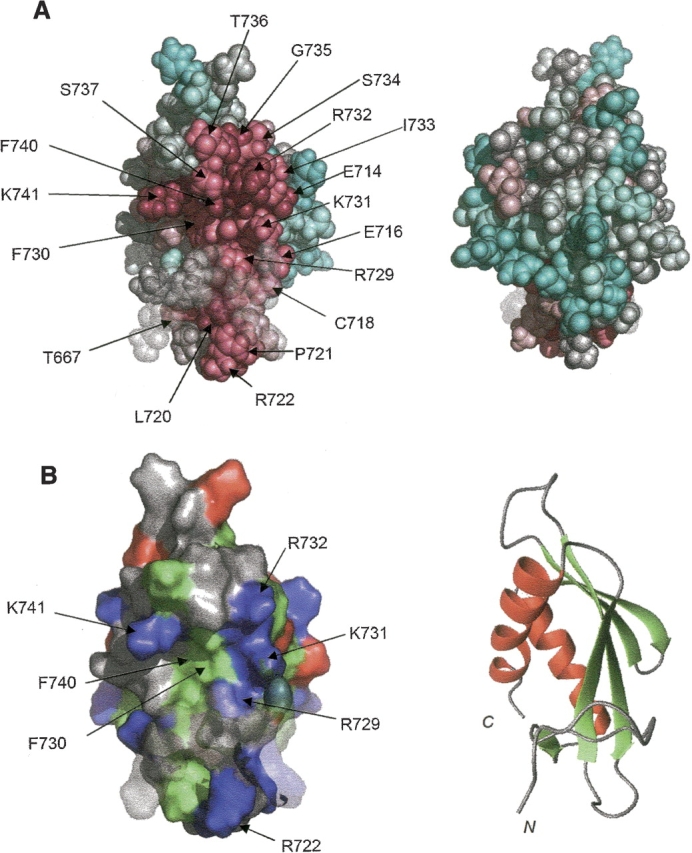
Possible binding site of the KA1 domain. (A) The structure of the KA1 domain is represented as a space filling model. The most highly conserved residues are scored 9 and colored magenta, while the most variable ones are scored 1 and colored blue. Intermediately conserved residues are colored on a graded scheme between these two extremes. The conservation scores were calculated with the program ConSurf (Glaser et al. 2003), using the sequence alignment of the MARK/PAR-1/kin1 and MELK proteins (shown in ▶). The right view is rotated by 180° around the vertical axis from the left view. (B) Distribution of charged and hydrophobic residues on the surface of the KA1 domain (left). Positively charged, negatively charged, and hydrophobic residues are colored blue, red, and green, respectively. Conserved residues are labeled. A ribbon diagram is also shown in the right panel. The β-strands and α-helices are colored green and red, respectively. The orientations are the same as that in A.
This putative binding site is supported by the structural analysis of the truncated KA1 (Asp674–Leu753). We determined the solution structure of the truncated KA1 (Asp674–Leu753) in a similar manner and found that its structure is very similar to that of the KA1 domain (▶). However, the N-terminal tag sequence, corresponding to the TEV protease cleavage site, forms an artificial β-strand (β1′), which constitutes the β-sheet with the C-terminal region of β5 (▶,▶). Although the KA1 domain structure also has a β-strand (β1) at the N terminus, this β1 is shorter than β1′, and it forms the β-sheet with the N-terminal region of β5 (▶). As a result, this β1′covers the region corresponding to the hydrophobic, concave surface of the KA1 domain, indicating that this region has the potential to bind some ligands.
Figure 4.

The solution structure of the truncated KA1 (Asp674–Leu753) of mouse MARK3. Stereoview of the backbone superposition of the 20 lowest-energy structures of the truncated KA1 (Asp674–Leu753). The region corresponding to the native-His affinity tag sequence, with the TEV protease cleavage site at the N terminus, is colored yellow. The region corresponding to the sequence derived from the expression vector at the C terminus is colored cyan. The N and C termini are labeled. (B) Superposition of ribbon diagrams of the structures of the KA1 domain and the truncated KA1 (Asp674–Leu753). The KA1 domain is colored blue, except for the region of the N-terminal sequence derived from the expression vector, which is colored magenta. The truncated KA1 (Asp674–Leu753) is colored gray, except for the regions of both the N- and C-terminal sequences derived from the expression vector, which are colored yellow and cyan, respectively. The orientation is the same as that in ▶.
In summary, we determined the solution structure of the KA1 domain of mouse MARK3. Unexpectedly, we found that ∼50 additional N-terminal residues preceding the Pfam-defined KA1 (Asp704–Leu753) are indispensable for the proper folding of the KA1 domain. The multiple sequence alignment based on the KA1 domain region indicated that the highly conserved residues are clustered at a specific site. We propose that this highly conserved surface is the ligand binding site of the KA1 domain.
Materials and methods
Protein expression and purification
The DNA encoding the KA1 domain (Arg659–Leu753) of mouse MARK3 (SwissProt accession no. Q03141) was subcloned by PCR from the mouse full-length cDNA clone, with the ID RIKEN cDNA 1600015G02 (Kawai et al. 2001; Bono et al. 2002), which has a single mutation (Asp to Gly at position 684). This DNA fragment was cloned into the expression vector pCR2.1 (Invitrogen), as a fusion with an N-terminal native His affinity tag and a TEV protease cleavage site. The 13C/15N-labeled fusion protein was synthesized by the cell-free protein expression system (Kigawa et al. 1999, 2004). The lysate was clarified by centrifugation at 16,000g for 20 min and filtration with a 0.45-μm membrane (Millipore). The clarified lysate was applied to a 5 mL HiTrap Chelating HP column (Amersham Biosciences) equilibrated with buffer A (50 mM sodium phosphate buffer at pH 8.0 containing 500 mM NaCl, 20 mM imidazole) on an ÄKTA Explore system (Amersham Biosciences). The bound protein was released with elution buffer B (50 mM sodium phosphate buffer at pH 8.0 containing 500 mM NaCl, 500 mM imidazole), and the fusion tag was cleaved by a treatment with TEV protease for 1 h at 30°C. After dialysis against buffer A without imidazole, the dialysate was mixed with imidazole (20 mM final concentration) and then applied to a 1 mL HiTrap Chelating HP column equilibrated with buffer A, which was eluted with a concentration gradient of buffer A and buffer B. The flow through fraction was dialyzed against buffer C (20 mM sodium phosphate buffer at pH 7.2 containing 1 mM phenylmethylsulfonyl fluoride [PMSF]). The dialysate was loaded on a cation exchange column (HiTrap SP; Amersham Biosciences), which was eluted with a concentration gradient of buffer C and buffer D (20 mM sodium phosphate buffer at pH 7.2 containing 1 M NaCl, 1 mM PMSF). The KA1 domain-containing fractions were collected. The identity of the protein was verified by MALDI-TOF mass spectrometry (data not shown). The NMR sample contained ∼1 mM of uniformly 13C/15N-labeled KA1 protein, in 20 mM sodium phosphate buffer (pH 6.0) containing 100 mM NaCl, 1 mM 1,4-DL-dithiothreitol-d10 (d10-DTT), 0.02% NaN3, and 10% 2H2O/90% 1H2O.
NMR spectroscopy, structure determination, and analysis
All NMR experiments were performed at 298 K on Bruker AVANCE 700 and 800 spectrometers. Sequence-specific resonance assignments were made by using the standard triple-resonance techniques (Wüthrich 1986; Ikura et al. 1990; Bax et al. 1994; Cavanagh et al. 1996; Kay 1997). The backbone assignment was achieved by the combined analysis of HNCO, HNCACO, HNCA, HNCOCA, CBCACONH, HNCACB, and CCCONNH spectra. The aliphatic side chain resonances were assigned by the combined use of HCCONH, HCCH-TOCSY, HCCH-COSY, and 15N-edited NOESY-HSQC spectra. The side chains of the aromatic residues were assigned mainly by analyzing the HCCH-COSY and 13C-edited NOESY-HSQC spectra for the aromatic region. The 15N-edited NOESY-HSQC and 13C-edited NOESY-HSQC spectra with 80-msec mixing times were used for the structure calculation. The spectra were processed with the program NMRPipe (Delaglio et al. 1995). KUJIRA (N. Kobayashi, pers. comm.), a software package of integrated modules, was used for the systematic and interactive analysis of the NMR data. NMRView (Johnson and Blevins 1994) was used as a core module of KUJIRA for displaying contour plots and controlling spectrum windows. Automated NOE cross-peak assignments and structure calculations with torsion angle dynamics were performed using the software package CYANA (Güntert et al. 1997; Herrmann et al. 2002; Jee and Güntert 2003; Güntert 2004). The φ and ψ restraints from the TALOS program (Cornilescu et al. 1999) were also included for the calculations, with allowed ranges of ±20°.
The final structure calculations with CYANA were started from 100 conformers with random torsion angle values. The 20 conformers with the lowest final CYANA target function values were selected for the final structure set. The structures were validated by using PROCHECK-NMR (Laskowski et al. 1996). Figures were generated with the MOLMOL program (Koradi et al. 1996) and the PyMol program (DeLano Scientific). The program ConSurf (Glaser et al. 2003) was employed to identify the functionally important regions on the surface of the protein.
Construction of the newly defined KA1 HMM profile
We first performed a PSI-BLAST search (Altschul et al. 1997) with the region Arg659–Leu753 of mouse MARK3 against the NCBI nonredundant sequence database. In total, five iterations were performed with the default parameter settings. The multiple sequence alignment of the acquired KA1 domain sequences was carried out by using the ClustalW program (Thompson et al. 1994) and then was edited manually. We used these aligned sequences as input for the hmmbuild program of the HMMER 2.3.2 package (Eddy 1998), to construct a profile of the KA1 domain. With this profile, we searched the NCBI nonredundant sequence database, using the hmmsearch program of the HMMER 2.3.2 package. Finally, we modified the multiple sequence alignment of the KA1 domains, based on this hmmsearch result.
PDB accession numbers
The structures of the KA1 domain and the truncated KA1 (Asp674–Leu753) of mouse MARK3 have been deposited in the PDB, with the accession numbers 1UL7 and 1V5S, respectively.
Acknowledgments
We thank Emi Nunokawa, Satoru Watanabe, Yukiko Fujikura, Natsuko Matsuda, Yukako Miyata, Masaomi Ikari, Fumiko Hiroyasu, Takushi Harada, Miyuki Sato, and Satoko Yasuda for their technical assistance, and Hiroko Uda, Nobuhiro Hayami, Naomi Oobayashi, Yuki Kamewari, Hiroaki Hamana, and Kinosita Yukiko for the sample preparation. We also thank Azusa Ishii, Kiyomi Yajima, and Tomoko Nakayama for expert secretarial assistance. This work was supported by the RIKEN Structural Genomics/Proteomics Initiative (RSGI), the National Project on Protein Structural and Functional Analyses, Ministry of Education, Culture, Sports, Science and Technology of Japan.
Footnotes
Reprint requests to: Shigeyuki Yokoyama, RIKEN Genomic Sciences Center, 1-7-22 Suehiro-cho, Tsurumi, Yokohama 230-0045, Japan; e-mail: yokoyama@biochem.s.u-tokyo.ac.jp; fax: (81) 45-503-9195.
Abbreviations: MAP, microtubule-associated protein; MARK, microtubule-associated protein/microtubule affinity-regulating kinase; PAR-1, partitioning-defective 1; UBA, ubiquitin-associated; KA1, kinase-associated domain 1; ELKL motif, Glu-Leu-Lys-Leu motif; MELK, maternal embryonic leucine zipper kinase; SnRK1, Snf1-related protein kinase 1; NMY-2, nonmuscle myosin II heavy chain; NOE, nuclear Overhauser enhancement; HSQC, heteronuclear single quantum coherence spectroscopy; NOESY, nuclear Overhauser enhancement spectroscopy; PDB, Protein Data Bank; TOCSY, total correlation spectroscopy; COSY, correlated spectroscopy; MALDI-TOF, matrix-assisted laser desorption ionization–time of flight; TALOS, torsion angle likelihood obtained from shift and sequence similarity.
Article and publication are at http://www.proteinscience.org/cgi/doi/10.1110/ps.062391106.
References
- Akiyama, Y., Onizuka, K., Noguchi, T., and Ando, M. 1998. Parallel Protein Information Analysis (PAPIA) system running on a 64-node PC Cluster. In Proceedings of the 9th Genome Informatics Workshop (GIW’98). pp. 131–140. Universal Academy Press, Tokyo, Japan. [PubMed]
- Altschul, S.F., Madden, T.L., Schäffer, A.A., Zhang, J., Zhang, Z., Miller, W., and Lipman, D.J. 1997. Gapped BLAST and PSI-BLAST: A new generation of protein database search programs. Nucleic Acids Res. 25 3389–3402. [DOI] [PMC free article] [PubMed] [Google Scholar]
- Andersen, S.S. 1998. Xenopus interphase and mitotic microtubule-associated proteins differentially suppress microtubule dynamics in vitro. Cell Motil. Cytoskeleton 41 202–213. [DOI] [PubMed] [Google Scholar]
- Barral, Y., Parra, M., Bidlingmaier, S., and Snyder, M. 1999. Nim1-related kinases coordinate cell cycle progression with the organization of the peripheral cytoskeleton in yeast. Genes & Dev. 13 176–187. [DOI] [PMC free article] [PubMed] [Google Scholar]
- Bax, A., Vuister, G.W., Grzesiek, S., Delaglio, F., Wang, A.C., Tschudin, R., and Zhu, G. 1994. Measurement of homo- and heteronuclear J couplings from quantitative J correlation. Methods Enzymol. 239 79–105. [DOI] [PubMed] [Google Scholar]
- Bessone, S., Vidal, F., Le Bouc, Y., Epelbaum, J., Bluet-Pajot, M.T., and Darmon, M. 1999. EMK protein kinase-null mice: Dwarfism and hypofertility associated with alterations in the somatotrope and prolactin pathways. Dev. Biol. 214 87–101. [DOI] [PubMed] [Google Scholar]
- Beullens, M., Vancauwenbergh, S., Morrice, N., Derua, R., Ceulemans, H., Waelkens, E., and Bollen, M. 2005. Substrate specificity and activity regulation of protein kinase MELK. J. Biol. Chem. 280 40003–40011. [DOI] [PubMed] [Google Scholar]
- Bondareff, W., Harrington, C.R., Wischik, C.M., Hauser, D.L., and Roth, M. 1995. Absence of abnormal hyperphosphorylation of tau in intracellular tangles in Alzheimer's disease. J. Neuropathol. Exp. Neurol. 54 657–663. [DOI] [PubMed] [Google Scholar]
- Bono, H., Kasukawa, T., Furuno, M., Hayashizaki, Y., and Okazaki, Y. 2002. FANTOM DB: Database of functional annotation of RIKEN mouse cDNA clones. Nucleic Acids Res. 30 116–118. [DOI] [PMC free article] [PubMed] [Google Scholar]
- Brich, J., Shie, F.S., Howell, B.W., Li, R., Tus, K., Wakeland, E.K., Jin, L.W., Mumby, M., Churchill, G., and Herz, J., et al. 2003. Genetic modulation of tau phosphorylation in the mouse. J. Neurosci. 23 187–192. [DOI] [PMC free article] [PubMed] [Google Scholar]
- Cavanagh, J., Fairbrother, W.J., Palmer, A.G., and Skelton, N.J. 1996. Protein NMR spectroscopy, principles and practice. Academic Press, NY.
- Chartrain, I., Couturier, A., and Tassan, J.P. 2006. Cell cycle dependent cortical localization of pEg3 protein kinase in Xenopus and human cells. Biol. Cell 98 253–263. [DOI] [PubMed] [Google Scholar]
- Cornilescu, G., Delaglio, F., and Bax, A. 1999. Protein backbone angle restraints from searching a database for chemical shift and sequence homology. J. Biomol. NMR 13 289–302. [DOI] [PubMed] [Google Scholar]
- Cox, D.N., Lu, B., Sun, T.Q., Williams, L.T., and Jan, Y.N. 2001. Drosophila par-1 is required for oocyte differentiation and microtubule organization. Curr. Biol. 11 75–87. [DOI] [PubMed] [Google Scholar]
- Delaglio, F., Grzesiek, S., Vuister, G.W., Zhu, G., Pfeifer, J., and Bax, A. 1995. NMRPipe: A multidimensional spectral processing system based on UNIX pipes. J. Biomol. NMR 6 277–293. [DOI] [PubMed] [Google Scholar]
- Doerflinger, H., Benton, R., Shulman, J.M., and St. Johnston, D. 2003. The role of PAR-1 in regulating the polarised microtubule cytoskeleton in the Drosophila follicular epithelium. Development 130 3965–3975. [DOI] [PubMed] [Google Scholar]
- Drewes, G. 2004. MARKing tau for tangles and toxicity. Trends Biochem. Sci. 29 548–555. [DOI] [PubMed] [Google Scholar]
- Drewes, G., Ebneth, A., and Mandelkow, E.M. 1998. MAPs, MARKs and microtubule dynamics. Trends Biochem. Sci. 23 307–311. [DOI] [PubMed] [Google Scholar]
- Ebneth, A., Drewes, G., Mandelkow, E.M., and Mandelkow, E. 1999. Phosphorylation of MAP2c and MAP4 by MARK kinases leads to the destabilization of microtubules in cells. Cell Motil. Cytoskeleton 44 209–224. [DOI] [PubMed] [Google Scholar]
- Eddy, S.R. 1998. Profile hidden Markov models. Bioinformatics 14 755–763. [DOI] [PubMed] [Google Scholar]
- Eidenmüller, J., Fath, T., Hellwig, A., Reed, J., Sontag, E., and Brandt, R. 2000. Structural and functional implications of tau hyperphosphorylation: Information from phosphorylation-mimicking mutated tau proteins. Biochemistry 39 13166–13175. [DOI] [PubMed] [Google Scholar]
- Elbert, M., Rossi, G., and Brennwald, P. 2005. The yeast par-1 homologs kin1 and kin2 show genetic and physical interactions with components of the exocytic machinery. Mol. Biol. Cell 16 532–549. [DOI] [PMC free article] [PubMed] [Google Scholar]
- Espinosa, L. and Navarro, E. 1998. Human serine/threonine protein kinase EMK1: Genomic structure and cDNA cloning of isoforms produced by alternative splicing. Cytogenet. Cell Genet. 81 278–282. [DOI] [PubMed] [Google Scholar]
- Glaser, F., Pupko, T., Paz, I., Bell, R.E., Bechor-Shental, D., Martz, E., and Ben-Tal, N. 2003. ConSurf: Identification of functional regions in proteins by surface-mapping of phylogenetic information. Bioinformatics 19 163–164. [DOI] [PubMed] [Google Scholar]
- Gong, C.X., Lidsky, T., Wegiel, J., Zuck, L., Grundke-Iqbal, I., and Iqbal, K. 2000. Phosphorylation of microtubule-associated protein tau is regulated by protein phosphatase 2A in mammalian brain: Implications for neurofibrillary degeneration in Alzheimer's disease. J. Biol. Chem. 275 5535–5544. [DOI] [PubMed] [Google Scholar]
- Güntert, P. 2004. Automated NMR structure calculation with CYANA. Methods Mol. Biol. 278 353–378. [DOI] [PubMed] [Google Scholar]
- Güntert, P., Mumenthaler, C., and Wüthrich, K. 1997. Torsion angle dynamics for NMR structure calculation with the new program DYANA. J. Mol. Biol. 273 283–298. [DOI] [PubMed] [Google Scholar]
- Guo, S. and Kemphues, K.J. 1995. par-1, a gene required for establishing polarity in C. elegans embryos, encodes a putative Ser/Thr kinase that is asymmetrically distributed. Cell 81 611–620. [DOI] [PubMed] [Google Scholar]
- Guo, S. and Kemphues, K.J. 1996. A non-muscle myosin required for embryonic polarity in Caenorhabditis elegans. Nature 382 455–458. [DOI] [PubMed] [Google Scholar]
- Herrmann, T., Güntert, P., and Wüthrich, K. 2002. Protein NMR structure determination with automated NOE assignment using the new software CANDID and the torsion angle dynamics algorithm DYANA. J. Mol. Biol. 319 209–227. [DOI] [PubMed] [Google Scholar]
- Holm, L. and Sander, C. 1995. Dali: A network tool for protein structure comparison. Trends Biochem. Sci. 20 478–480. [DOI] [PubMed] [Google Scholar]
- Ikura, M., Kay, L.E., and Bax, A. 1990. A novel approach for sequential assignment of 1H, 13C, and 15N spectra of proteins: Heteronuclear triple-resonance three-dimensional NMR spectroscopy. Application to calmodulin. Biochemistry 29 4659–4667. [DOI] [PubMed] [Google Scholar]
- Illenberger, S., Drewes, G., Trinczek, B., Biernat, J., Meyer, H.E., Olmsted, J.B., Mandelkow, E.M., and Mandelkow, E. 1996. Phosphorylation of microtubule-associated proteins MAP2 and MAP4 by the protein kinase p110mark: Phosphorylation sites and regulation of microtubule dynamics. J. Biol. Chem. 271 10834–10843. [DOI] [PubMed] [Google Scholar]
- Jee, J. and Güntert, P. 2003. Influence of the completeness of chemical shift assignments on NMR structures obtained with automated NOE assignment. J. Struct. Funct. Genomics 4 179–189. [DOI] [PubMed] [Google Scholar]
- Johnson, B. and Blevins, R. 1994. NMRView: A computer program for the visualization and analysis of NMR data. J. Biomol. NMR 4 603–614. [DOI] [PubMed] [Google Scholar]
- Kawai, J., Shinagawa, A., Shibata, K., Yoshino, M., Itoh, M., Ishii, Y., Arakawa, T., Hara, A., Fukunishi, Y., and Konno, H., et al. 2001. Functional annotation of a full-length mouse cDNA collection. Nature 409 685–690. [DOI] [PubMed] [Google Scholar]
- Kay, L.E. 1997. NMR methods for the study of protein structure and dynamics. Biochem. Cell Biol. 75 1–15. [DOI] [PubMed] [Google Scholar]
- Kemphues, K.J., Priess, J.R., Morton, D.G., and Cheng, N.S. 1988. Identification of genes required for cytoplasmic localization in early C. elegans embryos. Cell 52 311–320. [DOI] [PubMed] [Google Scholar]
- Kigawa, T., Yabuki, T., Yoshida, Y., Tsutsui, M., Ito, Y., Shibata, T., and Yokoyama, S. 1999. Cell-free production and stable-isotope labeling of milligram quantities of proteins. FEBS Lett. 442 15–19. [DOI] [PubMed] [Google Scholar]
- Kigawa, T., Yabuki, T., Matsuda, N., Matsuda, T., Nakajima, R., Tanaka, A., and Yokoyama, S. 2004. Preparation of Escherichia coli cell extract for highly productive cell-free protein expression. J. Struct. Funct. Genomics 5 63–68. [DOI] [PubMed] [Google Scholar]
- Kim, Y., Geiger, J.H., Hahn, S., and Sigler, P.B. 1993. Crystal structure of a yeast TBP/TATA-box complex. Nature 365 512–520. [DOI] [PubMed] [Google Scholar]
- Koradi, R., Billeter, M., and Wüthrich, K. 1996. MOLMOL: A program for display and analysis of macromolecular structures. J. Mol. Graph. 14 29–32. [DOI] [PubMed] [Google Scholar]
- Laskowski, R.A., Rullmann, J.A., MacArthur, M.W., Kaptein, R., and Thornton, J.M. 1996. AQUA and PROCHECK-NMR: Programs for checking the quality of protein structures solved by NMR. J. Biomol. NMR 8 477–486. [DOI] [PubMed] [Google Scholar]
- Li, H., Berlin, Y., Hart, R.P., and Grumet, M. 2003. Microtubules are critical for radial glial morphology: Possible regulation by MAPs and MARKs. Glia 44 37–46. [DOI] [PubMed] [Google Scholar]
- Maccioni, R.B. and Cambiazo, V. 1995. Role of microtubule-associated proteins in the control of microtubule assembly. Physiol. Rev. 75 835–864. [DOI] [PubMed] [Google Scholar]
- Manabe, R., Whitmore, L., Weiss, J.M., and Horwitz, A.R. 2002. Identification of a novel microtubule-associated protein that regulates microtubule organization and cytokinesis by using a GFP-screening strategy. Curr. Biol. 12 1946–1951. [DOI] [PubMed] [Google Scholar]
- Marx, A., Pless, J., Mandelkow, E.M., and Mandelkow, E. 2000. On the rigidity of the cytoskeleton: are MAPs crosslinkers or spacers of microtubules? Cell. Mol. Biol. 46 949–965. [PubMed] [Google Scholar]
- Mercken, M., Fischer, I., Kosik, K.S., and Nixon, R.A. 1995. Three distinct axonal transport rates for tau, tubulin, and other microtubule-associated proteins: Evidence for dynamic interactions of tau with microtubules in vivo. J. Neurosci. 15 8259–8267. [DOI] [PMC free article] [PubMed] [Google Scholar]
- Nikolaou, S., Hartman, D., Presidente, P.J., Newton, S.E., and Gasser, R.B. 2002. HcSTK, a Caenorhabditis elegans PAR-1 homologue from the parasitic nematode. Haemonchus contortus. Int. J. Parasitol. 32 749–758. [DOI] [PubMed] [Google Scholar]
- Okawa, Y., Ishiguro, K., and Fujita, S.C. 2003. Stress-induced hyperphosphorylation of tau in the mouse brain. FEBS Lett. 535 183–189. [DOI] [PubMed] [Google Scholar]
- Ossipova, O., He, X., and Green, J. 2002. Molecular cloning and developmental expression of Par-1/MARK homologues XPar-1A and XPar-1B from Xenopus laevis. Mech. Dev. 119 S143–S148. [DOI] [PubMed] [Google Scholar]
- Panneerselvam, S., Marx, A., Mandelkow, E.M., and Mandelkow, E. 2006. Structure of the catalytic and ubiquitin-associated domains of the protein kinase MARK/Par-1. Structure 14 173–183. [DOI] [PubMed] [Google Scholar]
- Planel, E., Yasutake, K., Fujita, S.C., and Ishiguro, K. 2001. Inhibition of protein phosphatase 2A overrides tau protein kinase I/glycogen synthase kinase 3β and cyclin-dependent kinase 5 inhibition and results in tau hyperphosphorylation in the hippocampus of starved mouse. J. Biol. Chem. 276 34298–34306. [DOI] [PubMed] [Google Scholar]
- Planel, E., Miyasaka, T., Launey, T., Chui, D.H., Tanemura, K., Sato, S., Murayama, O., Ishiguro, K., Tatebayashi, Y., and Takashima, A. 2004. Alterations in glucose metabolism induce hypothermia leading to tau hyperphosphorylation through differential inhibition of kinase and phosphatase activities: Implications for Alzheimer's disease. J. Neurosci. 24 2401–2411. [DOI] [PMC free article] [PubMed] [Google Scholar]
- Sato-Harada, R., Okabe, S., Umeyama, T., Kanai, Y., and Hirokawa, N. 1996. Microtubule-associated proteins regulate microtubule function as the track for intracellular membrane organelle transports. Cell Struct. Funct. 21 283–295. [DOI] [PubMed] [Google Scholar]
- Shulman, J.M., Benton, R., and St Johnston, D. 2000. The Drosophila homolog of C. elegans PAR-1 organizes the oocyte cytoskeleton and directs oskar mRNA localization to the posterior pole. Cell 101 377–388. [DOI] [PubMed] [Google Scholar]
- Tassan, J.P. and Le Goff, X. 2004. An overview of the KIN1/PAR-1/MARK kinase family. Biol. Cell. 96 193–199. [DOI] [PubMed] [Google Scholar]
- Thompson, J.D., Higgins, D.G., and Gibson, T.J. 1994. CLUSTAL W: Improving the sensitivity of progressive multiple sequence alignment through sequence weighting, position-specific gap penalties and weight matrix choice. Nucleic Acids Res. 22 4673–4680. [DOI] [PMC free article] [PubMed] [Google Scholar]
- Timm, T., Li, X.Y., Biernat, J., Jiao, J., Mandelkow, E., Vandekerckhove, J., and Mandelkow, E.M. 2003. MARKK, a Ste20-like kinase, activates the polarity-inducing kinase MARK/PAR-1. EMBO J. 22 5090–5101. [DOI] [PMC free article] [PubMed] [Google Scholar]
- Tomancak, P., Piano, F., Riechmann, V., Gunsalus, K.C., Kemphues, K.J., and Ephrussi, A. 2000. A Drosophila melanogaster homologue of Caenorhabditis elegans par-1 acts at an early step in embryonic-axis formation. Nat. Cell Biol. 2 458–460. [DOI] [PubMed] [Google Scholar]
- Trinczek, B., Brajenovic, M., Ebneth, A., and Drewes, G. 2004. MARK4 is a novel microtubule-associated proteins/microtubule affinity-regulating kinase that binds to the cellular microtubule network and to centrosomes. J. Biol. Chem. 279 5915–5923. [DOI] [PubMed] [Google Scholar]
- Wendt, T., Taylor, D., Trybus, K.M., and Taylor, K. 2001. Three-dimensional image reconstruction of dephosphorylated smooth muscle heavy meromyosin reveals asymmetry in the interaction between myosin heads and placement of subfragment 2. Proc. Natl. Acad. Sci. 98 4361–4366. [DOI] [PMC free article] [PubMed] [Google Scholar]
- Wüthrich, K. 1986. NMR of proteins and nucleic acids. John Wiley & Sons, New York.
- Yanagisawa, M., Planel, E., Ishiguro, K., and Fujita, S.C. 1999. Starvation induces tau hyperphosphorylation in mouse brain: Implications for Alzheimer's disease. FEBS Lett. 461 329–333. [DOI] [PubMed] [Google Scholar]