Abstract
Protein structures in the Protein Data Bank provide a wealth of data about the interactions that determine the native states of proteins. Using the probability theory, we derive an atomic distance-dependent statistical potential from a sample of native structures that does not depend on any adjustable parameters (Discrete Optimized Protein Energy, or DOPE). DOPE is based on an improved reference state that corresponds to noninteracting atoms in a homogeneous sphere with the radius dependent on a sample native structure; it thus accounts for the finite and spherical shape of the native structures. The DOPE potential was extracted from a nonredundant set of 1472 crystallographic structures. We tested DOPE and five other scoring functions by the detection of the native state among six multiple target decoy sets, the correlation between the score and model error, and the identification of the most accurate non-native structure in the decoy set. For all decoy sets, DOPE is the best performing function in terms of all criteria, except for a tie in one criterion for one decoy set. To facilitate its use in various applications, such as model assessment, loop modeling, and fitting into cryo-electron microscopy mass density maps combined with comparative protein structure modeling, DOPE was incorporated into the modeling package MODELLER-8.
Keywords: statistical potential, protein structure prediction, comparative or homology modeling, model assessment
The native structure generally has the lowest free energy of all states under the native conditions (Anfinsen 1972, 1973). Therefore, an accurate free energy function would enable the prediction and assessment of protein structures (Dill 1985, 1997; Bryngelson et al. 1995; Dobson et al. 1998; Shakhnovich 2006). In principle, the free energy surface of a protein can be derived by thoroughly sampling the potential energy surface defined by a molecular mechanics force field (Brooks et al. 1988). However, this approach is computationally prohibitive and may be further limited by errors in potential energy functions. Instead of relying on free energy, an alternative approach is to construct a scoring function whose global minimum also corresponds to the native structure from a sample of native structures of different sequences (Tanaka and Scheraga 1976; Miyazawa and Jernigan 1985; Sippl 1990) deposited in the Protein Data Bank (PDB) (Kouranov et al. 2006). Due to its dependence on known protein structures, such a scoring function is often termed a knowledge-based or statistical potential.
The pioneering work of Tanaka and Scheraga (1976) related the frequencies of contact between different residue types, obtained from known native structures, to the free energies of corresponding interactions using the simple relationship between free energy and the equilibrium constant. Their work was followed by that of Miyazawa and Jernigan (1985, 1996, 1999), who developed residue contact statistical potentials using a quasichemical approximation. A new form of a statistical potential dependent on a distance between two residue types was then proposed independently by Sippl (1990, 1993a, b), based on the assumption that the distributions of distances between different residue types in diverse native structures in PDB are Boltzmann-like.
Subsequently, a large number of different statistical potentials were described and tested (Hendlich et al. 1990; Colovos and Yeates 1993; Sippl 1993a; Kocher et al. 1994; Huang et al. 1995; Rooman and Wodak 1995; Jernigan and Bahar 1996; Jones and Thornton 1996; Miyazawa and Jernigan 1996; Moult 1997; Park and Levitt 1996; Park et al. 1997; Reva et al. 1997; Simons et al. 1997; Vajda et al. 1997; Furuichi and Koehl 1998; Melo and Feytmans 1998;Rooman and Gilis 1998; Samudrala and Moult 1998; Betancourt and Thirumalai 1999; Jones 1999b; Rojnuckarin and Subramaniam 1999; Simons et al. 1999; Bastolla et al. 2000; Chiu and Goldstein 2000; Gatchell et al. 2000; Lazaridis and Karplus 2000; Vendruscolo et al. 2000; Lu and Skolnick 2001; Melo et al. 2002; Keasar and Levitt 2003; Zhou and Zhou 2003; Betancourt and Skolnick 2004; Buchete et al. 2004a,b; Wang et al. 2004; Zhang et al. 2004; Chen and Shakhnovich 2005; Fang and Shortle 2005; Qiu and Elber 2005; Summa et al. 2005; Dehouck et al. 2006; Eramian et al. 2006). Statistical potentials can be classified by the following characteristics: (1) protein representation (e.g., centroids of amino acid residues, Cα/Cβ atoms, and all atoms), (2) the restrained spatial feature (e.g., solvent accessibility, contact, distance, torsional angle), and (3) the reference state. Statistical potentials for the all-atom representation are generally more accurate than those for an amino acid residue representation (Samudrala and Moult 1998; Lu and Skolnick 2001; Melo et al. 2002; Zhou and Zhou 2002). The most commonly used statistical potentials depend on atomic distances only.
Statistical potentials are widely used in numerous applications because of their relative simplicity, accuracy, and computational efficiency. These applications include assessment of experimentally determined and computationally predicted protein structures (Sippl 1993b; DeBolt and Skolnick 1996; Gatchell et al. 2000; Melo et al. 2002; John and Sali 2003; Wang et al. 2004; Topf and Sali 2005; Topf et al. 2006), ab initio protein structure prediction (Bowie et al. 1991; Sun 1993; O'Donoghue and Nilges 1997; Chiu and Goldstein 2000; Tobi and Elber 2000; Tobi et al. 2000), fold recognition or threading (Maiorov and Crippen 1992; Sippl and Weitckus 1992; Bryant and Lawrence 1993; Ouzounis et al. 1993; Huang et al. 1995; DeBolt and Skolnick 1996; Jones and Thornton 1996; Reva et al. 1997; Jones 1999a; Kolinski et al. 1999; Miyazawa and Jernigan 1999, 2000; Panchenko et al. 2000; Skolnick et al. 2000), detection of native-like protein conformations (Hendlich et al. 1990; Casari and Sippl 1992; Bauer and Beyer 1994; Samudrala and Moult 1998; Simons et al. 1999; Gatchell et al. 2000; Vendruscolo et al. 2000), and prediction of protein stability (Gilis and Rooman 1996, 1997).
Perhaps the most essential question in the derivation of a statistical potential is how best to formulate and interpret a scoring function derived from a sample of native structures. In general, the derivation of a statistical potential has been motivated by a presumed analogy between a sample of native structures and the canonical ensemble in statistical mechanics. The principal of the corresponding assumptions is that the distributions of different structural features obtained from a sample of native structures obey the Boltzmann distribution of statistical mechanics (Sippl 1990). However, such a sample contains native states of different sequences at different temperatures, not states of the same sequence over a longer period of time at a specific temperature (Thomas and Dill 1996b), as required by the definition of the canonical ensemble to which the Boltzmann distribution applies. Therefore, alternative interpretations of the origin of the Boltzmann-like distribution for structural features in a sample of native structures have also been suggested (Finkelstein et al. 1995). In this other view, the Boltzmann-like distribution is a consequence of evolution that favors structural features for which more sequences have the global free energy minimum.
As a result of the uncertainties in the very formulation of a statistical potential, there are several related problems, including the question of the most appropriate reference state (Skolnick et al. 1997), the additivity of the individual terms in a statistical potential (BenNaim 1997), as well as balancing of a statistical potential with other terms that may be used in a complete scoring function for protein structure prediction (Misura et al. 2006).
Here, we first identify a statistical potential with the negative logarithm of the joint probability density function of a given protein. We then derive an atomic distance-dependent statistical potential from a sample of native structures based entirely on the probability theory, without recourse to statistical mechanics, thus circumventing the assumption of the Boltzmann distribution. Subsequently, we clarify the assumptions and approximations needed to interpret a statistical potential as a potential of mean force. This approach allowed us to treat the problem of the reference state more accurately than has been done previously. In our theory, the reference state is a finite sphere of uniform density and appropriate size, instead of the distribution of interatomic distances in the sample native structures irrespective of their sizes and atom types. In other words, in contrast to the previous approaches, our reference state explicitly depends on the sizes of the native structures from which the statistical potential is derived. This improvement results in an increased accuracy of protein structure assessment, as demonstrated by testing various statistical potentials, including ours, on multiple decoy sets. We term our new statistical potential Discrete Optimized Protein Energy (DOPE).
We begin by deriving DOPE from a sample of the native structures (see Theory). Next, we describe its accuracy compared to five other scoring functions with the aid of six multiple target decoy sets (see Results). We proceed by discussing its relative successes, failures, and applications (see Discussion). A detailed description of the training and decoy sets, the evaluated scoring functions, and the evaluation criteria are provided in Materials and Methods.
Theory
In this section, we describe the theory of the Discrete Optimized Protein Energy (DOPE). DOPE is an atomic distance-dependent statistical potential calculated from a sample of native protein structures. It is grounded entirely in the probability theory. We first define a statistical potential as the negative logarithm of the joint probability density function (pdf) of the atomic Cartesian coordinates. We then express the joint pdf as a product of pair pdfs. Next, we derive the pair pdf from a distance pdf, extracted from a single sample native structure and a reasonable definition of the reference state. Finally, we show how to combine the pair pdfs from a sample of many native structures of varying size to obtain the joint pdf. We conclude this section by clarifying the assumptions and approximations needed to connect our statistical potential and a potential of mean force.
Joint pdf for a native structure as a product of pair pdfs
Prediction of the native structure of a protein would be enabled by expressing our knowledge of any kind as a scoring function whose global optimum corresponds to the native structure. One such function is a joint probability density function of the Cartesian coordinates of the protein atoms, given available information I about the system,  , where N is the number of atoms in the protein and
 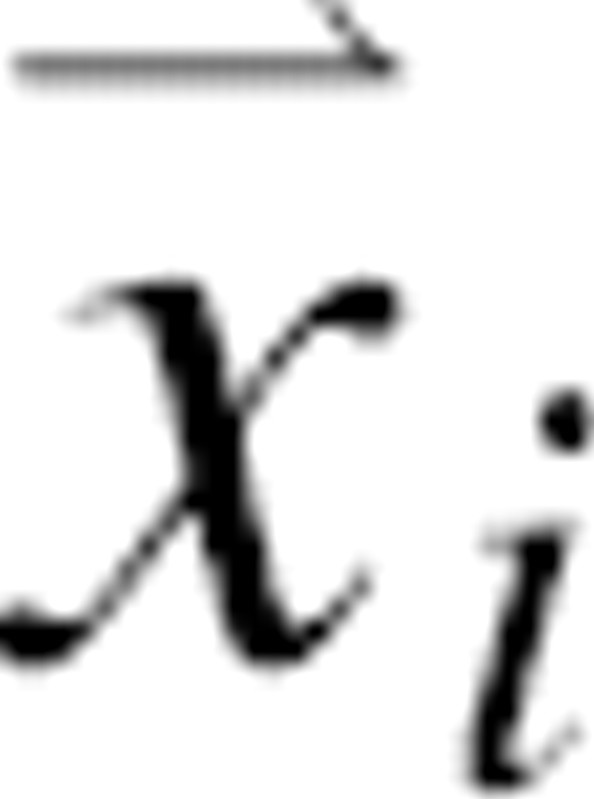 are the Cartesian coordinates of atom i. For each atom in a given protein, the joint pdf p gives the probability density that the atom i of the native structure is positioned very close to
  , given the information I we wish to consider in the calculation. In general, information I may include the sequence of the protein, a molecular mechanics force field, experimental structural information, a sample of known native structures, and an alignment of the sequence to a related known protein structure. For example, when information I reflects only the sequence and the laws of physics under the conditions of the canonical ensemble, the joint pdf corresponds to the Boltzmann distribution. If I also includes a crystallographic data set sufficient to define the native structure precisely, the joint pdf is a Dirac delta function centered on the native atomic coordinates. For simplicity, we omit I from notation in the rest of the paper.
We now wish to estimate the joint pdf for a given protein from a sample of the native structures for different proteins, deposited in the PDB. To minimize the needed size of the sample and to derive a joint pdf for any protein sequence, we seek to approximate the joint pdf p in terms of pdfs for all pairs of atoms in the system, 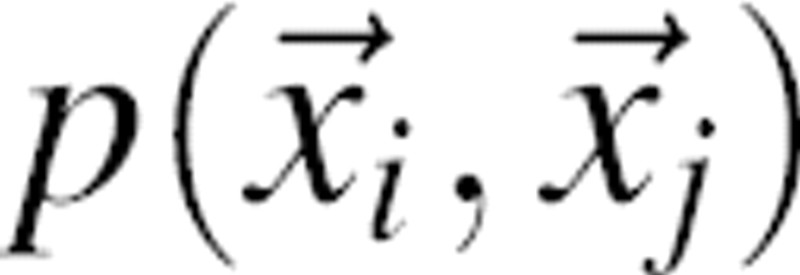 (i.e., pair pdfs); a pair pdf will depend only on the type and position of the two atoms, not on the whole sequence.
As suggested above, the joint pdf p can be approximated by a normalized product of the pair pdfs for all protein atom pairs:
 |
The denominator is derived from the condition that the joint pdf must be a product of single body pdfs when all the pair pdfs are uncorrelated with each other. The terms in the denominator, 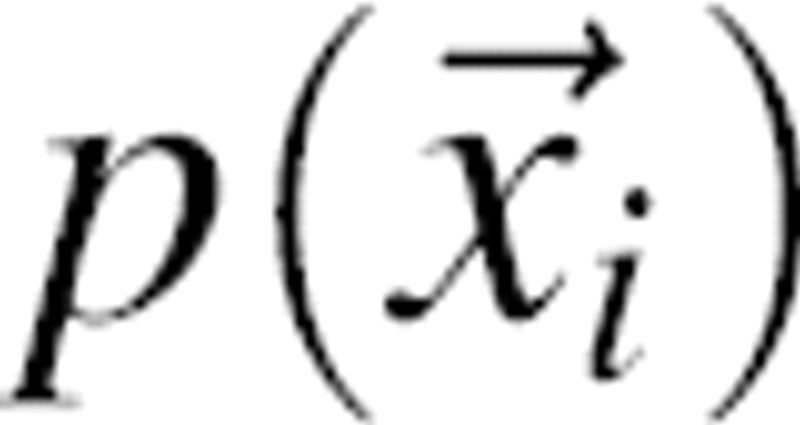 , are single-body distribution functions that depend only on the composition of the protein and the total volume of the system. In other words,
  is the number density of atom i, equal to the reciprocal volume of the system. Because
  is constant for a given protein, it does not impact on the rank order of different conformations and is ignored here.
In the context of the statistical mechanical liquid state theory, Equation 1 is also known as the Kirkwood superposition approximation (Kirkwood 1935). The superposition approximation would be exact only if all the pair pdfs were mutually independent from each other  . The pair pdfs
  of atom pairs are generally interdependent because each atom in the system interacts with more than one other atom; for example, a major source of interdependence of pair pdfs for nonbonded atoms within the same amino acid residue are the chemical bonds. For simple dense liquids, the ratio between the exact three-body distribution and its two-body approximation ranges from 0.8 to 1.2 (Alder 1964; Rahman 1964). In general, the Kirkwood approximation of the joint pdf
  by pair pdfs
  is clearly more accurate than a product of N single-body pdfs,
  .
.
It is tempting to equate interdependence with redundancy and thus minimize the problem by including only a subset of atoms (e.g., only Cβ atoms) in the joint pdf. However, it was found empirically that such simplifications reduce the accuracy of the resulting statistical potentials (Samudrala and Moult 1998; Lu and Skolnick 2001; Melo et al. 2002; Zhou and Zhou 2002). A probable reason is that the all atom pair pdfs jointly encode the preferred relative orientations between whole residues. Correspondingly, it appears to be possible to reduce the number of atoms considered in the joint pdf without sacrificing its accuracy by using orientation-dependent terms (Buchete et al. 2004b), albeit this reduction comes at a cost of introducing additional degrees of freedom into each term.
A general reduction of the joint pdf to lower-order pdfs is provided by the Bogolyubov–Born–Green–Kirkwood–Yvon hierarchy of a chain of integral equations connecting the N-body pdf with simpler pdfs (McQuarrie 1975). Therefore, in principle, the formalism developed here for deriving the joint pdf as a sum of pairwise terms can also be applied to derive the joint pdf approximated by a sum of higher-order terms.
The joint pdf may in principle be improved beyond the superposition approximation by iteratively modifying the individual terms so as to maximize the discrimination between the native and non-native structures (Thomas and Dill 1996a). Although this approach has been applied successfully to a contact statistical potential, it is less likely to work well for the larger parameter space of an atomic distance-dependent statistical potential, such as the one developed here.
Calculation of the pair pdf from the distance pdf estimated from a single sample native structure
We now estimate the pair pdf  for all atom pairs (i,j), using a single sample native structure. A structure is defined by internal coordinates that are invariant with respect to translation and rotation. Thus, the interparticle distance r between
  and
and  is the most relevant internal coordinate for a pair of atoms. Consequently, the distribution that can be estimated directly from a sample native structure is the distance pdf for a pair of atom types:
 |
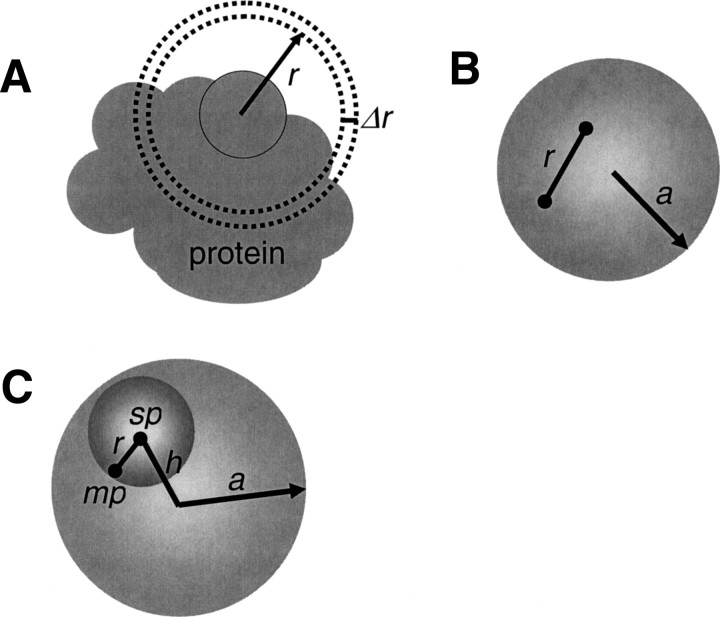
where m and n denote the atom types and Nmn(r) is the number of atom type pairs (m,n) at a distance within [r, r + Δr]. The distance pdf is proportional to the number of (m,n) pairs in a spherical shell of volume 4πr2Δr; thus, the density of the (m,n) pairs in the shell is pmn(r)/4πr2Δr. For a finite and nonspherical native structure, only a fraction ξ(r) of the spherical shell between r and r + Δr centered on  is occupied by protein atoms (0≤ξ(r)≤1) (▶). Thus, the density of the (m,n) pairs at the distance r is pmn(r)/[4πr2ξ(r)].
Figure 1.
Schematic representation of the reference state. (A) An illustration showing why only a fraction of a spherical shell generally contributes to the normalization function (Equation 3). (B) A pair of noninteracting atoms in a protein is modeled by two points positioned randomly inside a sphere with radius a; the points are at distance r from each other. The normalization function n(r) in Equation 7 corresponds to repeating this random assignment for an infinite number of times. (C) The definition of terms used to write Equations 8–11. The large and small spheres are the reference and probe spheres, respectively.
Next, we need to relate the distance pdf pmn(r) to the pair pdf  . The probability of finding atom i at
  and atom j at
 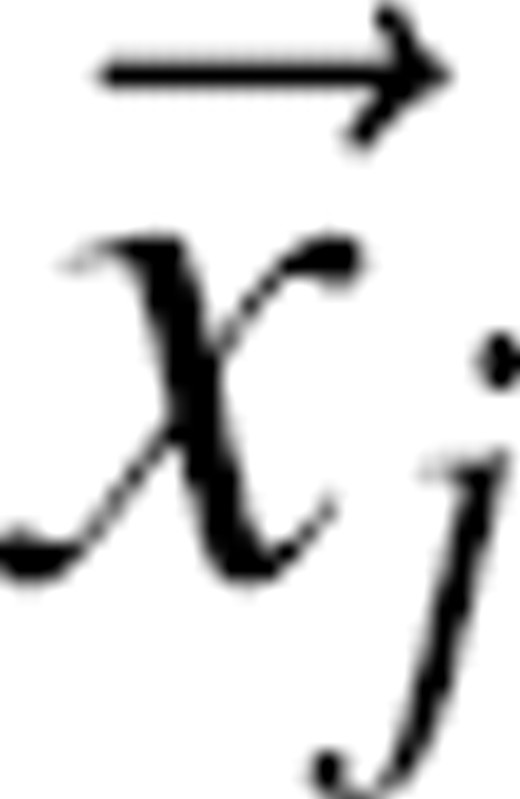 is
is  . Therefore, the pair pdf
  is the product of the pair probability
  and the (m,n) pair density:
 |
where n(r) is the normalization function equal to 4πr2ξ(r), and m and n are the types of atoms i and j, respectively. As mentioned above, the single-body pdf  is the number density of atom i and is ignored because it does not impact on the ranking of different conformations of the same protein.
Normalization function n(r; a) for a single sample native structure
The calculation of the normalization function n(r) is not straightforward because the native structures are finite and varying in size (▶). Therefore, we explicitly denote n(r) as dependent on the size a of the sample native structure, n(r;a). We define the size a to be the radius of the sphere of uniform density that has the same radius of gyration Rg as the sample native structure; thus,  . Similarly, for clarity, we also denote the distance pdf pm,n(r) as pm,n(r;a).
The key simplification in the calculation of the normalization function pm,n(r;a) is as follows: We construct a special state (i.e., the reference state) for which the calculation of pm,n(r;a) is analytically tractable and then assume that this pm,n(r;a) is applicable to any protein of size a. We define the reference state for a sample native structure with the radius of gyration Rg to be a sphere with the same radius of gyration and density, but with uncorrelated uniformly distributed atomic positions (▶); this reference state is independent of the composition. The assumption of uncorrelated uniform atomic density is grounded in the maximum entropy principle corresponding to no prior knowledge about the native structures. It is difficult to justify this particular reference state, especially its finite spherical attribute, other than by intuition and the performance of the corresponding statistical potential in protein structure prediction (Results).
According to Equation 3, in a reference state with uncorrelated positions of atoms i and j
 , the normalization function n(r;a) is equal to the distance pdf
  . Although
  and n(r;a) for a sphere have already been calculated (Deltheli 1919; Hammersley 1950; Lord 1954; de Smith 1977; Tu and Fischbach 2002; Garcia-Pelayo 2005), we re-derive them here for completeness.
We start by placing a stationary point (sp) on the center of the sphere encompassing the reference state (h = 0) while allowing a mobile point (mp) to move freely on the surface of a smaller “probe” sphere at a distance r from sp (small sphere in ▶). Because the mobile point cannot be outside of the reference sphere, the partial normalization function m(r;a) for an atom at the center of the reference sphere is
 |
Next, we offset the stationary point from the center of the reference sphere by distance h ≤ a. For distance r smaller than a − h, the mobile point must reside inside the sphere; thus, m(r;a) remains 4πr2. For a − h ≤ r ≤ a + h, the mobile point touches the reference sphere surface; thus, m(r;a) is proportional to the intersecting surface area of the probe sphere that remains within the reference sphere (Wodak and Janin 1980). Therefore, m(r;a) of the offset point is
 |
The normalization function is thus determined by integrating m(r;a) over all possible offsets h:
 |
which yields the normalization function:
 |
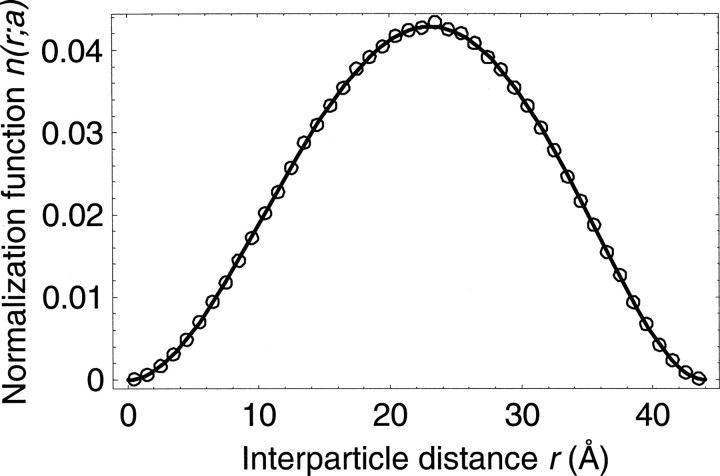
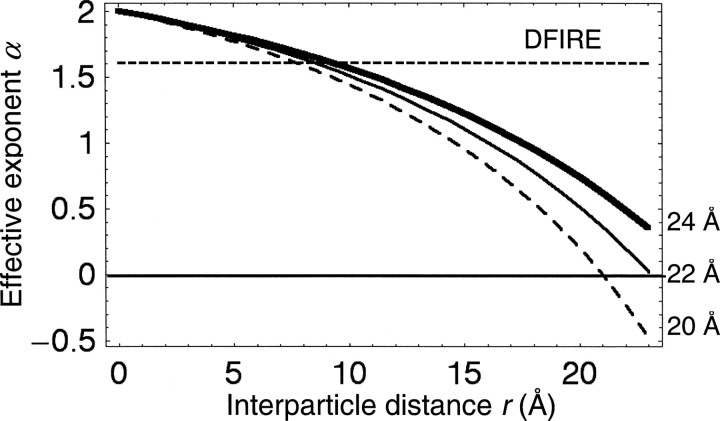
where rc is some upper bound on the range of the statistical potential. Equation 7 is validated numerically by the histogram of one million pairs of randomly generated distances inside a 22 Å sphere (the average size of a ∼150 residue protein domain) (▶). The most probable distance lies at  , which is ∼5% greater than the sphere radius. When r is infinitesimally small, n(r;a) approaches r2; as the distance r increases, n(r;a) can be expressed as rα, where α depends on both the distance r and sphere radius a. The effective exponent α can be derived by taking the logarithm and then the first derivative of both sides of the definition m(r;a) = rα; thus,
 |
Figure 2.
Comparison of the analytical normalization function (line; Equation 7) with the numerical simulation (points). The simulated sample includes one- million pairs of points located randomly inside a sphere with the radius a of 22 Å (Fig. ▶); the bin size is 1 Å.
and finally combining this result with Equation 7 (▶):
 |
Figure 3.
The effective exponent α of a sphere as a function of interparticle distance r (Equation 8). The dashed, thin, and thick curves show the effective exponents α(r) for sphere radii a of 20, 22, and 24 Å, respectively. The horizontal dashed line marks the effective exponent used by DFIRE (α = 1.61).
As expected, the short and long-range asymptotic behaviors of the effective exponent α are α → 2 as r → 0 and α → 0 as r →  , respectively.
Using a sample of many native structures of varying size
We now need to derive the joint pdf from a sample of many native structures of varying size, which is nontrivial because both the distance pdf pm,n(r;a) and the normalization function n(r;a) depend on size a of a sample structure. We note in passing that if we had a sufficiently large sample of native structures, we could subdivide it into subsets of proteins of equal size and then derive the joint pdf separately for each subset without the complication of combining the statistics from structures of varying size.
The dependence of both pm,n(r;a) and n(r;a) on protein size a might suggest that their ratio, pair pdf  , also depends on a. However, we suggest that the pair pdf may be approximately independent of the protein size. While we are not able to support this approximation based on statistics, we can ground it in physics if we assume that the pair pdf reflects only the potential of mean force between the corresponding atom types (Equation 12). The potential of mean force between two atoms in a protein, in turn, should depend only on their chemical properties and their distance, not on the protein size. Thus, the pair pdfs derived from subsets of protein structures of different sizes will not vary, except for statistical fluctuations due to small sample sizes, and can thus be averaged to obtain a more accurate estimate of the pair pdf.
Calculating DOPE
Based on the arguments and equations above, the complete calculation of DOPE is as follows. First, for each sample native structure, the distance pdf pm,n(r;a) is estimated by Equation 2; the details about the sample of the native structures, the sampling of the distances, atom types, and implementation in MODELLER-8 are described in Materials and Methods. The normalization function n(r;a) is calculated from Equation 7 using  .
.
Second, for each atom type pair (m,n) in the sample native structure, the pair pdf  is calculated using Equation 2 and 3.
Third, the weight ws of the sample native structure is calculated as the ratio between the number of all atom pairs in this structure and the number of atom pairs in all sample structures, irrespective of their types.
Fourth, the pair pdf  for the sample of all native structures is calculated as a weighted sum of the pair pdfs corresponding to the individual sample structures:
 |
where index s runs over all sample native structures. This averaging procedure is based on the presumed independence of the pair pdf from the protein size, as rationalized above.
Requirements needed for a physical interpretation of the joint pdf as the free energy
There are two approximations needed to relate the joint pdf  (Equations 1–3) derived from a sample of native structures and the free energy of a protein in solvent. However, we do not argue that these approximations are actually accurate or physically correct. The first approximation is that the pair pdfs
  estimated from a sample of known native structures obey the Boltzmann statistics of a canonical ensemble at some temperature T (Sippl 1990). While this approximation is partly validated by the observed Boltzmann statistics of structural features (e.g., atomic distances) in a set of known native structures (Finkelstein et al. 1995), serious concerns about its correct interpretation remain (Finkelstein et al. 1995; Thomas and Dill 1996b). The second approximation is the superposition approximation (above). Importantly, we note that the derivation of our statistical potential is entirely independent of the hypothetical relationships outlined in this section.
The joint pdf p defines the N-body correlation function g (Hill 1956):
 |
The total free energy G of the system can then be expressed in terms of the correlation function g:
 |
where kB is the Boltzmann constant. Therefore, an approximate free energy of a system is (Equations 1, 3, 9, 10):
 |
where 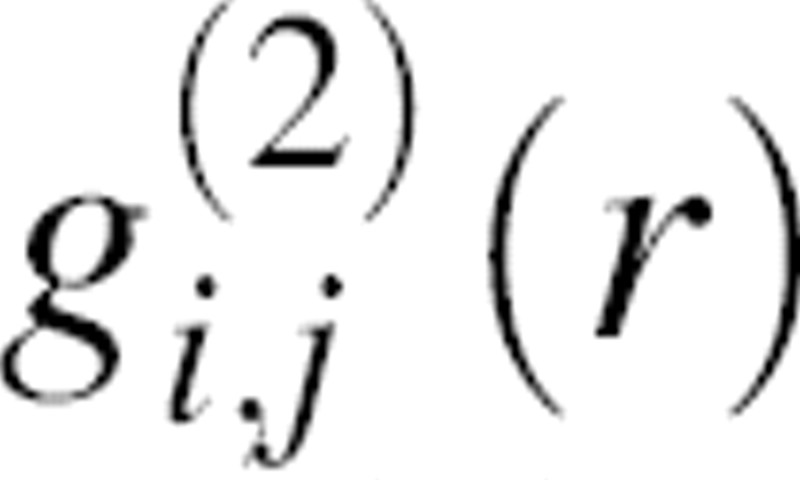 is the radial distribution function equal to pm,n(r)/n(r), and ūi,j(r) is the potential of mean force for a pair of atoms
  .
.
Because  and thus ūi,j(r) = 0 for the reference state as defined above, the potential of mean force derived from the observed distance pdf pm,n(r) is
 |
where 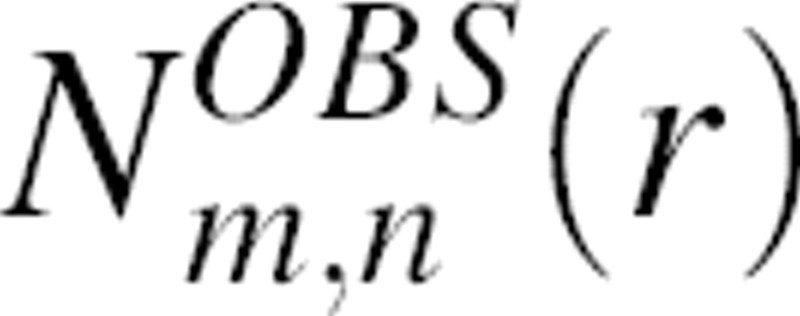 and
and 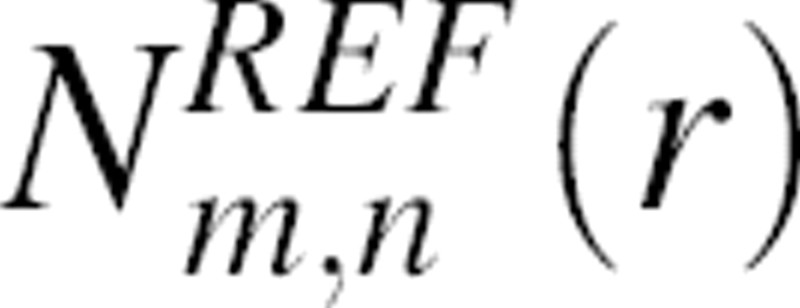 are the numbers of atom type pairs (m,n) at a distance r within [r, r + Δr] for the “interacting” real system and the “noninteracting” reference state, respectively. This interpretation of our reference state is identical to that of the “discharged” state used for free energy calculations in statistical mechanics (Onsager 1933; Hill 1956). Equation 13 establishes the relation between the statistical potential derived from a sample of known structure and the potential of mean force.
Results
Comparison of distance-dependent statistical potentials
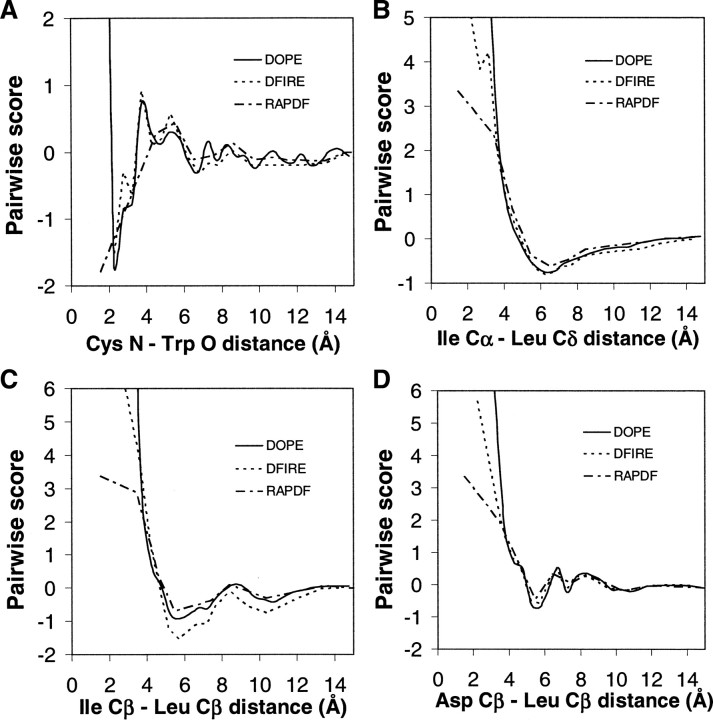
We compare the distance dependence of DOPE, DFIRE, and RAPDF for four representative pairs of atom types (main chain–main chain, main chain–side chain, hydrophobic side chain–hydrophobic side chain, and polar side chain–hydrophobic side chain) (Equation 12) (▶). For all four pairs, DOPE has a steeper repulsion at short distances. The Ile Cα–Leu Cδ and Asp Cβ–Leu Cβ pairs (i.e., main chain–side chain and polar side chain–hydrophobic side chain; ▶,▶) are very similar for all three statistical potentials. The structured distance dependence of the Cys N–Trp O main chain–main chain pair is present in DOPE as it is in DFIRE and RAPDF (▶). The minor difference between DOPE and DFIRE lies at ∼2.75 Å, where a small peak in DFIRE is absent in DOPE. The difference between DOPE and DFIRE is more pronounced for the Ile Cβ–Leu Cβ hydrophobic side chain–hydrophobic side chain pair, where DOPE lies between DFIRE and RAPDF.
Figure 4.
Distance dependence of DOPE, DFIRE, and RAPDF. (A) Cys N atom–Trp O atom. (B) Ile Cα atom–Leu Cδ atom. (C) Ile Cβ atom–Leu Cβ atom. (D) Asp Cβ atom–Leu Cβ atom. The DFIRE and RAPDF plots are reproduced from Zhou and Zhou (2002). All statistical potentials are shown with linear interpolation between their estimated values at discrete distances (cf. when using DOPE, interpolation by cubic splines is applied, as described in Materials and Methods, resulting in smoother curves than shown here).
Native state detection
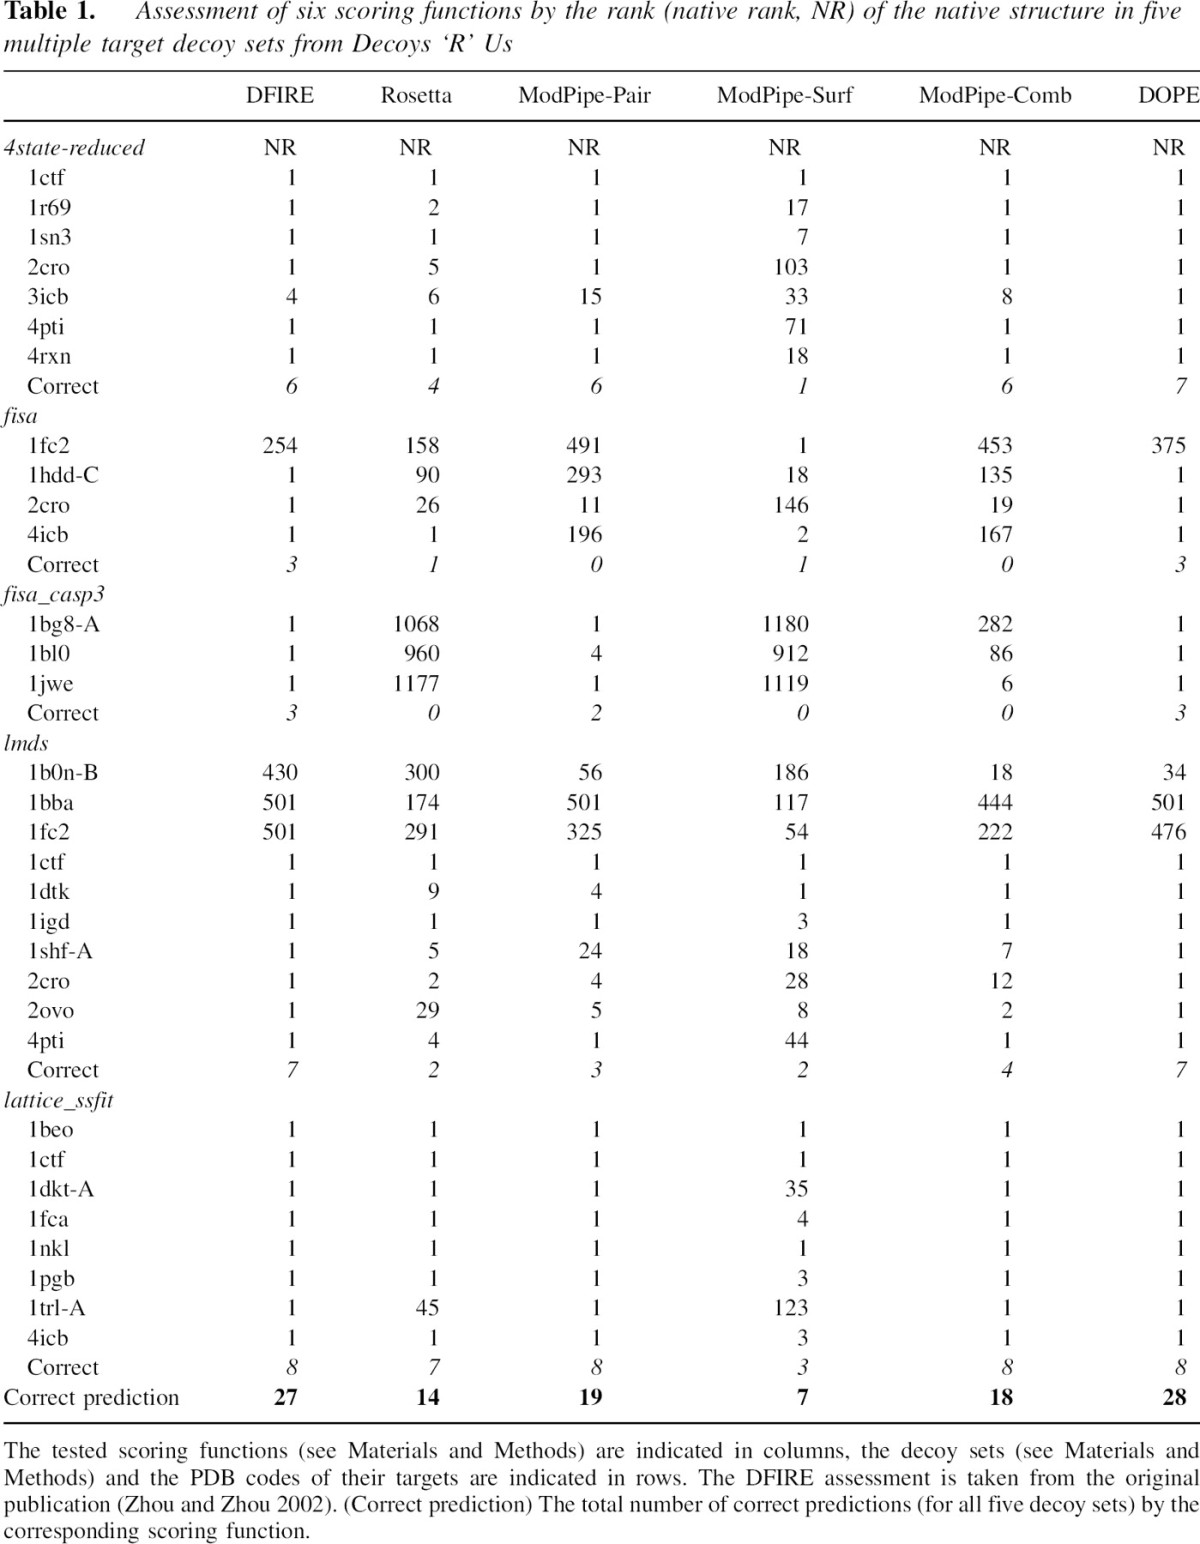
We first assess DOPE in terms of its ability to identify the native states in five multiple target decoy sets (▶), including 4state_reduced, fisa, fisa_casp3, lmds, and lattice_ssfit decoy sets from the Decoys ‘R’ Us Web site (http://dd.stanford.edu). This assessment is relative to five other previously published scoring functions, including DFIRE, Rosetta, ModPipe-Pair, Modpipe-Surf, and Modpipe-Comb (see Materials and Methods). DFIRE, in particular, is one of the best performing atomic distance-dependent statistical potentials (Zhou and Zhou 2002). DOPE correctly identifies 28 native structures for 32 targets in five multiple target decoy sets, while DFIRE, Rosetta, ModPipe-Pair, Modpipe-Surf, and Modpipe-Comb are successful for 27, 14, 19, 7, and 18 targets, respectively (▶). All scores miss the native state of 1fc2 in the fisa set (except for Modpipe-Surf) and 1b0n-B, 1bba, and 1fc2 in the lmds set.
Table 1.
Assessment of six scoring functions by the rank (native rank, NR) of the native structure in five multiple target decoy sets from Decoys ‘R’ Us
We also tested all six scoring functions on the 20 targets in the moulder decoy set derived by iterative target-sequence alignment and comparative model building (Materials and Methods). DOPE, DFIRE, Rosetta, ModPipe-Pair, and Modpipe-Comb are all able to identify 19 out of the 20 native structures from the total of 301 conformations. The single failure for these five scores was the only NMR structure, 2pna. Modpipe-Surf failed to identify two native structures (2pna and 1mup).
For all six decoy sets, DOPE correctly identifies 47 native states for 52 targets (90%), while DFIRE, Rosetta, ModPipe-Pair, Modpipe-Surf, and Modpipe-Comb succeed in 46, 33, 38, 25, and 37 cases (88%, 63%, 73%, 48%, and 71%), respectively.
Correlation between the score and model error
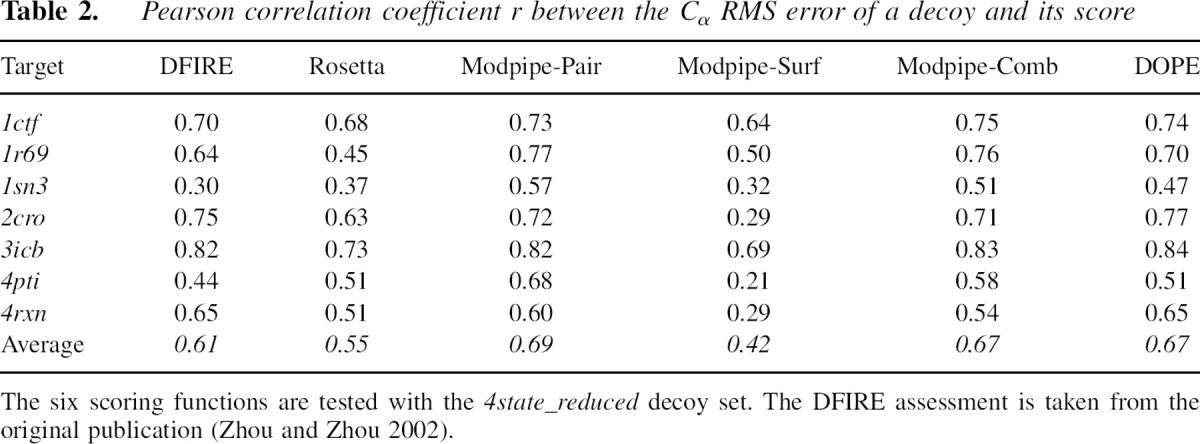
The percentage of detected native states provides a useful but incomplete indication of the accuracy of a scoring function. In particular, it does not describe the correlation between the score of a model and its structural similarity to the native state, suggested by the funnel-shaped free energy landscape of protein folding. To quantify these score–error correlations for the six scoring functions, we calculated the individual and average score–error correlation coefficients between the scores and the Cα RMS errors for the 4state_reduced decoy set (▶). ModPipe-Pair yields the highest average score–error correlation coefficient (0.69) among the six tested scoring functions, with DOPE and Modpipe-Comb following closely second (0.67). Moreover, ModPipe-Pair and DOPE both have the highest score–error correlation in three out of seven individual targets in the set.
Table 2.
Pearson correlation coefficient r between the Cα RMS error of a decoy and its score
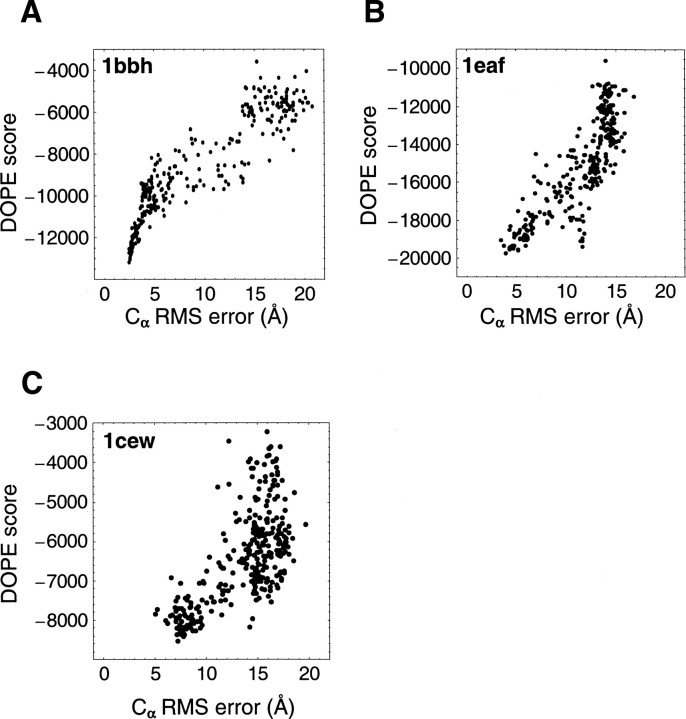
The score–error correlation coefficients were also calculated for the moulder decoy set (▶). The examples of high, medium, and low DOPE score–error correlation coefficients for the 20 targets in the moulder test set are 0.92 (1bbh), 0.84 (1eaf), and 0.67 (1cew), respectively (▶). The score–error correlation coefficients from the moulder decoy set are generally higher than those for the 4state_reduced set. The average DOPE score–error correlation coefficient over 20 targets (0.87) is slightly higher than that of DFIRE and Rosetta (0.85), while the coarse-grained scores tend to have lower correlation coefficients; the ModPipe-Comb average correlation is 0.82, and the ModPipe-Pair average correlation is 0.73 (▶). Notably, the DOPE score– error correlation coefficients for nine out of the 20 targets are ≥0.9, indicating a better performance of DOPE compared to DFIRE (6) and Rosetta (4).
Table 3.
Assessment of the six scoring functions by their ability to select the best model in the moulder decoy set
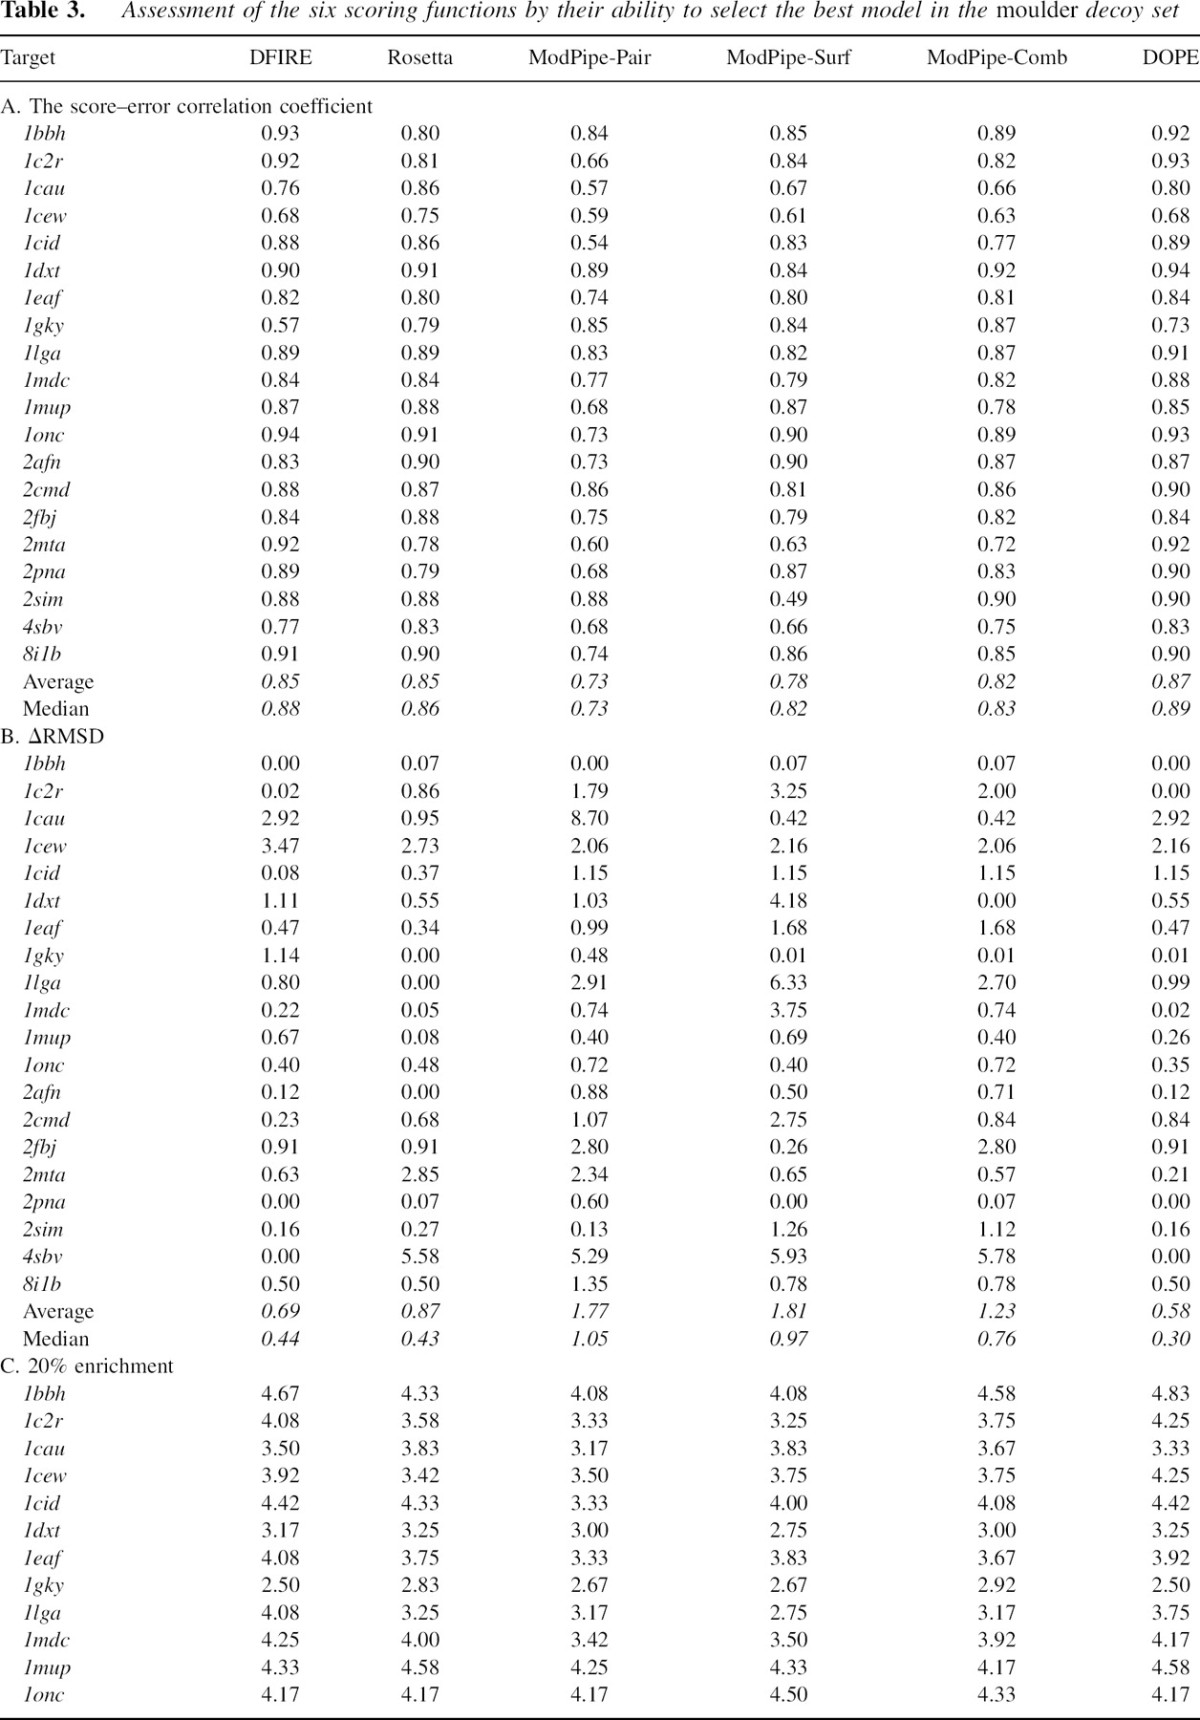
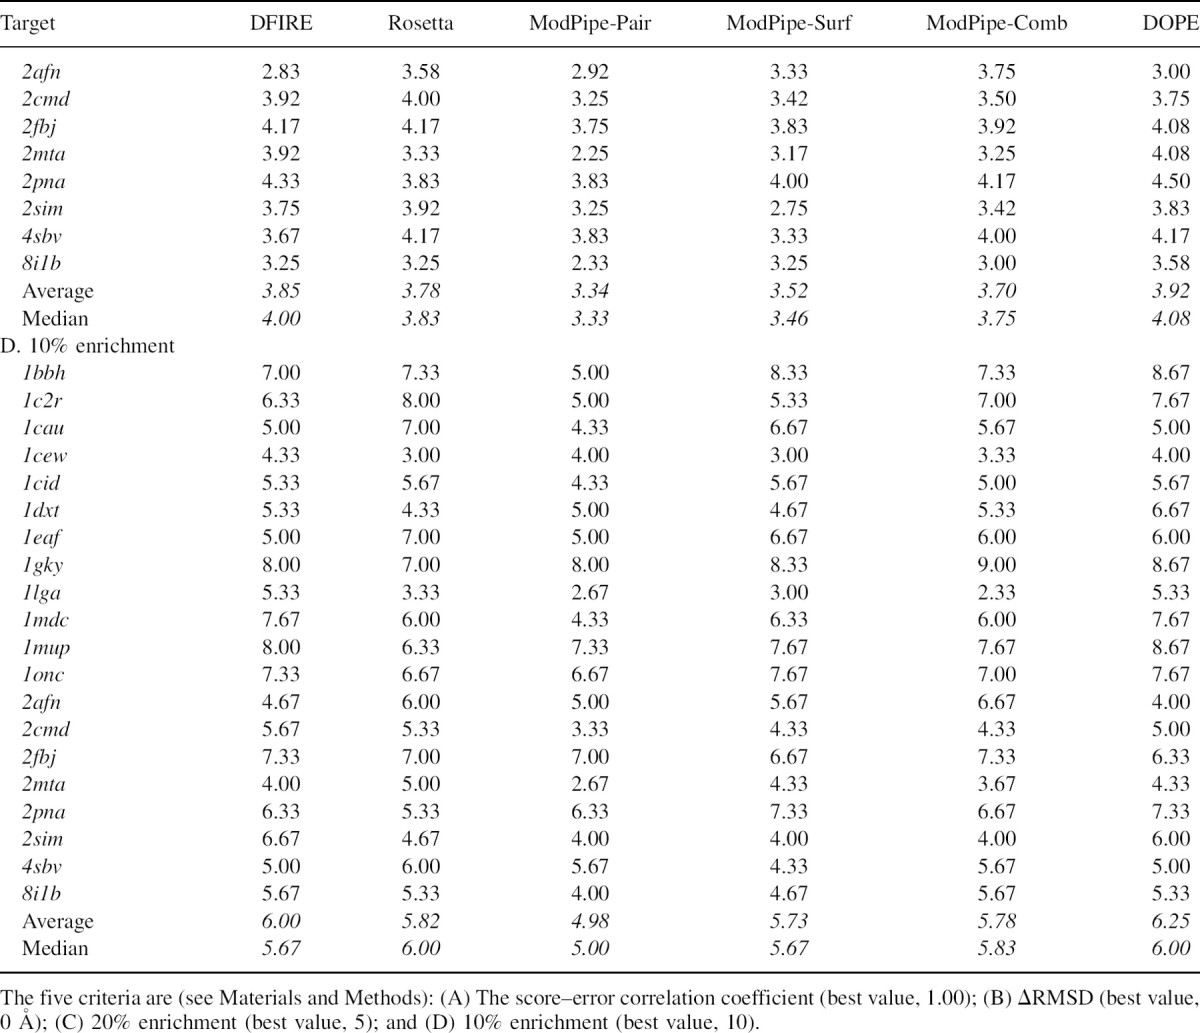
Figure 5.
Score–error correlation (see Materials and Methods) for DOPE, using three targets from the moulder decoy set. (A) High correlation, correlation coefficient r = 0.92 (1bbh). (B) Medium correlation, r = 0.84 (1eaf). (C) Relatively low correlation, r = 0.68 (1cew).
The high score–error correlation of DOPE suggests a relatively useful description of the non-native portion of the free energy surface. As a result, we expect DOPE to be more suitable than the alternative scoring functions for refining non-native structures as well as for selecting the most accurate model among a set of decoys without the native structure.
Selection of the most accurate non-native model
Identification of the non-native structure closest to the native structure among a set of decoys is generally significantly more difficult than identification of the native structure. Even the actual free energy function would generally not succeed if the best model were far enough from the native state. Yet, it is this more difficult task that needs to be performed in realistic model assessments where the native structure is not available. Therefore, to further test the practical utility of DOPE, we assess each of the 300 models of the 20 targets in the moulder decoy set by DOPE and the five other scoring functions. For the moulder decoy set, DOPE is the most accurate score according to three assessment measures (▶) as follows.
Using ΔRMSD as the accuracy criterion, DOPE is the best of all six tested scores with average and median ΔRMSDs of 0.58 Å and 0.30 Å, respectively. DOPE outperforms DFIRE, Rosetta, and ModPipe-Comb, whose average (median) ΔRMSDs are 0.69 Å (0.44 Å), 0.87 Å (0.43 Å), and 1.23 Å (0.76 Å), respectively. In four cases, DOPE selects a model with the lowest ΔRMSD, a better performance than DFIRE and Rosetta (three cases each). The two structures (1cau and 1cew) for which DOPE failed to select a model with ΔRMSD < 2.0 Å are both difficult cases in the sense that they failed at least half of the tested scoring functions.
DOPE also performs better than other scores according to the n% enrichment measures (▶). The DOPE average 20% enrichment for the 20 targets is 3.92, compared to 3.85, 3.70, and 3.78 for DFIRE, ModPipe-Comb, and Rosetta, respectively. Ten-percent enrichment results in a similar ranking of the scoring functions. The difference in enrichment ratios between DOPE and DFIRE is more pronounced at the 10% threshold (6.25 compared to 6.00) than at the 20% threshold (3.92 compared to 3.85). This difference is primarily due to the relatively higher accuracy of DOPE in the near-native region.
The relative accuracy of a score can also be illustrated by the number of the 10% most accurate models identified by the score; there are 600 such top 10% models in the moulder decoy set (10% × 20 targets × 300 models per target). DOPE identifies 375 of these models, which is 15, 26, and 28 more than identified by DFIRE, Rosetta, and ModPipe-Comb, respectively.
Discussion
We derived an atomic distance-dependent statistical potential from known native protein structures (DOPE), based on probability theory and without recourse to statistical mechanics (see Theory). Moreover, we related DOPE to a potential of mean force, based on several customary assumptions. We benchmarked DOPE and five other previously published scoring functions by using five multiple target decoy sets from the Decoys ‘R’ Us Web site as well as a set of 300 comparative models of varying accuracy for each one of 20 different sequences of known structure (see Results). DOPE is the best performing function in the detection of the native state, the correlation between the score and Cα RMS error, and the identification of the most accurate non-native model. The improvement results primarily from a more rigorous treatment of the reference state in the derivation of DOPE. Next, we first compare the theory of DOPE with other existing methods for deriving statistical potentials; second, we discuss the importance of the size of the spherical reference state of DOPE; and finally, we describe four regimes where DOPE tends to be less accurate: incomplete models, small structures, low-accuracy models, and NMR structures. We conclude by listing several current applications of DOPE.
Comparison of statistical potential reference states
All statistical potentials depend on the same protein structure database (i.e., PDB). Therefore, the differences between the distance pdfs pm,n(r) of various statistical potentials depend only on the specific choice of the sample structures and are not significant conceptually. In contrast, significantly different definitions of the distance pdf for the reference state  (Equation 3), which is equal to the normalization function n(r) (Equation 3) or equivalently
  (Equations 2 and 3), have been used in the derivation of different statistical potentials. For example, RAPDF uses a conditional pdf to construct a distance pdf for the reference state (Samudrala and Moult 1998), and AKBP relies on a mole fraction-dependent reference state function (Lu and Skolnick 2001). We now compare the DOPE n(r) function to that of DFIRE, which is the most similar statistical potential to DOPE.
A physical picture of noninteracting atoms in a finite spherical volume has inspired the DFIRE reference state (Zhou and Zhou 2002; Zhang et al. 2004), just as it did for DOPE. The DFIRE normalization function is n(r) = rα, relying on a constant effective exponent parameter α that is used for all sample native structures irrespective of their size. The optimal value of α was found empirically to be 1.57 (Zhou and Zhou 2002) and subsequently refined to 1.61 (Zhou and Zhou 2002, 2003). The DFIRE reference state captures an important feature of particle density in a finite spherical volume; namely, it does not grow with r2, but with rα, where α is smaller than 2.
DOPE goes a step further in the definition of the reference state and the corresponding normalization function. The DOPE reference state is a sphere whose size reflects that of the sample native structure, but with a uniform uncorrelated atom density; the reference state is independent of the composition of the protein. In contrast to DFIRE, the DOPE normalization function is derived analytically, without any adjustable parameters. It turns out that α is not a constant but, in fact, a function of both the distance between the interacting atoms r and the sample native structure size a (Equation 8). Thus, the DFIRE reference state can be considered to be an empirical approximation of the DOPE theory. For example, the average (over r from 0 to 15 Å) effective exponent α for a 22 Å reference sphere is 1.63, which is very close to the effective exponent α of DFIRE (1.61). The DOPE reference state results in a more accurate (see Results) and presumably more broadly applicable statistical potential; in principle, even though derived from sample native structures of different sizes, it is applicable to models of any size. Moreover, it affords a greater opportunity for generalization to other kinds of statistical potentials and other future developments.
The size of the reference state
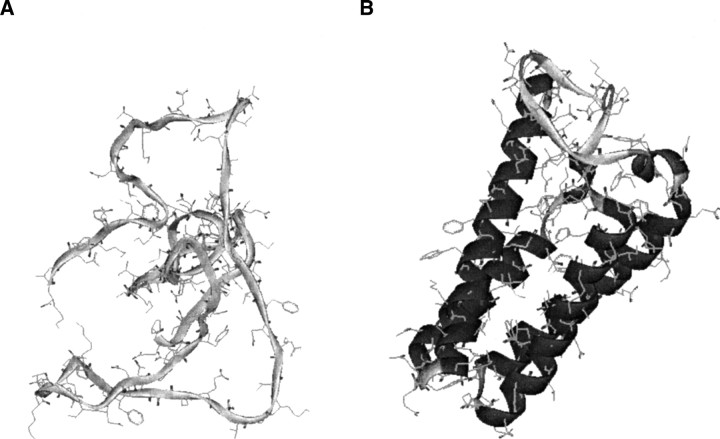
The reference state and the corresponding normalization function n(r) depend on the reference sphere radius a (see Theory). To further illustrate the impact of the reference sphere on the accuracy of the DOPE potential, we derived a version of DOPE in which the pair pdf in Equation 3 was calculated with the normalization function for the single sphere size a. This limited version of DOPE is termed DOPE-a. DOPE-a is highly inaccurate when derived with an incorrect reference sphere radius a. For example, DOPE-16 cannot identify the native structure of 1bbh (▶). In contrast, DOPE-24 does correctly identify the 1bbh native state (▶). The scoring function derived from a reference state that is too small results in an erroneous preference for loosely packed structures because the short-range interactions are deemed to be more repulsive by the corresponding DOPE-a than by DOPE.
Figure 6.
Sample structure assessment that benefits from using the correct reference sphere size. The best-scored model of the target 1bbh in the moulder decoy set with (A) DOPE based on an underestimated radius of the reference sphere a of 16 Å. The Cα RMS error of this model is 15.4 Å. (B) When DOPE is calculated with the size a of 23 Å, it correctly scores the native structure better than any of the 300 decoys.
We also tested DOPE-24 on the five Decoys ‘R’ Us decoy sets to elucidate the importance of using the multiple reference states in the derivation of DOPE. In summary, DOPE-24 is less accurate than DOPE. DOPE-24 successfully ranks all 18 native structures in the 4state_reduced, fisa_casp3, and lattice_ssfit as the best scored model. However, DOPE-24 performs worse than DOPE on the fisa and lmds decoy sets, where DOPE-24 misidentified nine native structures, five more than did DOPE. Overall, DOPE-24 successfully identified only 23 native states. This comparison emphasizes the importance of tabulating the distance pdfs for different pairs of atom types by using a reference state of the appropriate size; the “one-size-fits-all” reference state incorrectly scales the contributions from proteins of all but one size, leading to a less accurate statistical potential.
Accuracy of DOPE as the function of completeness of assessed model
In general, the failures in picking the native structure may be caused by a number different factors, which will be discussed in the following four sections. The first of these factors is the incompleteness of the assessed model. For example, the native interface between two domains in a single protein may be needed for its stability. In such a case, it is conceivable that neither a physics-based energy function nor a statistical potential will score the native state of an isolated domain correctly. There is not much that can be done about this problem, other than striving to assess biologically stable units of structure. A possible example of such a failure is 1b0n-B, whose crystal structure indicates that the stable unit is a dimer, not a monomer.
Accuracy of DOPE as the function of assessed model size
Yet another difficulty in model assessment is a small size of an assessed model; for example, 1b0n-B, 1bba, and 1fc2 have only 31, 36, and 43 residues, respectively. DOPE, like other statistical potentials, is less accurate for smaller proteins (▶). There are two potential sources of errors in assessing small proteins. First, small proteins are assessed by a smaller number of pairwise terms, thus resulting in a larger statistical error of the final score. The number of individual pairwise terms in the scoring function is proportional to the square of the protein sequence length; thus, the relative statistical fluctuation of the final score (Equation 12) is inversely proportional to the sequence length.
Second, the statistical mechanics of large proteins, which contribute most of the distances toward the construction of a statistical potential, may be different from that of small proteins, in addition to the differences accounted for by varying a. For example, the relatively more aspherical structure of small protein domains makes the spherical reference states less accurate. Also, a small protein domain usually lacks a well-packed hydrophobic core. To maintain the 1:1 hydrophobic-to-polar residue ratio found in these proteins, a substantial fraction of hydrophobic residues must be exposed (Shen et al. 2005). This irregularity is not captured well by a statistical potential and thus causes assessment errors. In an attempt to quantify this problem, we derived and tested a statistical potential by using only small protein structures (data not shown). This specialized statistical potential did not perform better than the statistical potential constructed from structures of all sizes (i.e., DOPE), presumably because of the first problem that apparently cancels the gains made by using the specialized sample consisting of only small native structures.
Accuracy of DOPE as the function of model accuracy
The performance of DOPE in selecting the most accurate model tends to increase with the accuracy of the best model in the decoy set. The average Cα ΔRMSD, score–Cα RMS error correlation coefficient, and 10% enrichment for high-accuracy targets (best model Cα RMS error <3.0 Å) in the moulder decoy set are 0.41 Å, 0.90, and 6.62, respectively. All three measures are significantly better than the averages of 0.58 Å, 0.87, and 6.25 for all 20 targets in the decoy set. This trend is also observed for other scoring functions to a lesser extent; for example, the average correlation coefficient of the Rosetta score exhibits slight improvement from 0.846 to 0.854 when limited to high-accuracy targets.
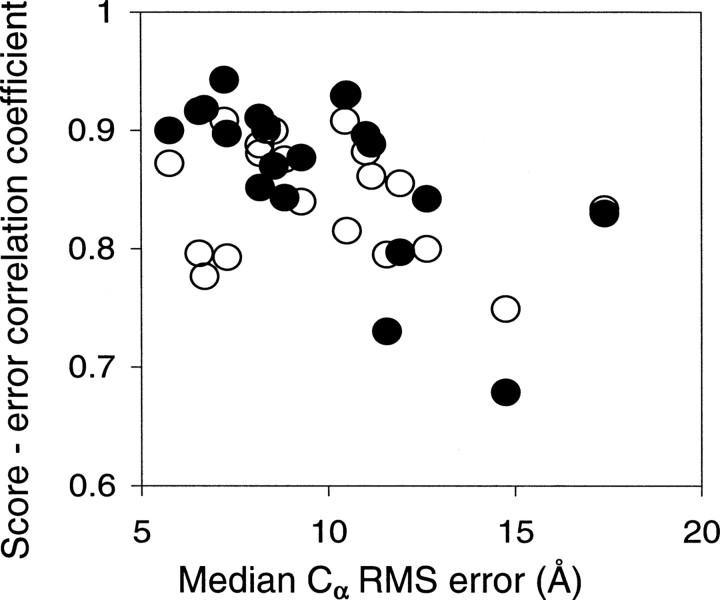
The dependence of DOPE performance on model accuracy is illustrated further by the relation between the median Cα RMS error and the score–error correlation coefficient for the 20 targets in the moulder decoy set (▶). The DOPE score–error correlation begins to decrease when the median model Cα RMS error is greater than ∼10 Å. In contrast, the Rosetta score–error correlation coefficients remain relatively stable (although lower than those of DOPE for median model Cα RMS error <10 Å) in all model accuracy ranges. This difference between DOPE and Rosetta is presumably due to the different information used in the construction of the two scoring functions. By construction, DOPE is based entirely on the native structures and lacks the ability to discriminate models with large Cα RMS errors. In contrast, Rosetta contains several physics-based terms, including electrostatics, hydrogen bonds, and solvation, making it possible at least in principle to assess non-native models more accurately based on the laws of physics. In conclusion, a combination of physics-based energy terms and DOPE may be able to improve DOPE's correlation with model accuracy when the Cα RMS error is large.
Figure 7.
Score–error correlation coefficient as a function of the median model accuracy for the 20 targets in the moulder decoy set. (Filled circles) DOPE, correlation coefficient of −0.62; (open circles) Rosetta, correlation coefficient of −0.27.
A more thorough comparison of the scoring functions would include a local minimization of each model with respect to each scoring function before the calculation of the final assessment score. Such a relaxation would make the results less sensitive to relatively small steric clashes in the models, which are especially problematic for scoring functions with stiff steric repulsion terms, such as Rosetta and molecular mechanics force fields in general. It was not feasible here to perform such minimizations with all tested scoring functions.
Assessment of NMR structures
Another difficulty is the assessment of structures determined by NMR spectroscopy. For example, neither DOPE nor DFIRE is able to identify the native structure of 2pna in the moulder decoy set. Initially, the 2pna native structure was arbitrarily chosen to correspond to the first of the 22 separately listed structures in the 2pna PDB file. To elaborate, we also assessed all 22 native structures in the PDB file; the corresponding DOPE scores ranged from −8997 to −9391. However, even the best scoring native structure does not score better than some of the decoys, although the rank does improves from 103 to 81 for the first and best scoring native structures, respectively. The apparent decrease of DOPE's ability to identify native NMR structures compared to X-ray structures is presumably a consequence of both the derivation of DOPE from X-ray structures and the inherent relative inaccuracy of the NMR structures compared to X-ray structures. It is conceivable that a DOPE-like score derived exclusively from the NMR structures will perform better than the current DOPE.
Applications of DOPE
Protein structure scoring functions have many applications (see introductory section). To facilitate applications of DOPE in particular, we implemented it in MODELLER-8, using cubic splines to interpolate between sampled points for smooth function values and first derivatives (see Materials and Methods) (http://salilab.org/modeller) (Sali and Blundell 1993; Fiser et al. 2000). This implementation allows us to use DOPE for both assessment of given structures as well as their refinement with optimization methods that depend on first derivatives, such as conjugate gradients and molecular dynamics. It also allows us to benefit from DOPE combined together with other scoring functionals that have been already incorporated in MODELLER.
So far, DOPE has already been applied to ab initio protein structure prediction (Colubri et al. 2006), protein–protein docking (Shen et al. 2005), various problems in comparative modeling, including fold assignment, template selection, sequence–structure alignment (John and Sali 2003; Eramian et al. 2006; Pieper et al. 2006), loop modeling (M.-Y. Shen and A. Sali, unpubl.), side chain modeling (B. Webb and A. Sali, unpubl.), refinement of whole models (B. Webb and A. Sali, unpubl.), and model assessment (Eramian et al. 2006), the modeling of quaternary structure restrained by small angle scattering spectra (F. Foerster, D. Agard, and A. Sali, unpubl.), as well as fitting into cryo-electron microscopy mass density maps combined with comparative modeling (Topf and Sali 2005; Topf et al. 2006).
In the future, further improvements and generalizations of DOPE will be facilitated by its rigorous statistical formulation, with clear assumptions and approximations, free of adjustable parameters. Ongoing work includes a comparison between statistical and physics-based potentials, which may result in a combined function with better accuracy in non-native regions, adapting the potential for maximum accuracy with small proteins, generalization of statistical potentials to multibody forms with a rigorous reference state, and inclusion of information about sequences that do not fold into a given native structure as well as conformations that are not the native structure for a given sequence.
Materials and methods
Sample native structures
The sample of the native structures used for the calculation of DOPE contains 1472 representative single chains from the PDB, determined by crystallography at ≤1.8 Å resolution and with an R-factor ≤0.25. These representative structures share <30% sequence identity with each other. The list was constructed with the PISCES Web server (Wang and Dunbrack 2003). No effort was made to exclude chains with chain breaks, ligands, and quaternary interactions.
Implementation of DOPE
We calculated DOPE for all pairs of non-hydrogen atoms in each of the 20 standard residue types, ignoring the N-terminal and C-terminal nitrogen and oxygen atoms, respectively. Thus, there are a total of 158 residue-dependent atom types. Nine of these atom types include differently labeled but chemically equivalent atoms (i.e., NH1 and NH2 in Arg, OD1 and OD2 in Asp, OE1 and OE2 in Glu, CD1 and CD2 in Leu, CD1 and CD2 in Phe, CE1 and CE2 in Phe, CD1 and CD2 in Tyr, CE1 and CE2 in Tyr, and CG1 and CG2 in Val). The possibility of equivalent atom pairs existing in different protonation states (e.g., OD1 and OD2 in Asp) was not addressed here. Such alternative assignments are difficult to resolve because of the absence of the experimentally determined positions of the hydrogen atoms in most of the sample structures, although an iterative scheme to address the problem has been described recently (Weichenberger and Sippl 2006).
DOPE was tabulated for distances from 0 to 15 Å (rc), with an interval of 0.5 Å (ΔR). These values were based on prior work (Melo et al. 2002; Zhou and Zhou 2002). The interval counts are converted into the DOPE scores, as described in the Theory section, except for counts of zero, which are assigned a DOPE score of 10, corresponding to the least favorable score.
DOPE was implemented in MODELLER-8 (http://salilab.org/modeller) (Sali and Blundell 1993) and the molecular dynamics package TINKER (Pappu et al. 1998) (http://dasher.wustl.edu). The MODELLER implementation relies on cubic splines (Press 1992) that allow us to smoothly interpolate between the sampled histogram points of DOPE as well as analytically calculate its continuous first derivatives. Thus, we can use DOPE, potentially combined with other scoring functions, for an optimization of a given model, in addition to its assessment.
Tested scoring functions
We assessed DOPE against five other scoring functions: DFIRE (Zhou and Zhou 2002), Rosetta (Simons et al. 1997, 1999; Misura et al. 2006), as well as ModPipe-Surf, ModPipe-Pair, and ModPipe-Comb (Melo et al. 2002). This selection of scores includes both single-body and two-body scoring functions, as well as coarse-grained and all-atom scoring functions. The coarse-grained residue-based scores are ModPipe-Surf (single-body), ModPipe-Pair (two-body), and ModPipe-Comb (combined). The all-atom distance-dependent statistical potentials are DOPE and DFIRE. Rosetta is an all-atom scoring function that includes both physics-based models and statistical potentials, quantifying stereochemistry, nonbonded interactions, and solvation.
We calculated the Rosetta score by the Rosetta program, kindly provided by the authors, using standard argument values (i.e., -score). The DOPE and three ModPipe scores were calculated by MODELLER-8 (http://salilab.org/modeller). We calculated the DFIRE scores for the moulder decoy set by the DFIRE program, also kindly provided by the authors, while the assessments of DFIRE by the five Decoys ‘R’ Us decoy sets were taken from the original description of DFIRE (Zhou and Zhou 2002).
Decoy sets of protein structures
Six multiple decoy sets, including the 4-state_reduced, fisa, fisa_casp3, lmds, lattice_ssfit, and moulder decoy sets, were used to evaluate the performance of the DOPE statistical potential. The first five decoy sets are available through Decoys ‘R’ Us (http://dd.stanford.edu). The 4state-reduced decoy set, containing from 632 to 689 models per target (seven targets in total), was generated using a four-state off-lattice model with a conformational relaxation method (Park and Levitt 1996). The fisa and fisa_casp3 decoy sets with four and three targets (500–1400 models per target), respectively, were obtained using a combination of a Bayesian scoring function and a simulated annealing protocol (Simons et al. 1997, 1999). The lmds decoy set with 215–500 models for each one of 10 primarily short targets, was obtained by a local optimization method and a reduced ENCAD energy function (Keasar and Levitt 2003). The largest lattice_ssfit decoy set, containing 2000 decoys for each of eight targets, was generated using a tetrahedral lattice model with the all-atom ENCAD energy function (Xia et al. 2000).
The moulder decoy set is derived by iterative target-template alignment and comparative model building of 20 target sequences only remotely related to their template structures, relying on MODELLER-6 (John and Sali 2003); it contains 300 models for each target, based on a wide range of target-template alignment accuracy.
All the target native structures in all decoy sets were determined by X-ray crystallography, except for 1bba in lmds and 2pna in moulder, which were determined by NMR spectroscopy.
Assessment of scoring function accuracy
Scoring functions were tested by five different criteria: First, the rank of the native structure in the list of decoys sorted by the tested score (NR). Second, the fraction of the targets for which the native structure was the best scoring structure in a decoy set. Third, the Pearson correlation coefficient r between the scoring function and the Cα RMS error for the target decoys (the score–error correlation); the Cα RMS error was calculated by MODELLER-8, upon least-squares rigid body superposition of a model and the native structure. Fourth, the difference in the Cα RMS error between the best scored model and the best model (ΔRMSD); ideally, Cα ΔRMSD should be 0 Å. Fifth, the relative occurrence of the most accurate (Cα RMS error) n% models among the n% best scoring models compared to that for the entire decoy set (n% enrichment). The best possible enrichment ratio (i.e., all n% most accurate models are recognized by the scoring function) is 1/n% [i.e., (n%/n%)/n%]. For example, the 10%-enrichment ratio for the best possible scoring function is 10 (i.e., 1/0.10). In contrast, a random scoring function has the probability of n% to correctly identify n% most accurate models, thus its enrichment ratio is n%/n% = 1.
Acknowledgments
We thank Chao Tang, Martin Karplus, Karl Freed, and Ken Dill for commenting on the manuscript, as well as David Eramian, John Chodera, Marc Marti-Renom, and Bianxiao Cui for very helpful discussions. We also thank Ben Webb for helping implement DOPE in MODELLER-8, and David Eramian for testing it. We acknowledge NIH R01 GM54762 and The Sandler Family Supporting Foundation for funding, as well as IBM and Intel for computer hardware.
Footnotes
Reprint requests to: Min-yi Shen or Andrej Sali, Department of Biopharmaceutical Sciences, Byers Hall at Mission Bay, Suite 503B, University of California at San Francisco, 1700 4th St., San Francisco, CA 94158, USA; e-mail: smy@salilab.org or sali@salilab.org; fax: (415) 514-4231.
Article and publication are at http://www.proteinscience.org/cgi/doi/10.1110/ps.062416606.
References
- Alder, B. 1964. Triplet correlations in hard spheres. Phys. Rev. Lett. 12 317–319. [Google Scholar]
- Anfinsen, C.B. 1972. The formation and stabilization of protein structure. Biochem. J. 128 737–749. [DOI] [PMC free article] [PubMed] [Google Scholar]
- Anfinsen, C.B. 1973. Principles that govern the folding of protein chains. Science 181 223–230. [DOI] [PubMed] [Google Scholar]
- Bastolla, U., Vendruscolo, M., and Knapp, E.W. 2000. A statistical mechanical method to optimize energy functions for protein folding. Proc. Natl. Acad. Sci. 97 3977–3981. [DOI] [PMC free article] [PubMed] [Google Scholar]
- Bauer, A. and Beyer, A. 1994. An improved pair potential to recognize native protein folds. Proteins 18 254–261. [DOI] [PubMed] [Google Scholar]
- BenNaim, A. 1997. Statistical potentials extracted from protein structures: Are these meaningful potentials? J. Chem. Phys. 107 3698–3706. [Google Scholar]
- Betancourt, M.R. and Skolnick, J. 2004. Local propensities and statistical potentials of backbone dihedral angles in proteins. J. Mol. Biol. 342 635–649. [DOI] [PubMed] [Google Scholar]
- Betancourt, M.R. and Thirumalai, D. 1999. Pair potentials for protein folding: Choice of reference states and sensitivity of predicted native states to variations in the interaction schemes. Protein Sci. 8 361–369. [DOI] [PMC free article] [PubMed] [Google Scholar]
- Bowie, J.U., Luthy, R., and Eisenberg, D. 1991. A method to identify protein sequences that fold into a known three-dimensional structure. Science 253 164–170. [DOI] [PubMed] [Google Scholar]
- Brooks, C.L., Karplus, M., and Pettitt, B.M. 1988. Proteins: A theoretical perspective of dynamics, structure, and thermodynamics. pp. xiii–259. Wiley, New York.
- Bryant, S.H. and Lawrence, C.E. 1993. An empirical energy function for threading protein sequence through the folding motif. Proteins 16 92–112. [DOI] [PubMed] [Google Scholar]
- Bryngelson, J.D., Onuchic, J.N., Socci, N.D., and Wolynes, P.G. 1995. Funnels, pathways, and the energy landscape of protein folding: A synthesis. Proteins 21 167–195. [DOI] [PubMed] [Google Scholar]
- Buchete, N.V., Straub, J.E., and Thirumalai, D. 2004a. Development of novel statistical potentials for protein fold recognition. Curr. Opin. Struct. Biol. 14 225–232. [DOI] [PubMed] [Google Scholar]
- Buchete, N.V., Straub, J.E., and Thirumalai, D. 2004b. Orientational potentials extracted from protein structures improve native fold recognition. Protein Sci. 13 862–874. [DOI] [PMC free article] [PubMed] [Google Scholar]
- Casari, G. and Sippl, M.J. 1992. Structure-derived hydrophobic potential—Hydrophobic potential derived from X-ray structures of globular-proteins is able to identify native folds. J. Mol. Biol. 224 725–732. [DOI] [PubMed] [Google Scholar]
- Chen, W.W. and Shakhnovich, E.I. 2005. Lessons from the design of a novel atomic potential for protein folding. Protein Sci. 14 1741–1752. [DOI] [PMC free article] [PubMed] [Google Scholar]
- Chiu, T.L. and Goldstein, R.A. 2000. How to generate improved potentials for protein tertiary structure prediction: A lattice model study. Proteins 41 157–163. [DOI] [PubMed] [Google Scholar]
- Colovos, C. and Yeates, T.O. 1993. Verification of protein structures: Patterns of non-bonded atomic interactions. Protein Sci. 2 1511–1519. [DOI] [PMC free article] [PubMed] [Google Scholar]
- Colubri, A., Jha, A.K., Shen, M.-y., Sali, A., Berry, R.S., Sosnick, T.R., and Freed, K.F. 2006. Minimalist representations and the importance of nearest neighbor effects in protein folding simulations. J. Mol. Biol. doi:10.1016/j.jmb.2006.08.035. [DOI] [PubMed]
- DeBolt, S.E. and Skolnick, J. 1996. Evaluation of atomic level mean force potentials via inverse folding and inverse refinement of protein structures: Atomic burial position and pairwise non-bonded interactions. Protein Eng. 9 637–655. [DOI] [PubMed] [Google Scholar]
- Dehouck, Y., Gilis, D., and Rooman, M. 2006. A new generation of statistical potentials for proteins. Biophys. J. 90 4010–4017. [DOI] [PMC free article] [PubMed] [Google Scholar]
- Deltheli, R. 1919. Sur la théorie des probabilités géométriques. Ann. Fac. Sci. Univ. Toulouse 11 1–65. [Google Scholar]
- de Smith, M. 1977. Distance distributions and trip behaviour in defined regions. Geogr. Anal. 9 332–345. [Google Scholar]
- Dill, K.A. 1985. Theory for the folding and stability of globular proteins. Biochemistry 24 1501–1509. [DOI] [PubMed] [Google Scholar]
- Dill, K.A. 1997. Additivity principles in biochemistry. J. Biol. Chem. 272 701–704. [DOI] [PubMed] [Google Scholar]
- Dobson, C.M., Sali, A., and Karplus, M. 1998. Protein folding: A perspective from theory and experiment. Angew. Chem. Int. Ed. 37 868–893. [DOI] [PubMed] [Google Scholar]
- Eramian, D., Shen, M.Y., Devos, D., Melo, F., Sali, A., and Marti-Renom, M.A. 2006. A composite score for predicting errors in protein structure models. Protein Sci. 15 1653–1666. [DOI] [PMC free article] [PubMed] [Google Scholar]
- Fang, Q. and Shortle, D. 2005. A consistent set of statistical potentials for quantifying local side-chain and backbone interactions. Proteins 60 90–96. [DOI] [PubMed] [Google Scholar]
- Finkelstein, A.V., Badretdinov, A., and Gutin, A.M. 1995. Why do protein architectures have Boltzmann-like statistics? Proteins 23 142–150. [DOI] [PubMed] [Google Scholar]
- Fiser, A., Do, R.K., and Sali, A. 2000. Modeling of loops in protein structures. Protein Sci. 9 1753–1773. [DOI] [PMC free article] [PubMed] [Google Scholar]
- Furuichi, E. and Koehl, P. 1998. Influence of protein structure databases on the predictive power of statistical pair potentials. Proteins 31 139–149. [DOI] [PubMed] [Google Scholar]
- Garcia-Pelayo, R. 2005. Distribution of distance in the spheroid. J. Phys. A Math. Gen. 38 3475–3482. [Google Scholar]
- Gatchell, D.W., Dennis, S., and Vajda, S. 2000. Discrimination of near-native protein structures from misfolded models by empirical free energy functions. Proteins 41 518–534. [PubMed] [Google Scholar]
- Gilis, D. and Rooman, M. 1996. Stability changes upon mutation of solvent-accessible residues in proteins evaluated by database-derived potentials. J. Mol. Biol. 257 1112–1126. [DOI] [PubMed] [Google Scholar]
- Gilis, D. and Rooman, M. 1997. Predicting protein stability changes upon mutation using database-derived potentials: Solvent accessibility determines the importance of local versus non-local interactions along the sequence. J. Mol. Biol. 272 276–290. [DOI] [PubMed] [Google Scholar]
- Hammersley, J. 1950. The distribution of distance in a hypersphere. Ann. Math. Stat. 21 447–452. [Google Scholar]
- Hendlich, M., Lackner, P., Weitckus, S., Floeckner, H., Froschauer, R., Gottsbacher, K., Casari, G., and Sippl, M.J. 1990. Identification of native protein folds amongst a large number of incorrect models—The calculation of low-energy conformations from potentials of mean force. J. Mol. Biol. 216 167–180. [DOI] [PubMed] [Google Scholar]
- Hill, T.L. 1956. Statistical mechanics: Principles and selected applications. p. 432. McGraw-Hill, New York.
- Huang, E.S., Subbiah, S., and Levitt, M. 1995. Recognizing native folds by the arrangements of hydrophobic and polar residues. J. Mol. Biol. 252 709–720. [DOI] [PubMed] [Google Scholar]
- Jernigan, R.L. and Bahar, I. 1996. Structure-derived potentials and protein simulations. Curr. Opin. Struct. Biol. 6 195–209. [DOI] [PubMed] [Google Scholar]
- John, B. and Sali, A. 2003. Comparative protein structure modeling by iterative alignment, model building and model assessment. Nucleic Acids Res. 31 3982–3992. [DOI] [PMC free article] [PubMed] [Google Scholar]
- Jones, D. 1999a. Protein secondary structure prediction based on position-specific scoring matrices. J. Mol. Biol. 292 195–202. [DOI] [PubMed] [Google Scholar]
- Jones, D. 1999b. GenTHREADER: An efficient and reliable protein fold recognition method for genomic sequences. J. Mol. Biol. 287 797–815. [DOI] [PubMed] [Google Scholar]
- Jones, D.T. and Thornton, J. 1996. Potential energy functions for threading. Curr. Opin. Struct. Biol. 6 210–216. [DOI] [PubMed] [Google Scholar]
- Keasar, C. and Levitt, M. 2003. A novel approach to decoy set generation: Designing a physical energy function having local minima with native structure characteristics. J. Mol. Biol. 329 159–174. [DOI] [PMC free article] [PubMed] [Google Scholar]
- Kirkwood, J. 1935. Statistical mechanics of fluid mixtures. J. Chem. Phys. 3 300–313. [Google Scholar]
- Kocher, J., Rooman, M., and Wodak, S. 1994. Factors influencing the ability of knowledge-based potentials to identify native sequence-structure matches. J. Mol. Biol. 235 1598–1613. [DOI] [PubMed] [Google Scholar]
- Kolinski, A., Rotkiewicz, P., Ilkowski, B., and Skolnick, J. 1999. A method for the improvement of threading-based protein models. Proteins 37 592–610. [DOI] [PubMed] [Google Scholar]
- Kouranov, A., Xie, L., de la Cruz, J., Chen, L., Westbrook, J., Bourne, P.E., and Berman, H.M. 2006. The RCSB PDB information portal for structural genomics. Nucleic Acids Res. 34 D302–D305. [DOI] [PMC free article] [PubMed] [Google Scholar]
- Lazaridis, T. and Karplus, M. 2000. Effective energy functions for protein structure prediction. Curr. Opin. Struct. Biol. 10 139–145. [DOI] [PubMed] [Google Scholar]
- Lord, R. 1954. The distribution of distance in a hypersphere. Ann. Math. Stat. 25 794–798. [Google Scholar]
- Lu, H. and Skolnick, J. 2001. A distance-dependent atomic knowledge-based potential for improved protein structure selection. Proteins 44 223–232. [DOI] [PubMed] [Google Scholar]
- Maiorov, V.N. and Crippen, G.M. 1992. Contact potential that recognizes the correct folding of globular proteins. J. Mol. Biol. 227 876–688. [DOI] [PubMed] [Google Scholar]
- McQuarrie, D.A. 1975. Statistical mechanics. pp. xiv–641. Harper & Row, New York.
- Melo, F. and Feytmans, E. 1997. Novel knowledge-based mean force potential at atomic level. J. Mol. Biol. 267 207–222. [DOI] [PubMed] [Google Scholar]
- Melo, F., Sanchez, R., and Sali, A. 2002. Statistical potentials for fold assessment. Protein Sci. 11 430–448. [DOI] [PMC free article] [PubMed] [Google Scholar]
- Misura, K.M., Chivian, D., Rohl, C.A., Kim, D.E., and Baker, D. 2006. Physically realistic homology models built with ROSETTA can be more accurate than their templates. Proc. Natl. Acad. Sci. 103 5361–5366. [DOI] [PMC free article] [PubMed] [Google Scholar]
- Miyazawa, S. and Jernigan, R.L. 1985. Estimation of effective interresidue contact energies from protein crystal-structures—Quasi-chemical approximation. Macromolecules 18 534–552. [Google Scholar]
- Miyazawa, S. and Jernigan, R.L. 1996. Residue–residue potentials with a favorable contact pair term and an unfavorable high packing density term, for simulation and threading. J. Mol. Biol. 256 623–644. [DOI] [PubMed] [Google Scholar]
- Miyazawa, S. and Jernigan, R.L. 1999. An empirical energy potential with a reference state for protein fold and sequence recognition. Proteins 36 357–369. [PubMed] [Google Scholar]
- Miyazawa, S. and Jernigan, R.L. 2000. Identifying sequence–structure pairs undetected by sequence alignments. Protein Eng. 13 459–475. [DOI] [PubMed] [Google Scholar]
- Moult, J. 1997. Comparison of database potentials and molecular mechanics force fields. Curr. Opin. Struct. Biol. 7 194–199. [DOI] [PubMed] [Google Scholar]
- O'Donoghue, S.I. and Nilges, M. 1997. Tertiary structure prediction using mean-force potentials and internal energy functions: Successful prediction for coiled-coil geometries. Fold. Des. 2 S47–S52. [DOI] [PubMed] [Google Scholar]
- Onsager, L. 1933. Theories of concentrated electrolytes. Chem. Rev. 13 73–89. [Google Scholar]
- Ouzounis, C., Sander, C., Scharf, M., and Schneider, R. 1993. Prediction of protein structure by evaluation of sequence–structure fitness: Aligning sequences to contact profiles derived from three-dimensional structures. J. Mol. Biol. 232 805–825. [DOI] [PubMed] [Google Scholar]
- Panchenko, A., Marchler-Bauer, A., and Bryant, S. 2000. Combination of threading potentials and sequence profiles improves fold recognition. J. Mol. Biol. 296 1319–1331. [DOI] [PubMed] [Google Scholar]
- Pappu, R.V., Hart, R.K., and Ponder, J.W. 1998. Analysis and application of potential energy smoothing and search methods for global optimization. J. Phys. Chem. B 102 9725–9742. [Google Scholar]
- Park, B. and Levitt, M. 1996. Energy functions that discriminate X-ray and near native folds from well-constructed decoys. J. Mol. Biol. 258 367–392. [DOI] [PubMed] [Google Scholar]
- Park, B., Huang, E., and Levitt, M. 1997. Factors affecting the ability of energy functions to discriminate correct from incorrect folds. J. Mol. Biol. 266 831–846. [DOI] [PubMed] [Google Scholar]
- Pieper, U., Eswar, N., Davis, F.P., Braberg, H., Madhusudhan, M.S., Rossi, A., Marti-Renom, M., Karchin, R., Webb, B.M., and Eramian, D., et al. 2006. MODBASE: A database of annotated comparative protein structure models and associated resources. Nucleic Acids Res. 34 D291–D295. [DOI] [PMC free article] [PubMed] [Google Scholar]
- Press, W.H. 1992. Numerical recipes in FORTRAN: The art of scientific computing, 2nd ed., pp. xxvi–963. Cambridge University Press, Cambridge, UK.
- Qiu, J. and Elber, R. 2005. Atomically detailed potentials to recognize native and approximate protein structures. Proteins 61 44–55. [DOI] [PubMed] [Google Scholar]
- Rahman, A. 1964. Triplet correlations in liquids. Phys. Rev. Lett. 12 575–577. [Google Scholar]
- Reva, B., Finkelstein, A., Sanner, M., and Olson, A. 1997. Residue–residue mean-force potentials for protein structure recognition. Protein Eng. 10 865–876. [DOI] [PubMed] [Google Scholar]
- Rojnuckarin, A. and Subramaniam, S. 1999. Knowledge-based interaction potentials for proteins. Proteins 36 54–67. [DOI] [PubMed] [Google Scholar]
- Rooman, M. and Gilis, D. 1998. Different derivations of knowledge-based potentials and analysis of their robustness and context-dependent predictive power. Eur. J. Biochem. 254 135–143. [DOI] [PubMed] [Google Scholar]
- Rooman, M. and Wodak, S. 1995. Are database-derived potentials valid for scoring both forward and inverted protein folding? Protein Eng. 8 849–858. [DOI] [PubMed] [Google Scholar]
- Sali, A. and Blundell, T.L. 1993. Comparative protein modelling by satisfaction of spatial restraints. J. Mol. Biol. 234 779–815. [DOI] [PubMed] [Google Scholar]
- Samudrala, R. and Moult, J. 1998. An all-atom distance-dependent conditional probability discriminatory function for protein structure prediction. J. Mol. Biol. 275 895–916. [DOI] [PubMed] [Google Scholar]
- Shakhnovich, E. 2006. Protein folding thermodynamics and dynamics: Where physics, chemistry, and biology meet. Chem. Rev. 106 1559–1588. [DOI] [PMC free article] [PubMed] [Google Scholar]
- Shen, M.Y., Davis, F.P., and Sali, A. 2005. The optimal size of a globular protein domain: A simple sphere-packing model. Chem. Phys. Lett. 405 224–228. [Google Scholar]
- Simons, K.T., Kooperberg, C., Huang, E., and Baker, D. 1997. Assembly of protein tertiary structures from fragments with similar local sequences using simulated annealing and Bayesian scoring functions. J. Mol. Biol. 268 209–225. [DOI] [PubMed] [Google Scholar]
- Simons, K.T., Ruczinski, I., Kooperberg, C., Fox, B.A., Bystroff, C., and Baker, D. 1999. Improved recognition of native-like protein structures using a combination of sequence-dependent and sequence-independent features of proteins. Proteins 34 82–95. [DOI] [PubMed] [Google Scholar]
- Sippl, M.J. 1990. Calculation of conformational ensembles from potentials of mean force. An approach to the knowledge-based prediction of local structures in globular proteins. J. Mol. Biol. 213 859–883. [DOI] [PubMed] [Google Scholar]
- Sippl, M.J. 1993a. Boltzmann's principle, knowledge-based mean fields and protein folding. An approach to the computational determination of protein structures. J. Comput. Aided Mol. Des. 7 473–501. [DOI] [PubMed] [Google Scholar]
- Sippl, M.J. 1993b. Recognition of errors in three-dimensional structures of proteins. Proteins 17 355–362. [DOI] [PubMed] [Google Scholar]
- Sippl, M.J. and Weitckus, S. 1992. Detection of native-like models for amino acid sequences of unknown three-dimensional structure in a data base of known protein conformations. Proteins 13 258–271. [DOI] [PubMed] [Google Scholar]
- Skolnick, J., Jaroszewski, L., Kolinski, A., and Godzik, A. 1997. Derivation and testing of pair potentials for protein folding. When is the quasichemical approximation correct? Protein Sci. 6 676–688. [DOI] [PMC free article] [PubMed] [Google Scholar]
- Skolnick, J., Kolinski, A., and Ortiz, A. 2000. Derivation of protein-specific pair potentials based on weak sequence fragment similarity. Proteins 38 3–16. [PubMed] [Google Scholar]
- Summa, C.M., Levitt, M., and Degrado, W.F. 2005. An atomic environment potential for use in protein structure prediction. J. Mol. Biol. 352 986–1001. [DOI] [PubMed] [Google Scholar]
- Sun, S. 1993. Reduced representation model of protein structure prediction: Statistical potential and genetic algorithms. Protein Sci. 2 762–785. [DOI] [PMC free article] [PubMed] [Google Scholar]
- Tanaka, S. and Scheraga, H.A. 1976. Medium- and long-range interaction parameters between amino acids for predicting three-dimensional structures of proteins. Macromolecules 9 945–950. [DOI] [PubMed] [Google Scholar]
- Thomas, P.D. and Dill, K.A. 1996a. An iterative method for extracting energy-like quantities from protein structures. Proc. Natl. Acad. Sci. 93 11628–11633. [DOI] [PMC free article] [PubMed] [Google Scholar]
- Thomas, P.D. and Dill, K.A. 1996b. Statistical potentials extracted from protein structures: How accurate are they? J. Mol. Biol. 257 457–469. [DOI] [PubMed] [Google Scholar]
- Tobi, D. and Elber, R. 2000. Distance-dependent, pair potential for protein folding: Results from linear optimization. Proteins 41 40–46. [PubMed] [Google Scholar]
- Tobi, D., Shafran, G., Linial, N., and Elber, R. 2000. On the design and analysis of protein folding potentials. Proteins 40 71–85. [DOI] [PubMed] [Google Scholar]
- Topf, M. and Sali, A. 2005. Combining electron microscopy and comparative protein structure modeling. Curr. Opin. Struct. Biol. 15 578–585. [DOI] [PubMed] [Google Scholar]
- Topf, M., Baker, M.L., Marti-Renom, M.A., Chiu, W., and Sali, A. 2006. Refinement of protein structures by iterative comparative modeling and CryoEM density fitting. J. Mol. Biol. 357 1655–1668. [DOI] [PubMed] [Google Scholar]
- Tu, S.J. and Fischbach, E. 2002. Random distance distribution for spherical objects: General theory and applications to physics. J. Phys. A Math. Gen. 35 6557–6570. [Google Scholar]
- Vajda, S., Sippl, M., and Novotny, J. 1997. Empirical potentials and functions for protein folding and binding. Curr. Opin. Struct. Biol. 7 222–228. [DOI] [PubMed] [Google Scholar]
- Vendruscolo, M., Najmanovich, R., and Domany, E. 2000. Can a pairwise contact potential stabilize native protein folds against decoys obtained by threading? Proteins 38 134–148. [DOI] [PubMed] [Google Scholar]
- Wang, G. and Dunbrack Jr., R.L. 2003. PISCES: A protein sequence culling server. Bioinformatics 19 1589–1591. [DOI] [PubMed] [Google Scholar]
- Wang, K., Fain, B., Levitt, M., and Samudrala, R. 2004. Improved protein structure selection using decoy-dependent discriminatory functions. BMC Struct. Biol. 4 8. [DOI] [PMC free article] [PubMed] [Google Scholar]
- Weichenberger, C.X. and Sippl, M. 2006. Self-consistent assignment of asparagine and glutamine amide rotamers in protein crystal structures. Structure 14 967–972. [DOI] [PubMed] [Google Scholar]
- Wodak, S.J. and Janin, J. 1980. Analytical approximation to the accessible surface area of proteins. Proc. Natl. Acad. Sci. 77 1736–1740. [DOI] [PMC free article] [PubMed] [Google Scholar]
- Xia, Y., Huang, E.S., Levitt, M., and Samudrala, R. 2000. Ab initio construction of protein tertiary structures using a hierarchical approach. J. Mol. Biol. 300 171–185. [DOI] [PubMed] [Google Scholar]
- Zhang, C., Liu, S., Zhou, H., and Zhou, Y. 2004. The dependence of all-atom statistical potentials on structural training database. Biophys. J. 86 3349–3358. [DOI] [PMC free article] [PubMed] [Google Scholar]
- Zhou, H. and Zhou, Y. 2002. Distance-scaled, finite ideal-gas reference state improves structure-derived potentials of mean force for structure selection and stability prediction. Protein Sci. 11 2714–2726. [DOI] [PMC free article] [PubMed] [Google Scholar]
- Zhou, H. and Zhou, Y. 2003. Erratum: Distance-scaled, finite ideal-gas reference state improves structure-derived potentials of mean force for structure selection and stability prediction. Protein Sci. 12 2121. [DOI] [PMC free article] [PubMed] [Google Scholar]


