Abstract
Type I interferons (IFNs) are a family of homologous helical cytokines that exhibit pleiotropic effects on a wide variety of cell types, including antiviral activity and antibacterial, antiprozoal, immunomodulatory, and cell growth regulatory functions. Consequently, IFNs are the human proteins most widely used in the treatment of several kinds of cancer, hepatitis C, and multiple sclerosis. All type I IFNs bind to a cell surface receptor consisting of two subunits, IFNAR1 and IFNAR2, associating upon binding of interferon. The structure of the extracellular domain of IFNAR2 (R2-EC) was solved recently. Here we study the complex and the binding interface of IFNα2 with R2-EC using multidimensional NMR techniques. NMR shows that IFNα2 does not undergo significant structural changes upon binding to its receptor, suggesting a lock-and-key mechanism for binding. Cross saturation experiments were used to determine the receptor binding site upon IFNα2. The NMR data and previously published mutagenesis data were used to derive a docking model of the complex with an RMSD of 1 Å, and its well-defined orientation between IFNα2 and R2-EC and the structural quality greatly improve upon previously suggested models. The relative ligand–receptor orientation is believed to be important for interferon signaling and possibly one of the parameters that distinguish the different IFN I subtypes. This structural information provides important insight into interferon signaling processes and may allow improvement in the development of therapeutically used IFNs and IFN-like molecules.
Keywords: interferons, protein–protein docking, protein–protein interactions, multidimensional NMR, cross saturation
Type I Interferons (IFNs) are a family of homologous helical cytokines initiating strong antiviral and antiproliferative activity. Since IFNs are at the forefront of defense against viral infection and promote a variety of biological effects, they are essential for the survival of higher vertebrates (Stark et al. 1998; Biron 2001). Not surprisingly, IFNs are the human proteins most widely used as therapeutics for the treatment of several kinds of cancer and viral diseases (e.g., Perry and Jarvis 2001; Kirkwood 2002). Human type I interferons include 13 IFNα isotypes (and allelic forms) and single forms of IFNβ, IFNɛ, IFNκ, and IFNω (Pestka et al. 2004). Sequence homology between all IFNα isotypes is high, with ∼80% identity, and the identity of the IFNα isotypes to ω, β, ɛ, and κ subtypes is 50%, 31%, 28%, and 27%, respectively. IFNγ is the only known type II interferon (Pestka et al. 1987), and it shares only 10% identity with IFNα. The three-dimensional structures of several type I IFNs have been solved, and a high resolution NMR structure of human IFNα2a (Klaus et al. 1997) and the X-ray structures of IFNα2b (Karpusas et al. 1997) and IFNβ (Radhakrishnan et al. 1996) are available.
All human type I IFNs share a common cell surface receptor consisting of two subunits, IFNAR1 and IFNAR2 (Uze et al. 1995). IFNAR1 and IFNAR2 belong to the class II helical cytokine receptor family (HCRII). Other members of this family are the IFNγ receptor (IFNGR), tissue factor (TF), the interleukin 10 receptor (IL10R1 and IL10R2), the interleukin 20 receptor (IL20R1 and IL20R2), IL-28BP, IFNLR, and IL-28Rα (Langer et al. 2004). The IFNAR2 subunit is the major ligand-binding component and can bind IFNs with high affinity without IFNAR1. The affinity of the human IFNAR1 subunit to IFNs is much lower and it binds to IFN only after IFNAR2 binding. Responses to binding of the different ligands to IFNAR2 and IFNAR1 are similar, but significant differences, most notably between IFNα and IFNβ signaling, have been observed (Abramovich et al. 1994; Croze et al. 1996; Platanias et al. 1996; Domanski et al. 1998; Runkel et al. 1998; Piehler and Schreiber 1999; Russell-Harde et al. 1999; Piehler et al. 2000; Deonarain et al. 2002). An important difference between IFNα and IFNβ is their different binding affinities to IFNAR1 (Russell-Harde et al. 1999; Lamken et al. 2004), which might be one of the reasons for the differential activity of type I inteferons. A recent study by Jaitin et al. (2006) showed that IFNα2 mutants with higher affinity to IFNAR1, resembling IFNβ’s affinity to IFNAR1, are functionally similar to IFNβ. It is still under debate how the ternary complex is formed and stabilized. Several mechanisms, involving preassociation of the receptor chains and ligand-induced changes, were postulated based on other cytokine receptor systems (Cunningham et al. 1991; Ozbek et al. 1998; Remy et al. 1999; Bernat et al. 2003; Gent et al. 2003; Krause and Pestka 2005). However, a recent study showed no evidence for interactions between IFNAR1 and IFNAR2 in the ternary complex (Lamken et al. 2004).
The structure of the IFNAR2 IFN-binding ectodomain (R2-EC) was solved recently by NMR (Chill et al. 2003), revealing two perpendicularly oriented fibronectin domains. The structures of the larger IFNAR1 subunit and of the binary IFNα2/IFNAR2 and ternary IFNAR1/IFNα2/IFNAR2 complexes have not been solved yet. Nevertheless, information about the location of the binding site for IFNα2 on IFNAR2 was obtained by mutagenesis and immunoblocking as well as by NMR chemical shift perturbation studies (Lewerenz et al. 1998; Chuntharapai et al. 1999; Chill et al. 2002). These studies mapped the binding site for IFNα2 on R2-EC to a contiguous surface on the N domain of the receptor and the hinge region connecting the two fibronectin domains. Residues of the interferon ligand interacting with R2-EC and contributing most to the binding energy were also identified by mutagenesis (Piehler and Schreiber 1999; Piehler et al. 2000), providing the necessary information for a rudimentary model of the IFNα2/R2-EC complex (Chill et al. 2003).
Despite these advances, the three-dimensional structure of the R2-EC/IFNα2 complex would greatly enhance our understanding of IFN binding. R2-EC and the R2-EC/IFNα2 complex have proven to be notoriously difficult to study by X-ray crystallography. Although NMR has contributed significantly to the study of this complex, at 44 kDa structure determination by NMR of R2-EC/IFNα2 presents considerable challenges. Traditionally, structure determination of complexes by NMR is based on intermolecular 1H-1H NOEs (Wüthrich 1986). The derivation of distance restraints from 3D- and 4D-NOESY spectra for structure determination requires resonance assignment for side chain protons, a difficult task to accomplish for proteins larger than 35 kDa due to decreasing transverse relaxation times of the carbon and hydrogen nuclei. However, sequential assignment of backbone nuclei, including the amide protons of proteins in large macromolecular complexes, has become feasible in recent years using uniform deuteration, TROSY-based triple-resonance experiments, and high-field spectrometers (for review, see Clore and Gronenborn 1998). Thus, the mapping of binding interfaces is possible using chemical shift perturbation or cross saturation experiments (Takahashi et al. 2000; Zuiderweg 2002).
In this study, we use NMR spectroscopy to determine the binding site for R2-EC upon IFNα2 and obtain a very well-defined model of the binary complex. The cross saturation experiment was utilized to determine residues of IFNα2 involved in binding to the receptor. The binding site was mapped to a contiguous surface on the AB loop and E helix of IFNα2. Docking of the two structures was performed based on the structures of the free molecules and the binding sites on the molecules determined by NMR. Knowledge of the exact binding sites on the two proteins is a crucial step in the determination of the three-dimensional structure of the complex and hence provides better insight into the IFN signaling cascade.
Results
Backbone assignment for complexed IFNα2
In order to learn about protein structure by NMR, assignment of the resonances of the protein must be available. Therefore, backbone assignment of IFNα2 in complex with R2-EC was performed using uniform 13C, 15N, and 2H labeling of IFNα2. Standard TROSY multidimensional NMR spectra were utilized to assign backbone resonance frequencies of complexed IFNα2. About 85% of the amide protons and nitrogens (135 of 159 non-proline residues), 89% of 13CO and 13Cβ as well as 93% of 13Cα resonances of complexed IFNα2 could be assigned. Unassigned residues are mainly located in loops and in the N terminus. These mobile regions are prone to rapid solvent exchange under the experimental conditions (pH 8 and 308 K).
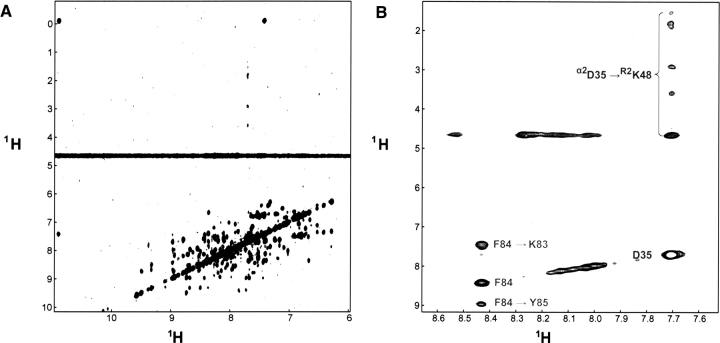
▶ shows the 1H-1H projection of the 15N-separated TROSY-NOE spectrum. About 100 unambiguous HN-HN intramolecular NOEs could be assigned. However, all of them are short range in nature. The exception is residue D35 of IFNα2, which shows cross peaks to the entire side chain of K48 of R2-EC (▶). The intramolecular NOE data were used to verify backbone and secondary structure assignment. The extent of backbone assignment is very good, considering the high pH of the sample and size of the protein under investigation.
Figure 1.
15N TROSY NOE of 15N,D-IFNα2/U-R2-EC. (A) 1H-1H projection showing the interactions between amide protons. (B) 1H-1H plane at δN = 123.8 ppm. This plane shows the only intermolecular interaction observed between αD35 and R2K48 in the spectrum marked in dark gray. Other intramolecular interactions in the same plane are marked in light gray.
Secondary structure of complexed IFNα2
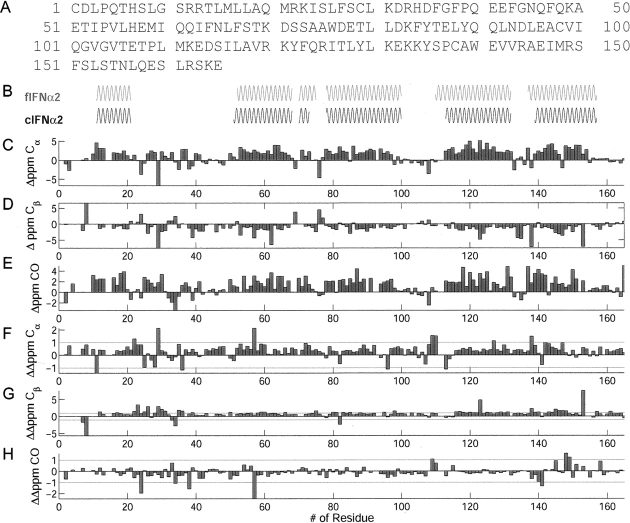
To examine whether IFNα2 undergoes conformational change that involve changes in its secondary structure, the deviations of chemical shifts from random coil values were compared between IFNα2 in complex with R2-EC and its free form (▶). These deviations of chemical shifts from random coil values are closely correlated to protein secondary structure. ▶ shows the deviation from random coil of 13Cα, 13Cβ, and 13CO resonances as well as the secondary structure motifs for complexed IFNα2 derived using the program CSI (Wishart and Sykes 1994) and the previously published chemical shift assignment for free IFNα2 (Klaus et al. 1997). The helices in complexed IFNα2 are formed by the segments αS11–αM21 (helix A), αE51–αS68 (helix B), αK70–αS73 (helix B′), αE78–αI100 (helix C), αS115–αE132 (helix D), and αA139–αL157 (helix E). The length of helices A, C, and E is unchanged between free and complexed IFNα2. Similarly, the distinct N-cap fingerprints (Gronenborn and Clore 1994) of residues αT69 and αW76, the first residues of the B′ and C helices, respectively, are observed both in free and in complexed IFNα2. Slight variations in the length of the helices are observed for helix B, which is elongated by one residue on the N-terminal side and Helix B′, which is shorter by two residues. The effect of complex formation on helix D, which in free IFNα2 starts with residue αL110, could not be assessed since some of the backbone resonances of αL110–αD114 in the complex with R2-EC could not be assigned.
Figure 2.
Deviation of chemical shifts and secondary structure. (A) Amino acid sequence of IFNα2. (B) Helical elements of noncomplexed IFNα2 (fIFNα2) and complexed IFNα2 (cIFNα2). (C–E) Deviations of chemical shifts from random coil values for 13Cα (C), 13Cβ (D), and 13CO (E). (F–H) Differences in 13Cα (F), 13Cβ (G), and 13CO (H) chemical shifts between noncomplexed and complexed IFNα2.
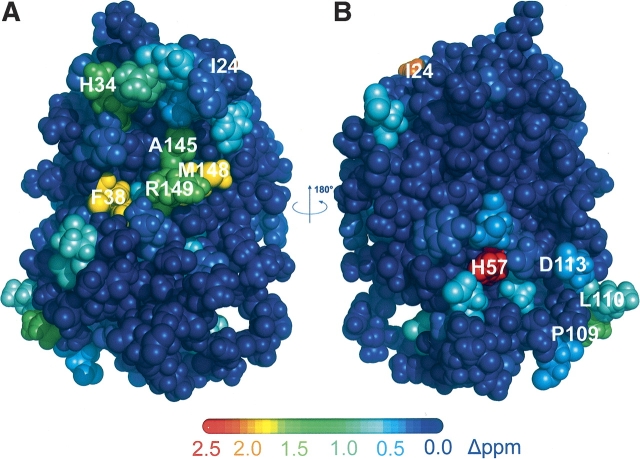
To further explore whether complex formation causes any conformational changes, we examined the difference in chemical shift between free and complexed IFNα2. Unfortunately, free IFNα2 is monomeric only at acidic pH, and the complex is stable and does not aggregate only above neutral pH. The change in pH between the free form of IFNα2 and the complex could result in chemical shift changes that are not related to binding and conformational changes. To minimize this problem the sum of 13Cα and 13CO chemical shift changes were analyzed and mapped on the structure of free IFNα2 (▶). In contrast to 15N chemical shifts, 13Cα and 13CO shifts are mostly indifferent to changes in pH. Deuterium isotope effects on the chemical shifts were taken into account (Venters et al. 1996). Significant changes >0.9 ppm for 13Cα and 13CO chemical shifts are observed for residue αS11 in the A helix, residues αR22, αI24, αS25, αS28, αC29, αH34, αP36, and αF38 in the AB loop, residue αH57 in the B helix, residue αS72 in the B′ helix, residue αE96 in the C helix, residues αP109, αL110, αE113, and αT127 in the D helix, and residues αC138, αW140, αE141, αV142, αI147, αM148, and αR149 in the DE loop and E helix. Changes >0.7 ppm are observed for residues αL3 and αS8 in the N terminus; αK23, αI24, αR33, and αD35 in the AB loop; αI53, αV55, αM59, αI60, and αS73 in the B and B′ helices; αY89 and αL92 in the C helix; αE107 and αT108 in the CD loop; αL130 in the D helix; and αA139, αE141, αV143, αA145, and αQ158 in the E helix. It is evident that the vast majority of chemical shift changes are localized in the AB loop and E helix, which form the R2-EC binding site as determined by mutagenesis (Piehler and Schreiber 1999; Piehler et al. 2000). Additional chemical shift changes were observed for αH57 and its vicinity.
Figure 3.
Mapping the sum of 13CO and 13Cα chemical shift changes of noncomplexed IFNα2. (A) Face of IFNα2 binding to R2-EC. (B) Opposite face. The color coding for the changes in 13CO and 13Cα chemical shifts is given by the colored bar. Highest changes in chemical shifts are 2.5 ppm (red). Dark blue color corresponds to no change in chemical shift.
The changes in 13Cα and 13Cβ are not randomly distributed on the surface of the IFNα2, as would be expected if changes are due only to the change in sample pH. Rather, the highest changes can be observed for residues located in the R2-EC binding site as well as for residue αH57 and its surrounding residues (see ▶). Thus the small changes in chemical shift for residues outside the binding site and away from αH57 imply that the conformation of IFNα2 does not change upon R2-EC binding and that any significant changes are probably restricted to residues involved in R2-EC binding.
Determination of the R2-EC binding site on IFNα2
The IFNα2 binding site on R2-EC has been determined previously (Chill et al. 2002) using chemical shift perturbation of 15N-R2-EC upon binding unlabeled IFNα2 (Chill et al. 2002). The regions of R2-EC that experienced the largest changes in chemical shifts were RT44–RK53, RS74–RV82, and RC95–RM105. Highlighting these residues on the NMR structure of R2-EC revealed parallel hydrophobic and hydrophilic striations that form the binding site for IFNα2 (Chill et al. 2003). Unfortunately, an analogous determination of the R2-EC binding site on IFNα2 was not practical. Free IFNα2 is monomeric only at acidic pH. Its resonances were assigned and its structure was determined at pH 3.5 (Klaus et al. 1997). However, the stability of the IFNα2/R2-EC samples required that its resonances (Klaus et al. 1997) be assigned at pH 8, precluding an analysis of chemical shifts changes upon complex formation. Nevertheless, as shown in ▶ and ▶, most changes in 13Cα and 13CO of IFNα2 are attributed to IFNα2 residues involved in R2-EC binding.
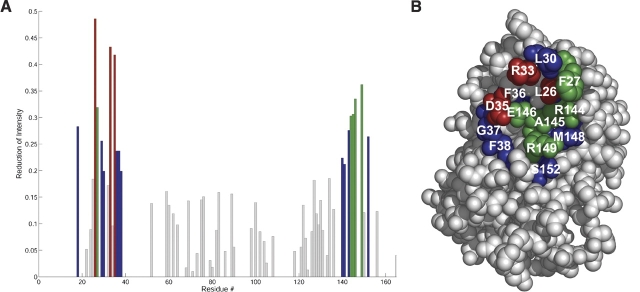
To circumvent this problem, the binding site for R2-EC on IFNα2 was mapped unequivocally using the cross saturation experiment (Takahashi et al. 2000) carried out on a 2H,15N- IFNα2/U-R2-EC sample. The aliphatic protons of the unlabeled R2-EC were saturated by irradiation at 0.9 ppm for 1.2 sec. As a result of the long irradiation saturation is transferred by spin diffusion to all other protons of the receptor, as well as to the amide protons of IFNα2 that are located in the binding site. Spin diffusion between the amide protons in IFNα2 is minimized by deuteration and by using a 90% D2O/10% H2O solution (Takahashi et al. 2000). IFNα2 residues located in the binding site can be identified by the decrease in intensity of their [1H,15N] TROSY HSQC cross peaks when R2-EC is irradiated. ▶ shows the reduction ratio of cross peak intensity for each IFNα2 residue. Residues that are affected significantly (>20% reduction in cross peak intensity) by the cross saturation transfer are all located on one side of the IFNα2 molecule and form a contiguous surface. Residues most affected by the cross saturation are αL26, αR33, and αD35 in the AB loop as well as αF151 in the E helix. Other residues showing a significant decrease in peak intensities are αL18 located in the A helix, αF27, αC29, αL30, αF36, αG37, and αF38 in the AB loop, and αW140, αE141, αV143, αR144, αA145, αE146, αR149, and αS152 in the E helix. αD35 is the only residue in the IFNα binding site for R2-EC that shows strong NOE cross peaks between its amide proton and a receptor residue (▶).
Figure 4.
Cross saturation experiment of 0.3 mM 15N,D-IFNα2/R2-EC in 25 mM tris (pH 8), 90% D2O/10% H2O. (A) Bar graph of the reduction of peak intensities between [15N,1H] TROSY HSQC spectra with and without irradiation of aliphatic protons at 0.9 ppm. (Red bars) 40%–50% reduction, (green) 30%–40%, (blue) 20%–30%, (gray) <20%. (B) Mapping of residues with reduction ratios >20% on the structure of IFNα2. The color code is the same as in A.
Docking of the IFNα2/R2-EC complex
A prerequisite for obtaining a reliable model of a complex based on the structures of the free molecules and a small number of experimental restraints is that no major structural changes occur upon binding. This condition is satisfied by R2-EC since chemical shift changes are limited to the binding site region. The secondary structure elements determined for IFNα2 in the complex involve nearly the same residues as in the free IFNα2. This, together with the fact that R2-EC does not cause any significant chemical shift changes other than for residues located in the binding site and for αH57 and its vicinity (▶), indicates that no major structural changes occur in IFNα2 upon binding to R2-EC.
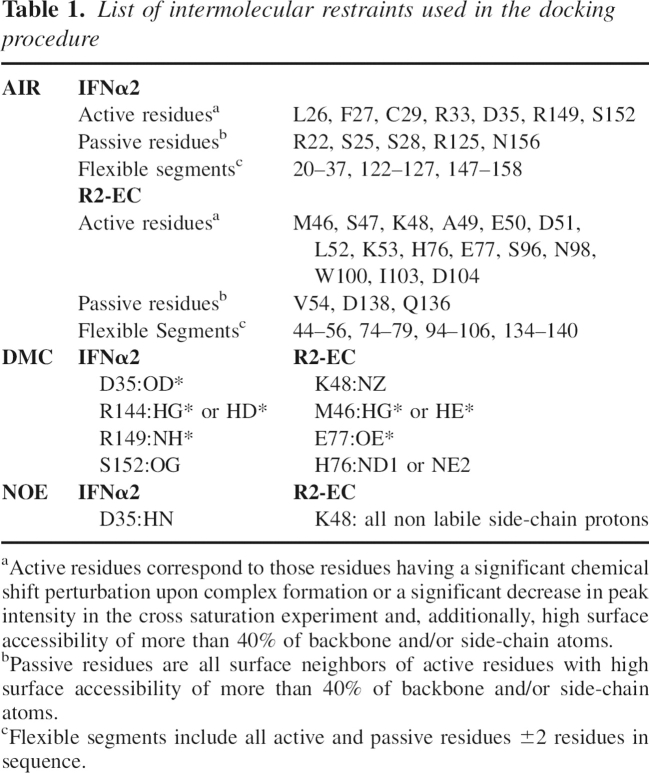
The mapping of the binding site for R2-EC on IFNα2 accomplished in this study and the determination of the binding site for IFNα2 on R2-EC together with the NOE data for αD35/RK48 and double mutant cycle restraints (Roisman et al. 2001) allowed us to perform an in silico docking of the two proteins using the program HADDOCK (Dominguez et al. 2003) to improve on the previously proposed model that was based solely on the double mutant cycle restraints (Chill et al. 2003).
The program HADDOCK (Dominguez et al. 2003) defines active and passive residues for the docking process. Active residues are those residues determined to be involved in the binding site and exhibiting high surface accessibility (in this case >40%). Passive residues are surface neighbors of the active residues with high surface accessibility. For IFNα2, 10 active and five passive residues were chosen as well as 16 active and three passive residues for R2-EC (see ▶).
Table 1.
List of intermolecular restraints used in the docking procedure
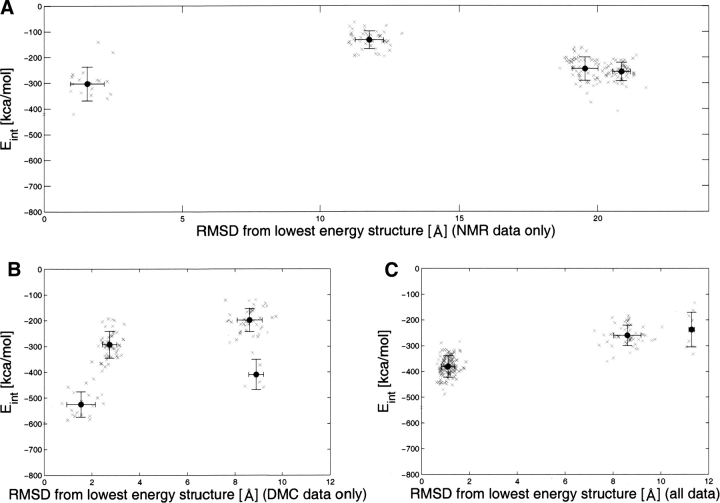
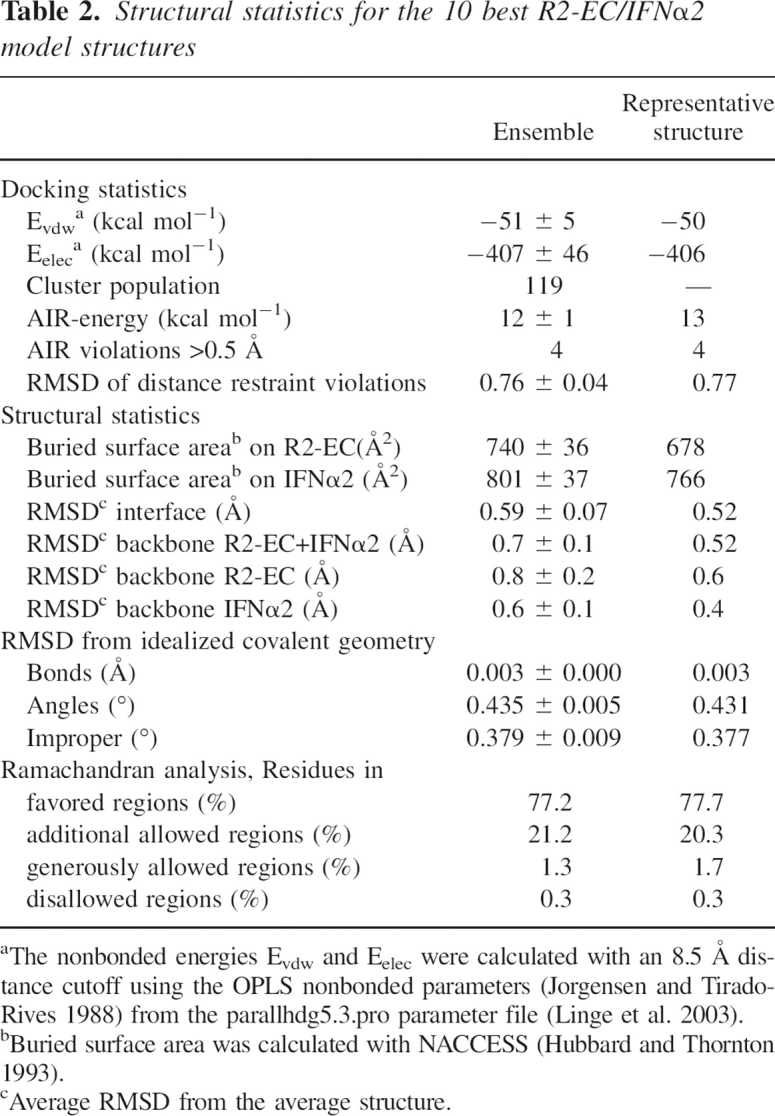
Three docking runs were performed, the first one using only DMC restraints, the second one using only NMR data, and the third one using both. ▶ shows a graph of the intermolecular energies of the solutions as a function of the RMSD from the lowest energy structure. The solutions were clustered using a 1 Å distance. Clusters were ranked according to the average intermolecular energies of the 10 lowest energy structures. The ensemble of the lowest energies for the cluster with the lowest average energy was used as the best solution. As can be seen in ▶, the run using only NMR-derived restraints converges poorly and provides four different solutions. The cluster with the lowest energy is actually the least populated of the three clusters. The difference between the cluster with the lowest energy and the second lowest energy is a 180° rotation of IFNα2 relative to R2-EC. Docking based on DMC restraints alone (▶) provides better convergence, but the RMSD of the ensemble is still high. None of the clusters for runs 1 and 2 contain more than a quarter of the total number of structures. The docking run using NMR data as well as DMC data (▶) has very good convergence, and 119 out of 200 structures are included in the cluster. Additionally, the solution has only a small number of AIR violations. ▶ shows a summary of statistics for the 10 best model structures of this cluster as well as for the representative structure.
Figure 5.
Intermolecular energies (Evdw + Eelec + Erestraints) versus backbone RMSD from the lowest energy structure. Only structures belonging to a cluster were taken into account. Values for individual structures are indicated by gray plus signs; cluster averages and standard deviations are shown in black. (A) Docking using only DMC restraints, (B) docking using only NMR data, and (C) docking using NMR as well as DMC data.
Table 2.
Structural statistics for the 10 best R2-EC/IFNα2 model structures
Model of the IFNα2/R2-EC complex
▶ shows the ensemble of the 10 lowest energy structures of the lowest energy cluster. The average intermolecular potential energy of this ensemble is −446 ± 96 kcal/mol. The binding surface area on R2-EC is 740 ± 36 Å2 and for IFNα2 801 ± 36 Å2, values similar to binding surfaces observed in other protein–protein complexes. Salt bridges are formed between residues RE50 and αR33, RD51 and αR33, RE77 and αR149, RD138 and αR162, and RD186 and αR162, as well as between RK48 and αD35. Possible intermolecular hydrogen bonds are formed between the following donor–acceptor pairs: RH76O/αR149NH2, RS140OG/αR162NH2, RK159NZ/αE165OE1, and RH187O/αR162NH2. ▶ shows a summary of all intermolecular contacts.
Figure 6.
Model of the IFNα2/R2-EC complex. (A) Ensemble of the 20 lowest energy structures of cluster I of the docking procedure. (B) Close-up view of the interface of the complex. IFNα2 is shown in green and R2-EC in orange. Residues involved in double mutant cycle restraints are shown in stick representation and labeled in the same colors as the protein. Names of β-strands and helices are given as well.
Table 3.
Intermolecular contactsa statistics calculated over the ensemble of the 10 best structures

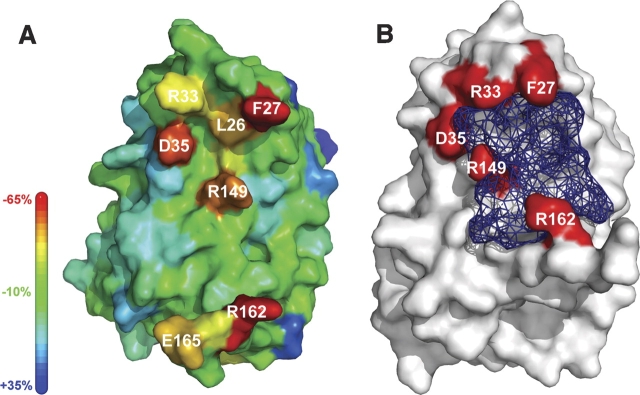
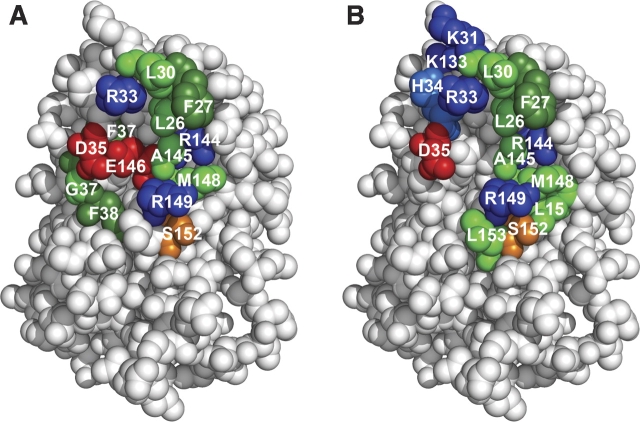
IFNα2 residues losing the highest percentage of surface accessibility are αF27, αR33, and αD35 located in the AB loop, αR149 in the E helix, and αR162 at the C terminus (▶). These five residues make up ∼60% of the binding surface, each contributing from 10% to 17% of the binding interface. In the binding site for IFNα2 on R2-EC, no such hotspot residues are observed and no residue contributes more than 8% to the total binding surface. Analysis using PDBsum (Laskowski et al. 2005) shows that in free IFNα2 a cleft with a volume of 1666 Å3 is formed by binding site residues and lined by αF27, αR33, αD35, αR149, and αR162 (▶). The binding site on IFNα2 is complementary to the previously determined binding site on R2-EC. Residues αL26, αF27, αL30, αA145, and αM148 form a hydrophobic strip, and residues αR33, αD35, αE146, αR149, and αS152 form an adjacent strip of alternating charges opposing the charges on R2-EC (see ▶).
Figure 7.
(A) Loss of surface accessibility upon complex formation. The change in surface accessibility upon complex formation was mapped on the structure of IFNα2 in the complex. The colored bar on the left represents the color coding for the percentage of change of accessible surface area. Residues experiencing the highest loss in surface accessibility upon binding are labeled. (B) Cleft formed by the R2-EC binding site. The cleft is shown in blue wireframe representation as determined using PDBsum for the free IFNα2. Residues lining the cleft and losing the highest percentage of surface accessibility upon binding are marked in red and labeled.
Figure 8.
Binding site of R2-EC on IFNα2 determined by (A) cross saturation and (B) mutagenesis. (Red) Negatively charged residues, (blue) positively charged residues, (green) aliphatic residues, (dark green) aromatic residues, (orange) partially negatively charged residues, (light blue) partially positively charged residues.
Discussion
The IFNα2/R2-EC complex poses a challenging problem for NMR studies due to its large size of 44 kDa, high sample pH, low sample concentration, and helicity of IFNα2 causing severe overlap in the NMR spectra. Despite these difficulties, we were able to study the structure of IFNα2 in its complex with R2-EC and obtain a well-defined model for the complex between the two proteins.
IFNα2 retains its global conformation upon binding to its receptor
The NMR data indicate that R2-EC binding to IFNα2 does not cause any significant changes in the secondary structure of IFNα2 and its global conformation as can be judged by comparing the chemical shifts of IFNα2 in its free form and in complex with R2-EC. Changes in 13Cα and 13CO chemical shifts were detected mostly for residues in the binding site and for residues surrounding αH57.
The observed rigidity of the global structure of the receptor as well as of the IFNα2 ligand manifested by the absence of any significant changes in structure as judged by the minor changes in chemical shifts outside the binding site region for both proteins in their free form and in the complex suggests that interferons bind to the IFNAR2 receptor mostly via a “lock and key” type mechanism.
The changes in the chemical shifts of αH57 could be attributed to the large difference in pH (4.5 pH units) in which the spectra of IFNα2 in its free form and in complex with R2-EC were measured. However, the two other histidine residues in IFNα2, αH7 and αH34, experience significantly smaller changes in chemical shift upon R2-EC binding. Although effects of the protonation state on the chemical shift were recorded for Cα and Cβ, such changes were not recorded for CO chemical shifts (Wishart and Case 2001), supporting the existence of effects other than changes caused by the difference in pH. Mutagenesis data suggest (Roisman et al. 2005) that αH57 is involved in binding of the second receptor subunit, IFNAR1. Some neighboring residues of αH57, either in sequence or in space, also show higher than average changes in chemical shifts (αV55, αM59, αV60, αY89, αE96). These changes might be induced by altered protonation state or by conformational changes in the IFNAR1 binding site induced by IFNα2 binding to R2-EC. An allosteric effect like a conformational change in the binding site of IFNAR1 on IFNα2 upon binding of IFNAR2 would explain the increased affinity of IFNAR1 to the binary complex between IFNAR2 and IFNα2 compared to unbound IFNα2. Since the chemical shift changes are very small and limited to only a few residues on the surface of IFNα2, we can assume that conformational changes must be very small as well. However, at this point there is not enough evidence to define conclusively if the chemical shifts changes are due to the difference in pH or due to conformational changes or both.
The R2-EC binding site: NMR versus mutagenesis
The docking of two protein molecules to build a model for the binary complex using their structure in the free form requires the mapping of the binding site on each of the interacting molecules. NMR provides several powerful, independent methods for the determination of binding surfaces. Chemical shift perturbation was used previously to determine the binding site for IFNα2 on R2-EC. Unequivocal mapping of the binding site of a protein using chemical shift perturbation can be obtained only if the spectrum of the protein in its free form and in its complex can be measured under the same measurement conditions and if the two proteins retain their global conformation upon binding. These requirements are fulfilled for R2-EC, but the first requirement could not be met for IFNα2. Therefore, we determined the binding site for R2-EC on IFNα2 using the cross saturation experiment. This method does not rely on comparison of the NMR data for the protein in its free form and in complex and depends on the direct interaction of the residues of the investigated protein (that is deuterated) with the unlabeled partner molecule in the complex. The binding site for R2-EC is located on the A helix, AB loop, and E helix of IFNα2 and forms a complementary site to the R2-EC binding surface (Piehler et al. 2000) made of a hydrophobic strip and a strip composed of charged residues that oppose a hydrophobic strip and a strip composed of charged residues on R2-EC.
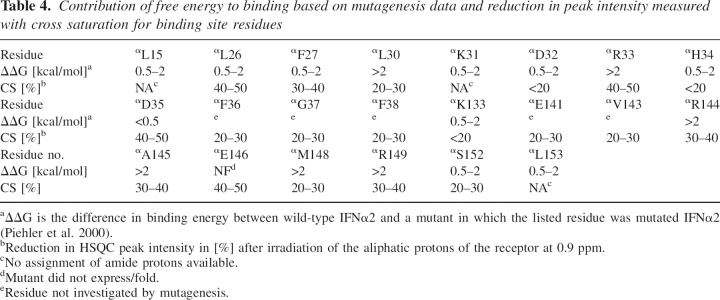
Site-directed mutagenesis and especially double mutant cycle can be used to probe the binding sites on two interacting proteins. ▶ shows a comparison between the binding sites determined with the cross saturation experiment by NMR (▶) and by mutational analysis (▶) (Piehler and Schreiber 1999; Piehler et al. 2000). The cross saturation experiment performed in this study identifies residues involved in binding based on the proximity of the amide protons of IFNα2 to R2-EC protons (either backbone or side chain). Mutational analysis determines residues important for binding by determination of the energetic contribution of those residues by mutation to Ala and isosteric residues (Piehler et al. 2000).
The binding sites demarcated by the two methods are located in the same region, the A helix, AB loop, and E helix. However, some significant differences are observed. Most notably, other hot spot residues are observed by the two different methods. Residues highly affected by the cross saturation method are αL26, αR33, αD35, and αE146, while mutagenesis studies highlight αL30, αR33, αR144, αA145, αM148, and αR149 (Piehler and Schreiber 1999; Piehler et al. 2000). ▶ presents a comparison of all residues inferred to be in the binding site and summarizes the different contribution of residues to binding between the two methods based on binding energy and changes in peak intensity of amide protons due to saturation transfer, respectively. Interestingly αD35, which interacts with the side chain of RK48 and is the only IFNα2 residue that showed strong NOE between its NH proton and the side chain of an R2-EC residue, contributes only 0.3 kcal/mol to the binding energy, as found by mutagenesis.
Table 4.
Contribution of free energy to binding based on mutagenesis data and reduction in peak intensity measured with cross saturation for binding site residues
In contrast to the NMR, which can detect all amide resonances in a single experiment, mutational analysis requires the expression and purification of a large number of mutated proteins. Therefore, only selected residues are mutated and their effect on the binding energy studied. For example, residues αF36, αG37, and αF38, which showed a reduction of 20% to 30% in intensity in the cross saturation measurements, were not probed at all by mutagenesis.
An additional problem encountered by mutational analysis is that some mutants do not express or fold properly. Failure to express mutant proteins prevents the assessment of the contribution of the mutated residues to the binding and suggests that the mutated residues play an important role in stabilizing the structure of the protein. αE146, located in the middle of the binding site, shows a 34% reduction in cross peak intensity but is not one of the binding site residues identified by mutagenesis since the αE146A mutant did not fold properly. Expression of another mutant, αR12A, was unsuccessful as well (Piehler et al. 2000).
Residues αD32, αH34, and αK133 contribute 0.5–2 kcal/mol to the free binding energy, but show no significant effect in the cross saturation experiment. This might be due to the fact that these residues, which are all charged, have a significant effect on the electrostatic nature of the binding site and its surroundings and therefore influence the rate of complex formation rather than being involved directly in interactions with the receptor. Therefore, these residues were not included in the final restraint list. Assignment of the amide protons of residues αL15, αK31, and αL153 is missing, and therefore no direct comparison between the two methods is possible for these residues. Examination of these three residues reveals that αL15 is buried, implying a structural role in stabilizing the binding site rather than direct interaction with R2-EC. According to the model of the IFNα2/R2-EC complex, residue αL153 loses 20% of surface accessibility upon binding and therefore might be considered as part of the binding site. The surface accessibility of the third residue, αK31, is not affected by the complex formation, indicating that it does not interact with R2-EC.
The failure to express or fold some of the mutated IFNα2 molecules illustrates the limitation of mutagenesis in assessing the contribution to binding of residues having a role in stabilizing the structure of the protein. Moreover, residues not directly involved in the binding site could show an energetic contribution to the binding energy as a result of a role in stabilizing the binding site structure. Mutational analysis provides no means to differentiate the contribution of a residue to direct interactions with the ligand and contribution to the stabilization of the binding site. On the other hand, a drawback of the cross saturation experiment used in this study is the detection of changes in peak intensities of the amide protons only. Residues that contribute to the binding through side chain interactions will show a smaller effect than residues whose amide protons are directly involved in the binding. The opposite is the case for mutational analysis. Given the different advantages and disadvantages, these two methods are rather complementary to each other.
Docking model of the IFNα2/R2-EC complex
The mapping of the binding sites on IFNα2 and R2-EC and the NMR observation that both IFNα2 and R2-EC do not experience any significant conformational changes upon binding allowed the docking of these two proteins using the program HADDOCK and the structure of the two proteins in their free form. Double mutant cycle restraints (RM46/αR144, RK48/αD35, RH76/αS152, RE77/αR149, RY43/αF27) data were used as additional pairwise restraints in the docking protocol. The fifth DMC restraint, RY43/αF27, which was excluded in the earlier model due to incompatibility with the structure, does not contribute significantly, and the docking models obtained by HADDOCK with and without this restraint are the same, apart from the violations of this distance restraint in the first case. However, RY43 has a low surface accessibility of <20% and RY43 points inward. Therefore, the effect observed in the double mutant cycle could be due to a structural change in R2-EC caused by mutation of RY43 that affects αF27 in IFNα2 and not as a result of direct interactions between the two residues. Hence, this restraint was excluded from the final docking procedure. It is also noteworthy that none of the solutions of the calculations using only NMR or only DMC data is the same as the model using all data.
The main cluster obtained using the NMR data together with the DMC restraints has an RMSD of 1 Å only. A total of 119 structures out of the 200 refined structures belong to this cluster, emphasizing the good convergence of the structures and the well-defined orientation of the two proteins relative to one another. The solutions of the docking using only DMC restraints or only NMR data are not as well defined, and the solution using only NMR data provides two models with a 180° rotation of the ligand relative to the receptor. These results show that to obtain meaningful models it is important to combine data like perturbation of chemical shifts and cross saturation data that define the binding surface with data from NOE and/or double mutant cycle, which provide information about pairwise interactions.
Analysis using WHATIF (Vriend 1990) of the old and new model shows that the quality of the new model is improved compared to the previous model. All Z-scores calculated are better for the new model. The structure calculation using HADDOCK takes into account electrostatic forces and water refinement in the last step. This results in a much better hydrogen bond network. The new model has 46 more hydrogen bonds than the old one. The new model has five salt bridges in the interface versus only two salt bridges in the old model. The Ramachandran plot as well is better for the new model with 9% more residues in the most favored regions. Additionally, the old model had 28 bad contacts, whereas the new model shows none. Overall, the new model of the IFNα2/R2-EC is not only an improvement due to more data available for the docking procedure, but also has a higher quality than the previous model. It is noteworthy that the use of a different docking procedure also has resulted in a difference in the models based only on double mutant cycle data. This is mainly due to the inclusion of electrostatic energy into the energy minimization and water refinement used by HADDOCK.
▶ shows a close-up of the interface between the N domain of R2-EC and IFNα2 of the model obtained using all available data. All the DMC restraints (residues represented by sticks) involve residues located at the upper part of the binding site. The NMR data provides additional data, and its inclusion in the calculation brings the AB loop of the ligand closer to the CD loop of R2-EC. On the other hand, the A helix of IFNα2 is farther away from the receptor, in comparison to the previous model. The C terminus of IFNα2 interacts with parts of the C domain of R2-EC, which was not the case in the earlier model. Consequently, the orientation between the ligand and the receptor, crucial for interferon signaling, is different and the RMSD between the old and new model is 3.8 Å. Compared to the old model, IFNα2 is tilted about 10° in reference to the receptor.
The obtained model shows for the first time involvement of the C domain of the receptor in binding to IFNα2, inferred by loss of surface area upon IFNα binding. RD138, located in the loop between β-strands BC and CC, forms a salt bridge to residue αR162. RE186 also forms a salt bridge with αR162. Residues RE132 and RD138–RS140 located in the loop between β-strands BC and CC, RI158–RG160 in the loop between β strands DC and EC, and RE186–RS188 located in the loop between β strands FC and GC contribute 21% of the binding surface. Since these contributions are mainly from the side chains of these residues, it is possible that they have at most only minor effects on the chemical shift of the backbone amide protons. The chemical shift perturbation experiment showed no change in chemical shifts for the segment R190–R194, but the signal arising from these residues was significantly attenuated. Signal for residues 192–194 were very weak and signals for 190 and 191 were absent from the TROSY HSQC spectrum, thus supporting the involvement of the C domain of R2-EC in binding to IFNα2. Analysis by site-directed mutagenesis did not show any involvement of the C domain of R2-EC in binding to IFNα2. However, a residue involved in an important interaction might not show an effect upon mutation if a nearby side chain or a water molecule might substitute for the missing atoms and thus retain the interaction (DeLano 2002).
Materials and methods
Protein expression and purification
The plasmid PTZ18U containing the gene coding for IFNα2 was transformed into Rosetta competent cells. Unlabeled R2-EC was expressed in Escherichia coli and purified as described previously (Chill et al. 2002). Deuterated 15N-labeled and 13C,15N-labeled IFNα2 were overexpressed using appropriately labeled Celtone medium (Martek Biosciences). To adapt the bacteria to the deuterated environment, they were first grown in 75% D2O until the OD reached 0.4. After a 1:20 dilution with 100% D2O, the cells were grown for 25–26 h and then harvested. Cells were lysed using lysozyme in 50 mM Tris buffer (pH 8) containing 100 mM NaCl and 1 mM EDTA, and insoluble parts were separated by centrifugation. The supernatant was removed and the pellet washed with H2O. The inclusion bodies were then completely dissolved in 9 M urea containing 50 mM glycine (pH 11). The supernatant was then added into a 20-fold volume of 50 mM glycine (pH 10.6) and stirred for 1 h. Afterward, Tris was added up to a final concentration of 20 mM, the pH was adjusted with 0.1 N HCl to pH 9, and the solution was stirred overnight at 4°C. IFNα2 was purified on an AKTA FPLC system using first the HiTrap QS-FF anion exchange and then the Superdex 75 HR 10/30 column (Pharmacia). The protein was concentrated by centrifugation in Vivaspin tubes (Vivasciences, molecular cutoff 10 kDa). This protocol yielded about 40 mg IFNα2 per 1 L labeled Celtone medium.
Preparation of the IFNα2/R2-EC complex
R2-EC (at ≈0.5 μM, in 10% excess) and IFNα2 were incubated for 1–2 h in 25 mM deuterated Tris buffer (pH 8) containing 0.02% NaN3. The complex was then concentrated using Vivaspin tubes (Pharmacia). Formation of the 1:1 complex was verified using a preparative Superdex 75 size exclusion column (Pharmacia). The complex elutes at a volume corresponding to a 44-kDa protein. The final concentration of the complex in all samples was 0.2–0.3 mM in 25 mM deuterated Tris buffer (pH 8) containing 0.02% NaN3. Samples used for backbone assignment and NOE measurements contained 95% H2O/5% D2O. The sample utilized for the cross saturation experiment had a H2O:D2O ratio of 1:9.
NMR measurements
All NMR measurements were conducted at 308 K on Bruker DMX 500 MHz (cryoprobe) and DRX 800 MHz spectrometers equipped with a z-gradient and a x,y,z-gradient triple resonance probe, respectively. Data were processed and analyzed using NMRPipe (Delaglio et al. 1995) and NMRView (Johnson and Blevins 1994).
The 2D [1H,15N] TROSY HSQC experiment was acquired at 800 MHz using 256 t1 increments with a sweep width of 1622 Hz and 1024 t2 points with a sweep width of 10,417 Hz. The TROSY versions of the following triple resonance experiments were utilized for sequential backbone assignment of IFNα2 in the complex with R2-EC (numbers in parentheses indicate the number of real points and sweep width in hertz for each dimension; experiments utilizing magnetization transfer through the carbonyl carbons were measured at 500 MHz, all others at 800 MHz): HNCO (C: 90/1510; N: 44/1014; H: 1024/7001), HNCA (C: 64/4025; N: 60/1621; H: 1024/11,159), HNCACB (C: 68/10,867; N: 60/1621; H: 1024/10,415), HNCB (C: 98/10,458; N: 82/1621; H: 1024/10,415), HNCOCA (C: 50/2512; N: 40/1014; H: 1024/7001), HNCOCACB (C: 44/2515; N: 78/1014; H: 1024/7001), HNCACO (C: 52/2524; N: 44/1014; H: 1024/7001). The 3D 15N TROSY NOESY was measured with a sweep width of 12,820.5 Hz, 160 points in the indirect proton dimension with a sweep width of 1623.4 Hz and 80 points in the 15N dimension with a sweep width of 1623.4 Hz. NOE mixing time was 150 msec.
Cross saturation
The cross saturation experiment was acquired according to Shimada and coworkers (Takahashi et al. 2000) at 800 MHz using the sample of 0.3 mM D,15N-IFNα2/U-R2-EC containing 25 mM Tris buffer (pH 8) in 90% D2O/10% H2O. In this experiment, 200 t1 and 1024 t2 points were acquired for the two interleaved spectra with a sweep width of 1622 Hz and 9615 Hz, respectively. The aliphatic protons of R2-EC were saturated using the WURST-2 decoupling scheme at a saturation frequency of 0.9 ppm. The maximum radiofrequency amplitude was 0.178 kHz (adiabatic factor Q0 = 1). The total measurement time was 3 d with a relaxation delay of 2 sec, saturation time of 1.2 sec, and number of scans 300.
Docking
The docking of the IFNα2/R2-EC complex performed using the software HADDOCK1.3 (Dominguez et al. 2003) combined with CNS was based on the chemical shift perturbation data for R2-EC, the cross saturation data for IFNα2, NOE interactions, and double mutant cycle data. Starting structures for the docking were the previously published structure of R2-EC (PDB entry 1N6U) and IFNα2 (PDB entry 1ITF; Klaus et al. 1997).
Active and passive residues were selected based on the strategy outlined by Dominguez et al. (2003). Active residues of R2-EC were those that underwent chemical shift changes above 0.2 ppm upon binding of IFNα2 and that have high surface accessibility (>40% backbone and/or side chain surface accessibility). Active residues selected for IFNα2 were those with a decrease in the amide proton peak intensity >20% observed in the cross saturation experiment as well as high surface accessibility. Residues with high surface accessibility adjacent to active residues were chosen as passive residues. Solvent accessibility was calculated using the program NACCESS (Hubbard and Thornton 1993). All AIR (ambiguous interaction restraints) (Dominguez et al. 2003) distance restraints were defined with a maximum effective distance of 2 Å. Additional pairwise restraints were defined based on double mutant cycle analysis data (RM46HG* or HE*/αR144HG* or HD*, RK48NZ/αD35OD*, RH76ND1 or NE2/αS152OG, RE77OE*/αR149NH*) (Roisman et al. 2001; Chill et al. 2003). Distances for residues involved in DMCs were restrained to a range of 3 to 7 Å for heavy atoms and a range of 2 to 5 Å for protons. Intermolecular NOES were translated as well to distance restraints between 2 Å and 5 Å. A total of 1000 structures were calculated in the rigid body minimization. Semiflexible simulated annealing followed by refinement in explicit water was performed for the best 200 solutions based on the intermolecular energy. Solutions were clustered using an appropriate distance cutoff.
Structure analysis
The structure of the complex and the IFNα2/R2-EC interface were analyzed with WHATIF (Vriend 1990), PDBSum (Laskowski et al. 2005), and Procheck (Laskowski et al. 1993). All molecular pictures were created with PyMOL (DeLano 2002).
PDB accession number
The coordinates of the structure ensemble have been deposited in the Protein Data Bank under accession code 2HYM.
Acknowledgments
This research is supported by the Minerva foundation with funding from the Federal German Ministry for Education and Research and by NIH grant GM 53329. J.A. is the Joseph and Ruth Owades Professor of Chemistry. S.R.Q.-A. received a Minerva Ph.D. Fellowship.
Footnotes
Reprint requests to: Jacob Anglister, Department of Structural Biology, Weizmann Institute of Science, 76100 Rehovot, Israel; e-mail: jacob.anglister@weizmann.ac.il; fax: 972-8-9344136.
Article published online ahead of print. Article and publication date are at http://www.proteinscience.org/cgi/doi/10.1110/ps.062283006.
References
- Abramovich, C., Shulman, L.M., Ratovitski, E., Harroch, S., Tovey, M., Eid, P., and Revel, M. 1994. Differential tyrosine phosphorylation of the Ifnar chain of the type-I interferon receptor and of an associated surface protein in response to IFN-α and IFN-β. EMBO J. 13 5871–5877. [DOI] [PMC free article] [PubMed] [Google Scholar]
- Bernat, B., Pal, G., Sun, M., and Kossiakoff, A.A. 2003. Determination of the energetics governing the regulatory step in growth hormone-induced receptor homodimerization. Proc. Natl. Acad. Sci. 100 952–957. [DOI] [PMC free article] [PubMed] [Google Scholar]
- Biron, C.A. 2001. Interferons α and β as immune regulators—A new look. Immunity 14 661–664. [DOI] [PubMed] [Google Scholar]
- Chill, J.H., Nivasch, R., Levy, R., Albeck, S., Schreiber, G., and Anglister, J. 2002. The human interferon receptor: NMR-based modeling, mapping of the IFN-α 2 binding site, and observed ligand-induced tightening. Biochemistry 41 3575–3585. [DOI] [PubMed] [Google Scholar]
- Chill, J.H., Quadt, S.R., Levy, R., Schreiber, G., and Anglister, J. 2003. The human type I interferon receptor: NMR structure reveals the molecular basis of ligand binding. Structure 11 791–802. [DOI] [PubMed] [Google Scholar]
- Chuntharapai, A., Gibbs, V., Lu, J., Ow, A., Marsters, S., Ashkenazi, A., De Vos, A., and Jin Kim, K. 1999. Determination of residues involved in ligand binding and signal transmission in the human IFN-α receptor 2. J. Immunol. 163 766–773. [PubMed] [Google Scholar]
- Clore, G.M. and Gronenborn, A.M. 1998. NMR structure determination of proteins and protein complexes larger than 20 kDa. Curr. Opin. Chem. Biol. 2 564–570. [DOI] [PubMed] [Google Scholar]
- Croze, E.R., Harde, D., Wagner, T.C., Pu, H.F., Pfeffer, L.M., and Perez, H.D. 1996. The human type I interferon receptor—Identification of the interferon β-specific receptor-associated phosphoprotein. J. Biol. Chem. 271 33165–33168. [DOI] [PubMed] [Google Scholar]
- Cunningham, B.C., Ultsch, M., De Vos, A.M., Mulkerrin, M.G., Clauser, K.R., and Wells, J.A. 1991. Dimerization of the extracellular domain of the human growth hormone receptor by a single hormone molecule. Science 254 821–825. [DOI] [PubMed] [Google Scholar]
- Delaglio, F., Grzesiek, S., Vuister, G.W., Zhu, G., Pfeifer, J., and Bax, A. 1995. NMRpipe—A multidimensional spectral processing system based on UNIX pipes. J. Biomol. NMR 6 277–293. [DOI] [PubMed] [Google Scholar]
- DeLano, W.L. 2002. Unraveling hot spots in binding interfaces: Progress and challenges. Curr. Opin. Struct. Biol. 12 14–20. [DOI] [PubMed] [Google Scholar]
- Deonarain, R., Chan, D.C., Platanias, L.C., and Fish, E.N. 2002. Interferon–α/β-receptor interactions: A complex story unfolding. Curr. Pharm. Des. 8 2131–2137. [DOI] [PubMed] [Google Scholar]
- Domanski, P., Nadeau, O.W., Platanias, L.C., Fish, E., Kellum, M., Pitha, P., and Colamonici, O.R. 1998. Differential use of the β(L) subunit of the type I interferon (IFN) receptor determines signaling specificity for IFN α2 and IFN β. J. Biol. Chem. 273 3144–3147. [DOI] [PubMed] [Google Scholar]
- Dominguez, C., Boelens, R., and Bonvin, A.M. 2003. HADDOCK: A protein–protein docking approach based on biochemical or biophysical information. J. Am. Chem. Soc. 125 1731–1737. [DOI] [PubMed] [Google Scholar]
- Gent, J., Van Den Eijnden, M., Van Kerkhof, P., and Strous, G.J. 2003. Dimerization and signal transduction of the growth hormone receptor. Mol. Endocrinol. 17 967–975. [DOI] [PubMed] [Google Scholar]
- Gronenborn, A.M. and Clore, G.M. 1994. Identification of N-terminal helix capping boxes by means of 13C chemical-shifts. J. Biomol. NMR 4 455–458. [DOI] [PubMed] [Google Scholar]
- Hubbard, S.J. and Thornton, J.M. 1993. NACCESS. Department of Biochemistry and Molecular Biology, University College London.
- Jaitin, D.A., Roisman, L.C., Jaks, E., Gavutis, M., Pichler, J., Van der Heyden, J., Uze, G., and Schreiber, G. 2006. Inquiring into the differential action of interferons (IFNs): An IFN-α2 mutant with enhanced affinity to IFNAR1 is functionally similar to IFN-β. Mol. Cell. Biol. 26 1888–1897. [DOI] [PMC free article] [PubMed] [Google Scholar]
- Johnson, B.A. and Blevins, R.A. 1994. NMRView—A Computer-program for the visualization and analysis of NMR data. J. Biomol. NMR 4 603–614. [DOI] [PubMed] [Google Scholar]
- Jorgensen, W.L. and Tirado-Rives, J. 1988. The OPLS [optimized potentials for liquid simulations] potential functions for proteins, energy minimizations for crystals of cyclic peptides and crambin. J. Am. Chem. Soc. 110 1657–1666. [DOI] [PubMed] [Google Scholar]
- Karpusas, M., Nolte, M., Benton, C.B., Meier, W., Lipscomb, W.N., and Goelz, S. 1997. The crystal structure of human interferon β at 2.2-Å resolution. Proc. Natl. Acad. Sci. 94 11813–11818. [DOI] [PMC free article] [PubMed] [Google Scholar]
- Kirkwood, J. 2002. Cancer immunotherapy: The interferon-α experience. Semin. Oncol. 29 18–26. [DOI] [PubMed] [Google Scholar]
- Klaus, W., Gsell, B., Labhardt, A.M., Wipf, B., and Senn, H. 1997. The three-dimensional high resolution structure of human interferon α-2a determined by heteronuclear NMR spectroscopy in solution. J. Mol. Biol. 274 661–675. [DOI] [PubMed] [Google Scholar]
- Krause, C.D. and Pestka, S. 2005. Evolution of the Class 2 cytokines and receptors, and discovery of new friends and relatives. Pharmacol. Ther. 106 299–346. [DOI] [PubMed] [Google Scholar]
- Lamken, P., Lata, S., Gavutis, M., and Piehler, J. 2004. Ligand-induced assembling of the type I interferon receptor on supported lipid bilayers. J. Mol. Biol. 341 303–318. [DOI] [PubMed] [Google Scholar]
- Langer, J.A., Cutrone, E.C., and Kotenko, S. 2004. The Class II cytokine receptor (CRF2) family: Overview and patterns of receptor-ligand interactions. Cytokine Growth Factor Rev. 15 33–48. [DOI] [PubMed] [Google Scholar]
- Laskowski, R.A., Macarthur, M.W., Moss, D.S., and Thornton, J.M. 1993. PROCHECK—A program to check the stereochemical quality of protein structures. J. Appl. Crystallogr. 26 283–291. [Google Scholar]
- Laskowski, R.A., Chistyakov, V.V., and Thornton, J.M. 2005. PDBsum more: New summaries and analyses of the known 3D structures of proteins and nucleic acids. Nucleic Acids Res. 33 D266–D268. [DOI] [PMC free article] [PubMed] [Google Scholar]
- Lewerenz, M., Mogensen, K.E., and Uze, G. 1998. Shared receptor components but distinct complexes for α and β interferons. J. Mol. Biol. 282 585–599. [DOI] [PubMed] [Google Scholar]
- Linge, J.P., Williams, M.A., Spronk, C.A., Bonvin, A.M., and Nilges, M. 2003. Refinement of protein structures in explicit solvent. Proteins 50 496–506. [DOI] [PubMed] [Google Scholar]
- Ozbek, S., Grotzinger, J., Krebs, B., Fischer, M., Wollmer, A., Jostock, T., Mullberg, J., and Rose-John, S. 1998. The membrane proximal cytokine receptor domain of the human interleukin-6 receptor is sufficient for ligand binding but not for gp130 association. J. Biol. Chem. 273 21374–21379. [DOI] [PubMed] [Google Scholar]
- Perry, C.M. and Jarvis, B. 2001. Peginterferon-α-2a (40kD)—A review of its use in the management of chronic hepatitis C. Drugs 61 2263–2288. [DOI] [PubMed] [Google Scholar]
- Pestka, S., Langer, J.A., Zoon, K.C., and Samuel, C.E. 1987. Interferons and their actions. Annu. Rev. Biochem. 56 727–777. [DOI] [PubMed] [Google Scholar]
- Pestka, S., Krause, C.D., and Walter, M.R. 2004. Interferons, interferon-like cytokines, and their receptors. Immunol. Rev. 202 8–32. [DOI] [PubMed] [Google Scholar]
- Piehler, J. and Schreiber, G. 1999. Mutational and structural analysis of the binding interface between type I interferons and their receptor Ifnar2. J. Mol. Biol. 294 223–237. [DOI] [PubMed] [Google Scholar]
- Piehler, J., Roisman, L.C., and Schreiber, G. 2000. New structural and functional aspects of the type I interferon-receptor interaction revealed by comprehensive mutational analysis of the binding interface. J. Biol. Chem. 275 40425–40433. [DOI] [PubMed] [Google Scholar]
- Platanias, L.C., Uddin, S., Domanski, P., and Colamonici, O.R. 1996. Differences in interferon α and β signaling—Interferon β selectively induces the interaction of the α and β(L) subunits of the Type I interferon receptor. J. Biol. Chem. 271 23630–23633. [DOI] [PubMed] [Google Scholar]
- Radhakrishnan, R., Walter, L.J., Hruza, A., Reichert, P., Trotta, P.P., Nagabhushan, T.L., and Walter, M.R. 1996. Zinc mediated dimer of human interferon-α(2b) revealed by X-ray crystallography. Structure 4 1453–1463. [DOI] [PubMed] [Google Scholar]
- Remy, I., Wilson, I.A., and Michnick, S.W. 1999. Erythropoietin receptor activation by a ligand-induced conformation change. Science 283 990–993. [DOI] [PubMed] [Google Scholar]
- Roisman, L.C., Piehler, J., Trosset, J.Y., Scheraga, H.A., and Schreiber, G. 2001. Structure of the interferon-receptor complex determined by distance constraints from double-mutant cycles and flexible docking. Proc. Natl. Acad. Sci. 98 13231–13236. [DOI] [PMC free article] [PubMed] [Google Scholar]
- Roisman, L.C., Jaitin, D.A., Baker, D.P., and Schreiber, G. 2005. Mutational analysis of the IFNAR1 binding site on IFNα2 reveals the architecture of a weak ligand-receptor binding-site. J. Mol. Biol. 353 271–281. [DOI] [PubMed] [Google Scholar]
- Runkel, L., Pfeffer, L., Lewerenz, M., Monneron, D., Yang, C.H., Murti, A., Pellegrini, S., Goelz, S., Uze, G., and Mogensen, K. 1998. Differences in activity between α and β type I interferons explored by mutational analysis. J. Biol. Chem. 273 8003–8008. [DOI] [PubMed] [Google Scholar]
- Russell-Harde, D., Wagner, T.C., Perez, H.D., and Croze, E. 1999. Formation of a uniquely stable type I interferon receptor complex by interferon β is dependent upon particular interactions between interferon β and its receptor and independent of tyrosine phosphorylation. Biochem. Biophys. Res. Commun. 255 539–544. [DOI] [PubMed] [Google Scholar]
- Stark, G.R., Kerr, I.M., Williams, B.R., Silverman, R.H., and Schreiber, R.D. 1998. How cells respond to interferons. Annu. Rev. Biochem. 67 227–264. [DOI] [PubMed] [Google Scholar]
- Takahashi, H., Nakanishi, T., Kami, K., Arata, Y., and Shimada, I. 2000. A novel NMR method for determining the interfaces of large protein–protein complexes. Nat. Struct. Biol. 7 220–223. [DOI] [PubMed] [Google Scholar]
- Uze, G., Lutfalla, G., and Mogensen, K.E. 1995. α-Interferon and β-interferon and their receptor and their friends and relations. J. Interferon Cytokine Res. 15 3–26. [DOI] [PubMed] [Google Scholar]
- Venters, R.A., Farmer 2nd, B.T., Fierke, C.A., and Spicer, L.D. 1996. Characterizing the use of perdeuteration in NMR studies of large proteins: 13C, 15N and 1H assignments of human carbonic anhydrase II. J. Mol. Biol. 264 1101–1116. [DOI] [PubMed] [Google Scholar]
- Vriend, G. 1990. WHAT IF: A molecular modeling and drug design program. J. Mol. Graph. 8 52–56 29. [DOI] [PubMed] [Google Scholar]
- Wishart, D.S. and Case, D.A. 2001. Use of chemical shifts in macromolecular structure determination. Methods Enzymol. 338 3–34. [DOI] [PubMed] [Google Scholar]
- Wishart, D.S. and Sykes, B.D. 1994. The 13C chemical-shift index: A simple method for the identification of protein secondary structure using 13C chemical-shift data. J. Biomol. NMR 4 171–180. [DOI] [PubMed] [Google Scholar]
- Wüthrich, K. 1986. NMR of proteins and nucleic acids. J. Wiley & Sons, New York.
- Zuiderweg, E.R. 2002. Mapping protein–protein interactions in solution by NMR spectroscopy. Biochemistry 41 1–7. [DOI] [PubMed] [Google Scholar]


