Abstract
Dynein light chain protein, a part of the cytoplasmic motor assembly, is a homodimer at physiological pH and dissociates below pH 4.5 to a monomer. The dimer binds to a variety of cargo, whereas the monomer does not bind any of the target proteins. We report here the pH induced stepwise structural and motional changes in the protein, as derived from line broadening and 15N transverse relaxation measurements. At pH 7 and below until 5, partial protonation and consequent interconversion between molecules carrying protonated and neutral histidines, causes conformational dynamics in the dimeric protein and this increases with decreasing pH. Enhanced dynamics in turn leads to partial loosening of the structure. This would have implications for different efficacies of binding by target proteins due to small variations in pH in different parts of the cell, and hence for cargo trafficking from one part to another. Below pH 5, enhanced charge repulsions, partial loss of hydrophobic interactions, and destabilization of H-bonds across the dimer interface cause further loosening of the dimeric structure, leading eventually to the dissociation of the dimer.
Keywords: dynein light chain protein, 15N transverse relaxation, conformational exchange, line broadening, pH driven conformational transitions, nuclear magnetic resonance, dimer–monomer equilibrium
Dynein light chain (DLC8), a 10.3-kDa protein (89 residues) is the smallest subunit of the microtubule-associated cytoplasmic dynein motor assembly (King and Patel-King 1995; King et al. 1998; Harrison and King 2000; King 2000; Koonce and Samso 2004; Pfister 2005). DLC8 is known to interact with several proteins of diverse biological functions and presumably plays a primary role as a cargo adaptor in the transport of several organelles (Jaffrey and Snyder 1996; Fan et al. 1998; Liang et al. 1999; Puthalakath et al. 1999, 2001; Espindola et al. 2000; Naisbitt et al. 2000; Schnorrer et al. 2000; Fuhrmann et al. 2002; Day et al. 2004; Vadlamudi et al. 2004; Lo et al. 2005; Yang et al. 2005). DLC8 is highly conserved throughout the evolution and its structure has been determined both by X-ray crystallography (Liang et al. 1999) and by NMR (Fan et al. 2001); the two structures are essentially identical. At the physiological pH of 7.0 the protein exists as a homodimer, whereas below pH 4.5 it has been reported to exist as a monomer (Barbar et al. 2001). The structure of the monomer has also been determined to high resolution (Wang et al. 2003; Makokha et al. 2004). The NMR structures of the dimer and the monomer are shown in Figure 1. In the dimer, the β-strands form the core while the helices are on the surface. The protruding β3 strand of one monomer pairs in an antiparallel fashion with the β2′ strand of the other monomer. A number of contacts at the interface between the two monomers stabilize the dimeric structure. These include side-chain H-bonds: Gln 61–Arg 60′, Tyr 65–Lys 44′, Thr 67–Lys 43′ and hydrophobic interactions: Ile 57/57′;, Phe 62/62′, Ser 64/64′, Val 66/66′ and His 55/55′ (Liang et al. 1999). Further, it is evident from Figure 1 that the structure of the free monomer is identical to that of the monomer in the dimer except for small differences. The α and β secondary structural elements in the dimer are: α1: 15–31, α2: 35–50, β1: 6–11, β2: 54–59, β3: 62–67, β4: 72–78, and β5: 81–87. The corresponding secondary elements in the monomer are, α1: 15–29, α2: 35–48, β1: 8–11, β2: 55–58, β4: 72–78, and β5: 81–87. Thus the differences between the two structures are: (1) the β3 strand in the dimer loses its secondary structure on dissociation to the monomer, and (2) the helices α1 and α2 and the strands β1 and β2 get shortened by two residues (Makokha et al. 2004).
Figure 1.
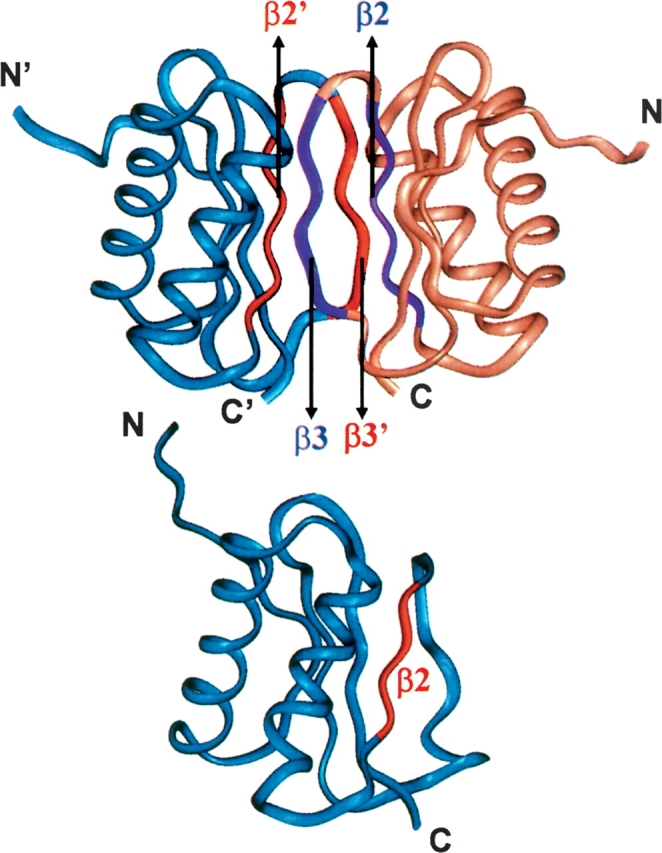
Structures of DLC8 dimer (PDB Id: 1f3c) and monomer (PDB Id: 1rhw). The β-sheets at the dimer interface are highlighted using red and violet colors. Primed and unprimed symbols are used to distinguish the monomeric units. DLC8 image was produced using Insight II.
DLC8 is known to be functional only as a dimer at physiological pH, in the sense that only the dimer binds the cargo. The binding site of the cargo is known to be the β3 strand and the loop between β3 and β4 facilitates the binding (Fan et al. 2001; Lo et al. 2001). However, the diversity in the structures of the target proteins bound by the dimer demands conformational adaptability of the protein to achieve the necessary specificities. In the same vein, the dimer to monomer transition would have a crucial role to play in cargo trafficking. Variations in pH, as they occur in different parts of the cell, can alter the target binding efficacy of the dimer by small structural and motional changes or by shifting the dimer–monomer equilibrium. The fine details of these changes are not fully understood. It has been suggested on the basis of mutational studies that at low pH, His 55 gets protonated in the side chain, and since the two histidines (His 55/55′) from the two monomers are only 5.7 A °apart, this results in charge–charge repulsion causing dissociation of the dimer into the monomers (Barbar et al. 2001; Barbar and Hare 2004). However, the detailed mechanism in terms of the stepwise changes leading to dimer dissociation is not yet known. In this background, our NMR relaxation and line broadening measurements reported here have enabled dissection of the stepwise changes with pH in the structure and dynamics in the protein, and this in turn has enabled elucidation of the dimer dissociation mechanism at a much finer residue level detail. It appears that dynamics changes induced by decreasing pH cause slow loosening of the dimer well before its eventual complete dissociation below pH 3.5. Further, the changes are seen to occur at the sites which are involved in cargo binding. This would have direct implications for different efficacies of target protein binding in different parts of the cell, where there can be small differences in the pH values. Thus the pH changes can provide an on/off switch for cargo trafficking inside the cell. Overall, the present results, while providing a residue-level detail mechanism for dimer to monomer transition in the DLC8 protein, also demonstrate how protein dynamics can mediate structural changes due to external perturbations, and thus contribute to protein function.
Results and Discussion
Resonance assignments
The pH dependent HSQC spectra of the protein at 27°C, are included in the Supplementary Material. Consistent with the previous reports (Fan et al. 2001; Barbar and Hare 2004; Makokha et al. 2004), the spectra indicate that the protein condition remains the same at pH 7.0, 6.0, and 5.0 (i.e., as a dimer) and likewise at pH 3.5 and 3.0, the protein remains as a pure monomer. Sequence-specific resonance assignments were obtained at pH 7 and pH 3 following standard procedures based on triple resonance experiments (Ferentz and Wagner 2000; Panchal et al. 2001). Assignments at pH 6 and pH 5 were derived from simple transfer from those at pH 7, and likewise assignments at pH 3.5 were derived from those at pH 3. All these concur with the previously reported assignments (Fan et al. 2001; Barbar and Hare 2004; Makokha et al. 2004).
pH driven conformational dynamics
In small folded proteins, 15N transverse relaxation rates (R2) serve as useful monitors for local conformational transitions occurring on the milli-to-micro second time scale. Whenever present at particular residue sites, conformational exchange results in conspicuously enhanced R2 values for those residues. Conformational exchange occurring on a millisecond time scale results in significant line broadening effects which can be directly seen in the NMR spectra. We have applied these considerations here to derive valuable insights into residue level detail of the pH induced stepwise structural and dynamics changes in the DLC8 protein, which in turn have enabled elucidation of the mechanism of the dimer-to-monomer transition in finer detail.
Figure 2 shows residue-wise 15N transverse relaxation rates (R2) measured at 27°C, in DLC8 at five pH values: 7.0, 6.0, 5.0, 3.5, and 3.0. The data reveals some distinct patterns in the relaxation rates. A notable feature at pH 7.0 is the appearance of very large R2 values for the residues Thr 67, Arg 71, His 72, and Ile 74, belonging to the loop between β3 and β4, and partly to β3 and β4. We wish to mention here that we do not have data for Glu 69 and Thr 70 due to overlap of their peaks with those of Ser 2 and Asp 3, respectively, in the HSQC spectra. These large R2 values are suggestive of high conformational transitions in this segment of the molecule. In fact, Fan et al. (2002) measured high Rex values (2–10 sec−1) for the region, aa 65–75 in the dimer at pH 7. Examination of the amino acid sequence reveals that there are two histidines (His 68, His 72) in this region. His side chain pK value is ~6.0 in free amino acid and has been found to lie typically in the range 5.0–8.0 in different proteins (Fasman 1989); this depends on the local environment around the His residue in the protein. In the present case, His 68 and His 72, which are exposed to the solvent, may be expected to have a pK of 6.0 and His 55, which is buried in a hydrophobic pocket, would have a lower pK value. Indeed, recent measurements by Barbar and coworkers (Nyarko et al. 2005) have found the values to be: 4.5 for His 55, and 6.0 for His 68 and His 72 (this paper appeared as the present paper was being revised). Using these, the population of charged histidine at any given pH can be calculated by the equation pK = pH − log A/AH+, where A and AH+ refer to the normalized populations of the neutral and charged species. Thus there will be a small population (~10%) of charged His side chains even at neutral pH, for His 68 and His 72. For His 55, the population of the charged species will be negligible. Under such conditions, there will be interconversion between protein molecules having charged and neutral His at 68 and 72 locations, and this would account for the high R2 values seen in that loop area.
Figure 2.
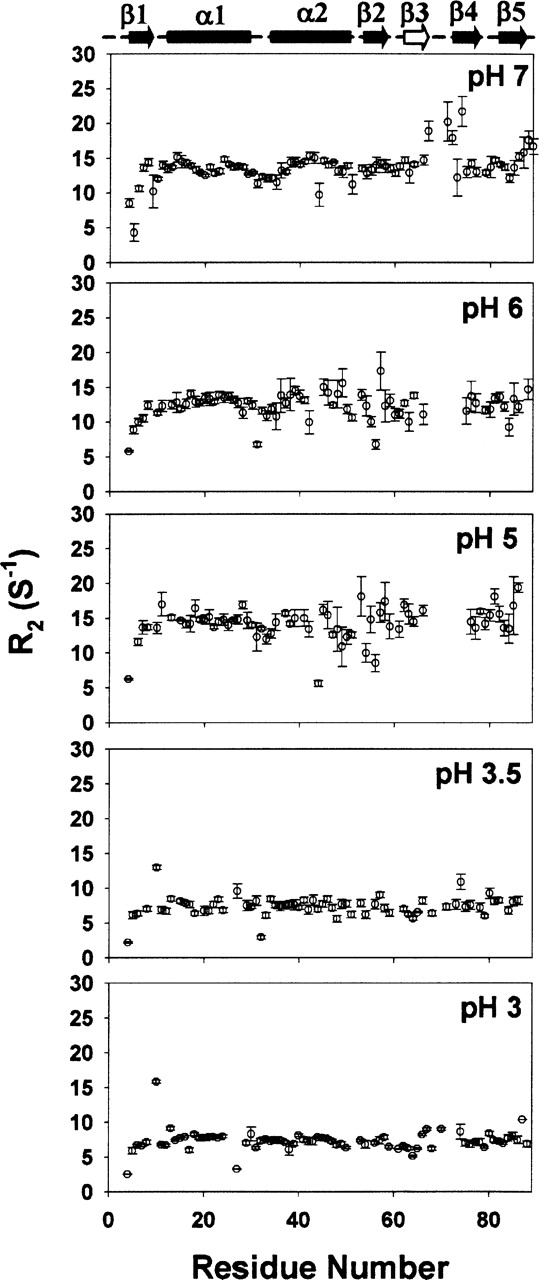
15N transverse relaxation rates (R2) in DLC8 measured at various pH values, 27°C. The secondary structural elements in the protein are marked above with cylinders (for helices) and arrows (for sheets). β3, which is present in the dimer only, is marked as an open arrow.
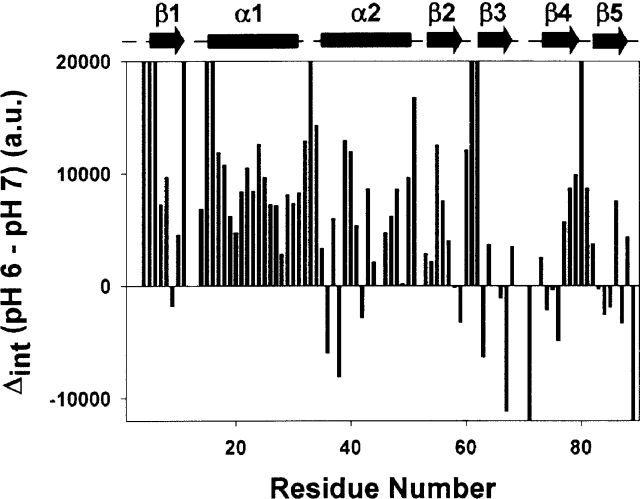
As the pH is reduced to 6.0, the population of charged His 68 and His 72 rises to 50% (for His 55, the population of charged species will be ~3%) resulting in greater conformational dynamics in the loop. As a consequence, several neighboring residues also acquire higher conformational flexibilities (micro- to millisecond time scale), manifesting in a scatter in the R2’s, and causing a slow loosening of the structure in that vicinity. The signals due to the residues Thr 67, Arg 71, His 72, Ile 74 become much weaker in the HSQC spectra. This is a consequence of line broadening due to slow time-scale motions which are due to conformational transitions. Such an effect was conspicuously seen for some other peaks as well and therefore we quantitated these line broadening effects for all the residues across the chain, by comparing the intensity changes due to decrease in pH. This is shown in Figure 3. For most residues, decreasing the pH causes an increase in the intensity, which is the normal thing to happen since the proton occupancy at the nitrogen increases at lower pH. However, for the residues, Lys 9, Lys 36, Lys 38, Ile 42, Gly 59, Gly 63, Val 66, Thr 67, Arg 71, Ile 74, Tyr 75, Phe 76, Ile 83, Leu 84, Leu 85, Lys 87, and Gly 89 there is a decrease in the intensity on going from pH 7 to 6; in fact for Arg 71 and Gly 89 the peaks vanish at pH 6. Clearly, this indicates an extension of the conformational dynamics outward from the loop between β3, β4 to other regions (β3, β4, β5, beginning of the α2 helix, and end of β2) of the protein. Some residues in the N-terminal and at the C-terminal also acquire enhanced conformational dynamics.
Figure 3.
Intensity differences in the HSQC spectra at pH 7 and 6 for the various residues plotted against the sequence. The secondary structural elements in the protein are marked above with cylinders (for helices) and arrows (for sheets).
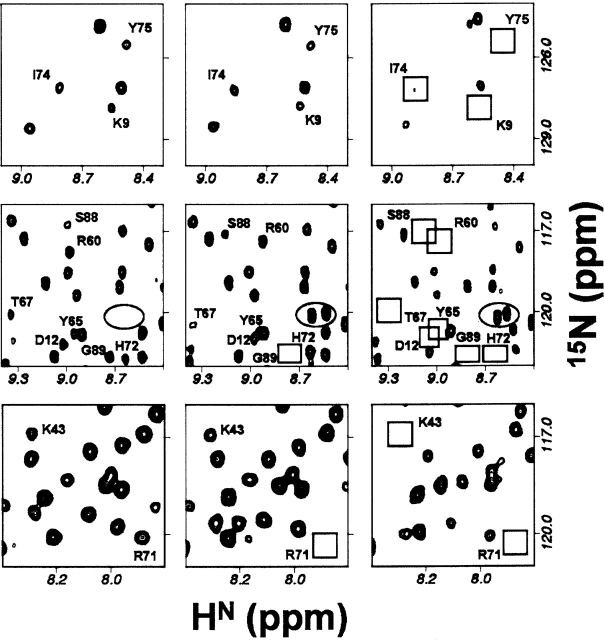
On further reduction of pH to 5.0, the population of the charged histidines increases further: ~90% for His 68 and His 72, and ~25% for His 55. The residues in the C-terminal β-sheet start to show a scatter in the R2 values indicating further extension of conformational dynamics. Besides, some more peaks vanish due to slow time-scale conformational transitions. All such visible spectral changes that occur in going from pH 7 to pH 5 are shown in Figure 4. The peaks which disappear at pH 5 include Lys 9, Asp 12, Ala 40, Lys 43, Arg 60, Tyr 65, Thr 67, His 68, His 72, Phe 73, Ile 74, Tyr 75, Lys 87, and Ser 88. These consolidate the conclusions at the end of the previous paragraph. Further, the conformational fluctuations seen at Arg 60, Tyr 65, Thr 67, and Lys 43 would contribute to destabilization of the H-bonds: Gln 61–Arg 60′, Tyr 65–Lys 44′, Thr 67–Lys 43′; between the two monomer units across the dimer interface (Fig. 5A). Similarly, this conformational dynamics would also lead to a partial loss of the hydrophobic interactions, Val 66/66′ and His 55/55′ (Fig. 5A).
Figure 4.
Blow-ups of selected regions of the HSQC spectra at pH 7, 6, and 5 showing the progressive broadening of some peaks (marked) with decreasing pH. Empty squares show the expected positions of the peaks that have broadened out. The peaks enclosed in the ellipse belong to the N-terminal, which were not seen at pH 7.
Figure 5.
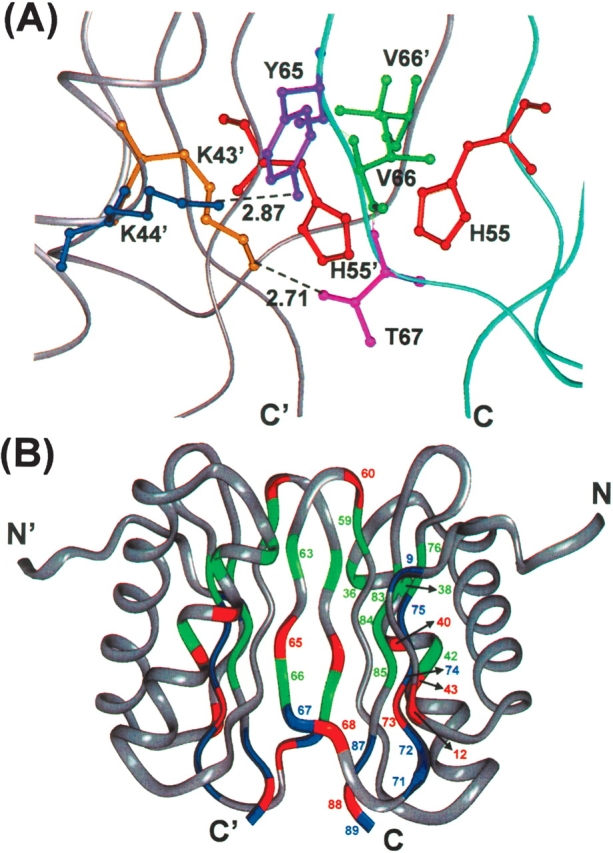
(A) Zooming in on a particular region of the dimer interface in the crystal structure (PDB Id: 1cmi), to show the side-chain interactions. The H-bonds are indicated by dotted lines. The two monomer backbones are shown in separate colors. (B) Residues exhibiting conformational exchange are shown on the native structure (PDB Id: 1f3c) of the dimer in a color-coded manner to indicate the hierarchy of line broadening. Blue identifies those residues whose peaks progressively decrease in intensity in going from pH 7 to 5 and actually vanish at pH 5. Green identifies those residues whose peaks also decrease in intensity from pH 7 to 5 but are visible in all the spectra. Red identifies those residues whose peaks do not lose intensity from pH 7 to 6, but disappear completely at pH 5. Numbers for all the colored residues are indicated on one of the monomers only for better clarity.
The locations of the various residues that undergo progressive broadening signifying enhanced conformational dynamics on a millisecond time scale with a decrease in pH from 7 to 5, as discussed above are shown on the native structure of the dimer in a color-coded manner in Figure 5B. Blue identifies those residues whose peaks progressively decrease in intensity in going from pH 7 to 5 and actually vanish at pH 5. Green identifies those residues whose peaks also decrease in intensity from pH 7 to 5 but are visible in all the spectra. Red identifies those residues whose peaks do not lose intensity from pH 7 to 6, but disappear completely at pH 5. Thus these colors represent in some sense a hierarchy of conformational transitions with pH change and indicate progressive loosening of the dimeric structure: blue followed by green followed by red. As can be seen, these residues essentially surround the dimer interface. Loosening of the structure at one location induces the residues in the vicinity to become dynamic and they in turn induce further loosening and so on. Explicitly, loosening of the dimeric structure gets initiated at the dimer interface in the loop between β3, β4 and end of β5, then travels through β3, β4, β5, helix α2, and end of β2.
The above observations can be described more quantitatively by considering the different populations and the interactions of the charged histidines in the ensembles at the different pH values. His 68 and His 72 get charges (10% at pH 7.0, 50% at pH 6.0, and 90% at pH 5.0) before His 55 (0% at pH 7.0, 3% at pH 6.0, and 25% at pH 5.0), as the pH decreases below 7.0. There will be two types of consequences. First, there will be greater conformational exchanges between members of the ensemble carrying protonated and unprotonated histidines; the two species would have locally different conformations. Second, in species where there are more than one histidines protonated, there will be pairwise inter-monomer charge–charge repulsions, His 55–His 55′; (distance ~5.7 A °) as demonstrated earlier on the basis of effect of H55K point mutation (Barbar et al. 2001; Barbar and Hare 2004), His 55/55′–His 68′/68 (distance ~9 A °), and also intra-monomer pairwise repulsions, His 55′/55–His 68′/68 (distance ~10.7 Å), His 55′/55–His 72′/72 (distance ~11.3 A °), and His 68′/68– His 72′/72 (distance ~12.2 Å). Both these effects significantly destabilize the dimeric structure and contribute to the enhanced conformational dynamics. Going by the hierarchy of protonation of the histidines with decreasing pH, it is evident that His 68 and His 72 are the initiators of conformational dynamics in the protein and these residues lie in the loop between β3, β4. Thus it is no surprise that the protein dynamics and loosening of the structure travels outward from β3, β4 to other elements in the protein structure as the pH is lowered. It is also evident that until pH 5 the contribution of His 55–His 55′ repulsion to loosening of the dimeric structure would be relatively smaller, despite the fact that this distance is the shortest. This is because the repulsion energy is directly proportional to the product of the charges and inversely proportional to the distance. For example, the repulsion energy between His 55 and His 68′ will be proportional to 0.25 × 0.90/9.0 (arbitrary units), while that between His 55 and His 55′ will be proportional to 0.25 × 0.25/5.7 (arbitrary units). However, protonation of His 55 is energetically more unfavored, as this residue lies in a hydrophobic pocket (Fig. 5A) in the dimer, and this would also contribute to the destabilization at pH 5.
The above observations have important functional implications for the DLC8 protein. While the conformational dynamics seen in the dimer would facilitate the adaptability of the protein to achieve better binding with diverse cargo, alteration in the dynamics due to small pH changes would alter the binding efficacies. Since there can be small variations in the pH values in different portions of the cell, the resultant binding variations would generate an on/off switch for cargo binding, an essential requirement for trafficking inside the cell. In this context it is relevant to note that the structural and dynamic changes for small pH alterations occur at the dimer interface and more prominently at the β3 and β4 strands, which is the site for cargo binding on DLC8.
When the pH is reduced further below 3.5, His 55 protonation increases to nearly 90%–100%, causing enhanced repulsions. Moreover, accommodation of charged His 55 in the hydrophobic pocket will also be highly unfavorable in the dimer. As a consequence, the dimer becomes energetically unstable and dissociates into monomers. This is evident from the transverse relaxation data in Figure 2; the average R2 values have reduced nearly to half of those in the dimer (pH 5–7). Further, the residue-wise relaxation rates are seen to be rather uniform, suggesting that a stable monomer structure has been formed. However, Asn 10 shows a significantly higher than average value. This residue is at the end of the β1 strand and its enhanced conformational dynamics would implicate reduced stability at this site. At the intermediate pH values between 5 and 3.5, the HSQC spectra indicate coexistence of the dimeric and the monomeric species (data not shown).
Mechanism of pH driven dimer–monomer transition
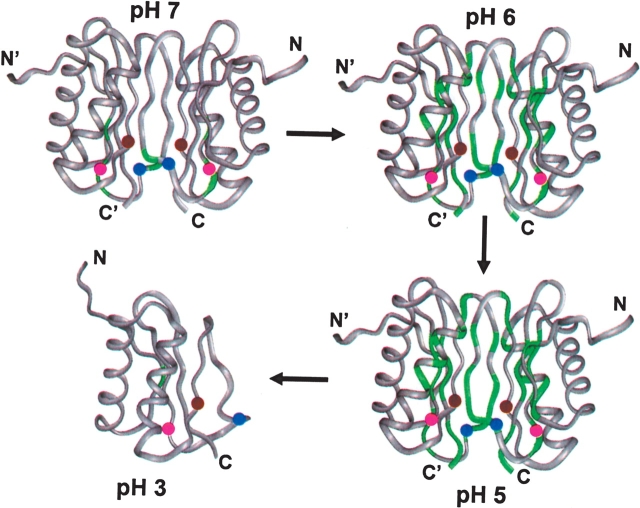
In the light of the above results from transverse relaxation data and line broadening effects, we propose a step by step mechanism for pH induced dimer to monomer transition as depicted in Figure 6. Progressive increase in the conformational transitions with decreasing pH is shown by green color in the different segments of the protein structure. At physiological pH, the loop between β3 and β4 has high conformational flexibility in the milli- to micro-second time scale (large R2 values), which can be attributed to partial protonation of His 68 and His 72 (the positions of the three histidines in each monomer are indicated by colored balls in the figure). At pH 6 this flexibility increases and a few more residues belonging to the β3, β4 β5, beginning of the α2 helix, and end of β2 acquire flexibility. An increase in the population of the protonated His at positions 68 and 72 would cause strand repulsions between β3–β3′, β4–β4′, and β3/β3′–β4/β4′. At pH 5.0, even larger segments belonging to β4/β4′, β5/β5′ β2/β2′ and α2/α2′ acquire enhanced conformational flexibility. Greater population of charged His 55 (which belongs to β2 strand) results in enhanced repulsions between the strands: β2 –β3′, β2′–β3, β2–β2′ and β2/β2′–β4/β4′. All these result in loosening of the other H-bond interactions and hydrophobic interactions at the dimer interface. Finally at pH 3.0, the population of the protonated histidines increases so much that dimer formation becomes energetically unfavorable.
Figure 6.
Schematic showing the mechanism of dimer to monomer transition of DLC8 induced by pH change. The segments marked with green color identify the regions of conformational exchange. The locations of the histidines (three in each monomer) are indicated by colored balls: His 55/55′ is brown, His 68/68′ is blue and His 72/72′ is pink.
Conclusions
This study on pH induced structural and dynamics changes in DLC8 has elucidated two important mechanistic aspects related to stability and function of the protein. First, it has delineated the fine details of the conformational dynamics introduced in different portions of the dimeric protein due to small deviations in the pH from the physiological value. The origin of these has been attributed to partial protonation of the histidine residues located at the dimer interface. The molecules carrying charged and neutral histidines would have locally different conformations and an interconversion between such molecules in the ensemble causes dynamism in the protein. Since the dimer interface also happens to be the binding site for the cargo, such dynamism alters the binding efficacies with change in pH, which in turn would facilitate cargo binding and release in different portions of the cell. In other words, small pH variations in the cell can indeed serve as on/off switches for cargo trafficking inside the cell. Of course when the pH changes are large, the cargo trafficking would be dictated by a shift in the dimer–monomer equilibrium. Second, we have been able to elucidate the mechanism of pH driven dimer-to-monomer transition at residue level detail. The dimeric structure is seen to be slowly loosened as the pH is decreased, and this happens in a hierarchical manner. Explicitly, the dynamics gets initiated at the dimer interface in the loop between β3, β4, and end of β5, then travels through β3, β4, β5, helix α2 and the end portion of β2. These are mediated by repulsions in molecules carrying more than one charged histidine, and consequent partial loss of hydrophobic interactions and destabilization of several H-bonds between side chains across the dimer interface. When the pH is below 4, the repulsions become so strong and the hydrophobic pocket around His 55 becomes so energetically unstable that the dimer dissociates into monomers. Below pH 3.5 the protein is a well folded monomer.
Materials and methods
Overexpression and protein purification
The gene encoding Drosophila DLC8 was subcloned into the bacterial expression vector pET14b (Novagen) cut with Nde1 and BamH1 containing an N-terminal polyhistidine tag with an inbuilt Thrombin cleavage site. The clone was confirmed by multiple restriction digests and DNA sequencing and then transformed into Escherichia coli BL21(DE3) cells. The recombinant BL21(DE3) cells for DLC8 were inoculated in M9 minimal medium containing 15NH4Cl and 13C-glucose containing ampicillin (100 μg/mL) from an overnight culture and grown at 37°C to an OD600 of 0.6–0.8. Expression of His tag protein was induced with a final concentration of 600 μM of isopropyl-β-D-thiogalactopyranoside (IPTG), and the culture was incubated at 37°C for another 6 h. The cells were harvested by centrifugation at 5500 rpm for 30 min. The harvested culture was lysed in TIN buffer (20 mM Tris, 10 mM Imidazole, 200 mM NaCl at pH 8) containing Triton X-100, lysozyme, leupeptin, pepstatin, and phenylmethylsulphonylfluoride (PMSF). The lysed cells were sonicated and spun at 35,000 rpm for 45 min to obtain a clear supernatant. The supernatant was incubated with Nickel beads (Amersham) for 90 min at 4°C to allow binding of the overexpressed His-DLC8 recombinant protein. The beads were washed with TIN buffer with increasing concentrations of imidazole (10 mM, 50 mM, 80 mM) to remove the nonspecific binding of other proteins. Finally the protein was eluted using TIN buffer containing 250 mM imidazole. The fractions of protein were dialyzed against 20 mM Tris buffer (pH 8.0), containing 200 mM NaCl and 2 mM dithiothreitol (DTT). His tag was cleaved by incubating the protein with thromin (Sigma-Aldrich) for 12 h at room temperature. His tag impurities were removed by exchanging the protein with TND buffer (20 mM Tris, 200 mM NaCl, 2 mM DTT at pH 8) in an ultra-filtration cell (Amicon) using 3-kDa cutoff Membrane (Millipore). The purity of the sample was checked using SDS-PAGE.
NMR spectroscopy
For NMR studies the protein purified as described above was concentrated to 1.5 mM in an ultrafiltration cell using a 1-kDa cutoff Membrane (Difco). Phosphate buffer (20 mM phosphate, 200 mM NaCl, 2 mM DTT) and acetate buffer (20 mM acetate, 200 mM NaCl, 2 mM DTT) were used for the experiments recorded in the pH ranges 7.0–5.5 and 5.0–3.0, respectively. The final volume in all the samples was ~550 μL containing 10% D2O.
All the NMR experiments were recorded using a triple channel Varian Unity-plus 600 MHz NMR spectrometer equipped with pulse-shaping and pulse-field gradient capabilities. For all the experiments 1H and 15N carrier frequencies were set at 4.71 ppm and 119 ppm. The transverse relaxation rates were measured using the pulse sequences described by Farrow et al. (1994). 15N transverse relaxation rates (R2) were measured using CPMG delays, 10, 30, 50, 70, 90, 110, 130, 150, 190, 230 msec and duplicated at 50, 110 msec. Relaxation experiments and 1H-15N HSQC are recorded at pH 7, 6, 5, 3.5, and 3. All the data were processed using FELIX on a Silicon Graphic, Inc. work station. Prior to Fourier transformation and zero-filling, data was apodized with a sine-squared weighting function shifted by 60° in both dimensions. After zero filling and Fourier transformation the final matrix 4096, 1024 points along F2, F1 for all the experiments. R2 values were extracted by fitting the peak intensities to the equation I(t) = B exp (−R2 t).
Acknowledgments
We thank the Government of India for providing financial support to the National Facility for High Field NMR at the Tata Institute of Fundamental Research. We thank Dr. Anindya Ghosh-Roy for the clone of DLC8.
Abbreviations
NMR, nuclear magnetic resonance
HSQC, hetero-nuclear single quantum coherence
DLC8, dynein light chain protein
Article published online ahead of print. Article and publication date are at http://www.proteinscience.org/cgi/doi/10.1110/ps.051854906.
Supplemental material: see www.proteinscience.org
References
- Barbar, E. and Hare, M. 2004. Characterization of the cargo attachment complex of cytoplasmic dynein using NMR and mass spectrometry. Meth. Enzymol. 380: 219–241. [DOI] [PubMed] [Google Scholar]
- Barbar, E., Kleinman, B., Imhoff, D., Li, M., Hays, T.S., and Hare, M. 2001. Dimerization and folding of LC8, a highly conserved light chain of cytoplasmic dynein. Biochemistry 40: 1596–1605. [DOI] [PubMed] [Google Scholar]
- Day, C.L., Puthalakath, H., Skea, G., Strasser, A., Barsukov, I., Lian, L.Y., Huang, D.C., and Hinds, M.G. 2004. Localization of dynein light chains 1 and 2 and their proapoptotic ligands. Biochem. J. 377: 597–605. [DOI] [PMC free article] [PubMed] [Google Scholar]
- Espindola, F.S., Suter, D.M., Partata, L.B., Cao, T., Wolenski, J.S., Cheney, R.E., King, S.M., and Mooseker, M.S. 2000. The light chain composition of chicken brain myosin-Va: Calmodulin, myosin-II essential light chains, and 8-kDa dynein light chain/PIN. Cell Motil. Cytoskeleton 47: 269–281. [DOI] [PubMed] [Google Scholar]
- Fan, J.S., Zhang, Q., Li, M., Tochio, H., Yamazaki, T., Shimizu, M., and Zhang, M. 1998. Protein inhibitor of neuronal nitric-oxide synthase, PIN, binds to a 17-amino acid residue fragment of the enzyme. J. Biol. Chem. 273: 33472–33481. [DOI] [PubMed] [Google Scholar]
- Fan, J., Zhang, Q., Tochio, H., Li, M., and Zhang, M. 2001. Structural basis of diverse sequence-dependent target recognition by the 8 kDa dynein light chain. J. Mol. Biol. 306: 97–108. [DOI] [PubMed] [Google Scholar]
- Fan, J.S., Zhang, Q., Tochio, H., and Zhang, M. 2002. Backbone dynamics of the 8 kDa dynein light chain dimer reveals molecular basis of the protein’s functional diversity. J. Biomol. NMR 23: 103–114. [DOI] [PubMed] [Google Scholar]
- Farrow, N.A., Muhandiram, R., Singer, A.U., Pascal, S.M., Kay, C.M., Gish, G., Shoelson, S.E., Pawson, T., Forman-Kay, J.D., and Kay, L.E. 1994. Backbone dynamics of a free and phosphopeptide-complexed Src homology 2 domain studied by 15N NMR relaxation. Biochemistry 33: 5984–6003. [DOI] [PubMed] [Google Scholar]
- Fasman, G.D. 1989. Practical handbook of biochemistry and molecular biology. CRC Press, Boca Raton, Florida.
- Ferentz, A.E. and Wagner, G. 2000. NMR spectroscopy: A multifaceted approach to macromolecular structure. Q. Rev. Biophys. 33: 29–65. [DOI] [PubMed] [Google Scholar]
- Fuhrmann, J.C., Kins, S., Rostaing, P., El Far, O., Kirsch, J., Sheng, M., Triller, A., Betz, H., and Kneussel, M. 2002. Gephyrin interacts with Dynein light chains 1 and 2, components of motor protein complexes. J. Neurosci. 22: 5393–5402. [DOI] [PMC free article] [PubMed] [Google Scholar]
- Harrison, A. and King, S.M. 2000. The molecular anatomy of dynein. Essays Biochem. 35: 75–87. [DOI] [PubMed] [Google Scholar]
- Jaffrey, S.R. and Snyder, S.H. 1996. PIN: An associated protein inhibitor of neuronal nitric oxide synthase. Science 274: 774–777. [DOI] [PubMed] [Google Scholar]
- King, S.M. 2000. The dynein microtubule motor. Biochim. Biophys. Acta 1496: 60–75. [DOI] [PubMed] [Google Scholar]
- King, S.M. and Patel-King, R.S. 1995. The M(r) = 8,000 and 11,000 outer arm dynein light chains from Chlamydomonas flagella have cytoplasmic homologues. J. Biol. Chem. 270: 11445–11452. [DOI] [PubMed] [Google Scholar]
- King, S.M., Barbarese, E., Dillman III, J.F., Benashski, S.E., Do, K.T., Patel-King, R.S., and Pfister, K.K. 1998. Cytoplasmic dynein contains a family of differentially expressed light chains. Biochemistry 37: 15033–15041. [DOI] [PubMed] [Google Scholar]
- Koonce, M.P. and Samso, M. 2004. Of rings and levers: The dynein motor comes of age. Trends Cell Biol. 14: 612–619. [DOI] [PubMed] [Google Scholar]
- Liang, J., Jaffrey, S.R., Guo, W., Snyder, S.H., and Clardy, J. 1999. Structure of the PIN/LC8 dimer with a bound peptide. Nat. Struct. Biol. 6: 735–740. [DOI] [PubMed] [Google Scholar]
- Lo, K.W., Naisbitt, S., Fan, J.S., Sheng, M., and Zhang, M. 2001. The 8-kDa dynein light chain binds to its targets via a conserved (K/R)XTQT motif. J. Biol. Chem. 276: 14059–14066. [DOI] [PubMed] [Google Scholar]
- Lo, K.W., Kan, H.M., Chan, L.N., Xu, W.G., Wang, K.P., Wu, Z., Sheng, M., and Zhang, M. 2005. The 8-kDa dynein light chain binds to p53-binding protein 1 and mediates DNA damage-induced p53 nuclear accumulation. J. Biol. Chem. 280: 8172–8179. [DOI] [PubMed] [Google Scholar]
- Makokha, M., Huang, Y.J., Montelione, G., Edison, A.S., and Barbar, E. 2004. The solution structure of the pH-induced monomer of dynein light-chain LC8 from Drosophila. Protein Sci. 13: 727–734. [DOI] [PMC free article] [PubMed] [Google Scholar]
- Naisbitt, S., Valtschanoff, J., Allison, D.W., Sala, C., Kim, E., Craig, A.M., Weinberg, R.J., and Sheng, M. 2000. Interaction of the post-synaptic density-95/guanylate kinase domain-associated protein complex with a light chain of myosin-V and dynein. J. Neurosci. 20: 4524–4534. [DOI] [PMC free article] [PubMed] [Google Scholar]
- Nyarko, A., Cochrun, L., Norwood, S., Pursifull, N., Voth, A., and Barbar, E. 2005. Ionization of His 55 at the dimer interface of dynein light-chain LC8 is coupled to dimer dissociation. Biochemistry 44: 14248–14255. [DOI] [PubMed] [Google Scholar]
- Panchal, S.C., Bhavesh, N.S., and Hosur, R.V. 2001. Improved 3D triple resonance experiments, HNN and HN(C)N, for HN and 15N sequential correlations in (13C, 15N) labeled proteins: Application to unfolded proteins. J. Biomol. NMR 20: 135–147. [DOI] [PubMed] [Google Scholar]
- Pfister, K.K. 2005. Dynein cargo gets its groove back. Structure (Camb.) 13: 172–173. [DOI] [PubMed] [Google Scholar]
- Puthalakath, H., Huang, D.C., O’Reilly, L.A., King, S.M., and Strasser, A. 1999. The proapoptotic activity of the Bcl-2 family member Bim is regulated by interaction with the dynein motor complex. Mol. Cell 3: 287–296. [DOI] [PubMed] [Google Scholar]
- Puthalakath, H., Villunger, A., O’Reilly, L.A., Beaumont, J.G., Coultas, L., Cheney, R.E., Huang, D.C., and Strasser, A. 2001. Bmf: A proapoptotic BH3-only protein regulated by interaction with the myosin V actin motor complex, activated by anoikis. Science 293: 1829–1832. [DOI] [PubMed] [Google Scholar]
- Schnorrer, F., Bohmann, K., and Nusslein-Volhard, C. 2000. The molecular motor dynein is involved in targeting swallow and bicoid RNA to the anterior pole of Drosophila oocytes. Nat. Cell Biol. 2: 185–190. [DOI] [PubMed] [Google Scholar]
- Vadlamudi, R.K., Bagheri-Yarmand, R., Yang, Z., Balasenthil, S., Nguyen, D., Sahin, A.A., den Hollander, P., and Kumar, R. 2004. Dynein light chain 1, a p21-activated kinase 1-interacting substrate, promotes cancerous phenotypes. Cancer Cell 5: 575–585. [DOI] [PubMed] [Google Scholar]
- Wang, W., Lo, K.W., Kan, H.M., Fan, J.S., and Zhang, M. 2003. Structure of the monomeric 8-kDa dynein light chain and mechanism of the domain-swapped dimer assembly. J. Biol. Chem. 278: 41491–41499. [DOI] [PubMed] [Google Scholar]
- Yang, Z., Vadlamudi, R.K., and Kumar, R. 2005. Dynein light chain 1 phosphorylation controls macropinocytosis. J. Biol. Chem. 280: 654–659. [DOI] [PubMed] [Google Scholar]


