

Abstract
HXMS (hydrogen/deuterium exchange mass spectrometry) of the glucocorticoid receptor ligand-binding domain (GR LBD) complexed with the agonist dexamethasone and the antagonist RU-486 is described. Variations in the rates of exchange were observed in regions consistent with the published crystal structures of GR LBD complexed with RU-486 when compared with the GR dexamethasone complex. We also report the HXMS results for agonist-bound GR LBD with the coactivator transcriptional intermediary factor 2 (TIF2) and anatagonist-bound GR LBD with nuclear receptor corepressor (NCoR). Alterations in exchange rates observed for agonist-bound GR LBD with TIF2 present were consistent with the published crystal structural contacts for the complex. Alterations in exchange rates observed for antagonist-bound GR LBD with NCoR were a subset of those observed with TIF2 binding, suggesting a common or overlapping binding site for coactivator and corepressor.
Keywords: glucocorticoid receptor, H/D exchange, mass spectrometry
The glucocorticoid receptor (GR) is a member of the nuclear receptor family; its members include the mineralcorticoid (MR), progesterone (PR), estrogen (ER), and androgen (AR) receptors (Robinson-Rechavi et al. 2001). The glucocorticoid receptor has been shown to regulate glucose homeostasis, lipid metabolism, and inflammation (Reichardt et al. 2000), making it a therapeutically important drug target. Marketed steroids such as dexamethasone and prednisolone are effective at suppressing inflammation but also show negative side effects, including diabetes, hyperglycemia, and osteoporosis (Schacke et al. 2002). Pharmaceutical research continues to seek high affinity glucocorticoid receptor ligands that have potent anti-inflammatory activity with reduced side effects. Much work has been done to identify novel inhibitors that show such dissociative behavior (Coghlan et al. 2003; Schacke et al. 2004).
GR is a transcription factor that is activated upon ligand binding. Upon glucocorticoid binding, the GR receptor translocates from the cytoplasm into the nucleus, where it serves either directly or indirectly as a transcriptional regulator. Transrepression of genes is understood to be responsible for the positive anti-inflammatory effects, while transactivation of genes is held to be the primary mechanism responsible for the negative side effects of glucocorticoids (Adcock 2000). Transactivation occurs via the binding of GR, as a homodimer, to a glucocorticoid response element (GRE), inducing transcription of genes such as TAT (tyrosine aminotransferase) (Jantzen et al. 1987). Transrepression occurs via multiple mechanisms. Direct transrepression occurs with binding of activated GR to a negative GRE (nGRE), inhibiting transcription. Activated GR can also bind as a monomer to proinflammatory transcription factors such as NF-κB leading to indirect transrepression (De Bosscher et al. 2000). This indirect mechanism, also called cross-talk, is thought to be the primary route by which glucocorticoids exert their anti-inflammatory effects. The GR protein is composed of three domains: an N-terminal transactivation domain, a DNA-binding domain (DBD), and a ligand-binding domain (LBD). The structures of GR LBD complexed with the agonist dexamethasone (Bledsoe et al. 2002; Kauppi et al. 2003) and the antagonist RU-486 (Kauppi et al. 2003) have been determined by X-ray crystallography. Distinct structural differences are seen in the crystal structures of these very different ligands complexed with GR LBD. The GR LBD is unstable in the apo form and not amenable to structural investigations. Dexamethasone is a GR agonist; its binding induces a conformation wherein the position of helix 12 enables interaction with coactivator proteins such as steroid receptor coactivator 1 (SRC1) and transcriptional intermediary factor 2 (TIF2). Coactivators contain multiple LXXLL motifs, which adopt an a-helical conformation, and interact with residues from helix 12 (Darimont et al. 1998). Dexamethasone binding also has been implicated in regulating the interaction of the DBD with NF-κB(Garside et al. 2004). RU-486 is a GR antagonist; its binding induces a conformation wherein helix 12 adopts a position that covers the coactivator pocket, preventing coactivator binding. RU-486 binding to GR has also been shown to recruit the binding of corepressors such as NCoR (Schulz et al. 2002). The corepressor NCoR contains three interaction domains, characterized by the consensus sequence (I/L)XX(I/V)I (Nagy et al. 1999). Although no crystal structure data exist, mutagenesis studies have suggested that coactivators and corepressors share a common or overlapping binding site (Nagy et al. 1999).
Hydrogen/deuterium exchange mass spectrometry (HXMS) is a useful method for probing protein structure (Zhang and Smith 1993; Zhang et al. 1996; Resing and Ahn 1998; Engen et al. 1999; Resing et al. 1999; Wang et al. 1999; Davidson et al. 2004). The technique measures the solvent accessibility of regions of the protein by monitoring the extent of deuterium exchange of backbone amide hydrogens. Although lacking high resolution, HXMS has advantages over other methods for analyzing protein structure, such as X-ray crystal diffraction and high-resolution NMR. Very little unlabeled protein is required (typically 500 pmol for a set of experiments), a high degree of purity is not required, and there are no upper molecular mass limits. Altered rates of exchange, for the regions monitored by HXMS, result from direct protection due to binding of a ligand, a cofactor, or multimerization. Conformational changes in the protein that alter solvent exposure (“intramolecular protection”) and formation or destruction of secondary, supersecondary, or tertiary structure also alter exchange rates. Protein unfolding, stability, aggregation, and protein–protein interactions have been successfully studied with this technique. The HXMS technique exposes the intact protein or protein complex to D2O for various lengths of time. The exchange is then quenched by lowering pH and temperature. The analysis is performed by rapid peptic digestion and fast, low temperature liquid chromatography/mass spectrometry (LC/MS). Resolution is limited by the length of peptides produced in the digestion. The mass of each monitored peptide changes as a function of the amount of exchange that occurred in that region of the intact protein. An HXMS study of the ligand-regulated transcription factor retinoid x receptor described structural changes induced due to binding of 9-cis-retinoic acid (Yan et al. 2004). HXMS has been used less frequently to study small molecule binding to proteins (Davidson et al. 2004). This technique has the ability to determine binding site location, at low resolution, as well as probing secondary structural effects induced upon compound binding. By analyzing different classes of ligands and comparing HXMS results to biological data (i.e., agonism/antagonism), information can be gained about structure/function effects.
In this work, we employ on-exchange HXMS to study GR LBD complexed with two ligands and two cofactors. GR LBD with the agonist dexamethasone bound is compared to GR LBD with the antagonist RU-486 (mifepristone) bound. By monitoring the increase in mass of each region over time of exchange, differences in conformation of the two GR LBD ligand complexes were detected and mapped onto the published crystal structures of GR LBD. GR LBD was also analyzed in complex with the cofactor peptides TIF2 and NCoR to determine their binding site and to identify conformational changes induced by their binding.
Results
HXMS methodology
The HXMS behavior of GR LBD complexed with various ligands and cofactors was determined at several time points of exchange. In our experience, peptides from four to 24 amino acids in length are generated from pepsin cleavage. A total of 50 peptides, covering 25 different regions of the GR LBD protein were identified and monitored. This represents 95% sequence coverage.
Coverage maps
Figure 1A summarizes the HXMS results for GR LBD complexed with dexamethasone. The extent of exchange for 25 selected peptides, out of the total of 50 peptides analyzed, at each of five time points, is mapped onto the amino acid sequence of GR LBD. Many regions are covered by multiple peptides (i.e., region 753–777 is covered by four peptides: 753–777, 754–777, 755–777, and 756–777), and this information is not captured in this figure. (See the Supplemental Material for individual peptide results.) Figure 1B summarizes the HXMS results, in a similar fashion, for the GR LBD/RU-486 complex. These figures give an overall summary of the experimental results. They also serve as the control data for further observations based on the alteration of exchange rates.
Figure 1.
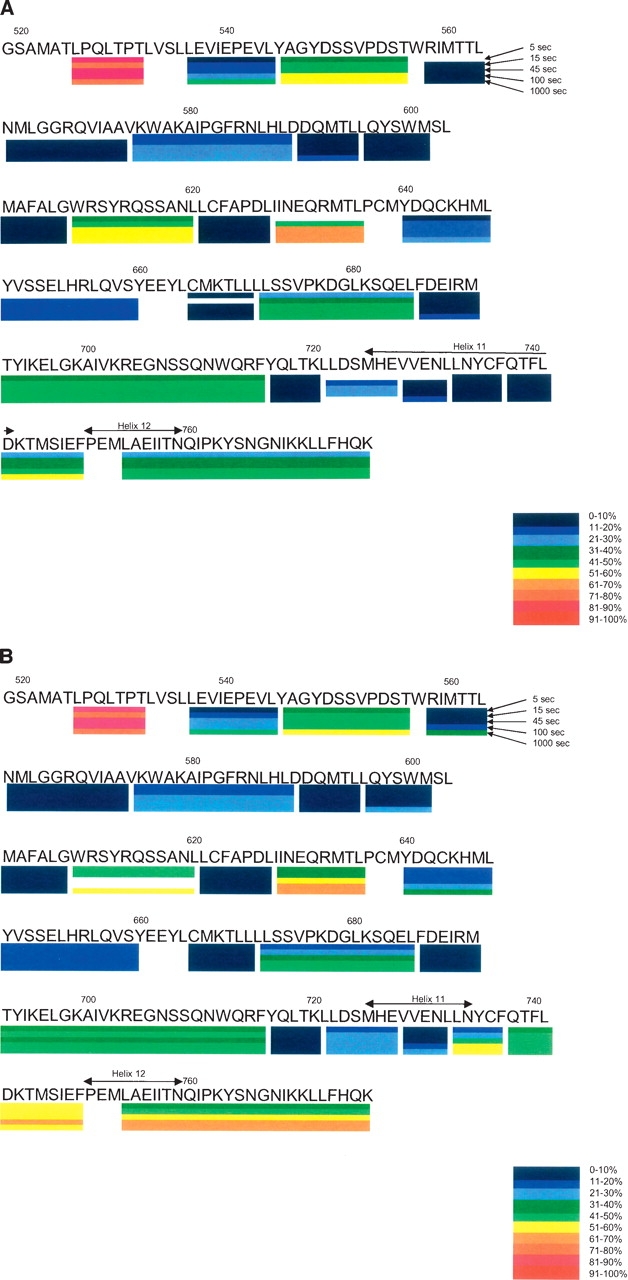
(A) Amino acid sequence of GR LBD with dexamethasone bound indicating a subset of the peptides studied by HXMS. The five time points of exchange are indicated as well as the amount of deuterium incorporated into each peptide. (B) Amino acid sequence of GR LBD with RU-486 bound indicating a subset of the peptides studied by HXMS. The five time points of exchange are indicated as well as the amount of deuterium incorporated into each peptide.
GR LBD antagonist structural effects
GR LBD with dexamethasone was used as a comparison for experiments to determine the structural effects induced by RU-486 binding, as the apo form of GR LBD is insoluble and not amenable to analysis. Figure 2 shows the published structures for GR LBD/dexamethasone and GR LBD/RU-486 (Bledsoe et al. 2002; Kauppi et al. 2003). Regions of altered exchange rates are mapped onto the GR LBD/RU-486 crystal structure. The most extensive change seen upon RU-486 binding is in the C-terminal portion of helix 11 (amino acids 733–741). This region shows greatly increased exchange (decreased protection) with RU-486 present, compared with dexamethasone. This result correlates well with the loss of helix 11 in this region seen in the GR LBD/RU-486 crystal structure. In this structure, helix 11 is preterminated at N734, while helix 11 continues to D742 in the GR LBD/dexamethasone structure. The loss of helical structure with RU-486 bound leads to decreased solvent protection and increased deuterium exchange. Decreased protection was also observed in region 742–777, which includes the loop between helices 11 and 12, helix 12, and the C terminus. Again, this correlates well with the orientation of helix 12 seen in the antagonist (RU-486) crystal structure. In this structure, helix 12 is not in the traditional agonist position, packed against helices 3, 4, and 10 (Bledsoe et al. 2002). Rather, helix 12 is located over the ligand-binding pocket, preventing coactivator binding and enabling corepressor binding. This orientation of helix 12 would be expected to have increased deuterium exchange due to increased solvent accessibility in the antagonist orientation. Another region of decreased protection is seen in 726–734. This includes the segment of helix 11 preceding the above-mentioned helical loss, suggesting that this region loses structure or changes orientation when RU-486 is bound. Regions 558–563 and 640–647 also exhibited decreased protection upon RU-486 binding. These regions include helix 3 and helix 7, respectively, both comprising part of the ligand-binding pocket. In particular, helix 7 includes Q642, which forms a hydrogen bond with the 17β-hydroxyl group of the RU-486 molecule. The peptides containing the other hydrogen bonds between RU-486 and GR LBD, Q570 and R611, show no significant alteration in exchange. Helix 7 also contains a residue that forms different hydrogen bonds with helix 11 in the two structures. D641 forms hydrogen bond interactions with Y735 in the RU-486 structure, while Q642 forms a hydrogen bond with Y735 in the dexamethasone structure.
Figure 2.
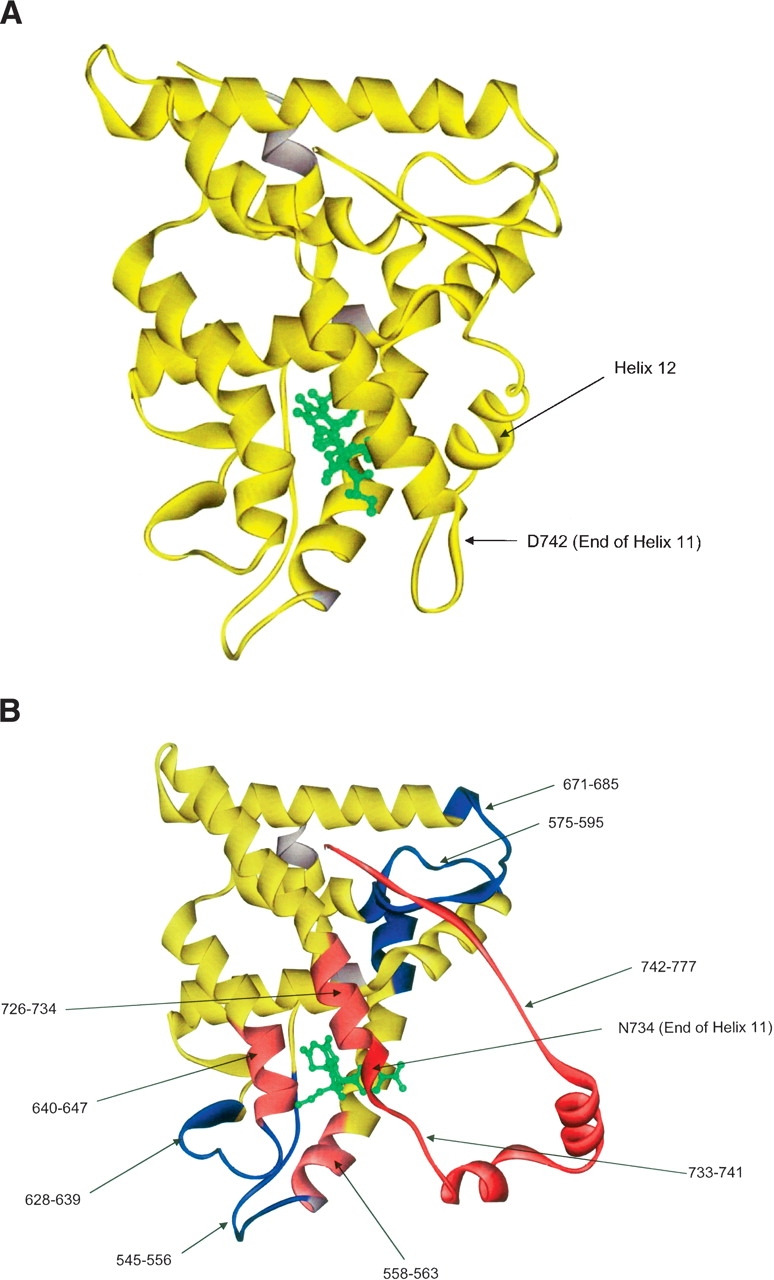
(A) The crystal structure of GR LBD with dexamethasone bound. This serves as a control for Figures 2B and 3A. (B) The crystal structure of GR LBD with RU-486 bound. Regions colored in blue show decreased exchange (increased protection) relative to GR LBD with dexamethasone bound. Regions colored in light red show a moderate increase in exchange (decreased protection), while regions colored in dark red show a strong increase in exchange (decreased protection). This experiment also serves as a control for Figure 3B.
Regions of decreased exchange/increased protection were also seen in the RU-486 bound structure. These include 628–639, a region between helices 5 and 7 composed of β strands 3 and 4. This area is proximal to residues shown by Bledsoe et al. (2002) to contain the central hydrophobic interface of GR LBD, with residues P625 and I628 interacting reciprocally to form a dimer in the dexamethasone bound structure. Regions 575–595 and 671–685 also exhibited increased protection with RU-486 as compared with dexamethasone. Region 575–595 contains three of the charge clamps that form between GR LBD and the coactivator TIF2 and comprises helices 3 and 4, which are part of the hydrophobic groove in which TIF2 binds. Peptide 671–685 corresponds to a β strand between helices 8 and 9. Bledsoe et al. (2002) indicate that this region interacts with the β strand following helix 12 in the dexamethasone bound structure, stabilizing helix 12 in the active conformation. The decreased protection seen in this region of the antagonist-bound GR LBD may be due to this decreased interaction with helix 12.
GR LBD agonist with coactivator
Figure 3A shows the alterations in exchange rates for GR LBD/dexamethasone produced by binding of the coactivator TIF2 peptide (KENALLRYLLDKDD). Regions of increased protection (decreased exchange) include 575–595, 671–685, and 753–777. Region 575–595 contains three of the four charge clamps that form between GR LBD and TIF2 (Bledsoe et al. 2002). This region comprises helices 3 and 4, which are part of the hydrophobic groove in which TIF2 binds. Region 753–777 contains the other charge clamp that forms between GR LBD and TIF2 and comprises helix 12, which is also part of the hydrophobic groove in which TIF2 binds. These data are consistent with the location of the coactivator binding site determined by crystallography. Region 671–685 also shows increased protection. This result was not predicted by our observation of the crystal structure. This area corresponds to a β strand between helices 8 and 9, which forms interactions with the β strand following helix 12 in the agonist-bound species.
Figure 3.
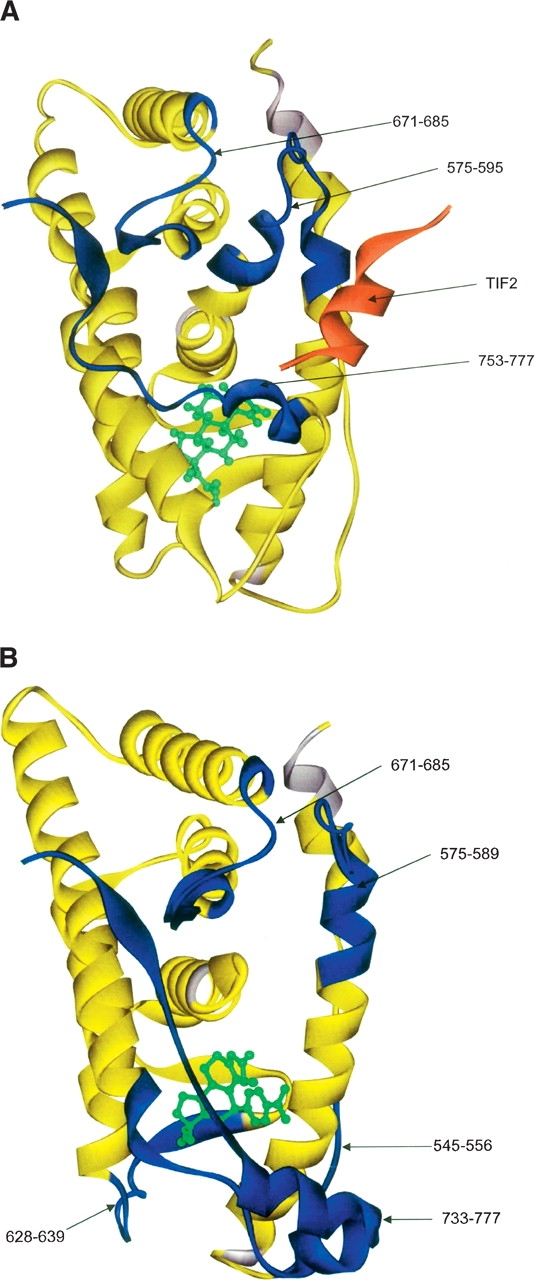
(A) This figure shows the alteration of exchange rates produced by TIF2 binding to GR LBD/dexamethasone mapped onto the crystal structure of GR LBD/dexamethasone. Regions colored in blue show decreased exchange (increased protection) upon TIF2 binding. (B) This figure shows the alteration of exchange rates produced by NCoR binding to GR LBD/RU-486 mapped onto the crystal structure of GR LBD/RU-486. Regions colored in blue show decreased exchange (increased protection) upon NCoR binding.
The decreased exchange in this region upon TIF2 binding suggests increased interaction with the β strand following helix 12, further stabilizing the protein in the “agonist-bound” orientation.
GR LBD antagonist and corepressor
Figure 3B shows the HXMS results for GR LBD with RU-486 and the corepressor NCoR peptide (ASNLGLE DIIRKALMGSFD) bound. As no structure for this complex has been published, alterations in exchange rates represent novel information. Regions of increased protection include 575–589 and 671–685. The exchange rates of these regions are also altered by TIF2 binding. This is consistent with coactivator and corepressor sharing a similar binding site, although the location of helix 12 in the antagonist-bound species suggests that this interaction is lacking with corepressor. Specifically, peptide 575–589 is a subset of the region altered upon coactivator binding. In contrast to coactivator binding, region 590–595 was unchanged upon corepressor binding. Also, peptide 628–639 showed increased protection with corepressor bound. Region 753–777 also showed increased protection with corepressor bound. The exchange behavior of this region seen with antagonist-bound GR LBD with corepressor is approaching that of agonist-bound GR LBD. That is, RU-486 binding causes an increase in exchange in this region, while corepressor binding causes the exchange to decrease. This could indicate that this region adopts a more “agonist-bound” conformation upon corepressor binding. This could also be a consequence of the region gaining structure or having increased interactions with other regions of the protein upon corepressor binding.
Discussion
The structural changes induced by RU-486 binding to GR LBD were monitored by HXMS by using GR LBD with dexamethasone bound as the control and identifying regions where hydrogen/deuterium exchange is altered. The effects detected correlated very well with crystal structure data, as well as identifying additional altered regions. As predicted from the crystal structure, antagonist binding leads to increased exchange in helices 11 and 12. RU-486 binding has been shown to induce a structural change in this region, leading to the loss of helical structure in the C-terminal portion of helix 11 and movement of helix 12 to a more solvent-accessible orientation. Other regions, including parts of helix 3 and helix 7, also exhibit increased exchange upon antagonist binding. These helices comprise part of the ligand-binding pocket, with helix 7 also interacting with helix 11 differently in the agonist- and antagonist-bound species. Other parts of the ligand-binding pocket showed no perturbation in exchange.
Areas of decreased exchange seen in the antagonist-bound species include the region of helix 3 shown by Bledsoe et al. (2002) to be involved in coactivator binding. This suggests that the structure of the ligand bound to GR LBD influences the structure of the cofactor binding site, leading to recruitment of either coactivator or corepressor. Also, the β strand between helices 8 and 9 exhibited decreased exchange in the antagonist-bound form of GR LBD. This region was shown by Bledsoe et al. (2002) to interact with the β strand following helix 12 in the agonist-bound species, stabilizing the helix in the active conformation. Although helix 12 is positioned away from the protein in the antagonist-bound structure, the β strand following helix 12 is in a similar position. This suggests that this β strand following helix 12 is forming additional interactions with the β strand between helices 8 and 9 in the antagonist-bound structure. This also correlates well with the structure of the ligand bound to GR LBD influencing the structure of the cofactor binding site.
The coactivator TIF2 containing the third LXXLL motif was also found to alter the H/D exchange behavior of specific regions of agonist-bound GR LBD, consistent with the crystal data obtained by Bledsoe et al. (2002). Specifically, the region of helices 3 and 4 which contains three of the four charge clamps (R585, D590, and K597) that form between TIF2 and GR LBD exhibited decreased exchange. The region containing the fourth charge clamp (E755) from helix 12 also exhibited decreased exchange with TIF2 present. Both of these regions form the hydrophobic groove in which TIF2 binds and would be predicted to exhibit increased protection upon coactivator binding. A third, unpredicted region of protection was also observed. This region comprises the previously mentioned β strand between helices 8 and 9 and is spatially near the coactivator binding site. As no crystal structural data exist for dexamethasone bound GR LBD in the absence of TIF2 peptide, this result suggests that a conformational change in this region of the protein occurs upon coactivator binding. This area of the protein may be interacting with the adjacent region of the TIF2 binding site or exhibiting increased interaction with helix 12 in the TIF2 bound species, further stabilizing the protein in the agonist-bound orientation.
The corepressor NCoR was also found to alter the H/D exchange behavior of specific regions of antagonist-bound GR LBD. This information is novel, as no crystal structural data exist for this complex. NCoR binding was found to decrease exchange in a subset of the abovementioned region of coactivator binding, suggesting a common or overlapping binding site for coactivator and corepressor. Specifically, the region of helix 3 which contains one of the four charge clamps (R585) that form between coactivator and GR LBD exhibited decreased exchange, while the region of helix 4 which contains two of the four charge clamps (D590 and K597) exhibited no change in exchange. In addition, exchange was decreased in the β strand between helices 8 and 9 as well as in the region comprising helix 12 and the C terminus. Although helix 12 is in an “antagonist-bound” orientation without corepressor present, these results suggest that corepressor binding induces helix 12 to adopt a more “agonist-bound” orientation.
The utility of HXMS for probing compound-induced structural changes in GR LBD has been shown. The results from our HXMS experiments with agonist and antagonist-bound GR LBD correlate well with structural differences seen in the crystal structures of these complexes. Also, coactivator binding was shown to exhibit a pattern of protection consistent with the binding site location defined by the crystallography. Corepressor and coactivator binding exhibited patterns of protection, which are consistent with common or overlapping binding sites.
Materials and Methods
Expression and purification of GR LBD
The GST-tagged GR LBD (F602S) was expressed in and isolated from the soluble fraction of the BL21(DE3) strain of Escherichia coli as described (R.R. Kroe et al., in prep.). Biomass for purification was produced on a 15-L scale using an MBR Fermentor (New MPR) and yielded ∼100 g of wet weight pellet per growth. The E. coli biomass was lysed using sonication and the protein was isolated using a two-step purification process that included an affinity column eluted by protease cleavage of the GST tag and an ion exchange column. A standard yield was ∼50 mg of GR LBD from a 15-L fermentation. The pooled product was dialyzed into 5 L of buffer (20 mM Hepes at pH 7.4, 200 mM NaCl, 10% glycerol, 0.04% Chaps, 1 mM DTT and 10 μM dexamethasone) for 4 h. The final product was aliquoted, snap-frozen in liquid nitrogen, and stored at −80°C.
Dialysis of RU-486 and SEC-MS monitoring
GR LBD was concentrated prior to being used to exchange dexamethasone with RU-486. The buffer used to hydrate the concentrators (Vivaspin 20 mL concentrator, Membrane 10,000 MWCO PES, product no. VS2002) contained 20 mM HEPES (pH 7.4), 200 mM NaCl, 10% glycerol, 1 mM DTT, and 10 μM dexamethasone (Sigma, catalog no. D1756). The GR LBD was concentrated using a Jovan CR412 centrifuge, and the concentrations were determined by either the Bio-Rad microplate assay or A280. For the Bio-Rad microplate assay, the reagents are contained in the 500–0112 Bio-Rad DC Protein Assay Kit II. The microplates used for the assay are Costar 3595 (Corning Inc.96-well cell culture cluster flat bottom nonpyrogenic polystyrene clear sterile). For the A280 assay, a Perkin Elmer Lambda 40 UV/VIS or Ultraspec 3100 Pro UV was used.
The buffer for the dialysis was 20 mM Hepes, 150 mM NaCl, and 1 mM TCEP. The pH was adjusted to 7.4 using 5 M NaOH and a Corning 430 pH meter. A 10-mg/mL compound stock of RU-486 was made with DMSO. From this stock 10 or 20 μM compound was added to the dialysis buffer. The concentrated GR LBD was diluted to 10 μM in dialysis buffer and was charged into a Slide-A-Lyzer 10K Dialysis Cassette (Pierce 10,000 MWCO). The sample was dialyzed overnight in a cold room, with the buffer being changed once with fresh buffer containing compound, and dialyzed overnight again.
Before the dialyzed sample was put in the concentrator, the concentrator was hydrated with dialysis buffer containing 0.04% Chaps. The sample was removed from the Slide-A-Lyzer, and a small portion was retained for SEC-MS. Chaps (0.04%) was added to the remaining sample to prevent sticking to the concentrator membrane. The sample was concentrated using a Jovan CR412 centrifuge. The concentrations of the pre- and post-concentrated samples were determined using the Bio-Rad assay or A280.
Online size exclusion chromatography/liquid chromatography-mass spectrometry was used to confirm that RU-486 was bound to GR LBD and that no dexamethasone remained in the samples. The instrumentation used is a modification of the apparatus described previously (Blom et al. 1999). A short SEC column is used to separate the GR LBD/small molecule complex from unbound small molecule. The complex is collected on a protein trap and desalted. A water/acetonitrile/formic acid gradient is then used to dissociate the complex and separate the components on a short RP column. The column eluate is analyzed by the mass spectrometer for the presence of the small molecule. The small molecule is only detected if it was originally bound to GR LBD. A third automated valve was added to the apparatus to permit the SEC column to be bypassed without manual replumbing. Bypassing the SEC column allows all small molecule components present in the sample, whether bound or unbound, to reach the mass spectrometer and be detected. This also permits the injection of small molecule standards without protein present. The responses for the standards are used to quantify the small molecule(s) present in the sample whether bound or unbound.
Deuterium exchange experiments—Identification of peptides
Peptides generated from GR LBD by peptic digestion were identified. Pepsin cleavage is reproducible but difficult to predict. The protein was digested with pepsin, on ice, for 5 min at 0°C. The resulting peptides were subjected to μHPLC/FTMS analysis. Mobile phase A was 99/1/0.1 (H2O/acetonitrile/formic acid), and Mobile Phase B was 5/95/0.1 (H2O/acetonitrile/ formic acid). Flow rate was 5 μL/min, with a 10 μL-injection onto a 150 × 0.3-mm PepMap C18 column (LC Packings). The gradient program was from 0% B to 100% B at 38 min, hold to 54 min. FTMS spectra (Bruker Apex II) were acquired from m/z 400–1800. Seven 1.5-sec spectra were accumulated for each stored spectrum with a 256K length, 50,000 resolution. External calibration was performed by in-source fragmentation of angiotensin I. A second run was made under identical conditions with the exception of increasing the capillary exit voltage of the interface from 80 V to 155 V to produce fragment ions from the eluting peptides and alteration of the m/z range to 200–1800. Data were converted to MassLynx (Micromass/Waters) format for analysis. All spectra were averaged into a single spectrum. This was subjected to analysis by MassLynx MaxENT3 to produce a list of monoisotopic molecular weights for each deconvoluted component. This list was searched versus the protein sequence to determine possible peptides without any constraints on the cleavage sites. Use of a 5-ppm error window produced unambiguous results for most peptides. For ambiguous results the spectrum was extracted from the high capillary exit voltage run. The fragment ions present in the spectrum were used to resolve the ambiguity by comparison to theoretical fragmentation patterns generated by the Mass-Lynx software. Fifty peptides were identified, and sequence coverage was 95%.
Hydrogen/deuterium exchange experiments—Deuterium exchange
Protein was diluted 1:10 into deuterated 5 mM NaH2PO4 buffer at pH 7.0 and allowed to exchange for varying lengths of time (5, 15, 45, 100, and 1000 sec) at room temperature. Exchange was quenched by lowering the pH and the temperature (adding an equal volume of ice-cold NaH2PO4 at pH 2.5). The protein was then digested with pepsin (1:1 for 5 min on ice) and injected onto a trap column (Michrom C18) and then a 0.8 × 150-mm C18 (PepMap C18, LC Packings) column for separation by μHPLC. The flow rate was 30 μL/min with the injector, sample loop, column, and transfer lines placed in an ice bath.
Hydrogen/deuterium exchange experiments—Mass spectrometry
A Bruker Apex II FTMS with ESI was employed for on-line monitoring of the chromatographic effluent. A 1.1-sec hexapole accumulation was performed before ion injection, excitation, and detection (m/z 350–2000). Two 256K spectra were averaged for each stored spectrum; 128 averaged spectra were acquired per run. Resolution was 40,000 FWHM. An external calibration with in- source fragment ions of porcine rennin substrate was performed. The trapping and the excitation values were optimized to reduce variation of mass assignment with ion population. The hexapole accumulation has the effect of integrating the ESI ions and thus improving the measurement of relative abundance data. Capillary exit voltage was typically 70 V. In-source back exchange was determined by preparing 100% exchanged angiotensin I in D2O. This solution was combined with a 30:1 flow of 50% H2O/acetonitrile in a 10-μL tee just outside the ESI source. All eight amide exchange deuterons were retained (little or no back exchange). Variations of source temperature, nitrogen flow rates, and skimmer voltages had no observable effect on the relative ion abundance.
Hydrogen/deuterium exchange experiments—Data analysis
Spectra from each time point were analyzed. A program entitled ExPro (Poster entitled “ExchangePro: An Automated High Performance Software Package for analysis of Deuterium Exchange Mass Spectrometric Data Obtained by FTMS,” Davidson, Frego, and Kruppa, presented at the 52nd Annual Conference of the American Society for Mass Spectrometry) was used to calculate the “average mass” of the peptide's molecular ion cluster, by multiplying the mass times the intensity for each isotope of the cluster and dividing by the total intensity. The resulting data were plotted graphically for each peptide, yielding a map of protection for the protein. For all experiments, reported data were adjusted for the number of exchangeable hydrogens in each peptide: reported value = centroid / number of nonproline residues in the peptide –1. ViewerLite 4.2 (Accelyrs Inc.) was employed to map results onto the crystal structures.
Electronic supplemental material
For graphical plots of all peptides exhibiting altered exchange, please refer to the file GRLBDHXMS.ppt.
Acknowledgments
We are indebted to Gary Kruppa for software development, Jerry Hopkins for the SEC-MS results, Dorothy Freeman for the dialysis procedure, and Elda Gautschi and Alistair Baptiste for protein supply.
Footnotes
Supplemental material see www.proteinscience.org
Reprint requests to: Lee Frego, Boehringer Ingelheim Pharmaceuticals, 900 Ridgebury Road, Ridgefield, CT 06877, USA; e-mail: lfrego@rdg.boehringer-ingelheim.com; fax: (203) 791-6196.
Article and publication are at http://www.proteinscience.org/cgi/doi/10.1110/ps.051781406.
Abbreviations: H/D, hydrogen/deuterium; HXMS, hydrogen/deuterium exchange mass spectrometry; LC/MS, liquid chromatography/mass spectrometry; GR, glucocorticoid receptor; GR LBD, glucocorticoid receptor ligand-binding domain; TIF2, transcriptional intermediary factor 2; SRC1, steroid receptor coactivator 1; NCoR, nuclear receptor corepressor; NF-κB, nuclear factor κB; TAT, tyrosine aminotransferase; GRE, glucocorticoid response element; nGRE, negative glucocorticoid response element; DBD, DNA-binding domain; LBD, ligand-binding domain; NMR, nuclear magnetic resonance.
References
- Adcock I.M. 2000. Molecular mechanisms of glucocorticoid actions Pulm. Pharmacol. Ther. 13: 115–126. [DOI] [PubMed] [Google Scholar]
- Bledsoe R.K., Montana V.G., Stanley T.B., Delves C.J., Apolito C.J., McKee D.D., Consler T.G., Parks D.J., Stewart E.L., Willson T.M.et al. 2002. Crystal structure of the glucocorticoid receptor ligand binding domain reveals a novel mode of receptor dimerization and coactivator recognition Cell 110: 93–105. [DOI] [PubMed] [Google Scholar]
- Blom K.F., Larsen B.S., McEwen C.N. 1999. Determining affinity-selected ligands and estimating binding affinities by online size exclusion chromatography/liquid chromatography-mass spectrometry J. Comb. Chem. 1: 82–90. [DOI] [PubMed] [Google Scholar]
- Coghlan M.J., Jacobson P.B., Lane B., Nakane M., Lin C.W., Elmore S.W., Kym P.R., Luly J.R., Carter G.W., Turner R.et al. 2003. A novel antiinflammatory maintains glucocorticoid efficacy with reduced side effects Mol. Endocrinol. 17: 860–869. [DOI] [PubMed] [Google Scholar]
- Darimont B.D., Wagner R.L., Apriletti J.W., Stallcup M.R., Kushner P.J., Baxter J.D., Fletterick R.J., Yamamoto K.R. 1998. Structure and specificity of nuclear receptor-coactivator interactions Genes & Dev. 12: 3343–3356. [DOI] [PMC free article] [PubMed] [Google Scholar]
- Davidson W., Frego L., Peet G.W., Kroe R.R., Labadia M.E., Lukas S.M., Snow R.J., Jakes S., Grygon C.A., Pargellis C.et al. 2004. Discovery and characterization of a substrate selective p38α inhibitor Biochemistry 43: 11658–11671. [DOI] [PubMed] [Google Scholar]
- De Bosscher K., Vanden Berghe W., Vermeulen L., Plaisance S., Boone E., Haegeman G. 2000. Glucocorticoids repress NF-κB-driven genes by disturbing the interaction of p65 with the basal transcription machinery, irrespective of coactivator levels in the cell Proc. Natl. Acad. Sci. 97: 3919–3924. [DOI] [PMC free article] [PubMed] [Google Scholar]
- Engen J.R., Gmeiner W.H., Smithgall T.E., Smith D.L. 1999. Hydrogen exchange shows peptide binding stabilizes motions in Hck SH2 Biochemistry 38: 8926–8935. [DOI] [PubMed] [Google Scholar]
- Garside H., Stevens A., Farrow S., Normand C., Hould B., Berry A., Maschera B., Ray D. 2004. Glucocorticoid ligands specify different interactions with NF-κB by allosteric effects on the glucocorticoid receptor DNA binding domain J. Biol. Chem. 48: 50050–50059. [DOI] [PubMed] [Google Scholar]
- Jantzen H.-M., Strahle U., Gloss B., Stewart F., Schmid W., Boshart M., Miksicek R., Schutz G. 1987. Cooperativity of glucocorticoid response elements located far upstream of the tyrosine aminotransferase gene Cell 49: 29–38. [DOI] [PubMed] [Google Scholar]
- Kauppi B., Jakob C., Farnegardh M., Yang J., Ahola H., Alarcon M., Calles K., Engstrom O., Harlan J., Muchmore S.et al. 2003. The three-dimensional structures of antagonistic and agonistic forms of the glucocorticoid receptor ligand-binding domain J. Biol. Chem. 278: 22748–22754. [DOI] [PubMed] [Google Scholar]
- Nagy L., Kao H.-Y., Love J.D., Li C., Banayo E., Gooch J.T., Krishna V., Chatterjee K., Evans R.M., Schwabe J.W.R. 1999. Mechanism of corepressor binding and release from nuclear hormone receptors Genes & Dev. 13: 3209–3216. [DOI] [PMC free article] [PubMed] [Google Scholar]
- Reichardt H.M., Tronche F., Berger S., Kellendonk C., Schutz G. 2000. New insights into glucocorticoid and mineralocorticoid signaling: Lessons from gene targeting Adv. Pharmacol. 47: 1–21. [DOI] [PubMed] [Google Scholar]
- Resing K.A. and Ahn N.G. 1998. Deuterium exchange mass spectrometry as a probe of protein kinase activation. Analysis of wild type and constitutively active mutants of MAP kinase kinase-1 Biochemistry 37: 463–475. [DOI] [PubMed] [Google Scholar]
- Resing K.A., Hoofnagle A.N., Ahn N.G. 1999. Modeling deuterium exchange behavior of ERK2 using peptide mapping to probe secondary structure J. Am. Soc. Mass Spectrom. 10: 685–702. [DOI] [PubMed] [Google Scholar]
- Robinson-Rechavi M., Carpentier A.S., Duffraisse M., Laudet V. 2001. How many nuclear hormone receptors are there in the human genome? Trends Genet. 17: 554–556. [DOI] [PubMed] [Google Scholar]
- Schacke H., Docke W.-D., Asadullah K. 2002. Mechanisms involved in the side effects of glucocorticoids Pharmacol. Ther. 96: 23–43. [DOI] [PubMed] [Google Scholar]
- Schacke H., Schottelius A., Docke W., Strehlke P., Jaroch S., Schmees N., Rehwinkel H., Hennekes H., Asadullah K. 2004. Dissociation of transactivation from transrepression by a selective glucorticoid receptor agonist leads to separation of therapeutic effects from side effects Proc. Natl. Acad. Sci. 101: 227–232. [DOI] [PMC free article] [PubMed] [Google Scholar]
- Schulz M., Eggert M., Baniahmad A., Dostert A., Heinzel T., Renkawitz R. 2002. RU486-induced glucocorticoid receptor agonism is controlled by the receptor N terminus and by corepressor binding J. Biol. Chem. 277: 26238–26243. [DOI] [PubMed] [Google Scholar]
- Wang F., Li W., Emmett M.R., Marshall A.G., Corson D., Sykes B.D. 1999. Fourier transform ion cyclotron resonance mass spectrometric detection of small Ca (2+)-induced conformational changes in the regulatory domain of human cardiac troponin c J. Am. Soc. Mass Spectrom. 10: 703–710. [DOI] [PubMed] [Google Scholar]
- Yan X., Broderick D., Leid M.E., Schimerlik M.I., Deinzer M.L. 2004. Dynamics and ligand-induced solvent accessibility changes in human retinoid X receptor homodimer determined by hydrogen deuterium exchange and mass spectrometry Biochemistry 43: 909–917. [DOI] [PubMed] [Google Scholar]
- Zhang Z.Q. and Smith D.L. 1993. Determination of amide hydrogen exchange by mass spectrometry: A new tool for protein structure elucidation Protein Sci. 2: 522–531. [DOI] [PMC free article] [PubMed] [Google Scholar]
- Zhang Z.Q., Post C.B., Smith D.L. 1996. Amide hydrogen exchange determined by mass spectrometry: Application to rabbit muscle aldolase Biochemistry 35: 779–791. [DOI] [PubMed] [Google Scholar]