

Abstract
SH3 domains are small protein modules that are involved in protein–protein interactions in several essential metabolic pathways. The availability of the complete genome and the limited number of clearly identifiable SH3 domains make the yeast Saccharomyces cerevisae an ideal proteomic-based model system to investigate the structural rules dictating the SH3-mediated protein interactions and to develop new tools to assist these studies. In the present work, we have determined the solution structure of the SH3 domain from Myo3 and modeled by homology that of the highly homologous Myo5, two myosins implicated in actin polymerization. We have then implemented an integrated approach that makes use of experimental and computational methods to characterize their binding properties. While accommodating their targets in the classical groove, the two domains have selectivity in both orientation and sequence specificity of the target peptides. From our study, we propose a consensus sequence that may provide a useful guideline to identify new natural partners and suggest a strategy of more general applicability that may be of use in other structural proteomic studies.
Keywords: myosin, NMR, protein design, S.cerevisiae, structure, Wilskott-Aldrich syndrome
Especially since the determination of the human genome, protein–protein interactions have been considered one of the key elements to explain the complexity of living organisms (Xenarios and Eisenberg 2001). Among the several protein–protein interaction modules is the Src homology-3 (SH3) domain, one of the widest-spread protein modules mostly observed in eukaryotic organisms having been identified in many hundreds of signaling proteins in species from yeast to human (Mayer 2001; Tong et al. 2002). Often found in intracellular or membrane-associated proteins (Mayer 2001), SH3 domains are known to act through their binding to specific proline-rich sequence motifs as molecular adhesives and to play a crucial role in the formation of multiprotein complexes and networks responsible for signal transduction, cytoskeletal organization and other cellular processes (Morton and Campbell 1994; Mayer 2001). In humans, mutations in several SH3 domains are known to cause severe malfunctions leading, among others, to inflammatory diseases and to cancer (Smithgall 1995; Dalgarno et al. 1997; Vidal et al. 2001).
SH3-domains are relatively small protein modules, usually comprising 50–70 amino acid residues. From the structural point of view, they have a common characteristic fold (Yu et al. 1992, 1994; Musacchio et al. 1994), with five to eight β-strands arranged into two tightly packed antiparallel β-sheets, linked by the RT-and the n-SRC-loops. The ligands, which are usually accommodated in a groove adjacent to the RT-loop, adopt a left-handed polyproline-2 (or PPII) helix conformation (Musacchio 2002). Because of the intrinsic symmetry of PPII helices, the target peptides can be accommodated into the SH3 cavity in both of the two possible orientations, traditionally classified into two families, according to specific consensus motifs. The so-called type-I and type-II ligands have the general consensus sequences + xxPxxP (or + xϕPxϕP) and xPxxPx + (or ϕPxϕPx +), respectively, where x is any amino acid; + is in most cases a basic residue, usually an arginine; and ϕ is a hydrophobic residue (Mayer 2001; Musacchio 2002).
More recently, it has become clear, however, that such a classification might be too rigid as sequences not belonging to either of the two motifs are able to be recognized and that key positions not interacting directly with the ligand can favor one of the two orientations (Fernandez-Ballester et al. 2004). In general, the affinity of most of the known SH3 domains for their peptide ligands is relatively low, with Kd values ranging from 1–100 μM and relatively low selectivity (Feng et al. 1994; Nguyen et al. 2000). This finding opens the intriguing question of what is the physiological significance and the evolutionary advantage of maintaining such relatively low affinities and selectivity.
Because of their importance at the cellular level, a deeper understanding of the target specificity of particular SH3 domains may eventually lead us to develop molecules able to inhibit specific interactions in vivo. An excellent model system for these studies is the yeast Saccharomyces cerevisiae, one of the simplest eukaryotic organisms. A relatively small but appreciable number of SH3 domains (29) have been identified in the S. cerevisiae genome and are predicted to form a complex network of interactions with other protein partners (Tong et al. 2002).
We have started a long-term project aimed at the characterization of all SH3 domains from S. cerevisiae and their interactions. Here, we present the structure determination and the determinants of the binding selectivity of two homologous SH3 domains from the highly related classic class-1 myosin isoforms Myo3 (Myo3-SH3) and Myo5 (Myo5-SH3). These sequences were selected, among other factors, because of their potential medical interest: Mutations at the level of the genes encoding the human orthologs of these proteins result in Wiskott-Aldrich Syndrome (WAS), a severe immunodeficiency related to genetic alterations in chromosome X (Derry et al. 1995). WAS is thought to be caused by defects in actin polymerization mediated by the Arc2/3 protein complex, a critical component of the cytoskeleton formation of all eukaryotes (Mochida et al. 2002; Tong et al. 2002). Myo3-SH3 and Myo5-SH3 are linked to WAS since they are known to bind Vrp1p and Las17, which are respectively the yeast homologs of human WIP (Wiskott-Aldrich syndrome protein [WASP]-interacting protein) (Goodson et al. 1996; Evangelista et al. 2000; Geli et al. 2000) and of a WASP-like adapter protein essential for endocytosis and cytoskeleton assembly (Anderson et al. 1998; Rodal et al. 2003). A study of their properties could therefore shed new light into the complex mechanism that controls actin nucleation.
Results
The Myo-SH3 modules form stable domains
A structural characterization of the purified SH3 domains was first carried out by circular dichroism (CD) and fluorescence spectroscopy. The far-UV CD spectra of Myo3-SH3 and Myo5-SH3 are similar to those previously reported for other SH3 domains (Viguera et al. 1994; Knapp et al. 1998; Okishio et al. 2000), with a positive band centered at 226 nm and a prominent, negative contribution at ~202 nm (Fig. 1A). As in other proteins with an intrinsically low CD signal from the backbone conformation, the spectra are strongly influenced by conformation-unspecific effects due to the absorption of the aromatic residues present along the SH3 sequences. This feature has been recognized as preventing a correct estimate of the protein secondary structure content (Vuilleumier et al. 1993; Woody 1995).
Figure 1.

Spectroscopical characterization of Myo3 and Myo5-SH3 domains. Far-UV (A) and near-UV (B) circular dichroism spectra of Myo3-SH3 (solid line) and Myo5-SH3 (dashed line). (C) Fluorescence emission spectrum of Myo3-SH3 (solid line) and Myo5-SH3 (dashed line) after sample excitation at 294 nm at the concentration of 2.2 μM. (D) Temperature dependence of the Myo3-SH3 (black line) and Myo5-SH3 (gray line) as followed using the CD signal recorded at 226 nm. Data are given as the [θ]/[θ]0 ratio, where [θ]0 is the ellipticity value measured at 5°C. All the spectra were recorded in 10 mM Tris-HCl (pH 7.0) containing 50 mM NaCl.
The near UV CD spectra are also in excellent agreement with those reported for other SH3 domains (Viguera et al. 1994), having an intense signal in the 255-to 340-nm region with a maximum centered at ~266 nm (Fig. 1B). Fluorescence spectra, recorded after sample excitation at 294 nm, show a λmax value at 349 nm (Fig. 1C), indicating that the two Trp residues present in both the SH3 sequences are exposed (Lakowicz 1999).
The thermal stabilities of the two domains were tested by monitoring the CD signal at 226 nm. The unfolding transitions of Myo3-SH3 and Myo5-SH3 are reversible and highly cooperative with transition midpoints at 54°C and 58°C, respectively (Fig. 1D). No precipitation or aggregation was observed during the unfolding process, as also confirmed by size-exclusion chromatography, carried out by loading the Superdex HP-75 analytical column with the samples after incubation at 90°C.
The NMR spectra of Myo3-SH3 and Myo5-SH3 have excellent intrinsic resolution with features that clearly confirm that both SH3 domains are folded (data not shown). Virtually complete assignment was achieved for both domains and used for further structural analysis. However, the resonances of a few amides (Ser19, Ala56, Tyr57, Thr64, Arg65, and Asn66 for Myo3-SH3; Lys2, Glu3, Ser18, Ser19, Tyr57, Thr59, and His61 for Myo5-SH3) could not be identified and connected with the spin system of the respective side chains. Since no strip remained unassigned in any of the triple or quadruple resonance experiments, we must conclude that these amides undergo a conformational or chemical exchange with the solvent that broadens them to disappearance, suggesting that the dynamical properties of the RT-loop and of the termini are different from those of the rest of the molecule.
Myo3-SH3 shares the highest structural similarity with type-I domains
Complete structure calculations were carried out for Myo3-SH3 (Table 1). The 20 best final structures, as judged from energy and geometrical considerations, show that the tertiary fold of Myo3-SH3 typically consists of one triple-stranded, antiparallel β-sheet and a double-stranded antiparallel β-sheet (Fig. 2A,B). Two additional β-strands, βx (residues 22–24) and βz (residues 11–13), form an antiparallel β-hairpin, βIII, in the long loop between β1 and β2, termed the RT-loop. A one-turn 310 helix is present between residues 55–57. The structure of Myo3-SH3 is well defined between residues 3–13 and 22–60 with a 0.35 Å root mean square deviation (RMSD) for the backbone atoms in these regions (Fig. 2A,B); Table 1). The RT-loop and, to a minor extent, the nSrc-loop show an appreciably larger RMSD compared with the structured regions, suggesting that they are flexible. Overall, the N-terminal region is well structured. The Myo3-SH3 construct comprises nine residues terminal to Tyr61 that are not part of the SH3 sequence. This region is disordered in our structures and does not interact with the adjacent domain, in agreement with the difficulties encountered in identifying in the NMR spectrum some of the corresponding amides.
Table 1.
Structural statistics for the Myo3-SH3 domain
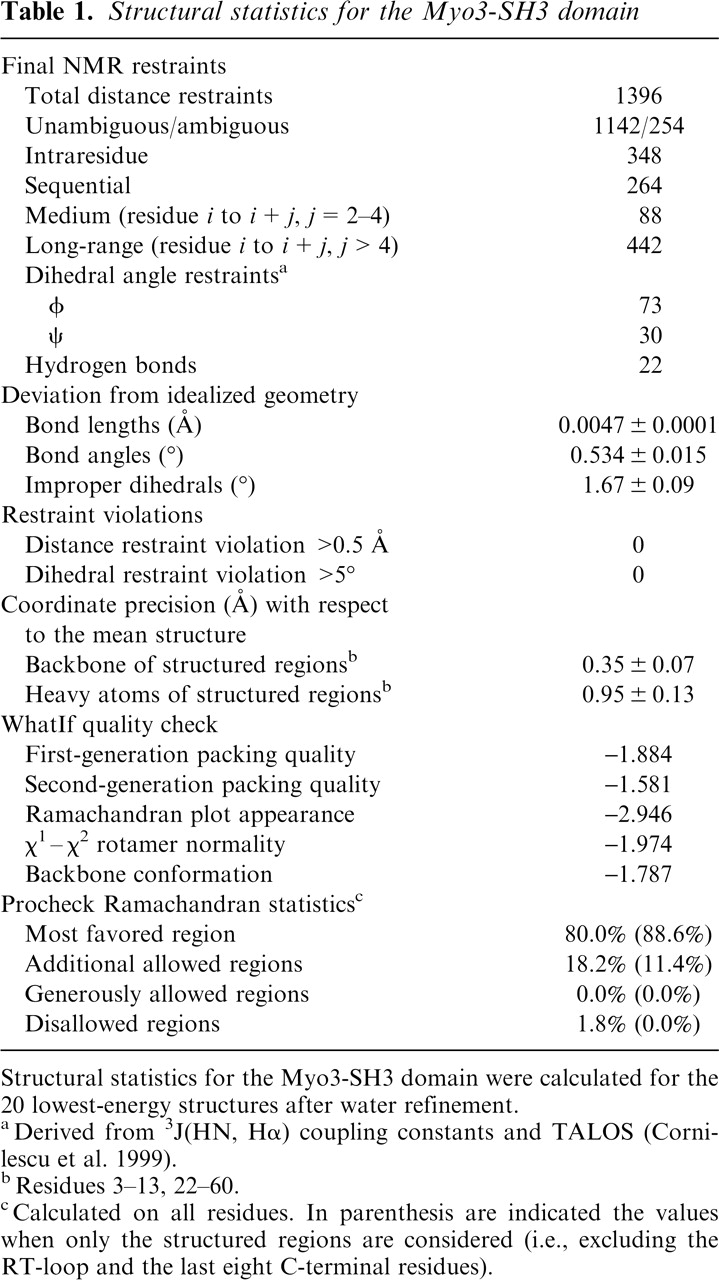
Structural statistics for the Myo3-SH3 domain were calculated for the 20 lowest-energy structures after water refinement.
aDerived from 3J(HN, Hα) coupling constants and TALOS (Cornilescu et al. 1999).
bResidues 3-13, 22-60.
cCalculated on all residues. In parenthesis are indicated the values when only the structured regions are considered (i.e., excluding the RT-loop and the last eight C-terminal residues).
Figure 2.

Tertiary structure of Myo3-SH3 and comparative modeling of Myo5-SH3. (A) Backbone bundle of the 20 best calculated structures of Myo3-SH3. The fitting was obtained by superimposing the backbone atoms of the structured regions (residues 3–13 and 22–60). (B) Schematic representation of the minimized averaged three-dimensional structure. The N and C termini are labeled. (C) Model of Myo5-SH3 built by homology using the structure of Myo3-SH3 as a template. The side chains of residues that differ between Myo3-SH3 and Myo5-SH3 are indicated in red.
A DALI search indicates that Myo-SH3 shares the highest degree of homology with the SH3 domains from human P56-Lck tyrosine kinase (1lck), kalirin 9a, and the Abelson tyrosin kinase (1bbz), having Z-scores of >9 and RMSDs of 2.0–2.2 Å over residues 57–63. Of these structures, the Abelson tyrosine kinase also shares the highest degree of sequence similarity (30% identity and 67% similarity).
The structure of Myo5-SH3 can be built with confidence from that of Myo3-SH3
The high degree of sequence homology between the Myo3-SH3 and Myo5-SH3 (80.6%) and the absence of insertions/deletions in their sequences indicate that the coordinates of Myo3-SH3 can safely be used as a template for the structure of Myo5-SH3. It has been shown that protein structures sharing >50% identity superpose the core residues with an RMSD of <1 Å, a value approximately in the range of the accuracy of an NMR structure bundle (Irving et al. 2001). A comparative model built by the SwissModel program shows that the main differences between the two Myo-SH3 domains are mostly concentrated in regions far away from the classical binding groove (Fig. 2C), strongly suggesting that the mode of binding of the two SH3 domains must be very similar.
The Myo-SH3 domains show high flexibility in the binding pockets
15N relaxation experiments were performed to study the dynamical behavior of the two Myo-SH3 domains (Fig. 3). The Lipari-Szabo model-free formalism was used to analyze the data (Lipari and Szabo 1982). Smaller than average T1/T2 and small NOE values, which suggest the presence of internal motions on the nano-and picosecond time scale, were observed in the loops (i.e., in the RT-and nSrc-loops) and at both termini, indicating a greater mobility in these regions in agreement with the larger RMSD of the solution bundle. Their higher flexibility is also supported by the significantly reduced NOE intensities. In both domains, residues 10, 35, 37, and 58 have larger-than-average T1/T2 ratios and shorter T2 in both domains. These features may indicate the presence of low-frequency motions, often associated with conformational exchange.
Figure 3.

Relaxation parameters for Myo3-SH3 (left panel) and Myo5-SH3 (right panel) recorded at 600 MHz and 20°C. R1 and R2 and 15N-NOE are plotted as a function of residue number. The values for the amide resonances of residues 19, 56, 57, and 64–66 for Myo3-SH3 and 2, 3, 18, 19, 57, 59, and 61 for Myo5-SH3 are missing because they were not assigned, whereas the other missing values correspond to residues that were excluded either because of overlap or because they were too weak to be properly appreciated.
Correlation times of 7.9 and 6.2 nsec were estimated for Myo3-SH3 and Myo5-SH5, respectively. The difference is consistent with the presence of the highly flexible C-terminal tail in Myo3-SH3: Disordered regions appended to globular domains have been shown to exert a frictional drag that increases with the length of the tag, thus affecting the molecular tumbling in solution (Nicastro et al. 2004). Myo5-SH3, which lacks the long tail, is more compact and has a relaxation time in good agreement with what expected for a monomeric globular domain of equivalent size (Maciejewski et al. 2000).
Analysis of Myo-SH3 binding properties
To investigate the binding affinity and specificity of Myo3-SH3 and Myo5-SH3, we selected peptide sequences according to two independent philosophies. First, we selected representative sequences from Las17 and Vrp1p, the two proteins thought to be the natural partners of Myo3 and Myo5. Both proteins are rich in prolines and poly-proline sequences and have been found to contain multiple binding sites (Anderson et al. 1998; Evangelista et al. 2000). The sequence from Las17 (P_Las17) was selected according to the predicted highest score by the SPOT program (Brannetti and Helmer-Citterich 2003), whereas that from Vrp1p (P_Vrp1p) was chosen because it contains a repeated LPL motif. Both sequences have mixed type-I and type-II features, making it difficult to predict the orientation they bind with.
Second, the Abo-peptide (3BP-1) was selected as a classical example of a type-I peptide known to bind the Abelson tyrosine kinase SH3 domain with high specificity (Ren et al. 1993; Viguera et al. 1994). For comparison, a peptide spanning a region of the titin protein (P_titin) and known to bind to the nebulin SH3 domain (Sorimachi et al. 1997; Politou et al. 2002) was chosen as a representative of a type-II peptide.
Peptide binding to Myo3-SH3 and Myo5-SH3 was monitored by following the fluorescence emitted by the SH3-domain at 317 nm and 360 nm in the presence of increasing concentrations of ligand peptide, after sample excitation at 294 nm (Fig. 4). The binding constants were obtained by nonlinear least squares fitting of the data (Table 2). The titration curves indicate that all peptides cause a variation of the fluorescence signal, but they bind with different affinities: 3BP-1 binds myosin SH3 domains with binding constants well comparable with those of other SH3 domains (42 μM and 35 μM for Myo3-SH3 and Myo5-SH3, respectively). P_Vrp1p and P_Las17 form complexes approximately one order of magnitude weaker. P_titin binds very weakly, and the titration does not reach a plateau within the concentration range explored by fluorescence. These results were also confirmed by monitoring the near-UV CD signal of the complexes (data not shown).
Figure 4.

Plot of fluorescence intensities of Myo3-SH3 as a function of increasing concentrations of peptides. Two representative curves are shown for the high-affinity 3BP-1 peptide (A) and for the lower-affinity P_Vrp1p (B). They were recorded at 360 nm and 317 nm, respectively. (Insets) Fluorescence spectra recorded as a function of increasing concentrations of the relative peptides.
Table 2.
Comparison of the predicted binding energies with the experimental dissociation constants (Kd)

Energy (in kcal/mol) is the binding energy predicted by Fold-X. VDWclashes represent the van der Waals' clashes between the protein and the ligand. Predictions were made by using the full van der Waals' clash penalty of Fold-X and considering that the peptide loses all backbone mobility upon binding. When, as for P_Las17 and P_Vrp1p, different 10-amino-acid windows were possible, all possible frames were tested. Here, we report the results for the frame (indicated in bold) for which the best energy was obtained. Likewise, since the crystal structure (1sim) used as a reference for the P-titin prediction is seven residues, only the best energy frame is shown.
aNot determined. Affinity too low to be fitted.
NT, Not tested.
The interactions of Myo3-SH3 and Myo5-SH3 with the peptides were further mapped onto their structures by NMR chemical shift perturbation to confirm that the binding mode involves the classical groove (Fig. 5). The peptides affect the same Myo-SH3 resonances that map into the structure around the RT-loop. Interestingly, some of the amide resonances (such as those of residues 14 and 15 in Myo3-SH3) that are very weak in the spectrum of the isolated domain become clearly visible upon complex formation. This suggests that complex formation reduces the mobility of the RT-loop. However, the resonances whose assignment is missing remained undetected even at high peptide–protein ratios.
Figure 5.
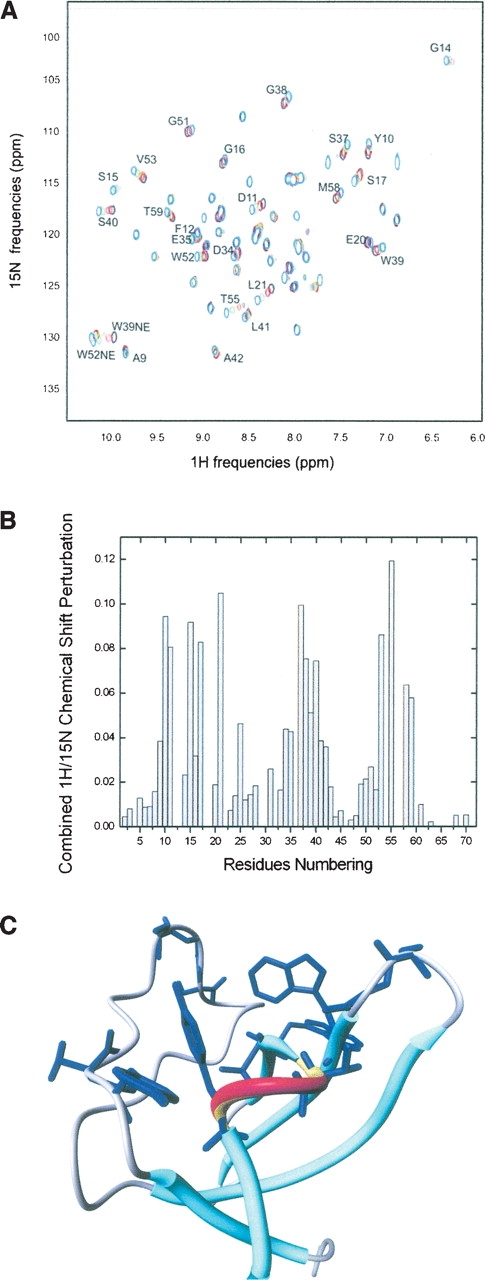
Effects of the peptide titrations on the Myo-SH3 NMR spectra. A representative example of Myo3-SH3 titrated with 3BP-1 is shown. (A) Superposition of the HSQC spectra recorded at 25°C and 500 MHz corresponding to 0, 0.33, 1, and 3 molar Myo3-SH3:peptide molar ratios colored in black, red, green, and blue, respectively. (B) Histogram of the weighted chemical shifted variation as observed for a 1:3 molar ratio of Myo3-SH3:3BP-1 complex. (C) Mapping of the interaction surface of 3BP-1 onto the structure of Myo3-SH3. The secondary structure elements are indicated with red and yellow (the α-helix) and cyan (the β-sheet) solid oval ribbons. The side chains of residues with amide resonances most dramatically shifted upon binding of the peptide are explicitly shown.
In silico prediction of the Myo-SH3 binding properties
In the attempt to rationalize these results and to develop new methods to predict optimal SH3 binding consensus sequences, we used a combined approach based on molecular modeling and energy calculations. The structures of Myo3-SH3 and Myo5-SH3 complexes with polyala-nine peptides were homology-built from a database of different structures of SH3 complexed with ligands belonging to type-I, type-II, and nonstandard classes (see Materials and Methods). A total of 11 complexes were analyzed (each one corresponding to the SH3 domain complexed to a different ligand conformation). For each template (which consisted of the SH3 domain and the alanine backbone of the ligand), each ligand position was then individually explored by systematic mutation of alanine into the 20 natural amino acids. The side chain mutations of the modeled ligands, the reorganization of the surrounding side chains from the SH3 domains, and the evaluation of the energies were calculated using a new version of the Fold-X algorithm (Guerois et al. 2002; Kiel et al. 2004, 2005; Schymkowitz et al. 2005). The energies obtained were tabulated and correlated with the ability of a residue to improve the ligand–domain interaction with respect to alanine, thus establishing a link between the ligand position, residue type, and ability to bind. The scoring matrices obtained allowed the selection of putative ligands for further experimental testing and validation of the methodology. The best ligands were then modeled by accepting the most favorable amino acid at each position (the lower the energy value, the better the ligand–domain interaction) and evaluating the binding energy (Table 2).
From this analysis, we would rank the 3BP-1 peptide as the best binding one both in terms of interaction energies and of lack of clashes. Consistently, both P_Vrp1p and PLas17 are associated with relatively less favorable binding energies, with more clashes, or with both, thus suggesting that they should bind with lower affinity than 3BP-1, in excellent agreement with the experimental findings. We also observed a certain propensity of Myo3-SH3 and Myo5-SH3 for type-I ligands. However, this preference was not clear-cut, suggesting that our approach can be confidently used to predict the relative binding affinity within each family but does not yet allow complete discrimination between the two peptide orientations, whose prediction will have to rely on different criteria.
To test further the predictive power of the Fold-X method, we calculated the consensus sequence for type-I ligands binding to Myo3-SH3 and Myo5-SH3, using a threshold of 1 kcal/mol from the best amino acid at each position. This is [HRC]-[PKF]-X-[KRHFLN]-[PMIHK][PHMF]-[WPHM]-X-[PRM]-P and is essentially the same for both Myo3-and Myo5-SH3. On the basis of this information, four type-I peptides were synthesized and their binding analyzed by fluorescence spectroscopy: Peptides P1 and P2 were predicted to bind with high affinity to Myo3-SH3, while peptides P3 and P4 were selected as controls because the individual amino acids had a good score but the overall binding energy when modeling the complex was highly unfavorable. The fluorescence titration curves recorded for these peptides indicate that P1 and P2 bind the Myo-SH3 domains with binding constants in the range 18–54 μM, values that are comparable to those observed for 3BP-1. P3 and P4 bind so weakly that no significant variations of the fluorescence signal were observed. The results were again confirmed by monitoring the near-UV CD signal of the complexes (data not shown). Overall, the modeling predictions were in good agreement with the experimental binding constants (Table 2), thus confirming that our method can be used as the basis for a computational approach to predict SH3 binding sequences.
Finally, we used the consensus sequence to screen the sequences of Las17 and Vrp1p and assess the choice of the two selected peptides using Fold-X. This search resulted in nine and 42 decameric sequences for Las17 and Vrp1p, respectively, which fulfil the consensus predicted. As previously, models were built assuming a type-I orientation and the energies of each model calculated (Table 3). Both experimentally tested peptides appear in this list with high score, supporting our original choice.
Table 3.
Decapeptide sequences from Las17 and Vrp1p that fulfill the consensus sequence predicted for the MYO-SH3 domains
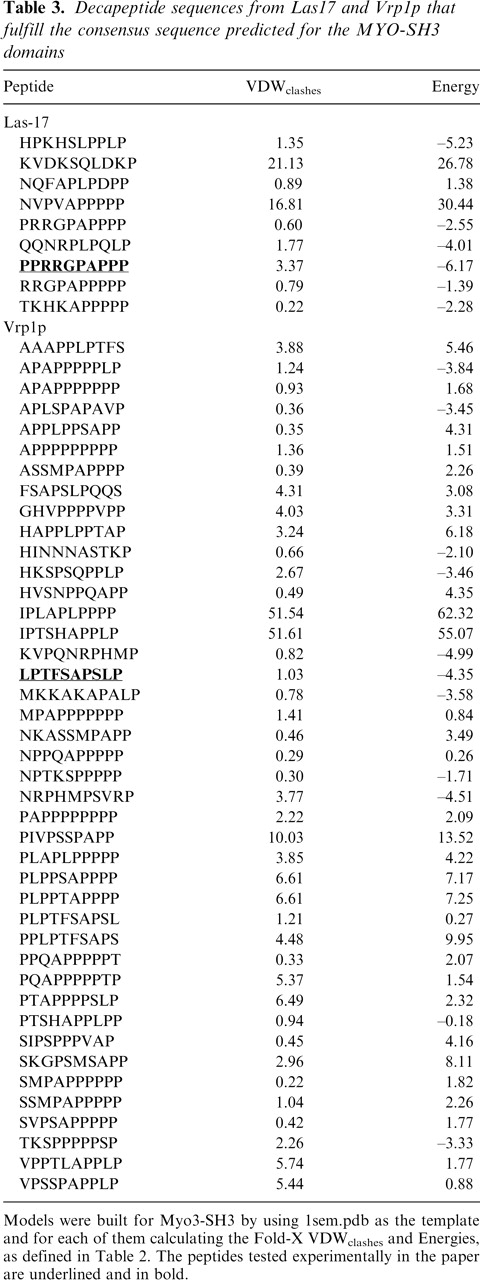
Models were built for Myo3-SH3 by using 1sem.pdb as the template and for each of them calculating the Fold-X VDWclashes and Energies, as defined in Table 2. The peptides tested experimentally in the paper are underlined and in bold.
Experimentally based docking of Myo-SH3 domains with their target peptides
To gain an experimentally based description of the complexes, we first tried to detect intermolecular NOEs between the peptides and the Myo-SH3 domains using classical filter experiments (see Materials and Methods). However, no effect could be observed, probably because of the modest affinity of even the most tightly binding peptide. We therefore adopted the HADDOCK strategy, a procedure that uses experimental chemical shift data to drive the molecular docking (Dominguez et al. 2003). The protocol was first validated by calculating the structure of the Abl tyrosine kinase in complex with the 3BP-1 peptide. The resulting HADDOCK structure compares very well with the experimental one (RMSD of 1.43 Å for all backbone atoms) (Fig. 6A). We then calculated the structures of the Myo-SH3 complexes with the peptides that bind with the highest affinities. The complexes of Myo3-SH3 with 3BP-1, P1, and P2 form bundles of solutions all having similar features and make use of the classical groove for their interactions. In all three cases, the preferred orientation is almost exclusively of type-I and little dispersion is observed in each bundle (Fig. 6B). The key interactions are mostly of a hydrophobic nature and are enhanced by a number of hydrogen bonds, among which are a hydrogen bond between the indole group of Trp39 and the carboxyl of the peptide at position 4 and a bifurcated hydrogen bond between the oxyhydryl of Tyr7 and the peptide carbonyl oxygens at positions 7 and 8.
Figure 6.

Structures of the Myo3-SH3 complexes as calculated by the program HADDOCK. (A) Comparison of the best HADDOCK structure of the Abl/3PB-1 complex (green peptide) as calculated to validate the protocol with the experimental crystallographic structure (1abo, with the peptide shown in red). The backbone atoms (2–61) of the best HADDOCK structure of the Myo3-SH3/3BP-1 complex (blue peptide) and the best model of the same complex as calculated Fold-X (yellow peptide) are also superposed to the X-ray structure. (B) Structure bundles as calculated for the Myo3-SH3 complexes with the 3BP-1, P1 and P2 (from left to right). The bundle RMSDs are 0.75 ± 0.29 Å, 1.14 ± 0.63 Å, and 1.26 ± 0.45 Å for the backbone atoms and 1.21 ± 0.30 Å, 1.61 ± 0.53 Å, and 1.75 ± 0.45 Å for the heavy atoms of the structured regions (residues 3–13, 22–44, 50–60, 71–80), respectively, of 3BP-1, P1, and P2. The peptide C termini are indicated in green.
Interestingly, when the structure of the 3BP-1/Myo3-SH3 complex was superposed with that of the Abl tyrosine kinase in complex with the same peptide (1abo), we observed a good agreement in the mode of the peptide binding (Fig. 6A). A similar agreement was also observed when comparing the HADDOCK solution with the lowest energy model of the same complex as calculated by Fold-X.
Discussion
In the last few years, SH3 domains have received much interest not only because of their importance in signal transduction but also because they represent an important paradigm for testing our understanding of protein–protein interactions. Here, we have described the structures, the dynamical and the binding properties of the SH3 domains from Myo3 and Myo5, two important components of the yeast cytoskeleton. In doing it, we have implemented a new approach to high-throughput studies of SH3 domains based on a combination of experimental and computational techniques that allowed us to describe the overall features of Myo-SH3 recognition without the necessity of solving directly the structure of each of these complexes. Such an interdisciplinary approach may be used in other structural genomics studies of SH3 complexes.
We had previously described a conceptually similar methodology (Politou et al. 2002), in which biophysical techniques were integrated with the prediction of putative SH3 binding sequences as calculated by the SPOT program (Brannetti and Helmer-Citterich 2003). The present computational methodology, based on the Fold-X algorithm (Kiel et al. 2004, 2005), is, however, expected to have at least two major advantages. First, Fold-X makes direct use of the structural information about the SH3 complexes currently available in the Protein Data Bank (PDB) database. Second, it does not contain any sequence bias (usually in favor of proline residues), being based on an exhaustive conformational search that screens all the 20 amino acids.
An interesting peculiarity of the Myo-SH3 domains is that, compared with other SH3 domain complexes, the RT-loop is unusually rich in small neutral residues such as serines and glycines. This sequence composition correlates directly with the high mobility of the loop as observed from the relaxation parameters and from the peculiar dynamical properties of some residues of the RT-loop. A similar behavior has also been reported for other SH3 domains. A flexible RT-loop is, for instance, known to enhance the binding specificity of SH3 domains of the Src family for HIV-1 Nef, so that the target binds with an affinity approximately one order of magnitude tighter than those of other SH3 domains from the Src family (Arold et al. 1998). The SH3 domains of the Lck family determined by both X-ray and NMR techniques (Schweimer et al. 2002) also show a high level of variability of the RT-loop, confirming that this region exhibits the most prominent dynamics in the molecule. While being an intrinsic feature, the flexibility of the RT-loops of the Myo-SH3 domains and, more in general, of SH3 domains could in principle limit the applicability of the Fold-X approach, which at the moment assumes rigid templates. Luckily, the strong similarity of the scaffold and of the mode of binding of SH3 domains allows modeling based on more rigid templates and transferability of the results to the case of interest. We are considering ways of taking flexibility into account in our calculations.
Although both Myo-SH3 domains contain in and around the binding pocket relatively few negatively charged residues able to interact with the arginine/lysine that often helps to determine the peptide orientation, we observed experimentally a preference for a type-I peptide orientation. A similar specificity has been described also for the Abelson tyrosine kinase, which is one of the SH3 domains both with the closest sequence (~67% sequence similarity) and structural similarity (2.0 Å over 57 residues) to the Myo-SH3 domains. A preference for type-I orientation provides also further support to the Trp switch hypothesis (Fernandez-Ballester et al. 2004), according to which the Trp strongly conserved in the SH3 family (Trp39 in Myo3-SH3) and the position corresponding to residue 52 (which in the Myo-SH3 sequences is a second Trp) are key positions in determining the peptide orientation. When this position is occupied by a β-branched or long aliphatic residue, its side chain locks the conserved Trp in a conformation that seems to stabilize preferentially the type-II orientation and to prevent the other.
Interestingly, in our screening, the sequences from the two putative natural partners have the lowest affinities amongst the peptides that bind. This could indicate either that other regions outside the window selected may contribute to strengthen binding or, not necessarily in opposition with the first hypothesis, that the sequences of P_Vrp1p and P_Las17 contain several motifs in principle able to be recognized by the Myo-SH3 domains. Binding competition could be modulated by interactions with other partners and give place to a complex regulation that might be needed for a correct functioning of the complex.
In conclusion, the data presented here provide the basis for further studies of the actin polymerization complex and suggest new approaches for understanding the specificity of SH3 recognition.
Materials and methods
Protein expression and purification
Myo3-SH3 and Myo5-SH3 span, respectively, residues 1122–1190 of S. cerevisiae Myo3 and residues 1086–1146 of Myo5. They were expressed in Escherichia coli BL21[DE3]pLysS cells transformed with a modified GATEWAY expression vector pDEST17 with an N-terminal 6His-tag sequence (MSYYHHHHHHLESTSLYKKAGFENLYFQ) kindly provided by Dr. M. Wilmanns (EMBL, Hamburg, Germany). A seven amino acid recognition site for the Tobacco Etch Virus (TEV) protease was introduced between the tag and the heterologous polypeptide. Cultures were grown overnight in M9 minimal medium, diluted 10-fold in LB medium, and induced with 0.5 mM isopropyl-β-D-thiogalactopyranoside (IPTG) for 4 h at 220 rpm and 24°C. The cell pellet was harvested and lysed by one freeze-thaw cycle followed by sonication in a standard lysis buffer. The soluble overexpressed proteins were purified initially by Ni2+ -NTA (Quiagen) chromatography and eluted with 300 mM imidazole (pH 8). The N-terminal tag was subsequently removed using TEV protease performing cleavage overnight at room temperature. The untagged polypeptides were then isolated by gel-filtration chromatography on a (1.6 × 60 cm) HR Superdex-75 from Pharmacia, eluted at a flow rate of 0.4 mL/min with 20 mM Tris-HCl buffer (pH 7.0), containing 50 mM NaCl.
The protein purity was evaluated by 12% polyacrylamide gel-electrophoresis (SDS-PAGE). The chemical identity of the purified materials was established by high-resolution mass spectrometry on a Mariner electrospray ionization (ESI) time-of-flight (TOF) instrument from PerSeptive Biosystems, yielding mass values within 1-Da mass accuracy. The monomeric state of the myosin SH3 domains in solution was established by size-exclusion chromatography on an analytical Superdex HR-75 analytical column (Pharmacia).
Uniformly 13C-and 15N-labeled SH3 protein samples were obtained by growing cells in M9 minimal medium containing 13C6H12O6 and (15NH4)2SO4, respectively (Kainosho 1997).
Optical spectroscopies
Protein concentrations were determined spectrophotometrically by measuring the absorbance of the protein solutions at 280 nm assuming a extinction coefficient of 15,220 M−1 cm−1 for both Myo3-SH3 and Myo5-SH3. CD measurements were carried out at 25°C on a Jasco J-715 spectropolarimeter equipped with a PTC-348 Peltier system for temperature control. The instrument was calibrated with d-(+)10-camphorsulphonic acid. The spectra were recorded in 10 mM Tris-HCl and 50 mM NaCl (pH 7.0). Protein concentrations of 17 and 90 mM and quartz cuvettes with path lengths of 1 mm and 1 cm were used for recording far-and near-UV spectra, respectively. Thermal unfolding experiments were performed recording the dichroic signal at 226 nm in the temperature range of 10°C–90°C. The samples were heated at a rate of 1°C/min and successively cooled down to 10°C to determine reversibility.
Steady-state fluorescence measurements were performed on a SPEX Fluoromax spectrometer, by exciting protein samples (2 μM) at 294 nm (slit-width, 0.4 nm) and recording the emission intensity from 300–450 nm (slit-width, 1.5 nm). All data were evaluated using the ORIGIN program package (Micro-Cal Software).
NMR measurements
Protein samples were dialyzed against a buffer containing 10 mM Tris-HCl and 50 mM NaCl (pH 7). Typical protein concentrations were 0.6–0.8 mM. NMR spectra were recorded at temperatures between 15°C and 35°C on Varian spectrometers running at 500-, 600-, and 800-MHz proton frequency. Full spectral assignments for both Myo3-SH3 and Myo5-SH3 were based on 1H- 1H NOESY, TOCSY, and COSY in H2O and in D2O; 1H-15N-HSQC-TOCSY; 1H-15N-and 1H−13C-HSQCNOESY; HNHA; HNHB; CBCANH; CBCA(CO)NH; HNCO; and HCCH-TOCSY experiments. The mixing times were in the range 35–80 msec for TOCSY and 50–150 msec for NOESY spectra. The spectra were processed by the NMRPipe software package and analyzed by using the Sparky and Xeasy programs (Eccles et al. 1991).
Hydrogen bonds were inferred from proton/deuterium exchange rates obtained by freeze-drying 15N-labeled samples (0.6 mM) from water, dissolving them in a 99.9% D2O buffer (10 mM Tris-HCl, 50 mM NaCl at pH 7.0, uncorrected), and immediately placing them in the NMR tube. A series of 1H-15N HSQC spectra was recorded at 10-min intervals with identical acquisition parameters. Backbone dihedral angle restraints were obtained from a three-dimensional HNHA spectrum or predicted by the backbone torsion angle prediction package TALOS (version 98.04.21.02) (Cornilescu et al. 1999).
Structure calculations
Structural calculations of Myo3-SH3 were performed with the package ARIA1.2 (Nilges 1995; Linge et al. 2001) interfaced with XPLOR 3.1 (Brünger 1993). Distance restraints were derived from a two-dimensional 1H NOESY (mixing time, 125 msec) and a 1H-15N-HSQC-NOESY spectrum (100 msec). The NOE volumes were integrated using the Sparky software and converted into distances by the opportune automatic ARIA subroutine as previously described (Nilges et al. 1997). A typical run consisted of nine iterations. Iteration 0 generates the initial structure ensemble with NOE violation tolerance set to 1000 Å and the partial assignment cutoff probability set to 1.01. In the following eight iterations, the NOE violation tolerances are progressively reduced (1000.0, 1.0, 0.5, 0.1, 1.0, 0.1, 0.1, and 0.1 Å). The partial assignment cutoff probability was reduced in parallel (0.9999, 0.999, 0.99, 0.98, 0.96, 0.93, 0.90, and 0.80). Twenty structures were calculated by simulated annealing for each ARIA iteration using the standard CNS protocol (Brünger et al. 1998). Floating assignment for prochiral groups and correction for spin diffusion during iterative NOE assignment were applied as described (Folmer et al. 1997; Linge et al. 2004). In the final ARIA run, the number of structures generated at iteration 8 was increased to 100, and after refinement by molecular dynamics simulation in water (Linge et al. 2003), the 20 lowest energy structures were selected and used for statistical analysis. The structure quality was assessed using WHATIF and PROCHECK evaluations (Vriend 1990; Sippl 1993). The coordinates are deposited (PDB accession code 1BTT).
15N relaxation experiments
15NT1, 15NT2,and 1H-15N NOE NMR experiments were carried out at 20°C at 500 and 600 MHz on Varian spectrometers using standard pulse sequences (Kay et al. 1989). T1 data were acquired with 10 relaxation delays (0, 10, 25, 50, 100, 200, 400, 800, 1200, 1600 msec) and T2 with 11 relaxation delays (0, 9, 18, 26, 35, 44, 61, 78, 96, 122, 140 msec). 1H-15N NOEs were measured by recording HSQC spectra with and without proton saturation. T1 and T2 values were exacted by single-exponential fits of the corresponding decay curves. The overall correlation times were calculated from a simultaneous fitting of the T1/T2 ratios of those residues where the individual values of T1 and T2 did not deviate >1 SD from the average values.
Peptide binding monitored by fluorescence and NMR spectroscopy
The synthetic peptides were prepared as described in Politou et al. (2002). SH3-peptide binding was followed by monitoring the intensity of the fluorescence emitted by the two tryptophan residues present in both SH3 domains. A SPEX Fluoromax spectrometer was used with excitation at 294 nm (slit-width, 0.4 nm) and emission intensity recorded from 300–450 nm (slit-width, 1.5 nm). The protein concentration was kept constant at 2.2 μM, while the peptide concentration was varied from 0 to 300 μM. All measurements were carried out at 25°C in 10 mM Tris-HCl (pH 7.0), containing 50 mM NaCl, using a 1-cm pathlength quartz cuvette. After each ligand addition, the samples were left to equilibrate for 10 min and excited at 294 nm.
Dissociation constants (Kd) were determined by standard nonlinear least square fitting of the experimental data relating the change in fluorescence intensity at 317 or at 360 nm to the total added peptide concentration (Martin and Bayley 2002).
Complex formation was also followed by NMR spectroscopy. Typically, protein samples were dialyzed against 10 mM Tris-HCl (pH 7.0) containing 50 mM NaCl. After addition of D2O (99.9%) to a final concentration of 5% (v/v), the protein concentration reached ~0.2 mM. Peptide stock solutions were prepared in the same buffer. Peptide/SH3 binding was analyzed by addition of known amounts of concentrated peptide stock solutions to 15N-labeled SH3 and subsequent recording of two-dimensional 15N-1H HSQC spectra. WATERGATE modified versions of the [F2-N]-NOESY experiment described by Ikura and Bax (1992) were run at 500 MHz to detect intermolecular NOE effects.
Computational predictions of SH3-ligand complexes
The Myo5 model was built using the SwissModel Web site (http://swissmodel.expasy.org).
The complexes were built by superimposition of the Myo3-SH3 and Myo5-SH3 structures with crystallographic structures of SH3 complexes (PDB accession names: 1abo, 1bbz, 1fyn, 1abl, 1ov3, 1avz, 1b07, 1cka, 1ckb, 1efn, 1sem, 1ov3, 1n5z, 1oeb, 1uj0, 1opk, 1ksw, 1opl, 2ptk, 2src, 1ycs, 1a0n, 1rlp2.pdb, and 1io6). The ligands were transferred to the Myo3-SH3 and Myo5-SH3 structures and prepared for mutagenesis scanning to 20 natural amino acids. The peptide length used in the calculations was dictated by the length of the respective peptide in the template. When the peptide was longer, all possible frames were explored, and the one giving the best energies was adopted in the end. In silico mutagenesis was carried out with Fold-X (http://foldx.embl.de) (Kiel et al. 2004, 2005), which tests different rotamers and allows neighbor side chains to move. The way the program operates is in short the following. First, it mutates the selected position to alanine and annotates the side chain energies of the neighbor residues. Then, it mutates the alanines to the selected amino acid and recalculates the energies. Those that exhibit an unfavorable energy difference are mutated to explore if another rotamer is more favorable. This procedure contains an additional function, which rearranges the side chains to eliminate small steric clashes. The advantage of this procedure is that it quickly eliminates minor local clashes and gains time by decreasing the number of rotamer searches. For positions in which the amino acid residues of the SH3 structure are moved, the program stores the rotamer of the corresponding residue of the wild type and the new rotamer is accepted only if the interaction energy is more favorable. The complexes having strong van der Waals clashes between ligand backbone and SH3 domain are directly discarded. During this procedure, Fold-X identifies and eliminates those residues that have bad torsion angles, van der Waals clashes, or unfavorable total energies.
The Fold-X energy function, which includes terms that have been found to be important for protein stability, has been extensively described elsewhere (Guerois et al. 2002; Kiel et al. 2004). The stability energy of the complex (Es) calculated with Fold-X allows the calculation of the binding energy (Eb) between domain and ligand using the equation
where EsA and EsB refer to the stability energy of isolated chains A (domain) and B (ligand), respectively.
Molecular docking calculations
Molecular docking of the Myo-SH3 domains with their ligands was performed using the software HADDOCK1.3 (Dominguez et al. 2003) based on the chemical shift perturbation data observed in the spectra of the 15N-labeled proteins upon complex formation. The data obtained from chemical shift mapping and surface accessibility inferred from the Myo3-SH3 structure were used to define active (10, 11, 15, 16, 17, 35, 37–39, 52, 53, 55–57) and passive (9, 18, 19, 36, 54) residues according to the HADDOCK definitions (Dominguez et al. 2003). The interfacial residues, which were allowed to move during the simulated annealing and water refinement, were 1–3, 45–49, 61–70. All of the peptide residues were defined as active. A distance of 2 Å was used to define the ambiguous intermolecular restraints. Initially, 1000 structures of each complex were generated by rigid-body energy minimization. The 200 best in terms of the total energy were selected for a semi-flexible simulated annealing followed by a refinement in explicit water solvent. The default scaling energy terms were used as described previously (Dominguez et al. 2003).
To validate the protocol, the structure of the Abl complex was calculated and compared with the crystallographic structure.
Acknowledgments
We thank Stephen Martin for help in the analysis of the fluorescence data, the NMR Centre of NIMR for technical support, and David J. Thomas for critical reading of the manuscript. The work was supported by an EU grant.
Footnotes
Reprint requests to: Annalisa Pastore, National Institute for Medical Research, The Ridgeway, London NW71AA, UK; e-mail: apastor@nimr.mrc.ac.uk; fax: 44-20-8906-4477.
Article and publication are at http://www.proteinscience.org/cgi/doi/10.1110/ps.051785506.
Abbreviations: CD, circular dichroism; RP-HPLC, reverse-phase high-performance liquid chromatography; NMR, nuclear magnetic resonance; Tris, tris(hydroxymethyl)aminomethane; [θ], mean residue ellipticity; PAGE, polyacrylamide gel electrophoresis; SDS, sodium dodecyl sulphate; RP, reverse-phase; UV, ultraviolet; MS, mass spectrometry; ESI, electrospray ionization; TOF, time-of-flight; NTA, nitrilotriacetic acid; TEV, tobacco etch virus; IPTG, isopropyl-β-D-thiogalactopyranoside; Myo3, myosin-3 SH3 domain; Myo5, myosin-5 SH3 domain; SH3, Src homology-3; WAS, Wiskott-Aldrich syndrome; HSQC, heteronuclear single quantum coherence spectroscopy; NOE, nuclear Overhauser effect; NOESY, NOE spectroscopy; NOESY-HSQC, 15N-edited 1H-15N NOESY; TOCSY, total correlated spectroscopy; TOCSY-HSQC, 15N-edited three-dimensional 1H-15N TOCSY.
References
- Anderson B.L., Boldogh I., Evangelista M., Boone C., Greene L.A., Pon L.A. 1998. The Src homology domain 3 (SH3) of a yeast type I myosin, Myo5p, binds to verprolin and is required for targeting to sites of actin polarization J. Cell Biol. 141: 1357–1370. [DOI] [PMC free article] [PubMed] [Google Scholar]
- Arold S., O'Brien R., Franken P., Strub M.P., Hoh F., Dumas C., Ladbury J.E. 1998. RT loop flexibility enhances the specificity of Src family SH3 domains for HIV-1 Nef Biochemistry 37: 14683–14691. [DOI] [PubMed] [Google Scholar]
- Brannetti B. and Helmer-Citterich M. iSPOT:A web tool to infer the interaction specificity of families of protein modules Nucleic Acids Res. 31: 3709–3711. [DOI] [PMC free article] [PubMed]
- Brünger A.T. 1993. XPLOR: A system for X-ray crystallography and NMR, version 3.1 Yale University Press, New Haven, CT.
- Brünger A.T., Adams P.D., Clore G.M., DeLano W.L., Gros P., Grosse-Kunstleve R.W., Jiang J.S., Kuszewski J., Nilges M., Pannu N.S. 1998. Crystallography & NMR system: A new software suite for macromolecular structure determination. Acta Crystallogr D Biol. Crystallogr. 54: 905–921. [DOI] [PubMed] [Google Scholar]
- Cornilescu G., Delaglio F., Bax A.et al. 1999. Protein backbone angle restraints from searching a database for chemical shift and sequence homology J. Biomol. NMR 13: 289–302. [DOI] [PubMed] [Google Scholar]
- Dalgarno D.C., Botfield M.C., Rickles R.J. 1997. SH3 domains and drug design: Ligands, structure, and biological function Biopolymers 43: 383–400. [DOI] [PubMed] [Google Scholar]
- Derry J.M., Kerns J.A., Weinberg K.I., Ochs H.D., Volpini V., Estivill X., Walker A.P., Francke U. 1995. WASP gene mutations in Wiskott-Aldrich syndrome and X-linked thrombocytopenia Hum. Mol. Genet. 4: 1127–1135. [DOI] [PubMed] [Google Scholar]
- Dominguez C., Boelens R., Bonvin A.M. 2003. HADDOCK: A protein–protein docking approach based on biochemical or biophysical information J. Am. Chem. Soc. 125: 1731–1737. [DOI] [PubMed] [Google Scholar]
- Eccles C., Guntert P., Billeter M., Wuthrich K. 1991. Efficient analysis of protein 2D NMR spectra using the software package EASY.J. Biomol NMR 1: 111–130. [DOI] [PubMed] [Google Scholar]
- Evangelista M., Klebl B.M., Tong A.H., Webb B.A., Leeuw T., Leberer E., Whiteway M., Thomas D.Y., Boone C. 2000. A role for myosin-I in actin assembly through interactions with Vrp1p, Bee1p, and the Arp2/3 complex. J Cell Biol. 148: 353–362. [DOI] [PMC free article] [PubMed] [Google Scholar]
- Feng S., Chen J.K., Yu H., Simon J.A., Schreiber S.L. 1994. Two binding orientations for peptides to the Src SH3 domain: Development of a general model for SH3-ligand interactions Science 266: 1241–1247. [DOI] [PubMed] [Google Scholar]
- Fernandez-Ballester G., Blanes-Mira C., Serrano L. 2004. The tryptophan switch: Changing ligand-binding specificity from type-I to type-II in SH3 domains J. Mol. Biol. 335: 619–629. [DOI] [PubMed] [Google Scholar]
- Folmer R.H., Hilbers C.W., Konings R.N., Nilges M. 1997. Floating stereospecific assignment revisited: Application to an 18 kDa protein and comparison with J-coupling data J. Biomol. NMR 3: 245–258. [DOI] [PubMed] [Google Scholar]
- Geli M.I., Lombardi R., Schmelzl B., Riezman H. 2000. An intact SH3 domain is required for myosin I–induced actin polymerization EMBO J. 19: 4281–4291. [DOI] [PMC free article] [PubMed] [Google Scholar]
- Goodson H.V., Anderson B.L., Warrick H.M., Pon L.A., Spudich J.A. 1996. Synthetic lethality screen identifies a novel yeast myosin I gene (MYO5): Myosin I proteins are required for polarization of the actin cytoskeleton J. Cell Biol. 133: 1277–1291. [DOI] [PMC free article] [PubMed] [Google Scholar]
- Guerois R., Nielsen J.E., Serrano L. 2002. Predicting changes in the stability of proteins and protein complexes: A study of more than 1000 mutations J. Mol. Biol. 320: 369–387. [DOI] [PubMed] [Google Scholar]
- Ikura M. and Bax A. 1992. Isotope-filtered 2D NMR of a protein–peptide complex: study of a skeletal muscle myosin light chain kinase fragment bound to calmodulin J. Am. Chem. Soc. 114: 2433–2440. [Google Scholar]
- Irving J.A., Whisstock J.C., Lesk A.M. 2001. Protein structural alignments and functional genomics Proteins 42: 378–382. [DOI] [PubMed] [Google Scholar]
- Kainosho M. 1997. Isotope labelling of macromolecules for structural determination (NMR supplement) Nat. Struct. Biol. 4: 858–861. [PubMed] [Google Scholar]
- Kay L.E., Torchia D.A., Bax A. 1989. Backbone dynamics of proteins as studied by 15N inverse detected heteronuclear NMR spectroscopy: Application to staphylococcal nuclease Biochemistry 28: 8972–8979. [DOI] [PubMed] [Google Scholar]
- Kiel C., Serrano L., Herrmann C. 2004. A detailed thermodynamic analysis of Ras/effector complex interfaces J. Mol. Biol. 340: 1039–1058. [DOI] [PubMed] [Google Scholar]
- Kiel C., Wohlgemuth S., Rousseau F., Schymkowitz J., Ferkinghoff-Borg J., Wittinghofer F., Serrano L. 2005. Recognizing and defining true Ras binding domains II: In silico prediction based on homology modelling and energy calculations J. Mol. Biol. 348: 759–775. [DOI] [PubMed] [Google Scholar]
- Knapp S., Mattson P.T., Christova P., Berndt K.D., Karshikoff A., Vihinen M., Smith C.I., Ladenstein R. 1998. Thermal unfolding of small proteins with SH3 domain folding pattern Proteins 31: 309–319. [DOI] [PubMed] [Google Scholar]
- Lakowicz J.R. In Principles of fluorescence spectroscopy . 1999. 2nd ed. Kluwer Academic/Plenum, New York.
- Linge J.P., O'Donoghue S.I., Nilges M. 2001. Automated assignment of ambiguous nuclear Overhauser effects with ARIA Methods Enzymol. 339: 71–90. [DOI] [PubMed] [Google Scholar]
- Linge J.P., Williams M.A., Spronk C.A., Bonvin A.M., Nilges M. 2003. Refinement of protein structures in explicit solvent Proteins 50: 496–506. [DOI] [PubMed] [Google Scholar]
- Linge J.P., Habeck M., Rieping W., Nilges M. 2004. Correction of spin diffusion during iterative automated NOE assignment J. Magn. Reson. 167: 334–342. [DOI] [PubMed] [Google Scholar]
- Lipari G. and Szabo A. 1982. Model-free approach to the interpretation of nuclear magnetic resonance relaxation in macromolecules. 1. Theory and range of validity J. Am. Chem. Soc. 104: 4546–4559. [Google Scholar]
- Maciejewski M.W., Liu D., Prasad R., Wilson S.H., Mullen G.P. 2000. Backbone dynamics and refined solution structure of the N-terminal domain of DNA polymerase β: Correlation with DNA binding and dRP lyase activity J. Mol. Biol. 296: 229–253. [DOI] [PubMed] [Google Scholar]
- Martin S.R. and Bayley P.M. 2002. Regulatory implications of a novel mode of interaction of calmodulin with a double IQ-motif target sequence from murine dilute myosin V Protein Sci. 11: 2909–2923. [DOI] [PMC free article] [PubMed] [Google Scholar]
- Mayer B.J. 2001. SH3 domains: Complexity in moderation. J. Cell Sci. 1253–1263. [DOI] [PubMed]
- Mochida J., Yamamoto T., Fujimura-Kamada K., Tanaka K. 2002. The novel adaptor protein, Mti1p, and Vrp1p, a homolog of Wiskott-Aldrich syndrome protein-interacting protein (WIP), may antagonistically regulate type-I myosins in Saccharomyces cerevisiae Genetics 160: 923–934. [DOI] [PMC free article] [PubMed] [Google Scholar]
- Morton C.J. and Campbell I.D. 1994. SH3 domains: Molecular velcro Curr. Biol. 4: 615–617. [DOI] [PubMed] [Google Scholar]
- Musacchio A. 2002. How SH3 domains recognize proline Adv. Protein Chem. 61: 211–268. [DOI] [PubMed] [Google Scholar]
- Musacchio A., Saraste M., Wilmanns M. 1994. High resolution crystal structure of tyrosine kinase SH3 domains complexed to proline-rich peptides Nat. Struct. Biol. 1: 546–551. [DOI] [PubMed] [Google Scholar]
- Nguyen J.T., Porter M., Amoui M., Miller W.T., Zuckermann R.N., Lim W.A. 2000. Improving SH3 domain ligand selectivity using a non-natural scaffold Chem. Biol. 7: 463–473. [DOI] [PubMed] [Google Scholar]
- Nicastro G., Margiocco P., Cardinali B., Stagnaro P., Cauglia F., Cuniberti C., Collini M., Thomas D., Pastore A., Rocco M. 2004. The role of unstructured extensions in the rotational diffusion properties of a globular protein: The example of the titin i27 module Biophys. J. 87: 1227–1240. [DOI] [PMC free article] [PubMed] [Google Scholar]
- Nilges M. 1995. Calculation of protein structures with ambiguous distance restraints, automated assignment of ambiguous NOE crosspeaks and disulphide connectivities J. Mol. Biol. 245: 645–660. [DOI] [PubMed] [Google Scholar]
- Nilges M., Macias M., O'Donoghue S.I., Oschkinat H. 1997. Automated NOESY interpretation with ambiguous distance restraints: The refined NMR solution structure of the pleckstrin homology domain from β-spectrin J. Mol. Biol. 269: 408–422. [DOI] [PubMed] [Google Scholar]
- Okishio N., Nagai M., Fukuda R., Nagatomo S., Kitagawa T. 2000. Interactions of phosphatidylinositol 3-kinase Src homology 3 domain with its ligand peptide studied by absorption, circular dichroism, and UV resonance raman spectroscopies Biopolymers 57: 208–217. [DOI] [PubMed] [Google Scholar]
- Politou A.S., Spadaccini R., Joseph C., Brannetti B., Guerrini R., Helmer-Citterich M., Salvatori S., Temussi P.A., Pastore A. 2002. The SH3 domain of nebulin binds selectively to type-II peptides: Theoretical prediction and experimental validation J. Mol. Biol. 316: 305–315. [DOI] [PubMed] [Google Scholar]
- Ren R., Mayer B.J., Cicchetti P., Baltimore D. 1993. Identification of a 10-amino acid proline-rich SH3 binding site Science 259: 1157–1161. [DOI] [PubMed] [Google Scholar]
- Rodal A.A., Manning A.L., Goode B.L., Drubin D.G. 2003. Negative regulation of yeast WASP by two SH3 domain-containing proteins Curr. Biol. 13: 1000–1008. [DOI] [PubMed] [Google Scholar]
- Schweimer K., Hoffmann S., Bauer F., Friedrich U., Kardinal C., Feller S.M., Biesinger B., Sticht H. 2002. Structural investigation of the binding of a herpesviral protein to the SH3 domain of tyrosine kinase Lck Biochemistry 41: 5120–5130. [DOI] [PubMed] [Google Scholar]
- Schymkowitz J., Borg J., Stricher F., Nys R., Rousseau F., Serrano L. The FoldX Web server: An online force field. Nucleic Acids Res. 2005. 33: W382–W388. [DOI] [PMC free article] [PubMed] [Google Scholar]
- Sippl M.J. 1993. Recognition of errors in three dimensional structures of proteins Proteins 17: 355–362. [DOI] [PubMed] [Google Scholar]
- Smithgall T.E. 1995. SH2 and SH3 domains: Potential targets for anti-cancer drug design J. Pharmacol. Toxicol. Methods 34: 125–132. [DOI] [PubMed] [Google Scholar]
- Sorimachi H., Freiburg A., Kolmerer B., Ishiura S., Stier G., Gregorio C.C. 1997. Tissue-specific expression and α-actinin binding properties of the Z-disc titin: Implications for the vertebrate Z-discs J. Mol. Biol. 270: 688–695. [DOI] [PubMed] [Google Scholar]
- Tong A.H., Drees B., Nardelli G., Bader G.D., Brannetti B., Castagnoli L., Evangelista M., Ferracuti S., Nelson B., Paoluzi S. 2002. A combined experimental and computational strategy to define protein interaction networks for peptide recognition modules Science 295: 321–324. [DOI] [PubMed] [Google Scholar]
- Vidal M., Gigoux V., Garbay C.et al. 2001. SH2 and SH3 domains as targets for anti-proliferative agents Crit. Rev. Oncol. Hematol. 40: 175–186. [DOI] [PubMed] [Google Scholar]
- Viguera A.R., Arrendo J.L., Musacchio A., Saraste M., Serrano L. 1994. Characterization of the interaction of natural proline-rich peptides with five different SH3 domains Biochemistry 33: 10925–10933. [DOI] [PubMed] [Google Scholar]
- Vriend G. 1990. WHAT IF: A molecular modeling and drug design program J. Mol. Graph. 8: 51–55. [DOI] [PubMed] [Google Scholar]
- Vuilleumier S., Sancho J., Loewenthal R., Fersht A.R. 1993. Circular dichroism studies of barnase and its mutants: Characterization of the contribution of aromatic side chains Biochemistry 32: 10303–10313. [DOI] [PubMed] [Google Scholar]
- Woody R.W. 1995. Circular dichroism Methods Enzymol. 246: 34–71. [DOI] [PubMed] [Google Scholar]
- Yu H., Rosen M.K., Shin T.B., Seidel-Dugan C., Brugge J.S., Schreiber S.L. 1992. Solution structure of the SH3 domain of Src and identification of its ligand-binding site Science 258: 1665–1668. [DOI] [PubMed] [Google Scholar]
- Yu H., Chen J.K., Feng S., Dalgarno D.C., Brauer A.W., Schreiber S.L. 1994. Structural basis for the binding of proline-rich peptides to SH3 domains Cell 76: 933–945. [DOI] [PubMed] [Google Scholar]
- Xenarios I. and Eisenberg D. 2001. Protein interaction databases Curr. Opin. Biotechnol. 12: 334–339. [DOI] [PubMed] [Google Scholar]