

Abstract
About 30% of proteins require cofactors for their proper folding. The effects of cofactors on the folding reaction have been investigated with α-lactalbumin as a model protein and metal ions as cofactors. Metal ions accelerate the refolding of α-lactalbumin by lessening the energy barrier between the molten globule state and the transition state, mainly by decreasing the difference of entropy between the two states. These effects are linked to metal ion binding to the protein in the native state. Hence, relationships between the metal affinities for the intermediate states and those for the native state are observed. Some residual specificity for the calcium ion is still observed in the molten globule state, this specificity getting closer in the transition state to that of the native state. The comparison between kinetic and steady-state data in association with the Φ value method indicates the binding of the metal ions on the unfolded state of α-lactalbumin. Altogether, these results provide insight into cofactor effects on protein folding. They also suggest new possibilities to investigate the presence of residual native structures in the unfolded state of protein and the effects of such structures on the protein folding reaction and on protein stability.
Keywords: protein folding, cofactors, α-lactalbumin, Φ value
Cofactors are often required for the proper folding and the biological function of proteins. Metal ions such as copper, zinc, and calcium are among the most common. Despite the significant percentage of proteins concerned (~30%), the effect of cofactors on the protein folding reaction has been barely investigated (Goedken et al. 2000; Pozdnyakova et al. 2000; Apiyo and Wittung-Stafshede 2002; Wittung-Stafshede 2002). Nevertheless, as reviewed recently, common features could be recognized in the cofactor effect (Wittung-Stafshede 2002). In the presence of cofactors, the stability of the native state is increased and the folding reaction is dramatically accelerated. The latter observation further implies that cofactors can bind to unfolded or partially folded states of proteins. Nevertheless, the cofactor effects on the folding reaction remain poorly understood. Better characterization of their effects on the structure and energetics of the intermediate folding states are necessary. Toward that purpose, we report here a study with bovine α-lactalbumin (BLA) as a protein model and metal ions as cofactors.
BLA is a small α + β milk protein with a calcium ion (Ca2+) as cofactor (Permyakov and Berliner 2000). The main function of α-lactalbumin is the regulation of lactose synthesis. BLA contains four disulphide bridges and a high-affinity calcium-binding site within a hinge between two domains: an α-domain with four α-helices, and a β-domain with three small β-strands, a long loop, and a small 310 -helix. The calcium-binding site is an EF-hand-like site between the 310 -helix of the β-domain and an α-helix of the α-domain. The calcium ion binds to BLA with dissociation constants on the order of 10−6 to 10−8 M (Permyakov and Berliner 2000). Besides the changes within the binding site, the main effects of Ca2+ binding to the native structure of BLA have been reported within the region of interaction between the two domains of the protein (Chrysina et al. 2000; Wijesinha-Bettoni et al. 2001). In the presence of calcium, these interactions are tighter; i.e., the domain docking is optimized. As a consequence, the rigidity and stability of the protein are increased.
Calcium ions have typical cofactor effects on the stability and folding reaction of BLA. In the presence of Ca2+, the stability of the native state is greatly increased (Ikeguchi et al. 1986a) and the folding reaction is much faster (Kuwajima et al. 1989; Forge et al. 1999). The folding rate of the holo-form (i.e., the Ca2+-bound form) is three orders of magnitude larger than that of the apo-form (i.e., the Ca2+-depleted form). Two main steps can be distinguished in the folding reaction of BLA (Ikeguchi et al. 1986b; Kuwajima et al. 1989; Balbach et al. 1995; Forge et al. 1999). After a few milliseconds, a partially folded state is formed. This state, the so-called molten globule state (MG-state), contains a high secondary structure content but no stable tertiary structure. Then, in a second step, the native state (N-state) is formed at the expense of the MG-state. The rate of this second step is highly dependent on the presence of calcium (Kuwajima et al. 1989; Forge et al. 1999). This dependence has been interpreted in terms of binding of calcium to the intermediate states of the folding reaction: the MG-state and the transition state (T-state) (Kuwajima et al. 1989). According to hydrogen/deuterium exchange experiments, the region of the calcium-binding site is partially stabilized in the MG-state (Forge et al. 1999). The large calcium effect on the folding rate indicates that the T-state also binds Ca2+ with a much better affinity than the MG-state in order to diminish the energy barrier of the folding reaction. The presence of a native-like tertiary structure in the region of the calcium-binding site in the T-state has been shown recently for the goat α-lactalbumin by protein engineering methods (Saeki et al. 2004). Altogether, these results suggest that, upon the binding of Ca2+ to the MG-state, the calcium binding site acts as a nucleus for the stabilization of the tertiary structure in the rest of the protein. In the absence of this nucleus, the formation of the tertiary structure is much slower. Then, the secondary structure changes can be intricate, and non-native structures can be transiently formed (Troullier et al. 2000).
All the metals of the alkaline-earth cation series can bind to the high-affinity calcium site (HACS), more particularly the divalent cations Mg2+, Ca2+, Sr2+, and Ba2+ (Desmet et al. 1991; Permyakov and Berliner 2000). The two remaining metal cations, Be2+ and Ra2+, are not used for such experiments because of their high toxicity. With the exception of Mn2+, the other metal ions do not bind to this site (Desmet et al. 1991). They can bind to another binding site of much lower affinity and specificity. A detailed characterization of the thermodynamics of metal binding to the HACS site has shown that the binding site is optimized for the calcium ion (Desmet et al. 1991). Bell-shaped dependence of the thermodynamic parameters (the binding constants and the enthalpy changes) on the ionic radius is observed, and the parameters obtained for Ca2+ are at the optimum. We have taken advantage of these properties of HACS to gain insight into its structure at various stages of the folding reaction of BLA. The binding of various metal ions to the two intermediate states involved in the reaction (MG- and T-states) has been characterized with a method similar to that previously used to characterize calcium's effect on the folding reaction (Kuwajima et al. 1989). The Φ values, the parameters used to characterize the T-state in the folding of small proteins by protein engineering methods (Matouschek et al. 1990; Fersht et al. 1992; Fersht 2000), have also been used. The effects of the metal ions on the energy barrier between the MG- and T-states have also been characterized in detail. All together, these results provide further insight into the effect of cofactors on protein folding.
Results
Conformation of the apo-form of BLA
The state of BLA in the absence of calcium depends on the ionic strength of the solution. At low ionic strength, the apo protein is in the MG-state, while at high ionic strength, tertiary structure is stabilized and the protein is in the N-state (Kuwajima et al. 1989; Wijesinha-Bettoni et al. 2001). As a preliminary step to the study of the effect of metal ions on the refolding of BLA, we have checked that in our conditions (100 mM Tris-HCl at pH 7.3 and 20°C) the apo-form of BLA is in the N-state, i.e., contains tertiary structure. Figure 1 shows the NMR spectra of BLA in various states. At pH 2 (Fig. 1a), the protein is in the MG-state, and the NMR spectrum possesses all the characteristics of a molten globule spectrum: weak dispersion and broad resonances due to internal dynamics on the msec timescale. The NMR spectrum of the holo-form (Fig. 1c) is highly dispersed with up-field resonances characteristic of the presence of stable tertiary structure. Up-field resonances are also observed in the NMR spectrum of our apo-form (Fig. 1b). They indicate that the tertiary structure is stabilized in our conditions. They are, however, broader than in the case of the holo-form as a consequence of the larger flexibility of the apo-form. The NMR spectrum of the apo-form (Fig. 1b) and the differences with the spectrum of the holo-form (Fig. 1c) are in agreement with those reported by Wijesinha-Bettoni and colleagues (2001). The intensity of the CD spectrum in the near-UV of the apo-form is smaller (~20%) than that of the holo-form (Fig. 2a). The spectrum of the MG-state stabilized at acidic pH is shown for comparison. There are two possible explanations for this effect: Either the thermal unfolding has already begun at 20°C and only 80% of the protein is in the N-state, or the intensity of the signal in the near-UV is smaller due to larger internal dynamics of the protein in the apo-form. The thermal unfolding curve monitored by changes of the CD signal at 270 nm is shown in Figure 2b. According to the parameters of the thermal unfolding (Fig. 2 legend), 5% of the protein is unfolded at 20°C. Therefore, the differences between the holo- and the apo-forms, which are detected in the NMR spectra, reflect changes in the internal dynamics of the protein. The apo-form is much more dynamic than the holo-form, as shown by the peak broadening of the NMR spectrum and the weaker protection against hydrogen/deuterium exchanges of the apo-form (Wijesinha-Bettoni et al. 2001). The smaller intensity of the near-UV CD spectrum of the apo-form is at least in part due to the small partial unfolding of the apo-form at 20°C. However, the comparison between the CD spectra of the apo- and holo-forms suggests that the internal dynamic of the protein may have an effect on the intensity of the signal in the near-UV (Fig. 2).
Figure 1.
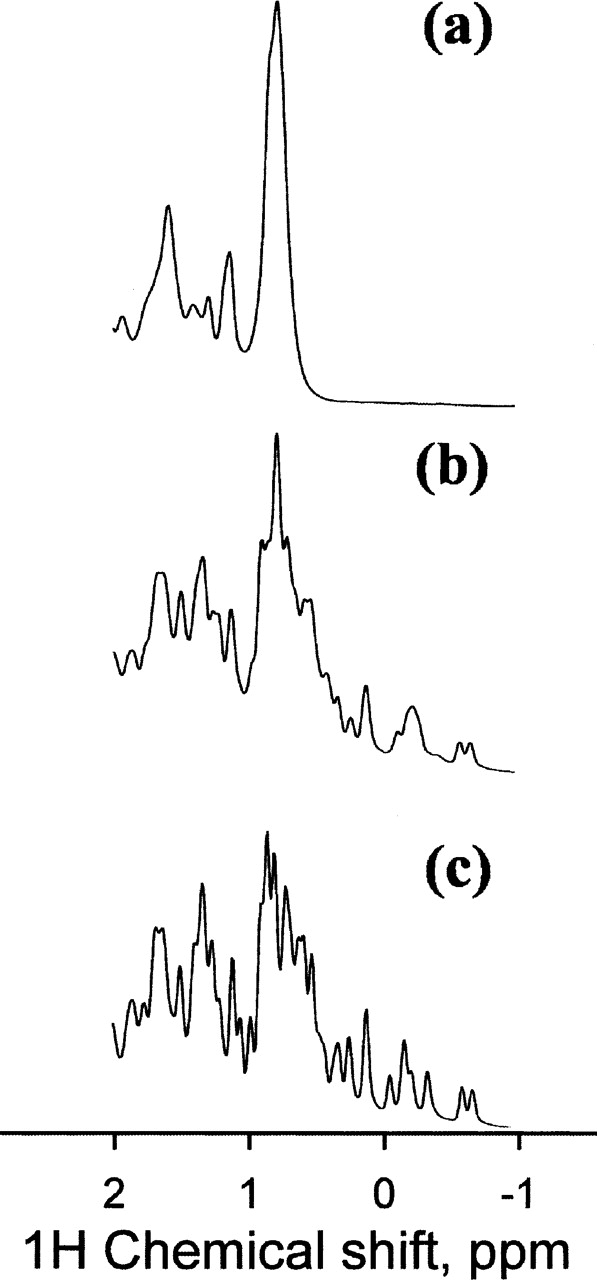
1H NMR spectra of the various states of BLA. Only the up-field aliphatic region of the spectrum is shown. The protein concentration is 10 mg/mL, and the temperature is 20°C. (a) The MG-state at pH 2. (b) The apo-form in the presence of 100 mM Tris-HCl and 10 mM EDTA at pH 7.3. (c) The holo-form in the presence of 100 mM Tris-HCl and 30 mM CaCl2 at pH 7.3.
Figure 2.
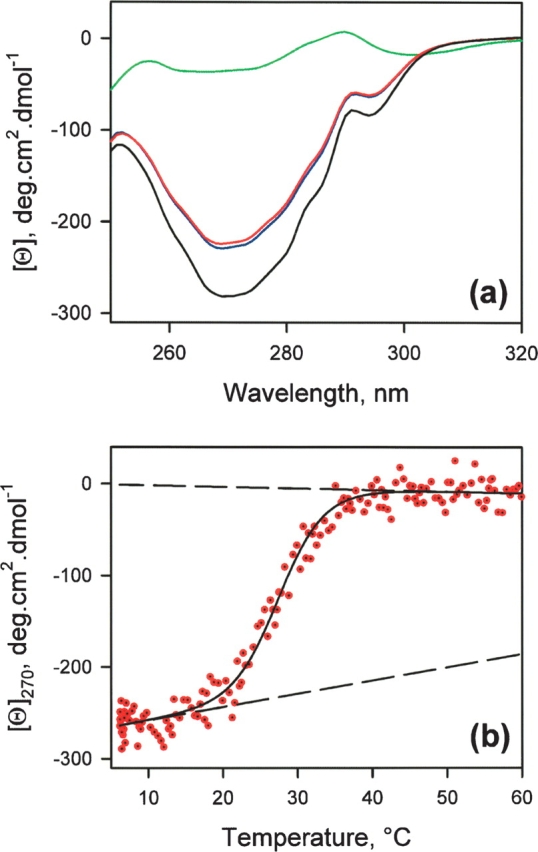
(a) Near-UV CD spectra of BLA in the presence of 100 mM Tris-HCl at 20°C: (black line) in the presence of 30 mM CaCl2, (red line) in the presence of 1mM EDTA, (blue line) in the presence of 1 mM EGTA, (green line) the MG-state at pH 2. (b) Thermal unfolding of the apo-form of BLA in the presence of 100 mM Tris-HCl and 1 mM EDTA monitored at 270 nm. The continuous line corresponds to the best fit of the data, as described in Materials and Methods. The thermodynamic parameters are ΔHVH = 248.5 kJ/mol and Tm = 27.8°C. The dashed lines illustrate the pre- and post-transitional dependencies of the CD signal.
Binding of various metals to the reaction intermediates of the BLA refolding
Intrinsic fluorescence changes have been used to monitor the refolding kinetics of BLA in the absence or presence of various concentrations of metal ions. The initial state of the reaction is the MG-state stabilized at pH 2 (Dolgikh et al. 1981; Kuwajima 1996). We have chosen this state instead of the fully unfolded state in 6 M GuHCl in order to avoid the presence of residual GuHCl during the folding reaction. Indeed, GuHCl can compete with metal ions for the binding to BLA. As the aim of this study is to compare the binding of the metal ions to the intermediate states of the folding reaction with their binding to the N-state, any possible interference between the metal ions and GuHCl must be removed. Moreover, the use of chelators (EGTA or EDTA) is needed to control the metal ion concentrations for the measurements of the binding curves to the N-state (see Materials and Methods). For this purpose, the constants for binding of the metal ions to the chelators must be known as precisely as possible, and the GuHCl effects on these constants are unknown. One can note here that the choice of the chelator (EDTA or EDTA) has no effect on the N-state (Fig. 2a). Lastly, the transition from the unfolded state (U-state) to the MG-state is too fast to be recorded in our experiments (Forge et al. 1999). Therefore, no information on the kinetics is lost when starting the reaction from the MG-state. For similar reasons, only the folding reaction is considered. The effects of metal on the unfolding kinetics have not been investigated because of difficulties in estimating the effect of high denaturant concentrations on the binding of the metal ions.
The refolding kinetics are highly sensitive to the presence of the various metals (Fig. 3). The kinetics comprise two phases, but only the fastest one, which represents ~90% of the fluorescence change recorded during the folding reaction, is considered. This point has already been discussed by Kuwajima and colleagues (1989). Figure 3a shows the folding kinetics recorded in the presence of various concentrations of Ca2+. The folding rate increases with Ca2+ concentration and reaches a plateau at concentrations of ~30 mM (Figs. 3a 4a). The other metal ions known for their abilities to bind to HACS are also able to accelerate the folding reaction, but to a lesser extent. Figure 3b shows the refolding kinetics in the presence of 30 mM of the various metal ions. The refolding kinetics of the apo-form, i.e., in the presence of EDTA, is also shown for comparison. Other metal ions known to bind only to the low-specificity metal site (LSMS) of BLA, such as Zn2+, Co2+, and Cd2+, do not accelerate the folding reaction of BLA. The only effect of these metal ions on the folding reaction is to induce the aggregation of BLA (data not shown). The refolding kinetics recorded in their presence is close to that of the apo-form. This is illustrated with the refolding recorded in the presence of 10 mM Zn2+ (Fig. 3b); the protein aggregates in the presence of higher concentrations. The small acceleration observed in the presence of Zn2+ (Fig. 3b) can be attributed to residual Ca2+, because no EDTA is added for this experiment.
Figure 3.
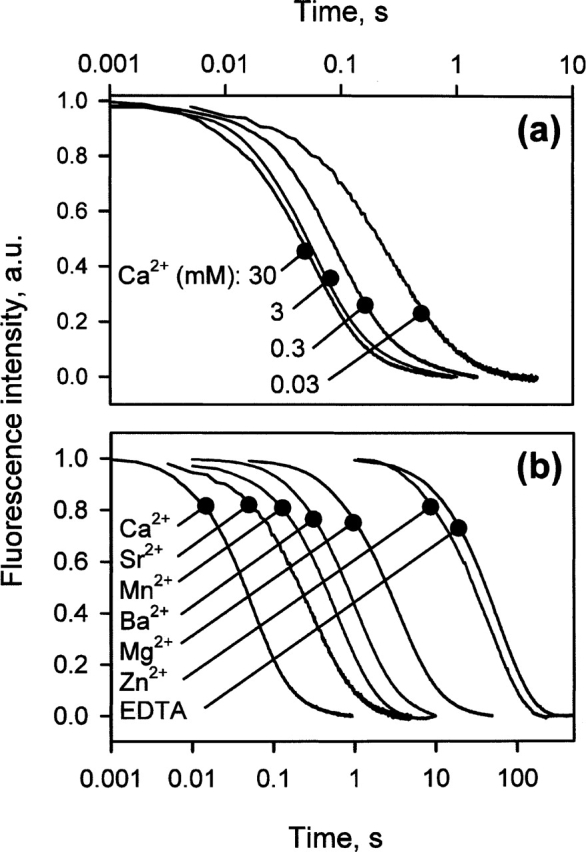
Metal ion effects on the refolding kinetics of BLA. (a) Refolding kinetics in the presence of various concentrations of Ca2+. (b) Refolding kinetics in the presence of 30 mM of the different metal ions, with the exception of Zn2+ (10 mM). For the apo-form, the refolding is monitored in the presence of 1 mM EDTA. The kinetics deduced from the fitting procedure are hardly distinguishable from the data. As a consequence, they are not shown.
Figure 4.
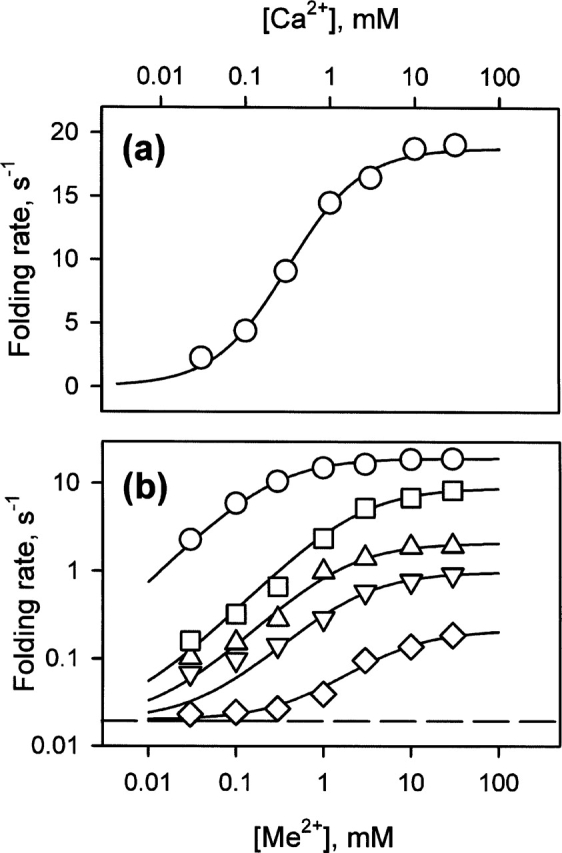
Folding rate dependencies. (a) Ca2+ dependence of the folding rate. (b) Metal ion dependence of the folding rates: (circles) Ca2+, (squares) Sr2+, (triangles) Mn2+, (inverted triangles) Ba2+, and (diamonds) Mg2+. The folding rate of the apo-form is marked by a dashed line. The continuous lines correspond to the best fits used to extract the dissociation constants of the MG- and T-states (given in Table 1), as described in Materials and Methods. The experimental errors are within the size of the symbols.
The dependence of the folding rate on the concentration of the various metal ions is shown in Figure 4b on logarithmic scales to facilitate the comparison between the various metals and with the apo-form (0.020 sec−1; marked by a dashed line in Fig. 4b). The extent of acceleration is strongly dependent on the metal. The largest acceleration is observed for Ca2+, while Mg2+ has the least effect (Fig. 4b). As reported by Kuwajima and coworkers (1989), the acceleration of the folding reaction in the presence of metal ions implies their binding to the MG- and T-states. The dissociation constants of the metal ions for the MG-state (KMG) and the T-state (KT) can be extracted from these dependencies (Kuwajima et al. 1989; see Materials and Methods). They are given in Table 1, together with the kmax (the maximum folding rate) for each metal. The dissociation constants of Ca2+ for the MG- and T-states are slightly lower than those reported by Kuwajima and colleagues (1989). These differences can be explained by the differences in the experimental conditions; the experiments reported by Kuwajima and his colleagues were performed in the presence of high concentrations of NaCl and GuHCl.
Table 1.
Dissociation constants of metal ions for the various states involved in the folding reaction

aFolding rates in the presence of saturating concentrations of metal ions and in the presence of EDTA (apo-form). The relative errors in these parameters are ∼10%.
bThe values of DH‡ determined from the slopes of the Eyring plots (Fig. 9).
Relationship of binding to the native state
Figure 5 shows the binding curves of the various metal ions to the N-state under conditions identical to those of the folding reaction. According to the thermal unfolding monitored in the near-UV CD, ~95% of the apo-form is refolded at 20°C. The metal binding curves are interpreted as the binding of the metal ions to the N-state. We consider that the 5% of unfolded protein in the absence of metal has no significant effect on the binding monitored here. The binding of metal ions to the N-state induces a blue shift of the fluorescence spectrum that can be monitored with high sensitivity using parameter A (see Materials and Methods). The binding occurs over very different concentration ranges depending on the metal ion (Fig. 5). Ca2+ binds at concentrations between 1 and 100 nM, and, at the other extreme, Mg2+ binds at concentrations between 100 μM and 10 mM. Table 1 gives the values of the dissociation constants extracted from these binding curves (KN). As previously noticed by Desmet et al. (1991), there is a regular bell-shaped dependence of the dissociation constant for the N-state on the ionic radius of the metal ion, with an optimum for Ca2+ (Fig. 6). Similar bell-shaped dependencies are observed for the dissociation constants for the MG- and T-states (Fig. 6), suggesting that the metal ions that accelerate the folding reaction of BLA bind to the same site on the intermediate states and on the N-state. These metal ions are known to bind to HACS. According to Desmet and colleagues (1991), the other metal ions bind to LSMS only and do not obey this empirical relationship. It has been proposed that Mg2+ does not bind to HACS but does bind to LSMS (Noyelle and Van Dael 2002). According to our results, however, Mg2+ has the same effects on the refolding kinetics (Fig. 4b) and on the fluorescence spectrum (parameter A in Fig. 5) as the other metal ions known to bind to HACS. Therefore, we consider here that Mg2+ binds to HACS, in agreement with earlier studies (Murakami et al. 1982; Permyakov et al. 1985, 1987; Ostrovsky et al. 1988; Desmet et al. 1991; Permyakov and Berliner 2000).
Figure 5.

Binding curves of the different metal ions: (circles) Ca2+, (squares) Sr2+, (triangles) Mn2+, (inverted triangles) Ba2+, and (diamonds) Mg2+. pMe = −log[Me2+], where Me2+ designs the various metal ions used. The continuous lines correspond to the best fits of the data to the binding equation, as described in Materials and Methods. The dissociation constants are given in Table 1.
Figure 6.

Dependencies of the dissociation constants on the ionic radius: (triangles) N-state, (squares) T-state, and (circles) MG-state. The ionic radii are taken from Desmet et al. (1991). The errors are within the size of the symbols.
As shown in Figure 7a, the dependence of Ln kmax as a function of Ln KN follows the Brønsted equation, showing that the folding reaction of BLA is governed by a single transition state (Permyakov et al. 1985). Brønsted's β value is 0.41, determined as the slope of the linear dependency. Ln KMG and Ln KT also have linear relationships with Ln KN (Fig. 7b). The parameters of the linear relationships are given in the legend for Figure 7. In the case of the MG-state, the slope is ~0.25, while it is ~0.65 in the case of the T-state. Ln KMG and Ln KT are not only proportional to Ln KN, but there are offsets in the linear dependencies that are quite close for both cases. As an obvious consequence of these offsets, some of the metal ions tend to have better apparent affinity for the T-state than for the N-state (this is more obvious for Mg2+) (Fig. 7b).
Figure 7.
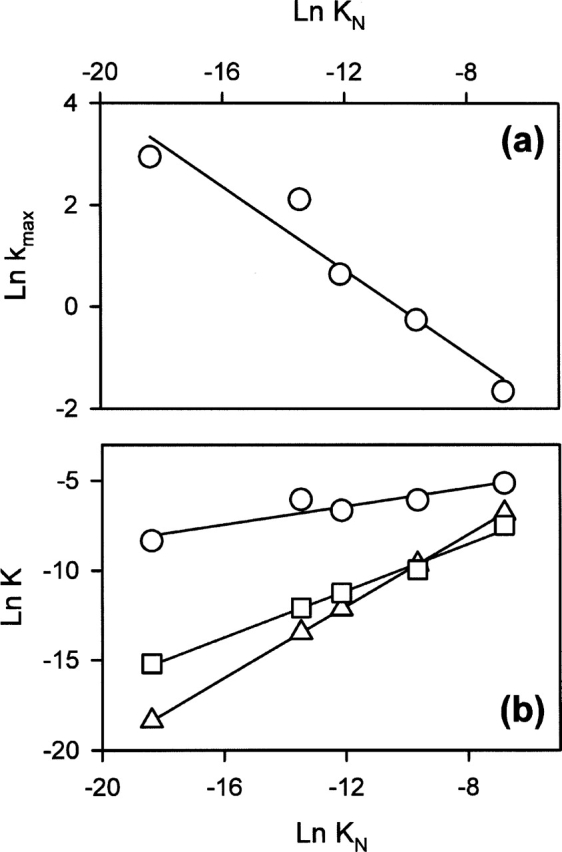
(a) Brønsted plot of Ln kmax as a function of Ln KN. Brønsted's coefficient = 0.41 ± 0.06; this is the slope of the linear regression (continuous line). (b) Relationships between the dissociation constants—(circles) MG-state, (squares) T-state, and (triangles) N-state–are given for comparison. The parameters of the linear regression (continuous lines): slope = 0.25 ± 0.05 and constant = −3.35 ± 0.30 for the MG-state, and slope = 0.65 ± 0.05 and constant = −3.30 ± 0.30 for the T-state. The errors are within the size of the symbols.
A possible explanation for the offsets in the linear dependencies can be that, in our apo-form, the protein is not fully refolded but in equilibrium between the N-state and the MG-state. In that case (see Materials and Methods), we have a simple relationship between the real dissociation constant for the N-state, KN∗ (K1 in Materials and Methods), and the measured one, KN (Kapp in Materials and Methods). This relationship is Ln KN∗ = Ln KN − Ln (1 + K2), where K2 is the equilibrium constant between the MG- and N-states in the conditions used here: K2 = MG/N. In the case in which we consider a proportional relationship between the dissociation constant of the intermediate states (KI, which corresponds to either KMG or KT) and the real dissociation constant for the N-state (KN∗), Ln KI = a Ln KN∗, we obtain the following equation: Ln KI = a Ln KN∗ − a Ln (1+K2). Hence, we obtain an offset in the linear dependence between Ln KI (either Ln KMG or Ln KT) and Ln KN . However, estimations of K2 from the parameters of the linear dependencies give unrealistic values: 6.6 × 10⁵ for “Ln KMG versus Ln KN” and 1.6 × 10² for “Ln KMG versus Ln KN.” According to these values, the protein should be practically 100% in the MG-state in the conditions of the apo-form; the thermal unfolding (Fig. 2b) shows that >90% of the protein is in the N-state. Moreover, the value of K2 should not depend on the linear dependence used for its estimation, and, obviously, this is not the case. The value of K2 at 20°C can be estimated from the thermal unfolding parameters: 95% of the protein in the N-state gives a value for K2 ~5 × 10⁻². Then, the estimated offsets are −0.013 for “Ln KMG versus Ln KN ” and −0.033 for “Ln KMG versus Ln KN .” These values are negligible compared with those observed in Figure 7b. The nature of this offset will be discussed further later.
The Φ value characterization
These values are defined as the ratio between free energy change of an intermediate and that of the N-state. The free energy changes are induced classically by amino acid mutations (Matouschek et al. 1990; Fersht et al. 1992, 1994; Dalby et al. 1998; Fersht 1999, 2000; Fowler and Clarke 2001; Jager et al. 2001; Northey et al. 2002; Friel et al. 2003). However, this method is also applicable with other types of perturbations, such as pH or temperature changes (Sanchez and Kiefhaber 2003). This method has been extensively used to characterize transition states, but it is applicable to other intermediate states (Capaldi et al. 2002). In our case, the perturbation is the binding of various metal ions; this binding can be considered as a probe of the tertiary structure in the HACS region of the protein. For the various states involved in the folding reaction of BLA, the dissociation constants are directly related to their stabilization by the binding of the metal ions. The U-state should be used for the Φ value calculations (Fersht 1999). In the kinetic experiments, however, only the transition between the MG- and the N-states is monitored. As a consequence, we have no way of detecting changes in ΔG betweenthe U-and the MG-states. Moreover, the energy changes drawn from the kinetic experiments are not sensitive to changes in the U-state. Therefore, the Φ values were calculated with another reference state; i.e., the N-state (either the apo-or the holo-form). Nevertheless, possible effects of the metal ions on the U-state will be discussed.
When the apo-form is used as the reference state, the addition of metals is equivalent to stabilizing perturbations. The Φ values are calculated for a concentration of metal ion equal to 30 mM, and the ΔGs of binding are determined from the dissociation constants as described by Schellman (1975; see Materials and Methods). The behavior of Φ is not as expected; i.e., values between 0 and 1 and constant over a large range of ΔG (Fersht 1999). The Φ values show a regular increase with ΔGN that reflects the stabilization of the N-state upon binding of metal ions (Fig. 8a). This behavior is confirmed with the “theoretical” dependence of the Φ value calculated from the relations between the dissociation constants shown in Figure 7b. Hence, for the T-state, the Φ values increase regularly as the ΔG of binding to the N-state decreases, i.e., as the affinity of the metal decreases and Φ becomes >1 for Ba2+ and Mg2+. A similar behavior is observed for the MG-state, but the Φ values remain within the “classical” range (Fig. 8a).
Figure 8.
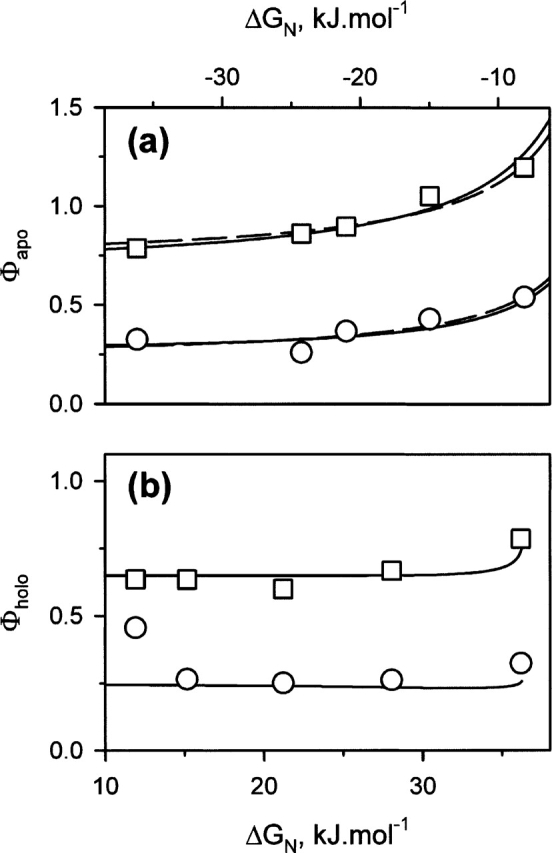
Φ values obtained for the MG-state (circles) and for the T-state (squares). (a) The apo-form is used as the reference. The addition of metal ions corresponds to stabilizing perturbations. As a consequence, the values of ΔGN are negative. The dashed lines correspond to the best fits of the equation given in the main text to the data. (b) The holo-form is used as the reference. The other metal ions (and the apo-form) are considered as a destabilizing perturbation of the Ca-bound form. This is the reason for the positive values of ΔGN ; the largest value corresponds to the apo-form. The energies of binding and the Φ values are calculated as described in Materials and Methods. The continuous lines correspond to the theoretical dependence of the Φ value with ΔGN, calculated with the relations found in Figure 7b.
When the reference state is the holo-form (Ca-bound, i.e., the most stable state of the protein), the absence of metal ion within the HACS and the binding of the other metal ions are considered as destabilizing perturbations of the N-state. For the T-state, the Φ values are between 0.6 and 0.8, while they are ~0.25 for the MG-state (Fig. 8b). The Φ values have the expected and commonly described behavior, i.e., they remain constant over a broad range of ΔGN . This behavior is confirmed with the theoretical dependence of the Φ value. Despite a small increase for the apo-form, theoretical values of Φ are constant over the ΔGN range covering all the metal ions and equal to 0.24 for the MG-state and 0.66 for the T-state (Fig. 8b). Note that these values are close to the slopes of the linear dependencies between the dissociation constants (Fig. 7b).
Nature of the energy barrier
In order to gain insight into the metal ion effect on the energy barrier between the MG-state and the T-state, the refolding kinetics have been recorded at various temperatures for the different metals and for the apo-form. In these experiments, the metal ion concentration is 30 mM. At this concentration, the effect on the folding rate is at its maximum for every metal (Fig. 4b). The Eyring plots obtained for the various metals are shown in Figure 9. The maximum temperature considered is variable (see Fig. 9 legend; Materials and Methods), because the stability of BLA depends on the presence of metal ions and on the nature of the metal ion. In the case of the apo-form, for instance, the highest temperature is 293 K because the protein is not fully refolded at higher temperatures (Fig. 2b). Besides the shifts due to different folding rates for the various metal ions, the slopes of the temperature dependencies seem pretty similar. The enthalpy barrier between the MG-state and the T-state (ΔH‡) is related to the slope of the Eyring plot (see Materials and Methods). The values of ΔH‡ extracted from the temperature dependencies are given in Table 1 for the various forms of BLA. With the exception of Mg2+ and Mn2+, which have slightly lower values, ΔH‡ is quite similar for all metals. More surprisingly, the values observed for the folding reaction in the presence of Ca2+ and for the apo-form are very close, despite the difference of three orders of magnitude between the folding rates of these two forms.
Figure 9.

Eyring plots for the various forms of BLA: (circles) Ca2+, (squares) Sr2+, (triangles) Mn2+, (inverted triangles) Ba2+, (diamonds) Mg2+, and (hexagons) apo-form. The concentration of the metal ions is 30 mM, and the concentration of EDTA in the case of the apo-form is 1 mM. The continuous lines are the best fits to the Eyring equation. The highest temperatures are 293 K for the apo-form, 298 K for Mg2+,308K for Ba2+ and Mn2+, and 312 K for Ca2+ and Sr2+.
In order to gain further insight into the nature of the energy barrier between the MG-state and the T-state, the metal effect on the free energy barrier (ΔΔG‡) was estimated from the changes of the folding rates at 293 K (see Materials and Methods; Fig. 10, green circles). Such calculations of ΔΔG‡ are commonly used to estimate the effect of mutations on the energy barrier of a protein folding reaction. Hence, the effects reported are independent of the pre-exponential factor of the relationship between the observed folding rate and the free energy barrier, according to the transition state theory (Fersht 1999). Indeed, the pre-exponential factor is not known with accuracy in the case of proteins (Fersht 1999). As the apo-form is used as the reference state, large positive values of ΔΔG‡ indicate small free energy barriers between the MG- and the T-states. The value of ΔΔG‡ depends on the metal ion, and a maximum is observed for Ca2+, the ion with the smallest energy barrier (see above). The values of ΔΔH‡ calculated from the ΔH‡ reported in Table 1 are also shown in Figure 10 (red squares), together with the values of −TΔΔS‡, which corresponds to the gap between ΔΔG‡ and ΔΔH‡. In the same way as ΔΔG‡, larger positive values of −TΔΔS‡ indicate smaller differences of entropy between the MG-state and the T-state. Both ΔΔG‡ and −TΔΔS‡ show bell-shaped dependencies on the ionic radius (Fig. 10a), similar to that of the dissociation constants (Fig. 6). This suggests that the main effect of the metal ions on the energy barrier between the MG-state and the T-state is related to the entropy change. The metal ions accelerate the folding reaction by decreasing the entropy lost between the MG-state and the T-state, and this effect is related to the binding of the metals to the N-state (Fig. 10b). The values of ΔΔG‡, ΔΔH‡, and −TΔΔS‡ are plotted as a function of Ln KN (Fig. 10b). Despite the data dispersion due to the errors in the calculated values, it is obvious that changes of the free energy barrier and of the entropy barrier are correlated to each other and to the affinity of the metal ion for the N-state, while the variations of the enthalpy barrier are smaller.
Figure 10.
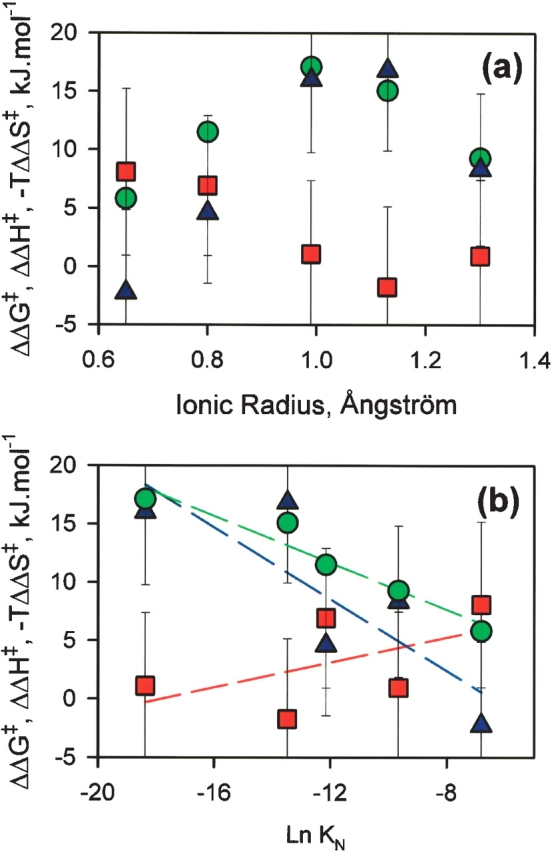
Changes of the energy barrier between the MG-state and the T-state with the apo-form as the reference state: (red squares) ΔΔH‡ = ΔH‡apo −ΔH‡Met (the values of ΔH‡ are the values of activation enthalpy calculated from the slopes of the Eyring plots; see Materials and Methods); (green circles) ΔΔG‡ =RT Ln(kmax /kapo) for each metal ion calculated from the kmax at 293 K (see Materials and Methods); (blue triangles) −TΔΔS‡ is the difference between the values of ΔΔH‡ and ΔΔG‡ calculated for each metal ion. These values are plotted as a function of the ionic radius of the metal ions (a) and as a function of Ln KN (KN being the dissociation constants for the N-state) (b). The dashed lines are linear regressions; they are shown to facilitate the localization of the various dependencies.
Discussion
The divalent metal ions belonging to the alkaline-earth series are able to accelerate the refolding of BLA. With the exception of Mn2+, the other divalent metal ions do not present this property. Their only effect on the folding reaction is to increase the tendency of the protein to aggregate. As a consequence, the effects of the metal ions described here are interpreted as the consequence of their binding to HACS. The step of the folding reaction monitored here is the transition between the MG- and N-states. Transition-state theory is used to interpret the effect of the metal ions on the folding reaction. The Brønsted behavior of the folding rates (Fig. 7a) suggests that the folding reaction is controlled by a single transition state between the MG- and N-states. The relationships between the dissociation constants (Fig. 7b) show that, despite lower affinities and specificities, the structure of the HACS region in the partially folded states shares similarities with the N-state. In the case of the MG-state, for instance, the dissociation constants are several orders of magnitude lower than those with the N-state, i.e., a fraction of millimolar in the case of Ca2+, and a small specificity for Ca2+ is still observed (Figs. 6, 7b). This indicates the presence of native features around HACS. This region of the protein is already partially stabilized in the MG-state according to H/D exchange experiments combined with NMR (Forge et al. 1999). In the case of the T-state, the linear dependency is steeper, indicating that the properties of the binding site in this state are closer to those of the N-state (Fig. 7b). More particularly, the specificity for Ca2+ is more pronounced than in the MG-state (Fig. 6).
Surprisingly, some of the metal ions tend to have better apparent affinities for the T-state than for the N-state (Fig. 7b). This effect is significant because it results from the overall tendency of the relationship between KT and KN. The reason for this tendency is the offsets between the dissociation constants for the MG- and T-states and those for the N-state. We have already demonstrated that these offsets are not due to a possible equilibrium between the N- and the MG-states in the apo-form. The origin of these offsets should be found in the fact that we compare parameters obtained from two different kinds of experiments. The dissociation constants for the intermediate states of the folding reaction are drawn from the metal ion effect on the refolding kinetics. Therefore, they reflect only the changes of the energy barrier between the MG- and T-states. Changes in the U-state have no effect on this barrier and, therefore, are not detected during the kinetics. The dissociation constants for the N-state are obtained from measurements at equilibrium; they represent the increase of stability of the holo-form due to the binding of the metal ions (Schellman 1975). As protein stability is defined with the U-state as reference, possible changes on the free energy of this state due to the presence of metal ions are contained in the measured dissociation constants. Therefore, changes in the U-state upon the addition of metal ions may explain the offsets observed in the relationship between the dissociation constants. Such changes would have a contribution to the dissociation constants of the N-state but not to those of the reaction intermediate states. These possible effects of the metal ions on the U-state should also have some influence on the Φ values calculated with either the holo-form or the apo-form as the reference state, while the U-state should be the reference. When the holo-form is used as the reference (Fig. 8b), the Φ values are the same for all metal ions considered here. This shows that the energy level of the U-state is constant for all metal ions. On the other hand, the increase in the Φ value obtained with the apo-form as the reference, suggests that the energy level of the U-state in the case of the apo-form (in the absence of metal ion) is different from that in the presence of metal ions. In that case, the Φ values calculated from the dissociation constants of the metal ions for the various states of the protein (Fig. 8a) should obey the following equation: Φc = Φr + ΔGU / ΔGN, where Φc is the Φ value calculated with the parameters obtained by kinetic and equilibrium measurements and shown in Figure 8; Φr is the “real” Φ value corresponding to the value we should obtain with the U-state as the reference state; ΔGU is the metal ion effect on the energy level of the U-state (it is a constant in the equation, together with Φr); and ΔGN corresponds to the effect of the metal ion binding to the N-state. In the case of the T-state, the fitting of this equation to the data provides the following values for Φr and ΔGU: 0.70 ± 0.05 and −4.3 ± 0.6 kJ/mol, respectively. In the case of the MG-state, these values become Φr = 0.22 ± 0.04 and ΔGU = −2.6 ± 0.7 kJ/mol. The values of Φr are close to the values of Φ obtained in the presence of metal ions with the holo-form as the reference (0.66 for the T-state and 0.24 for the MG-state) (Fig. 8b) and, therefore, are in agreement with the expected values. The values of ΔGU for the MG- and T-states are quite close (as expected) and indicate that the U-state is slightly stabilized in the presence of metal ions. This effect of the metal ions on the U-state seems unspecific and corresponds to a dissociation constant of the order of 10−2 M. We have no way to determine whether this effect is due to binding to HACS or to other nonspecific sites on the protein. Note that the ΔGU obtained from the changes of Φ with the apo-form as the reference state can also explain the slight increase in Φ observed for the apo-form when the holo-form is the reference (Fig. 8b). The effect of the metal ions on the U-states can also explain the offsets in the relations between the dissociation constants of the reaction intermediates and those of the N-state and, as a consequence, the apparent better affinities for the T-state than for the N-state (Fig. 7b). Intuitively, ΔGU must be related to the offsets found in the relationships between the dissociation constants of the various states (Fig. 7b), but we could not find any simple relationship between them.
The metal ions recognized by HACS bind to all states of BLA involved in the folding reaction, from the U- to the N-states. With the exception of binding to the U-state, binding to the intermediate states presents some similarities with that of the N-state. The main effect of the cofactors on the folding reaction is to decrease the energy barrier between the MG- and the T-states. This is a consequence of a much better affinity for the second one. The largest effect is observed on the entropy component of the barrier (Fig. 10). This entropy barrier is the sum of several contributions that are difficult to distinguish. In our case, contributions that describe both the protein folding and the metal ion association are required. The protein folding part gives two components (Lee et al. 1994; Makhatadze and Privalov 1996): ΔSsolvent and ΔSconfiguration. The first one, ΔSsolvent, counts mainly for the burying of the hydrophobic side chains, i.e., the hydrophobic effect, and is favorable to the reaction. The second contribution is the configurational entropy of the protein, ΔSconfiguration, which is unfavorable to the reaction. Indeed, the number of configurations accessible to the protein decreases during the folding reaction (Wolynes et al. 1995; Dill and Chan 1997; Dinner et al. 2000; Radford 2000).
The association of the metal ion with the protein is described by a single component, ΔSassociation (the contribution of the metal ion dehydration is included). The entropy of association of metal ions with organic compounds, such as EDTA or EGTA for instance, has been extensively studied (Latimer 1955; George 1959; Glueckauf 1964; Helgeson and Kirkham 1976; Fraùsto da Silva et al. 1977; Marcus 1985; Prapaipong et al. 1999; Prapaipong and Shock 2001). The values of ΔSassociation have linear relationships with the hydration entropies of the metal ions and show systematic behaviors with the charge and the ionic radius (George 1959; Fraùsto da Silva et al. 1977; Prapaipong et al. 1999; Prapaipong and Shock 2001). For instance, linear dependencies with the crystallographic radius of the ion have been described (Prapaipong and Shock 2001). Such behavior has been found for a large variety of organic compounds, with various types of ligands for the metal ion binding (Prapaipong and Shock 2001); only the parameters of the dependence vary. The specificity of compounds for a particular metal ion, such as the specificity of EGTA for Ca2+, for instance, results from the interplay between the enthalpy and the entropy contributions to the free energy of the association (Vasil'ev 2003). It has been proposed that these findings on the behavior of the association entropy can be generalized to proteins (Prapaipong and Shock 2001). Such a parallel between the behavior of ΔSassociation of chelators and that of proteins suggests a linear dependence between ΔSassociation and the ionic radius of the metal ions. As a consequence, it is quite unlikely that the bell-shaped dependence with the ionic radius of the entropy barrier between the MG- and T-states (Fig. 10a) is due to the behavior of the association entropy of the metal ions to the protein in both states. More likely, this bell-shaped dependence results from the behaviors of ΔSsolvent and ΔSconfiguration, contributions attributed to the protein. However, we have no way to distinguish these two contributions to the entropy barrier.
In conclusion, the present study on the effect of metal ions on the folding reaction of BLA has confirmed that cofactors bind to the folding intermediate states of their associated protein. Our results show also that this binding of the cofactors on the folding intermediates is related to their binding on the N-state. Moreover, by coupling kinetic and steady-state experiments and taking advantage of properties of the Φ values, we could detect the binding of cofactors to the U-state. At that stage we cannot decide whether this binding reflects the presence of native-structure in the U-state or not. However, such an approach in association with directed mutagenesis should allow the detection of native-like structures within the U-state. This will lead to the understanding of the underlying effects of these structures on the refolding kinetics and on the protein stability (Wirmer et al. 2004). Finally, according to our results, the cofactors accelerate the folding reaction by decreasing the main energy barrier of the reaction, the largest effect being on the entropy. In the case of BLA, the entropy change between the MG-state and the T-state is unfavorable to the reaction, but this difference is smaller in the presence of the metal ions recognized by the high-affinity calcium site.
Materials and Methods
Calcium-depleted bovine α-lactalbumin (BLA type III, L-6010) was purchased from Sigma and used without further purification. The metal ions were used in the form of CaCl2, SrCl2, MnCl2, BaCl2, MgCl2, and ZnCl2. The buffer was 100 mM Tris-HCl (pH 7.3) in all experiments, and when not specified the temperature was 20°C. EDTA and EGTA solutions were prepared from their acidic forms by adding TRIZMA base (Sigma) as counter ion.
NMR spectroscopy
One-dimensional 1H spectra were recorded with a 600-MHz Spectrometer (Varian). The protein concentration was 10 mg/ mL, and TRIS-d11 (Cambridge Isotope Laboratories) was used for the samples at pH 7.3.
CD spectroscopy
Steady-state measurements were performed with a spectropolarimeter (J-810, JASCO) in a thermostatic cell holder, using a 1-cm path length quartz cell. The spectra were recorded in the near-UV at a scan rate of 100 nm/min, with a data pitch of 0.5 nm and a bandwidth of 4 nm. The protein concentration was 0.2 mg/mL. The thermal unfolding was monitored with a Peltier effect cuvette holder (Bio-Logic). The temperature increment was 5°C every 2 min. The unfolding was reversible, and the same transition was observed during the decrease of temperature. The relationship between the CD signal measured at a temperature, T, y(T), and the proportion of the unfolded state, %U(T), is given by the following equation:
where yN(T) is the signal of the native state, and yU(T) is the signal of the unfolded state. yN(T) and yU(T) are linear dependencies of T in order to take into account the pre- and post-transitional changes of the CD signal. The following equation gives the relationship among %U(T), the van't Hoff enthalpy change (ΔHVH), and the midtransition temperature (Tm) (Fersht 1999):
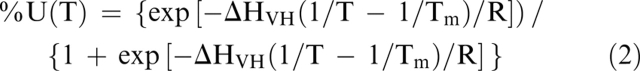 |
Equations 1 and 2 can be gathered in a single equation that describes the relationship between y(T), T, ΔHVH, and Tm. Then, the thermodynamic parameters are obtained with a one-step fit. Equation 2 can also be used to estimate the proportion of the unfolded state at a given temperature with the thermodynamic parameters obtained with the fitting procedure.
Fluorescence spectroscopy
Steady-state fluorescence measurements were performed with a spectrofluorimeter (FP-6500, JASCO) in a thermostatic cell holder, using a 1-cm path length quartz cell. The excitation and the emission bandwidths were 3 nm and 5 nm, respectively. Intrinsic fluorescence was measured at an excitation wavelength fixed at 280 nm. The emission spectra were recorded from 300–400 nm at a scan rate of 100 nm/min. The protein concentration was 1.4 μM. The position and form of the fluorescence spectra were characterized by the parameter A = (I320/I365)280, where I320 and I365 are the fluorescence intensities at λem = 320 nm and 365 nm, respectively. This parameter is very sensitive to small changes in the λmax of the fluorescence spectrum. This is not an extensive parameter, but its behavior is close to that of a real one (Kuznetsova et al. 1988). Moreover, it is less sensitive to experimental errors, such as those in the protein concentration, and as a consequence provides more accurate thermodynamic binding parameters (Kuznetsova et al. 1988).
Steady-state binding curves
For concentrations of metal ions <10 μmM, EGTA and EDTA were used to prepare buffer at the desired free concentration of metal ions, as previously described (Kuwajima et al. 1989; Forge et al. 1993). For concentrations >10 μM, the metal ion was added at the desired concentration. When needed (for every metal ion with the exception of Ca2+), overlapping concentrations were used in order to check that the method used to control the metal concentration had no effect on the binding curves. Each titration curve was fitted with the following binding equation: A = A0 +Aa /(1+(KN/[M])), where A is the parameter A measured for the various concentrations of metal ions, KN is the dissociation constant of the native state, [M] is the free metal concentration, A0 is the initial value of the parameter A, and Aa is the amplitude of its changes. For the fits, A0 was fixed at 1.75, and Aa, at 1. Obviously, the changes of the parameter A induced by the binding of metal are identical for all metal ions considered here (Fig. 5). Therefore, the values of A0 and Aa were fixed to facilitate the curve fitting.
Kinetic experiments
An SFM-400 stopped-flow apparatus (Biologic) was used for the experiments. The protein (140 μM) was initially in the MG- state at pH 2 (10 mM HCl). The folding reaction was initiated by the rapid mixing of one volume of this solution with 10 volumes of the refolding buffer (100 mM Tris-HCl) and various concentrations of metal ions. For the apo-form, 1 mM EDTA was added to the refolding buffer. The dead time of the experiment was ~3 msec. The excitation wavelength of the fluorescence was 280 nm (with a bandwidth of 4 nm), and a filter was used to record the fluorescence changes for wavelengths>320 nm. When the folding reaction required >50 sec, the reaction was initiated by manual mixing in a 1-cm quartz cell in the steady-state spectrophotometer. The dead time of these measurements was 3 sec, and the solutions were continually mixed.
Thermodynamic parameters
The free energy of the binding of metal ions was calculated according to Schellman (1975): ΔGbind = −RT Ln (1 + [M]/K), where K is the dissociation constant in M, and [M] is the free metal concentration in M. Based on this equation and on the theory of the transition state, the dissociation constants of the reaction intermediate states were obtained by fitting the dependencies of the folding rates with the following equation (Kuwajima et al. 1989): k = k0 {(1 + [M]/KT) / (1 + [M]/KMG)}, where k is the measured folding rate, k0 is the folding rate of the apo-form (in the presence of EDTA) and it is a fixed value, [M] is the metal ion concentration, KT is the dissociation constant for the T-state, and KMG is the dissociation constant for the MG-state.
The changes of the free energy barrier of the reaction were calculated with the apo-form as the reference from the folding rates with the formula: ΔΔG‡ = RT Ln(kmax/kapo) (Fersht et al. 1994), where kmax is the maximum folding rate for each metal ion, kapo is the folding rate of the apo-form, R is the gas constant, and T is the absolute temperature in K. The enthalpy barrier was determined with the slope of the Eyring plots, Ln (k/T) = f(1/T), which is equal to −ΔH‡/R.
Calculation of Φ values
These parameters are defined as follows (Fersht 1999): Φ = ΔΔGI/ΔΔGN, where ΔΔGI is the perturbation-induced change of free energy of the intermediate state (either the MG- or the T-state in our case), and ΔΔGN is the energy change of the N-state. The only changes of energy considered in our calculations are those induced by the binding of the metal ions. As described in the main text, the changes of energy drawn from kinetic experiments are not sensitive to changes in the U-state, contrary to those obtained by steady-state measurements. Therefore, we cannot use the U-state as the reference for the calculation of the Φ values as it should be (Fersht 1999). We have investigated two possibilities: (1) The addition of metal ions is considered a perturbation, inducing the stabilization of the various states of the protein. In this case, the reference state is the apo-form of the protein, i.e., the form of the protein in the absence of metal ion. Then, Φ obeys the following equation: Φ = Ln(1 + [M]/KI) / Ln(1 + [M]/KN), where [M] is the metal ion concentration, KI is the dissociation constant of the intermediate state (either MG- or T-state), and KN is the dissociation constant of the N-state. (2) The most stable form (the Ca-bound form) of the protein is used as the reference. In this case the changes for other metals or the absence of any metal ion are considered as destabilizing perturbations. Then, Φ obeys the following equation:
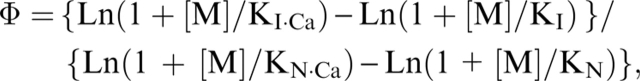 |
where KI·Ca is the dissociation constant of Ca2+ for the intermediate state, and KN Ca is the dissociation constant of Ca2+ for the N-state. The other parameters are the same as those described above.
Effect of a possible equilibrium in the apo-form between the N- and MG-states
According to the thermal unfolding curve of the apo-form (Fig. 2b), the protein is not fully refolded at the temperature of the majority of the experiments presented here (i.e., 20°C). In that case, we must consider an equilibrium between the N-state and the MG-state for the apo-form at this temperature. Only the MG-state has to be considered here because the unfolding of the apo-form is not cooperative (Ikeguchi et al. 1986a); the secondary structure is much more stable than the tertiary one and disappears for much higher temperatures (data not shown). In order to estimate the effect of this equilibrium on the dissociation constants measured for the N-state, we can consider the following reaction scheme:
N ↔ N–Me corresponds to the binding of the metal ion (Me) to the N-state. It is described by the dissociation constant K1 =N·Me/N–Me, where N is the concentration of the N-state, Me is the concentration of metal ion, and N–Me is the concentration of the metal bound N-state.
MG ↔ N corresponds to the equilibrium between the N-and MG-states in the conditions used for the experiments. It obeys the constant K2 = MG/N.
MG–Me ↔ MG corresponds to the binding of the metal ion to the MG-state. It obeys the dissociation constant K3 =MG·Me / MG – Me.
In order to calculate the apparent dissociation constant of the metal ion on the N-state, we have to consider the proportion of the metal-bound N-state
which becomes
The apparent dissociation constant (Kapp) is the value of Me when y = 0.5, then:
One should note that Kapp corresponds to KN used in the main text. The real dissociation of the N-state is K1, and it is related to Kapp (or KN) by the following relationship:
For the majority of the metal ions, the apparent affinity for the N-state is much better than that for the MG-state (Fig. 7b). Therefore, we can consider the following approximation: K3 >> Kapp, which gives K1 = Kapp/(1 + K2) (please note, Kapp corresponds to KN in the main text). In that case, we obtain a linear dependence between the logarithms of the dissociation constant Ln K1 = Ln Kapp − Ln (1 + K2).
Acknowledgments
We thank B. Brutscher (Institute of Structural Biology, Grenoble, France) for recording the NMR spectra. N.B. was the recipient of a fellowship from the French Government. This work was supported in part by the CNRS, the CEA, and grants from INTAS (INTAS-2001-2347) and from the Presidium of the Russian Academy of Sciences.
Footnotes
Reprint requests to: Vincent Forge, Laboratoire de Biophysique Moléculaire et Cellulaire, Unité Mixte de Recherche 5090, Département Réponse et Dynamique Cellulaires, CEA-Grenoble, 17 rue des Martyrs, 38054 Grenoble cedex 9, France; e-mail: forge@dsvsud.cea.fr; fax: +33-04-38-78-54-87.
Article published online ahead of print. Article and publication date are at http://www.proteinscience.org/cgi/doi/10.1110/ps.051904206.
References
- Apiyo D. and Wittung-Stafshede P. 2002. Presence of the cofactor speeds up folding of Desulfovibrio desulfuricans flavodoxin Protein Sci. 11: 1129–1135. [DOI] [PMC free article] [PubMed] [Google Scholar]
- Balbach J., Forge V., van Nuland N.A.J., Winder S.L., Hore P.J., Dobson C.M. 1995. Following protein folding in real time using NMR spectroscopy Nat. Struct. Biol. 2: 865–870. [DOI] [PubMed] [Google Scholar]
- Capaldi A.P., Kleanthous C., Radford S.E. 2002. Im7 folding mechanism: Misfolding on a path to the native state Nat. Struct. Biol. 9: 209–216. [DOI] [PubMed] [Google Scholar]
- Chrysina E.D., Brew K., Acharaya K.R. 2000. Crystal structures of apo- and holo- bovine α-lactalbumin at 2.2-Å resolution reveal an effect of calcium on inter-lobe interactions J. Biol. Chem. 275: 37021–37029. [DOI] [PubMed] [Google Scholar]
- Dalby P.A., Oliveberg M., Fersht A.R. 1998. Folding intermediates of wild-type and mutants of barnase. I. Use of ϕ-value analysis and m-values to probe the cooperative nature of the folding pre-equilibrium J. Mol. Biol. 276: 625–646. [DOI] [PubMed] [Google Scholar]
- Desmet J., Haezebrouck P., Van Cauwelaert F. 1991. Thermodynamic data on the binding of six M2(+)-ions to bovine, goat, and human α-lactalbumin J. Inorg. Biochem. 42: 139–145. [DOI] [PubMed] [Google Scholar]
- Dill K.A. and Chan H.S. 1997. From Levinthal to pathways to funnels Nat. Struct. Biol. 4: 10–19. [DOI] [PubMed] [Google Scholar]
- Dinner A.R., Sali A., Smith L.J., Dobson C.M., Karplus M. 2000. Understanding protein folding via free-energy surfaces from theory and experiment Trends Biochem. Sci. 25: 331–339. [DOI] [PubMed] [Google Scholar]
- Dolgikh D.A., Gilmanshin R.I., Brazhnikov E.V., Bychkova V.E., Semisotnov G.V., Venyaminov S.Y., Ptitsyn O.B. 1981. α-Lact-albumin: Compact state with fluctuating tertiary structure? FEBS Lett. 136: 311–315. [DOI] [PubMed] [Google Scholar]
- Fersht A.R. In Structure and mechanism in protein science. . 1999. W.H. Freeman and Company, New York.
- 2000. Transition-state structure as a unifying basis in protein-folding mechanisms: Contact order, chain topology, stability, and the extended nucleus mechanism Proc. Natl. Acad. Sci. 97: 1525–1529 ——. [DOI] [PMC free article] [PubMed] [Google Scholar]
- Fersht A.R., Matouschek A., Serrano L. 1992. The folding of an enzyme. I. Theory of protein engineering analysis of stability and pathway of protein folding J. Mol. Biol. 224: 771–782. [DOI] [PubMed] [Google Scholar]
- Fersht A.R., Itzhaki L.S., elMasry N.F., Matthews J.M., Otzen D.E. 1994. Single versus parallel pathways of protein folding and fractional formation of structure in the transition state Proc. Natl. Acad. Sci. 91: 10426–10429. [DOI] [PMC free article] [PubMed] [Google Scholar]
- Forge V., Mintz E., Guillain F. 1993. Ca2+binding to sarcoplasmic reticulum ATPase revisited. I. Mechanism of affinity and cooperativity modulation by H+and Mg2+ J. Biol. Chem. 268: 10953–10960. [PubMed] [Google Scholar]
- Forge V., Wijesinha R.T., Balbach J., Brew K., Robinson C.V., Red-field C., Dobson C.C. 1999. Rapid collapse and slow structural reorganisation during the refolding of bovine α-lactalbumin J. Mol. Biol. 288: 673–688. [DOI] [PubMed] [Google Scholar]
- Fowler S.B. and Clarke J. 2001. Mapping the folding pathway of an immunoglobulin domain: Structural detail from Phi value analysis and movement of the transition state Structure 9: 355–366. [DOI] [PubMed] [Google Scholar]
- Fraùsto da Silva J.J.R., Cândida T., Abreu Vaz M. 1977. The thermodynamics of complex formation between uramildiacetic acid and the alkaline-earth metals J. Inorg. Nucl. Chem. 39: 613–619. [Google Scholar]
- Friel C.T., Capaldi A.P., Radford S.E. 2003. Structural analysis of the rate-limiting transition states in the folding of Im7 and Im9: Similarities and differences in the folding of homologous proteins J. Mol. Biol. 326: 293–305. [DOI] [PubMed] [Google Scholar]
- George J.H.B. 1959. Entropies of association of ions in aqueous solution J. Am. Chem. Soc. 81: 5530–5532. [Google Scholar]
- Glueckauf E. 1964. Heats and entropies of ions in aqueous solution Trans. Faraday Soc. 60: 572–577. [Google Scholar]
- Goedken E.R., Keck J.M., Berger J.M., Marqusee S. 2000. Divalent metal cofactor binding in the kinetic folding trajectory of Eschericha coli ribonuclease HI Protein Sci. 9: 1914–1921. [DOI] [PMC free article] [PubMed] [Google Scholar]
- Helgeson H.C. and Kirkham D.H. 1976. Theoretical prediction of the thermodynamic properties of aqueous electrolytes at high pressures and temperatures. III. Equation of state for aqueous species at infinite dilution Am. J. Sci. 276: 97–240. [Google Scholar]
- Ikeguchi M., Kuwajima K., Sugai S. 1986a. Ca2+-induced alteration in the unfolding behavior of α-lactalbumin J. Biochem. 99: 1191–1201. [DOI] [PubMed] [Google Scholar]
- Ikeguchi M., Kuwajima K., Mitani M., Sugai S. 1986b. Evidence for identity between the equilibrium unfolding intermediate and a transient folding intermediate: A comparative study of the folding reactions of α-lactalbumin and lysozyme Biochemistry 25: 6965–6972. [DOI] [PubMed] [Google Scholar]
- Jager M., Nguyen H., Crane J.C., Kelly J.W., Gruebele M. 2001. The folding mechanism of a β-sheet: The WW domain J. Mol. Biol. 311: 373–393. [DOI] [PubMed] [Google Scholar]
- Kuwajima K. 1996. The molten globule state of α-lactalbumin FASEB J. 10: 102–109. [DOI] [PubMed] [Google Scholar]
- Kuwajima K., Mitani M., Sugai S. 1989. Characterization of the critical state in protein folding. Effects of guanidine hydrochloride and specific Ca2+binding on the folding kinetics of α-lactalbumin J. Mol. Biol. 206: 547–561. [DOI] [PubMed] [Google Scholar]
- Kuznetsova I.M., Khaitlina S.Y., Konditerov S.N., Surin A.M., Turoverov K.K. 1988. Changes of structure and intermolecular mobility in the course of actin denaturation Biophys. Chem. 32: 73–78. [DOI] [PubMed] [Google Scholar]
- Latimer W.M. 1955. Single ions free energies and entropies of aqueous ions J. Chem. Phys. 23: 90–92. [Google Scholar]
- Lee K.H., Xie D., Freire E., Amzel L.M. 1994. Estimation of changes in side chain configurational entropy in binding and folding: General methods and application to helix formation Proteins 20: 68–84. [DOI] [PubMed] [Google Scholar]
- Makhatadze G.I. and Privalov P.L. 1996. On the entropy of protein folding Protein Sci. 5: 507–510. [DOI] [PMC free article] [PubMed] [Google Scholar]
- Marcus Y. In Ion solvation . 1985. John Wiley & Sons Ltd, New York.
- Matouschek A., Kellis Jr. J.T., Serrano L., Bycroft M., Fersht A.R. 1990. Transient folding intermediates characterized by protein engineering Nature 346: 440–445. [DOI] [PubMed] [Google Scholar]
- Murakami K., Andree P.J., Berliner L.J. 1982. Metal ion binding to α-lactalbumin species Biochemistry 21: 5488–5494. [DOI] [PubMed] [Google Scholar]
- Northey J.G., Maxwell K.L., Davidson A.R. 2002. Protein folding kinetics beyond the Φ value: Using multiple amino acid substitutions to investigate the structure of the SH3 domain folding transition state J. Mol. Biol. 320: 389–402. [DOI] [PubMed] [Google Scholar]
- Noyelle K. and Van Dael H. 2002. Kinetics of conformational changes induced by the binding of various metal ions to bovine α-lactalbumin J. Inorg. Biochem. 88: 69–76. [DOI] [PubMed] [Google Scholar]
- Ostrovsky A.V., Kalinichenko L.P., Emelyanenko V.I., Klimanov A.V., Permyakov E.A. 1988. Environment of tryptophan residues in various conformational states of α-lactalbumin studied by time-resolved and steady-state fluorescence spectroscopy Biophys. Chem. 30: 105–112. [DOI] [PubMed] [Google Scholar]
- Permyakov E.A. and Berliner L.J. 2000. α-Lactalbumin: Structure and function FEBS Lett. 473: 269–274. [DOI] [PubMed] [Google Scholar]
- Permyakov E.A., Morozova L.A., Burstein E.A. 1985. Cation binding effects on the pH, thermal and urea denaturation transitions in α-lactalbumin Biophys. Chem. 21: 21–31. [DOI] [PubMed] [Google Scholar]
- Permyakov E.A., Ostrovsky A.V., Kalinichenko L.P. 1987. Stopped-flow kinetic studies of Ca(II) and Mg(II) dissociation in cod parvalbumin and bovine α-lactalbumin Biophys. Chem. 28: 225–233. [DOI] [PubMed] [Google Scholar]
- Pozdnyakova I., Guidry J., Wittung-Stafshede P. 2000. Copper triggered β-hairpin formation. Initiation site for azurin folding? J. Am. Chem. Soc. 122: 6337–6338. [Google Scholar]
- Prapaipong P. and Shock E.L. 2001. Estimation of standard-state entropies of association for aqueous metal-organic complexes and chelates at 25°C and 1 bar Geochim. Cosmochim. Acta 65: 3931–3953. [Google Scholar]
- Prapaipong P., Shock E.L., Korestky C.M. 1999. Metal-organic complexes in geochemical processes: Temperature dependence of the standard thermodynamic properties of aqueous complexes between metal cations and dicarboxylate ligands Geochim. Cosmochim. Acta 63: 2547–2577. [Google Scholar]
- Radford S.E. 2000. Protein folding: Progress made and promises ahead Trends Biochem. Sci. 25: 611–618. [DOI] [PubMed] [Google Scholar]
- Saeki K., Munehito A., Yoda T., Nakao M., Kuwajima K. 2004. Localized nature of the transition-state structure in goat α-lactalbumin folding J. Mol. Biol. 341: 589–604. [DOI] [PubMed] [Google Scholar]
- Sanchez I.E. and Kiefhaber T. 2003. Hammond behavior versus ground state effects in protein folding: Evidence for narrow free energy barriers and residual structure in unfolded states J. Mol. Biol. 327: 867–884. [DOI] [PubMed] [Google Scholar]
- Schellman J.A. 1975. Macromolecular binding Biopolymers 14: 999–1018. [Google Scholar]
- Troullier A., Reinstadler D., Dupont Y., Naumann D., Forge V. 2000. Transient non-native secondary structures during the refolding of α-lact-albumin detected by infrared spectroscopy Nat. Struct. Biol. 7: 78–86. [DOI] [PubMed] [Google Scholar]
- Vasil'ev V.P. 2003. Solubility and complexation in the series of compounds of alkaline-earth and alkali metals Russ. J. Coord. Chem. 29: 669–674. [Google Scholar]
- Wijesinha-Bettoni R., Dobson C.M., Redfield C. 2001. Comparison of the structural and dynamical properties of holo and apo α-lactalbumin by NMR spectroscopy J. Mol. Biol. 307: 885–898. [DOI] [PubMed] [Google Scholar]
- Wirmer J., Schlörb C., Klein-Seetharaman J., Hirano R., Ueda T., Imoto T., Schwalbe H. 2004. Modulation of compactness and long-range interactions of unfolded lysozyme by single point mutations Ed. Engl. 43: 5780–5785. [DOI] [PubMed] [Google Scholar]
- Wittung-Stafshede P. 2002. Role of cofactors in protein folding Acc. Chem. Res. 35: 201–208. [DOI] [PubMed] [Google Scholar]
- Wolynes P.G., Onuchic J.N., Thirumalai D. 1995. Navigating the folding routes Science 267: 1619–1620. [DOI] [PubMed] [Google Scholar]