

Abstract
Structural genomics projects require strategies for rapidly recognizing protein sequences appropriate for routine structure determination. For large proteins, this strategy includes the dissection of proteins into structural domains that form stable native structures. However, protein dissection essentially remains an empirical and often a tedious process. Here, we describe a simple strategy for rapidly identifying structural domains and assessing their structures. This approach combines the computational prediction of sequence regions corresponding to putative domains with an experimental assessment of their structures and stabilities by NMR and biochemical methods. We tested this approach with nine putative domains predicted from a set of 108 Thermus thermophilus HB8 sequences using PASS, a domain prediction program we previously reported. To facilitate the experimental assessment of the domain structures, we developed a generic 6-hour His-tag-based purification protocol, which enables the sample quality evaluation of a putative structural domain in a single day. As a result, we observed that half of the predicted structural domains were indeed natively folded, as judged by their HSQC spectra. Furthermore, two of the natively folded domains were novel, without related sequences classified in the Pfam and SMART databases, which is a significant result with regard to the ability of structural genomics projects to uniformly cover the protein fold space.
Keywords: structural genomics, protein domain, domain prediction, NMR, native structure
Structural genomics projects (Burley et al. 1999; Yokoyama et al. 2000; Gronwald and Kalbitzer 2004) have stimulated the development of computer-aided methods for identifying novel, biologically significant protein domains. This is because many, if not most, large multidomain proteins are unsuitable for high-throughput routine structure determination, as required in these projects (Yee et al. 2002). Thus, besides targeting small single domain proteins, most structural genomics projects are focusing on structural domains with molecular masses of 10–25 kDa that remain folded even when isolated from the rest of the protein. However, the dissection of a protein into its structural domains is often a tedious and time-consuming process, which heavily relies on the investigator's intuition and experience. For example, limited proteolysis, a popular method for dissecting proteins into domains, bears all the limitations and difficulties related to the expression and purification of large proteins. On the other hand, computer-aided methods, combining predictions of domains with an experimental assessment of their foldability, appear especially valuable for structural genomics, as they are readily adapted to automation and high throughput.
Several domain prediction methods have recently been developed, in anticipation of their potential use in structural genomics and other proteomics research. Conventional methods for computationally identifying protein domains are based on a sequence comparison of the query sequence with a domain database, such as Pfam, Prodom, SMART, or CDD (Sonnhammer et al. 1997; Corpet et al. 1998; Bate-man et al. 2004; Letunic et al. 2004; Marchler-Bauer et al. 2005). Recently, sequence similarity-based methods for predicting domain regions without referring to a pre-existing domain database have been reported (Kuroda et al. 2000; George and Heringa 2002). The important advantage of these methods over a conventional domain database search is their potential to detect completely novel structural domains. In addition, methods for recognizing domain boundaries, solely on the basis of their amino acid sequence characteristics, have also been reported (Suyama and Ohara 2003; Tanaka et al. 2003, 2005), including neural network-based methods (Miyazaki et al. 2002; Liu and Rost 2004; Nagarajan and Yona 2004; Sim et al. 2005).
Together with domain prediction methods, techniques for rapidly assessing the formation of natively folded structures (Hagihara and Kim 2002; Hagihara et al. 2005) are essential for structural genomics projects. Most high-throughput biochemical methods for probing protein solubility (Knaust and Nordlund 2001; Hammarstrom et al. 2002) and/or stability(Ghaemmaghami et al. 2000; Rucker et al. 2001) require only a small amount of protein, but they do not assess the formation of a native structure per se. On the other hand, once a sufficient quantity of purified protein is available, an HSQC (Hetero Single Quantum Correlation Spectroscopy) experiment provides a fast and reliable assessment of both the formation of a native structure and the overall sample quality (Tyler et al. 2005). Furthermore, HSQC experiments do not require extensive parameter setting and are thus appropriate for routine experimentation (Hoffmann et al. 2005).
Thus, the purpose of our study was to determine how to efficiently combine a domain prediction method (PASS) (Kuroda et al. 2000) with an experimental assessment of the native structure. The main ideas behind our protocol are summarized as: (1) prediction of regions corresponding to putative structural domains likely to yield good samples, (2) expression and rapid purification of the putative domains, and (3) experimental detection of natively folded, stable, soluble domains. Although individual methods used in our protocol (e.g., the use of HSQC or domain prediction) are not dramatically new, we show that a strategy that combines them efficiently can provide a new, generic, effective, and rapid screen for detecting natively folded structures without relying on a functional assay. We assess our strategy and discuss the correlation between the sample quality, as assessed by the HSQC experiments, and the solubility and stability of the protein, as monitored by biochemical methods, using structural domains predicted from a set of 108 Thermus thermophilus HB8 sequences.
Results
Prediction of putative domains
We selected nine putative structural domains predicted using PASS, which is a domain prediction method based on sequence similarity (Kuroda et al. 2000). The structural domains were detected with a Blast e-value of 10−20 and with the minimal number of homologous sequences set to five. The locations of the putative domains along the protein sequences are shown in Figure 1. Sequences 448 and 1350 contained a predicted trans-membrane region, and sequence 1350(586–745) did not express well. In addition, sequence 1600(117–368) was insoluble under all conditions examined and remained insoluble even when new constructs, with domain boundaries shifted by several resi-dues, were prepared (data not shown). All of the other do-mains were expressed and remained soluble under the conditions examined (Table 1 Supplement 1).
Figure 1.

Domain prediction. The expressed domains predicted with PASS are indicated by gray ellipses. The first and last residues, the computed and measured molecular masses, and the computed isoelectric point are indicated for each domain. The trans-membrane regions predicted with ALOM are shown with shaded bars.
Table 1.
Summary of the experimental results and comparison with databases

a Total number of cross-peaks detected in the HSQC spectra shown in Figure 3. The number of strong peaks is indicated in parentheses.
b Overall quality of the HSQC spectra shown in Figure 3, classified into bad, fair, and good.
c The first and last residues of regions resistant to trypsin digestion are indicated. Resistance to digestion was classified into low, medium, and high.
d Homology with sequences listed in PDB searched with Blast. The total number of residues in the PDB sequence are indicated in brackets.
e Homology with sequences listed in Pfam and SMART searched with Blast/CDD. Partial means that sequence similarity does not cover the entire query
sequence.
fTwo constructs corresponding to residues 1-178 and 30-178 were initially expressed, but all experiments were conducted with 30-178.
gThe latest search indicated a homology with pfam06071 and pfam01018, which are GTP binding proteins; and 1JAL PDB file.
Rapid purification and sample purity
The purification time was substantially shortened by removing all of the dialysis steps and eluting the protein from the nickel resin by thrombin cleavage of the His-tag (Fig. 2a). The total purification time was 4.5 h, measured after cell lysis. The NMR samples were further concentrated and the buffer was exchanged for 2 h, resulting in a total purification time of 6.5 h (Fig. 2a). In the most favorable case, the yield was 65%, as estimated from the band intensities of the SDS-PAGE gels (Fig. 3b), and in all cases, we obtained a sufficient pure quantity of protein from 1 L of Escherichia coli M9 culture for the NMR experiments (Fig. 3a).
Figure 2.

(A) Generic purification protocol. All of the domains were purified with the same protocol, without any optimization (for details, see Materials and Methods). The sample volume at each purification stage is shown on the right side of the figure. The protocol was designed so that the entire purification, after the initial loading of the protein to the nickel resin (step 1), can be performed in a single 50-mL sample tube. The fraction containing the protein is indicated on the right side of the figure, in italics. The first step, “Cell pellet,” indicates the resuspension and lysis of the E. coli cells (up to 5 g pellets). “Purified sample” indicates the low-concentration protein purified according to this protocol. “Final NMR sample” indicates the concentrated sample used for NMR measurements or as a stock solution for biochemical tests. The time indicated at the left of each purification step was measured from the time at which the cell pellet was first resuspended for lysis. Steps 1–5 were carried out in 4 h. The time typically needed for concentrating a well-behaving protein to NMR sample concentrations was 2.5 h, and the HSQC spectra were measured on the same day. The broken arrow between steps 5 and 6 indicates that some samples needed a longer concentration/buffer exchange time. This protocol was first tested with DFF-C, an 83-residue natively folded domain of DFF-45. (B) HSQC spectra of DFF-C, purified according to the rapid purification protocol. (C) Spectrum of the conventional Niresin/HPLC-purified DFF-C, which needed ≥5 d for completion. The two spectra are identical, and the peak assignments of DFF-C indicate that all of the residues are visible on both spectra. Furthermore, no impurities originating from peptide fragments are present, as judged by the absence of minor peaks that would indicate their presence.
Figure 3.
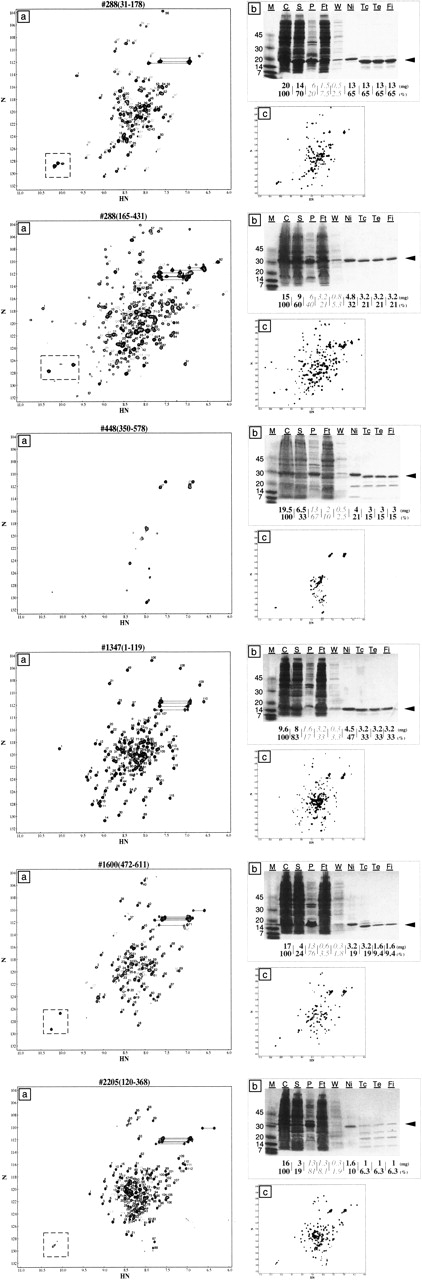
HSQC spectra and SDS-PAGE gels of the putative domains. (a) HSQC spectra of the final samples, purified according to the protocol described in Figure 2. Since many spectra contained a sizable fraction of cross-peaks with weak intensities, we divided the cross-peaks into two classes according to their intensities. Peaks with strong and weak intensities are numbered in black and gray italics, respectively. Peaks that are likely to correspond to the indole NH of tryptophan are boxed with a broken line. Peak pairs likely to correspond to side-chains NH are indicated by horizontal lines connecting the two peaks. The spectra were displayed with the NMRview software, with drawing parameters set to: level = 1.0, CLM = 1.3, and NLVIS = 30. (b) The yield at each purification step was monitored by SDS-PAGE. The molecular masses in kilodaltons are indicated on the left of the gel. The lanes are as follows: M, molecular mass marker; C (step 1), cell lysate; S, supernatant; P, precipitate; Ft (step 2), flow through of the nickel resin; W, wash of the nickel resin, Ni, the fraction bound to the nickel resin, Tc (step 3), nickel resin slurry after thrombin digestion, Te (step 5), eluted fraction after thrombin digestion; and Fi (step 6), final sample. From a total volume of 50 mL, a 7.8 μL aliquot was loaded in lane C. Equivalent amounts were loaded in lanes S to Ft, and double amounts were loaded in lanes W to Fi. The black arrow on the right side of the gel indicates the band position of the final purified sample. The numbers at the bottom of the gel indicate the estimated quantity of protein at each step in milligrams (upper line) and in percentages (bottom line). (c) Same HSQC spectra as in a recorded after an overnight incubation at 308K. All of the spectra measured after the incubation period remained unchanged, except for that of 1347(1–119). In the spectrum of 1347(1–119) measured after the overnight incubation, some minor peaks as well as broad peaks collapsed in the spectrum center are visible.
We first tested the purification protocol using a DFF-C domain, which is an 80-residue natively folded structural domain of DFF45 (DNA Fragmentation Factor 45 kDa), a 331-residue protein (Fukushima et al. 2002). DFF-C, purified according to the above purification protocol, yielded an ∼100% pure sample, which remained stable for several weeks, as judged by both SDS-PAGE and HSQC experiments (Fig. 2b,c). Likewise, all of the domains, except 2205(120–368), purified according to the protocol produced a single major SDS-PAGE band (Fig. 3b). Domain 2205(120–368) was actually degraded during the thrombin cleavage of the His-tag sequence, because of a fortuitous thrombin cleavage site in its amino acid sequence. This observation was confirmed by the undigested His-tagged version of 2205(120-368), which produced a single band (Fig. 3b, lane Ni of the SDS-PAGE gel).
HSQC assessment of the domain structure
An HSQC spectrum with sharp and dispersed peaks provides a direct measure for the overall sample quality (Tyler et al. 2005). With all of the cross-peaks collapsed at its center, the HSQC spectrum of 448(350–578) was typical of an unfolded or aggregated protein. Domain 288(30–178) exhibited a spectrum with dispersed peaks, but with inhomogeneous intensities, possibly caused by protein regions in a molten globule-like state (Ohgushi and Wada 1983; Kuwajima 1996). Four putative domains—288(165–431), 2205(120–368), 1347(1–119), and 1600(472–611)—produced HSQC spectra with well-dispersed peaks, strongly suggesting the presence of natively folded protein structures. In particular, the spectrum of 1347(1–119) contained 119 cross-peaks, which is close to the number expected from its sequence, suggesting that the natively folded region encompasses the entire predicted domain region.
Criteria for a good sample
At least three independent conditions—stability, fold-ability (in a native structure), and solubility—are simultaneously satisfied when a protein's HSQC spectrum exhibits sharp and dispersed peaks. Here, we examined whether a correlation existed between the biochemically assessed protein solubility and stability and the overall sample quality, as determined by HSQC.
Protein solubility
We measured the solubility of the putative domains at four pH values in the presence and absence of salt. Solubility was assessed by the SDS-PAGE gel band intensities of the proteins in the supernatant relative to those in the precipitate (Table 1). All of the proteins were more soluble at high pH than low pH, and all [except for 1600(117–368)] were highly soluble at pH 8.0 and 8.7. This result was somewhat counter-intuitive, as we expected the solubility to depend on the calculated isoelectric point of the domains (Fig. 1). The salt concentration had little influence on the solubility at pH 6.0 and none at pH 8.0 and 8.7. The solubility of all samples increased when the His-tag was removed (data not shown).
Stability by limited proteolysis
Trypsin digestion was performed at three relative trypsin/protein concentrations of 1/1000 (Fig. 4), 1/3000, and 1/10000. Here again, we used DFF-C as a control, and we observed that the flexible residues at its N and C termini were rapidly digested in <10 min, whereas its natively structured core region (residues 255–307) remained intact even after a 60-min incubation at a 1/1000 relative trypsin/protein concentration (Fig. 4). Thus, the 1/1000 relative concentration appeared appropriate for judging the formation of native structures. According to this criterion, 1600(472–611) contained a natively folded domain, which was as resistant to proteolysis as DFF-C. Predicted domains 288(165–431) and 2205(120–368) also contained structural domains (although not encompassing the entire predicted region; see Discussion), which were as stable as DFF-C. On the other hand, the stability of 1347(1–119) was low, despite its native-like HSQC spectrum, and it was completely digested after 40 min at a 1/3000 relative concentration (data not shown). Although they were more resistant to proteolysis than was 1347(1–119), 288(30–178) and 448(350–578) were also partially digested after a 60-min incubation at a 1/1000 relative concentration (Fig. 4).
Figure 4.
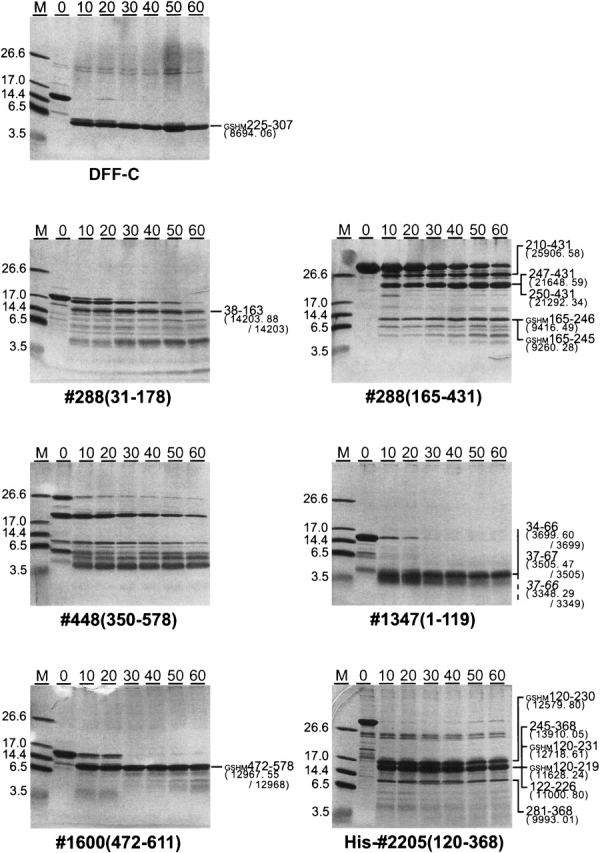
Domain stability and boundary refinement using MALDI-TOF: The SDS-PAGE gel represents the results of limited proteolysis performed with a 1/1000 relative trypsin/protein concentration. The incubation times ranged from 0–60 min and are indicated on the top of the gels. DFF-C is a control for a natively folded 83-residue domain flanked with a few unfolded residues at both its N and C termini. When the digestion produced one or a few fragments [DFF-C-control, 288(31–178), 1600, and 1347], the band identities were determined unambiguously from the molecular masses measured by MALDI-TOF spectroscopy. In these cases, the fragment identity was determined by comparing the experimental molecular mass with computed molecular masses of all possible fragments generated by trypsin digestion (cleavage at all R and K residues). Identification based on the fragment molecular mass was ambiguous for 288(165–431) and His-2205(120–368) because of the large numbers of fragments with similar molecular masses. In these cases, N-terminal amino acid sequencing provided unambiguous band identification. The first and last residues of the fragments are indicated on the right side of the gels, as well as the measured/calculated molecular masses in parentheses.
Long-term stability
Long-term sample stability was assessed by recording an HSQC spectrum 24 h after the first one, which was recorded just after purification (Fig. 3a,c). Both spectra were essentially the same for all samples, except for 1347(1–119) (Fig. 3c). Indeed, some peak intensities decreased (e.g., see peaks 4, 9, and 22), and broad signals appeared in the spectrum's center [Fig. 3c; 1347(1–119)]. The changes were amplified when we measured the HSQC experiment after a week, and all of the peaks were collapsed near the center of the spectrum, indicating that the native structure present in the fresh sample was completely disrupted after a week (data not shown).
Two novel structural domains
Overall, our experiment revealed two novel structural domains contained in 2205(120–368), which were not classified in the Pfam and SMART databases (Table 1; the latest search indicated a homology with pfam06071 and pfam01018) when searched with CDD (Marchler-Bauer et al. 2002). These two domains are fully novel and are important candidates for structure determination, as their sample qualities are good. In addition, 1600(472–611), a putative helicase, and 1347(1–119) share less than 26% and 34% similarity, respectively, with the sequences listed in the Protein Data Bank (PDB), and thus they also represent attractive targets.
Discussion
HSQC as a foldability screen
The development of a rapid and effective screen for detecting natively folded structures that do not rely on a functional assay has essentially remained elusive, and most assays assess either the solubility (Maxwell et al. 1999) or the stability (Ghaemmaghami et al. 2000) of the protein, rather than the presence of a native structure (Albala et al. 2000; Knaust and Nordlund 2001). Thus, NMR remains the method of choice for detecting domains (Huth et al. 1997; Tyler et al. 2005) that fold into a native structure in isolation, regardless of their activity. In a few favorable cases, protein structures could be assessed by directly recording an HSQC spectrum of the target protein in E. coli without cell lysis or purification (Serber and Dotsch 2001), thus drastically shortening the assay time. However, purification remains generally valuable, especially when a rapid and generic protocol is available, because it permits the evaluation of the sample quality under a broad range of conditions (Fig. 2). For example, purification was helpful for 1600(580–627), which at first seemed to have low solubility but eventually turned out to be soluble and exhibited a good HSQC.
In some cases, a protein structure may be difficult to determine even though a good initial HSQC spectrum was obtained. Domain 1347(1–119) is such an example (Fig. 3). It forms a native structure, which is stable for a few hours but unstable over a longer period of time. We speculate that the lack of long-term stability observed by HSQC is related to the low proteolytic resistance and/or the low solubility of 1347(1–119). This situation could probably be resolved by refining the domain's C terminus, and a systematic documentation of such a case might provide insight into the roles of the domain termini in the stability and/or solubility. Unfortunately, such observations are rarely reported, as the sample is either abandoned or the domain is reported with refined boundaries and improved sample quality.
A quantitative evaluation of the HSQC spectrum quality can easily be implemented. A simple method is to count the number of cross-peaks and compare it with the number of non-proline residues contained in the protein sequence (Table 1), which provides an estimate for the number of residues in both the folded and unfolded regions. According to this criterion, the natively folded region of 1347(1–119) would encompass the entire predicted domain region (119 peaks counted). Similarly, 83 peaks probably assignable to the natively folded region (472–578), as determined by proteolysis and mass spectroscopy (Fig. 4), of domain 1600(472–611), are visible in the HSQC spectrum.
Biochemical assay to complement the HSQC assessment
Biochemical information about protein solubility, stability, and foldability can efficiently complement the HSQC assessment and provide a rapid method for assessing the sample quality, refining the domain boundaries, and optimizing the NMR measurement conditions.
A systematic solubility test, typically requiring as little as 40 μg of unlabeled protein per condition, can be designed for optimizing the NMR measurement conditions (Table 2). Such tests are especially useful for interpreting the HSQC spectra of proteins with low solubility and/or stability. For example, the poor HSQC spectrum of 448(350–578) appeared to originate from its low solubility at pH 6.0 (Table 2) rather than its stability (Fig. 4). However, low resistance to limited proteolysis did not always imply a poor HSQC, as demonstrated by 1347(1–119), which exhibited a native-like HSQC spectrum (Figs. 3, 4).
Table 2.
Summary of the solubility test
Solubility was estimated from the protein concentration remaining in the supernatant at the indicated pH, and classified into four classes (ranging from - to+++). Each pH was tested under a low salt (0 M NaCl) and high salt (300 mM NaCl) condition. SDS-PAGE gels used to estimate the solubility are provided in the supplemental material (Supplement 2).
On the other hand, limited proteolysis combined with MALDI-TOF (matrix assisted laser desorption/ionization time of flight) mass spectroscopy (Galvani et al. 2000) and peptide sequencing appeared to be valuable for refining the domain boundaries, by identifying fragments resistant to proteolysis (Fig. 4). Importantly, domain boundary refinement is much easier than domain dissection from the entire protein, using limited proteolysis. A major advantage is that no tedious refolding of large multidomain proteins is required. Another advantage is that limited proteolysis experiments on putative domains are easily interpretable, since the expressed segment will usually comprise no more than one or possibly two domains. This is well illustrated by 1600(472–611), for which the domain boundary refinement was particularly straightforward, as it contained a single natively structured domain extending from residues 472–578. Although several bands appear on the SDS-PAGE gels when two domains are present, the analysis remains relatively simple. For example, limited proteolysis and mass spectroscopy experiments indicated that 288(165–431) contains two structural domains corresponding to residues 165–246 and 247–431 (Fig. 4). Similarly, 2205(120–368) appears to contain two structurally independent domains corresponding to residues 122–219 and 281–368.
Significance of the in silico screening
In the special case of coiled coils, a computationally assisted method successfully identified several domains, essentially due to both the distinctive coiled coil sequence and its dimeric structure (Newman et al. 2000). However, in a general context, how does domain prediction influence the search for domains with unspecified structures? One answer to this question is obtained by considering that the probability of selecting a domain boundary with a 20-residue error, by randomly fragmenting a 400-residue two-domain protein, is ∼5%. Domain prediction methods, such as PASS, can easily increase this number by seven- to eightfold (Kuroda et al. 2000). This represents an obvious advantage when designing experimental protocols for testing a large number of domains, as illustrated by the discovery of the three, or possibly four, natively folded domains (Table 1). On the other hand, the low sensitivity of the predictive methods may rapidly become a problem and should be improved. One possibility worth investigating for increasing the sensitivity of our method is to examine whether the regions located in-between the predicted domains such as region 120–321 in 1347 are structural domains or not.
Our results may be compared with those of a prototype structural genomics experiment, in which >400 proteins from Methanobacterium thermoautotrophicum were expressed (Christendat et al. 2000). In the prototype experiment, ∼20% of the expressed and purified proteins were found to be suitable for X-ray or NMR analysis. Thus, considering the additional difficulty of predicting the location of the domains in our study, the detection of two novel, natively folded domains out of nine expressed sequences is a promising result. We assume that this favorable situation is at least partly due to the in silico selection.
Conclusion
Due to the technical challenges in determining large protein structures, many structural genomics projects have adopted a domain-based approach. Here, we tested a computer-aided approach for identifying structural domains, and experimentally verified their sample quality. The identification of two new structural domains that were not cataloged in Pfam, SMART, or CDD is noteworthy, especially with regard to efforts directed toward uniformly covering the protein fold space (Brenner 2000, 2001). Overall, our results indicate that this combining approach involving the prediction of new structural domains, rapid purification, and an HSQC experiment, is a straightforward and realistic approach for identifying natively folded domains. We anticipate that similar approaches will be widely applied to high-throughput structural genomics and proteomics projects.
Materials and methods
Sequence analysis
The sequences of 108 T. thermophilus HB8 proteins were provided by the “Whole cell project of T. thermophilus HB8” (Yokoyama et al. 2000). The sequences were chosen according to a preliminary sequence analysis, which indicated that they were poorly characterized sequences with unknown functions, and often with few or no similar sequences detected in the GenBank database. The average length of the proteins was ∼400 residues. Twenty putative sequences were detected by running PASS. The domains were prioritized according to the number of similar sequences, and nine domains with the most homologs were selected (Supplement 1). Next, we verified that no putative domains with similar sequence were selected. We further verified the potential trans-membrane regions (Klein et al. 1985) and predicted the secondary structure contents using DSC (King and Sternberg 1996). However, in our case, no candidates were discarded on the basis of these two criteria as none overlapped with a trans-membrane region, and all putative domains contained a fair amount of predicted secondary structure. The protocol is essentially automatic with a small number of parameters that can be varied (e.g., minimum number of homologs, Blast e-value cut-off, minimum percentage of secondary structures). Nine putative domains in seven proteins were selected according to this protocol.
Plasmid construction
Ten nucleotide sequences corresponding to the putative domains were amplified by PCR and introduced into the pET1 1b (Novagen) expression vector at the NdeI/BamHI sites. The nucleotide sequences were verified by DNA sequencing, and the identities of the expressed proteins were confirmed by M ALDI-TOF mass spectroscopy (the calculated and measured masses are indicated in Fig. 1).
Protein expression
The domains were expressed in E. coli cells (JM109 (DE3) pLysS; Novagen) grown in LB media. E. coli cells were grown at 37°C until the OD600 reached 0.7. Protein expression was induced with IPTG, and the cells were grown for three additional hours. Uniformly 15N-labeled samples were prepared in M9 media supplemented with 1 g/L of 15NH4Cl as the nitrogen source.
Rapid purification protocol
The protocol was designed to purify proteins from up to 5 g of E. coli cells produced in 1 L of M9 minimal media (also see Fig. 2). The cells were harvested by centrifugation, and the cell pellets were resuspended in 50 mL of lysis buffer (50 mM Tris-HCl at pH 8.7, 100 mM NaCl, 1 mM 2-Me, 0.1 mM PMSF, 20 mM imidazole). After cell lysis by sonication, the cell debris was removed by centrifugation and by filtering the supernatant with a 0.8-μm filter (Fig. 2, Step 1). A 50% Ni-NTA (Qiagen) slurry (4 mL) was added to the filtered solution, and the mixture was stirred for 15 min at 4°C. This mixture was then loaded on an open column with a bed volume of 20 mL. The flow through fraction was removed, and the resin was washed twice with 10 mL of purification buffer (50 mM potassium phosphate at pH 8.0, 150 mM NaCl, 20 mM imidazole). Then, purification buffer (2 mL), containing 25 NIH units of thrombin (Sigma), was added to the resin (Fig. 2, step 2). The mixture was incubated for 2 h at room temperature (Fig. 2, step 3) to cleave the putative domain from its His-tag and release it from the nickel resin. The released domains were collected with 15 mL of the purification buffer. This solution was loaded onto a new column containing 1 mL of Benzamidine Sepharose resin (Pharmacia) to remove the thrombin protease. After letting the solution react for 15 min at room temperature (Fig. 2, step 4), the flow through fraction was collected. The Benzamidine Sepharose resin was washed twice with 2.5 mL of wash buffer (5 mM potassium phosphate at pH 7.0, 50 mM NaCl), and the washes were collected. The flow through fraction was consolidated with the two wash fractions, resulting in a 20 mL solution containing the “purified sample” (Fig. 2, step 5). The total time needed for steps 1-5 of the purification was 4 h.
The “final NMR sample” was obtained by concentrating this solution to 0.5∼1 mL, and by exchanging the buffer with either the NMR measurement buffer (5 mM potassium phosphate at pH 7.0,100 mM NaCl) or the stock solution buffer (10 mM Tris-HCl at pH 8.0), on a Centricon filter (ULTRAFR EE(R) MWCO-5 kDa or 10 kDa). Typically, the concentration/buffer exchange required 2.5 h. The total time needed from the cell pellet resuspension to the NMR measurement was thus ∼6.5 h, and the HSQC spectra were measured on the same day. However, some highly viscous samples required a longer period of time for sample concentrations.
NMR spectroscopy
Hetero-nuclear Single Quantum Coherence experiments were measured at 35°C on a Bruker DRX 600 spectrometer. The sample concentrations were between 100 and 200 μM as determined from their molar extinction coefficients using an aliquot taken from the NMR sample. 2kx128 points were recorded in the t2 and t1 directions, respectively, with spectral width of 6000 Hz and 10,000 Hz. Thirty-two scans were recorded in ∼75 min. The water flip back sequence was used to suppress the water signal. Prior to Fourier transformations, 90° shifted sine-bell windows were applied in both directions. NMR spectra were processed using NMRPipe (Delaglio et al. 1995) and NMRView (Johnson 2004).
Solubility test
The solubility of the putative domains was determined using 20 μL of protein stock solution (10 mM Tris-HCl at pH 8.0, a protein concentration of 100-200 μM). Eight samples with pH and salt concentrations adjusted to the testing conditions were prepared (pH 4.5 and 6.0 [citrate], 8.0 [potassium phosphate], and 8.7 [Tris] with and without 300 mM NaCl). The final volume of the eight samples was 25 μL. A 2.5 μL aliquot of each sample was set aside for use as a control for the initial protein concentration. The solubility was assessed by filtering the remaining 22.5 μL of the solution through a 0.22-μm filter. The flow through was collected as the “soluble fraction,” and the “insoluble fraction” was collected by washing the surface of the filter with 45 μL of 10 mM Tris-HCl buffer (pH 8.7). For comparison, 2.5 μL of the flow through, 5 μL of the insoluble fraction, and 2.5 μL of the unfiltered fraction were loaded onto an SDS-PAGE gel. The quantity of proteins contained in each fraction was estimated from a gel stained with Coomassie brilliant blue, by comparing the band intensities to reference bands containing 0.125, 0.25, 0.5, 1.0, and 2.0 μg of lysozyme.
Limited proteolysis
Limited proteolysis tests were performed with bovine pancreatic trypsin (Wako Chemical). Five-microliter reaction mixtures (5 mM potassium phosphate at pH 8.0, 100 mM NaCl), containing 100 μM of the purified protein as a substrate and trypsin at relative concentrations of 1/1000, 1/3000, and 1/ 10,000, were incubated at 25°C for 0–60 min. For each relative trypsin/protein concentration, seven proteolytic reactions were started at 10-min intervals by adding trypsin to the protein solution. The seven reactions were simultaneously blocked by adding 5 μL of SDS-PAGE loading buffer, and the samples were immediately loaded onto an SDS-PAGE gel. The degree of digestion was estimated from the intensities of the bands visible on the gel.
MALDI-TOF identification of trypsin resistant fragments
Fragments resistant to trypsin digestion were separated on a 17.5% SDS-PAGE gel. The fragments were isolated by excising the bands from the gel. The gel slices were destained for 90 min in a destaining solution (formic acid:isopropanol:MQ water = 1:2:3, v/v/v), dried, and crushed. The fragments were extracted by sonicating the crushed gels in 40 μL of extraction solvent (formic acid:acetonitrile:isopropanol:water = 50:25:15:10, v/v/v/v). The extract volume was reduced to 10 μL by speed vacuum, and 1 μL of the extract was used to determine the molecular masses of the fragments by MALDI-TOF mass spectroscopy (Voyager), using either sinapic acid or α -cyano-4-hydroxycinnamic acid as a matrix. The calibration was carried out using insulin (bovine; MW = 5733), myoglobin (horse heart; MW = 16,951) and trypsinogen (bovine; MW = 23,982).
The identities of some fragments that could not be unambiguously assigned solely by mass spectroscopy were further verified by N-terminal amino acid sequencing. To this end, the extract solution was diluted with MQ water containing 0.1% TFA to a final volume of 750 μL and was spotted onto a PVDF membrane (Applied Biosystems blotting kit). The membrane was washed with 0.1% TFA, dried, and loaded into the peptide sequencer (Applied Biosystems; Procise 494HT).
Acknowledgments
We dedicate this paper to the memory of Dr. Zheng-yu Peng (University of Connecticut Health Center). He was a dear friend and a generous colleague, well recognized for his creative and rigorous work on protein folding. He is survived by his wife, Li Luo, and his daughter, Lily. We thank Eisuke Chikayama and Dr. Jun Kikuchi (RIKEN, PSC) for discussion and advice. This work was partly supported by the RIKEN Structural Genomics/Proteomics Initiative (RSGI) and a grant-in-aid from the Japanese Society for the Promotion of Science to Y.K.
This paper is dedicated to the memory of Dr. Zheng-yu Peng (University of Connecticut Health Center).
Footnotes
Supplemental material see www.proteinscience.org
Reprint requests to: Y. Kuroda, Department of Biotechnology and Life Science, Graduate School of Engineering, Tokyo University of Agriculture and Technology, 2-24-16 Nakamachi, Koganei-shi, Tokyo 184-8588, Japan; e-mail: ykuroda@cc.tuat.ac.jp; fax: + 81-42-388-7794; or S. Yokoyama, Department of Biophysics and Biochemistry, Graduate School of Science, The University of Tokyo, 7-3-1 Hongo, Bunkyo-ku, Tokyo 113-0033, Japan; e-mail: yokoyama@biochem.s.u-tokyo.ac.jp; fax: +81-3-5841-8057.
Article published online ahead of print. Article and publication date are at http://www.proteinscience.org/cgi/doi/10.1110/ps.051880406.
References
- Albala J.S., Franke K., McConnell I.R., Pak K.L., Folta P.A., Rubinfeld B., Davies A.H., Lennon G.G., Clark R., Bertone P.et al. 2000. From genes to proteins: High-throughput expression and purification of the human proteome J. Cell. Biochem. 80: 187–191. [DOI] [PubMed] [Google Scholar]
- Bateman A., Coin L., Durbin R., Finn R.D., Hollich V., Griffiths-Jones S., Khanna A., Marshall M., Moxon S., Sonnhammer E.L.et al. 2004. The Pfam protein families database Nucleic Acids Res. 32: D138–D141. [DOI] [PMC free article] [PubMed] [Google Scholar]
- Brenner S.E. 2000. Target selection for structural genomics Nat. Struct. Biol. 7:Suppl, 967–969. [DOI] [PubMed] [Google Scholar]
- 2001. A tour of structural genomics Nat. Rev. Genet. 2: 801–809 ——. [DOI] [PubMed] [Google Scholar]
- Burley S.K., Almo S.C., Bonanno J.B., Capel M., Chance M.R., Gaas-terland T., Lin D., Sali A., Studier F.W., Swaminathan S. 1999. Structural genomics: Beyond the human genome project Nat. Genet. 23: 151–157. [DOI] [PubMed] [Google Scholar]
- Christendat D., Yee A., Dharamsi A., Kluger Y., Gerstein M., Arrow-smith C.H., Edwards A.M. 2000. Structural proteomics: Prospects for high throughput sample preparation Prog. Biophys. Mol. Biol. 73: 339–345. [DOI] [PubMed] [Google Scholar]
- Corpet F., Gouzy J., Kahn D. 1998. The ProDom database of protein domain families Nucleic Acids Res. 26: 323–326. [DOI] [PMC free article] [PubMed] [Google Scholar]
- Delaglio F., Grzesiek S., Vuister G.W., Zhu G., Pfeifer J., Bax A. 1995. NMRPipe: A multidimensional spectral processing system based on UNIX pipes J. Biomol. NMR 6: 277–293. [DOI] [PubMed] [Google Scholar]
- Fukushima K., Kikuchi J., Koshiba S., Kigawa T., Kuroda Y., Yokoyama S. 2002. Solution structure of the DFF-C domain of DFF45/ICAD: A structural basis for the regulation of apoptotic DNA fragmentation J. Mol. Biol. 321: 317–327. [DOI] [PubMed] [Google Scholar]
- Galvani M., Bordini E., Piubelli C., Hamdan M. 2000. Effect of experimental conditions on the analysis of sodium dodecyl sulphate polyacrylamide gel electrophoresis separated proteins by matrix-assisted laser desorption/ionisation mass spectrometry Rapid Commun. Mass Spectrom. 14: 18–25. [DOI] [PubMed] [Google Scholar]
- George R.A. and Heringa J. 2002. Protein domain identification and improved sequence similarity searching using PSI-BLAST Proteins 48: 672–681. [DOI] [PubMed] [Google Scholar]
- Ghaemmaghami S., Fitzgerald M.C., Oas T.G., Bertone P., Kluger Y., Lan N., Zheng D., Christendat D., Yee A., Edwards A.M.et al. 2000. A quantitative, high-throughput screen for protein stability Proc. Natl. Acad. Sci. 97: 8296–8301. [DOI] [PMC free article] [PubMed] [Google Scholar]
- Gronwald W. and Kalbitzer H.R. 2004. Automated structure determination of proteins by NMR spectroscopy Prog. Nucl. Magn. Res. Spect. 44: 33–96. [Google Scholar]
- Hagihara Y. and Kim P.S. 2002. Toward development of a screen to identify randomly encoded, foldable sequences Proc. Natl. Acad. Sci. 99: 6619–6624. [DOI] [PMC free article] [PubMed] [Google Scholar]
- Hagihara Y., Matsuda T., Yumoto N. 2005. Cellular quality control screening to identify amino acid pairs for substituting the disulfide bonds in immunoglobulin fold domains J. Biol. Chem. 280: 24752–24758. [DOI] [PubMed] [Google Scholar]
- Hammarström M., Hellgren N., van Den Berg S., Berglund H., Härd T. 2002. Rapid screening for improved solubility of small human proteins produced as fusion proteins in Escherichia coli Protein Sci. 11: 313–321. [DOI] [PMC free article] [PubMed] [Google Scholar]
- Hoffmann B., Eichmuller C., Steinhauser O., Konrat R. 2005. Rapid assessment of protein structural stability and fold validation via NMR Methods Enzymol. 394: 142–175. [DOI] [PubMed] [Google Scholar]
- Huth J.R., Bewley C.A., Jackson B.M., Hinnebusch A.G., Clore G.M., Gronenborn A.M. 1997. Design of an expression system for detecting folded protein domains and mapping macromolecular interactions by NMR Protein Sci. 6: 2359–2364. [DOI] [PMC free article] [PubMed] [Google Scholar]
- Johnson B.A. 2004. Using NMRView to visualize and analyze the NMR spectra of macromolecules Methods Mol. Biol. 278: 313–352. [DOI] [PubMed] [Google Scholar]
- King R.D. and Sternberg M.J. 1996. Identification and application of the concepts important for accurate and reliable protein secondary structure prediction Protein Sci. 5: 2298–2310. [DOI] [PMC free article] [PubMed] [Google Scholar]
- Klein P., Kanehisa M., DeLisi C. 1985. The detection and classification of membrane-spanning proteins Biochim. Biophys. Acta 815: 468–476. [DOI] [PubMed] [Google Scholar]
- Knaust R.K. and Nordlund P. 2001. Screening for soluble expression of recombinant proteins in a 96-well format Anal. Biochem. 297: 79–85. [DOI] [PubMed] [Google Scholar]
- Kuroda Y., Tani K., Matsuo Y., Yokoyama S. 2000. Automated search of natively folded protein fragments for high-throughput structure determination in structural genomics Protein Sci. 9: 2313–2321. [DOI] [PMC free article] [PubMed] [Google Scholar]
- Kuwajima K. 1996. The molten globule state of a-lactalbumin FASEB J. 10: 102–109. [DOI] [PubMed] [Google Scholar]
- Letunic I., Copley R.R., Schmidt S., Ciccarelli F.D., Doerks T., Schultz J., Ponting C.P., Bork P. 2004. SMART 4.0: Towards genomic data integration Nucleic Acids Res. 32: D 142–D 144. [DOI] [PMC free article] [PubMed] [Google Scholar]
- Liu J. and Rost B. 2004. Sequence-based prediction of protein domains Nucleic Acids Res. 32: 3522–3530. [DOI] [PMC free article] [PubMed] [Google Scholar]
- Marchler-Bauer A., Panchenko A.R., Shoemaker B.A., Thiessen P.A., Geer L.Y., Bryant S.H. 2002. CDD: A database of conserved domain alignments with links to domain three-dimensional structure Nucleic Acids Res. 30: 281–283. [DOI] [PMC free article] [PubMed] [Google Scholar]
- Marchler-Bauer A., Anderson J.B., Cherukuri P.F., DeWeese-Scott C., Geer L.Y., Gwadz M., He S., Hurwitz D.I., Jackson J.D., Ke Z.et al. 2005. CDD: A Conserved Domain Database for protein classification Nucleic Acids Res. 33: D 192–D 196. [DOI] [PMC free article] [PubMed] [Google Scholar]
- Maxwell K.L., Mittermaier A.K., Forman-Kay J.D., Davidson A.R. 1999. A simple in vivo assay for increased protein solubility Protein Sci. 8: 1908–1911. [DOI] [PMC free article] [PubMed] [Google Scholar]
- Miyazaki S., Kuroda Y., Yokoyama S. 2002. Characterization and prediction of linker sequences of multi-domain proteins by a neural network J. Struct. Funct. Genomics 2: 37–51. [DOI] [PubMed] [Google Scholar]
- Nagarajan N. and Yona G. 2004. Automatic prediction of protein domains from sequence information using a hybrid learning system Bioinformatics 20: 1335–1360. [DOI] [PubMed] [Google Scholar]
- Newman J.R., Wolf E., Kim P.S. 2000. A computationally directed screen identifying interacting coiled coils from Saccharomyces cerevisiae Proc. Natl. Acad. Sci. 97: 13203–13208. [DOI] [PMC free article] [PubMed] [Google Scholar]
- Ohgushi M. and Wada A. 1983. “Molten-globule state”: A compact form of globular proteins with mobile side-chains FEBS Lett. 164: 21–24. [DOI] [PubMed] [Google Scholar]
- Rucker E., Schneider G., Steinhauser K., Lower R., Hauber J., Stauber R.H. 2001. Rapid evaluation and optimization of recombinant protein production using GFP tagging Protein Expr. Purif. 21: 220–223. [DOI] [PubMed] [Google Scholar]
- Serber Z. and Dotsch V. 2001. In-cell NMR spectroscopy Biochemistry 40: 14317–14323. [DOI] [PubMed] [Google Scholar]
- Sim J., Kim S.Y., Lee J. 2005. PPRODO: Prediction of protein domain boundaries using neural networks Proteins 59: 627–632. [DOI] [PubMed] [Google Scholar]
- Sonnhammer E.L., Eddy S.R., Durbin R. 1997. Pfam: A comprehensive database of protein domain families based on seed alignments Proteins 28: 405–420. [DOI] [PubMed] [Google Scholar]
- Suyama M. and Ohara O. 2003. DomCut: Prediction of inter-domain linker regions in amino acid sequences Bioinformatics 19: 673–674. [DOI] [PubMed] [Google Scholar]
- Tanaka T., Kuroda Y., Yokoyama S. 2003. Characteristics and prediction of domain linker sequences in multi-domain proteins J. Struct. Funct. Genomics 4: 79–85. [DOI] [PubMed] [Google Scholar]
- Tanaka T., Yokoyama S., Kuroda Y. 2005. Improvement of domain linker prediction by incorporating loop length-dependent characteristics Biopolymers (in press). [DOI] [PubMed]
- Tyler R.C., Aceti D.J., Bingman C.A., Cornilescu C.C., Fox B.G., Frederick R.O., Jeon W.B., Lee M.S., Newman C.S., Peterson F.C.et al. 2005. Comparison of cell-based and cell-free protocols for producing target proteins from the Arabidopsis thaliana genome for structural studies Proteins 59: 633–643. [DOI] [PubMed] [Google Scholar]
- Yee A., Chang X., Pineda-Lucena A., Wu B., Semesi A., Le B., Ramelot T., Lee G.M., Bhattacharyya S., Gutierrez P.et al. 2002. An NMR approach to structural proteomics Proc. Natl. Acad. Sci. 99: 1825–1830. [DOI] [PMC free article] [PubMed] [Google Scholar]
- Yokoyama S., Hirota H., Kigawa T., Yabuki T., Shirouzu M., Terada T., Ito Y., Matsuo Y., Kuroda Y., Nishimura Y.et al. 2000. Structural genomics projects in Japan Nat. Struct. Biol. 7:Suppl, 943–945. [DOI] [PubMed] [Google Scholar]