

Abstract
Human phospholemman (PLM) is a 72-residue protein, which is expressed at high density in the cardiac plasma membrane and in various other tissues. It forms ion channels selective for K+, Cl−, and taurine in lipid bilayers and colocalizes with the Na+/K+-ATPase and the Na+/Ca2+-exchanger, which may suggest a role in the regulation of cell volume. Here we present the first structural data based on synthetic peptides representing the transmembrane domain of PLM. Perfluoro-octaneoate-PAGE of reconstituted proteoliposomes containing PLM reveals a tetrameric homo-oligomerization. Infrared spectroscopy of proteoliposomes shows that the PLM peptide is completely α-helical, even beyond the hydrophobic core residues. Hydrogen/deuterium exchange experiments reveal that a core of 20–22 residues is not accessible to water, thus embedded in the lipid membrane. The maximum helix tilt is 17° ± 2° obtained by attenuated total reflection infrared spectroscopy. Thus, our data support the idea of ion channel formation by the PLM transmembrane domain.
Keywords: secondary structure, oligomerization, membrane proteins, infrared spectroscopy, peptide, phospholemman
Phospholemman (PLM) is a 72-residue protein that is found in the central nervous system and skeletal muscle and at high density in the cardiac sarcolemma—the plasma membrane that surrounds the heart muscle fiber—from which it was first purified (Palmer et al. 1991). It is phosphorylated by protein kinase A and C at different sites in the cytoplasmic domain (Palmer et al. 1991), which suggests that PLM may be an important control point in the function of heart cells. The biological importance of PLM is further emphasized by the fact that PLM exhibits a close similarity to a number of other newly identified membrane proteins, including CHIF, RIC, and MAT-8, that form a new superfamily of membrane proteins with a single transmembrane domain (Sweadner and Rael 2000).
The function of PLM is not completely understood, yet recent evidence suggests that PLM may function as a regulator of the Na+/K+-ATPase (Silverman et al. 2005) and that it also colocalizes with the Na+/Ca2+-exchanger (Mirza et al. 2004). Electrical measurements of PLM in artificial lipid bilayers and oocytes show that PLM facilitates the membrane flux of ions (Chen et al. 1999) and taurine transport (Moorman et al. 1995). Based on these findings, it has been suggested that PLM has a function in the regulation of cell volume either by modulating of a swelling-activated signal transduction pathway or by directly facilitating osmolyte influx (Davis et al. 2004).
To date, there are no structural data available about PLM based on physical measurements, however a solid-state NMR study of the related MAT-8 and CHIF proteins shows that they have an α-helical transmembrane domain (Franzin et al. 2004). On the basis of hydropathy analysis of the amino acid sequence, PLM is predicted to have a single transmembrane domain from residues 18–37 (Palmer et al. 1991). The C terminus is located intracellularly, which has been shown by resistance to protease digestion, while the N terminus is located extracellulary, as shown by antibody labeling (Chen et al. 1998). Here we show experimentally that PLM has indeed a transmembrane domain, which forms a tetramer of α-helices in a lipid bilayer membrane. The α-helices have a predominant transmembrane orientation.
Results
Gel electrophoresis
SDS-PAGE of the lipid vesicle reconstituted PLM peptide shows a single band depicted in Figure 1B. A plot of the relative migration distance of the marker proteins against the logarithm of the molecular mass is used to determine the molecular mass of PLM as 3.9 ± 0.5 kDa. The expected molecular mass of the PLM peptide monomer is 3.04 kDa. Replacing the detergent SDS with perfluoro-octaneoate (PFO) shows again a single band at the molecular mass of 12.6 ± 0.5 kDa (Fig. 1A).
Figure 1.
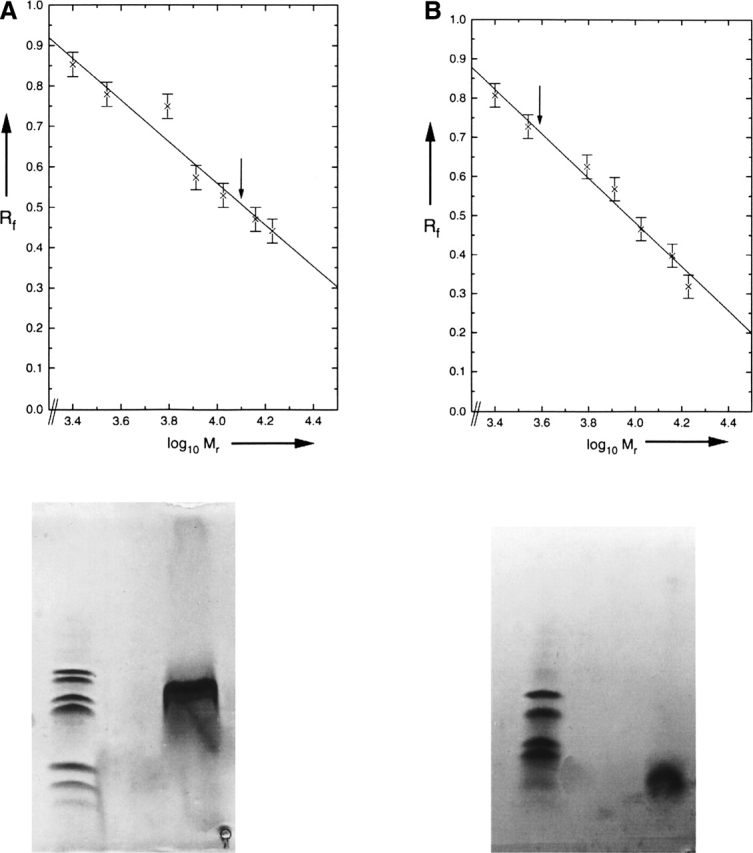
(A) (Top) Graph of the relative mobility Rf of the marker proteins in perfluoro-octaneoate (PFO)–PAGE in dependence of the logarithm of molecular mass. The arrow indicates the relative mobility of the phospholemman (PLM) peptide. (Bottom) PFO-PAGE gel showing marker proteins (left lane) and PLM (right lane). (B) Same as A for SDS-PAGE. The molecular mass of the marker proteins is 16.9 kDa, 14.4 kDa, 10.6 kDa, 8.2 kDa, 6.2 kDa, 3.5 kDa, and 2.5 kDa. The vertical bars indicate the standard error of the measurement.
Infrared spectroscopy
The amide I infrared absorption band of the lipid vesicle reconstituted PLM peptide centered at 1658 cm−1 is characteristic of predominantly α-helical structure in terms of wavenumber and band shape (Fig. 2A). To characterize the secondary structure quantitatively, a polarization-independent spectrum has been generated by combining the spectra at parallel and perpendicular polarization (Equation 1). After applying the band-narrowing technique of Fourier self-deconvolution, the spectrum can be fitted by six Gaussian curves, as shown in Figure 2B. The secondary structure composition is obtained from the relative area under each curve as 82% α-helix, 11% β-sheet, and 7.3% disordered structure. A detailed assignment of each band is presented in Table 1 (Tamm and Tatulian 1997). Furthermore, a second peptide with the residue Leu16 labeled with 13C18O at its carbonyl group shows a small absorption band at 1595 cm−1 (Fig. 3), which is consistent with this residue being in an α-helical environment (Torres et al. 2001).
Figure 2.
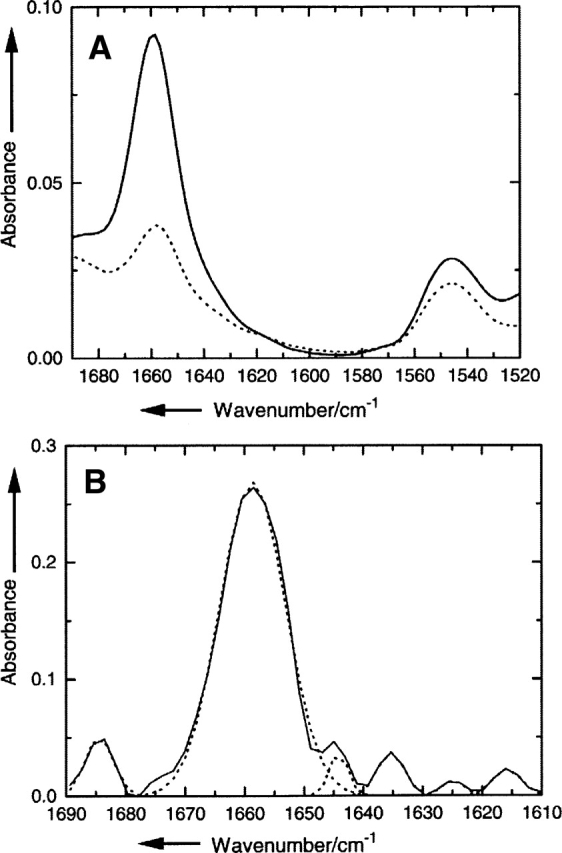
(A) Attenuated total reflection (ATR)–FTIR absorption spectra of the amide I/amide II region of lipid vesicle reconstituted PLM. The solid curve shows the spectrum obtained at a polarization parallel to the plane of incidence; the dashed curve shows the spectrum obtained at a polarization perpendicular to the plane of incidence. (B) The polarization-independent FTIR absorption spectrum after Fourier self-deconvolution (solid line). The dashed curve shows the individual component Gaussian curves used for curve-fitting the spectrum.
Table 1.
Secondary structure analysis of the lipid vesicle reconstituted PLM peptide

The assignment follows the review by Tatulian (2003) and references therein.
Figure 3.

Polarization-independent FTIR absorption spectra of lipid reconstituted PLM from H2O (solid line) and after 9 h of incubation with D2O saturated nitrogen gas (dashed line).
For orientational analysis, the dichroic ratio of the amide I band is calculated from the integrated amide I absorption at parallel and perpendicular polarized light (Equation 2) as R = 3.86 ± 0.1. With use of Equations 3 and 4, the tilt angle of the helix with respect to the bilayer normal is calculated as β = 17° ± 2°.
The polarization-independent absorption spectrum after 9 h of incubation with D2O-saturated nitrogen, shown in Figure 3 (dotted line), reveals only a small amount of exchange. Integration of the amide II band yields an exchange of 24 ± 3%, which remains constant between 6 and 24 h. Please note that a peptide with the residue Leu16 labeled with 13C18O at its carbonyl group has been used for the deuterium/exchange study, which does not affect the results.
Discussion
The method of PFO-PAGE has been developed recently to study the oligomerization of transmembrane protein complexes (Ramjeesingh et al. 1999) and has been used successfully for synthetic peptides (Therien and Deber 2002). For a PLM transmembrane peptide, we find Mr = 12.6 kDa, which corresponds to a tetrameric oligomerization (n = 4.1), given that the monomer mass is Mr = 3.04 kDa. Higher and lower oligomerization states would be clearly resolved on the gel (Fig. 1A) but no other distinctive bands are visible. Thus we can safely conclude that the PLM peptide forms a tetramer in lipid vesicles. The oligomerization is clearly disrupted by SDS, as shown in Figure 1B by the appearance of one band at Mr = 3.9 kDa. The difference to the expected peptide molecular mass of 3.04 kDa reflects the inaccuracy of gel electrophoresis to detect this low-molecular-mass compound; the accuracy based on the standard error is, however, sufficient to distinguish among monomer, dimer, trimer, and higher oligomerization species.
The secondary structure analysis reveals that the peptide is mainly α-helical in a lipid bilayer. The small β-sheet content of 11% reflects most likely unspecific aggregation of peptide, which did not insert into the lipid bilayer, a phenomenon that is commonly observed with hydrophobic peptide preparations (Kukol and Arkin 2000). By taking into account only the lipid bilayer inserted amounts of 82% α-helix and 7.3% disordered structure, we can derive that 26 amino acid residues are in an α-helical conformation, while two residues are in a disordered random coil conformation.
The helix tilt angle of β = 17° ± 2° reveals that the peptide has a predominantly trans-bilayer orientation as opposed to an orientation parallel to the membrane plane. It should be stressed however, that the angle of 17° reflects a maximum tilt angle, assuming that the sample is perfectly ordered as pointed out by Arkin et al. (1997). The actual tilt angle is likely to be lower because perfect sample order cannot be achieved with the present method of preparation. The fraction of ordered sample is typically between 0.6 and 0.8 as obtained by site-specific dichroism analysis of multiply labeled samples for a similar system (Kukol et al. 1999). The tilt angle taken together with the calculated length of the helical segment strongly indicates that the helix segment extends beyond the lipid bilayer into the solution phase. Embedding an α-helix of 26 residues in a lipid bilayer would require higher tilt angles. Alternatively, the local thickness of the bilayer could be slightly larger to account for any hydrophobic mismatch, but given that there is a strong hydrophobic core of only 19 amino acid residues, this possibility seems unlikely. From the amount of hydrogen/deuterium exchange of 24 ± 3% (Fig. 3), we obtain that 7 ± 1 residues are accessible to water. That means that the lipid membrane embedded part is 20–22 residues long.
Based on the considerations above, we present the following tentative model of the PLM transmembrane domain (Fig. 4), a tetramer of α-helices tilted by 17° against the bilayer normal. The helix extends beyond the hydrophobic transmembrane core of ≥20 amino acid residues (Fig. 4, shown in light gray) to at least 26 residues. This model explains the experimental findings of ion channel activity of PLM (Kowdley et al. 1997; Chen et al. 1999; Kadowaki et al. 2004) in the way that a tetramer is able to form a hydrophilic pore lined by the carbonyl groups of the peptide backbone through the lipid bilayer. While the role of PLM has been mainly discussed in terms of an efflux pathway, the short extracellular domain shows a remarkable resistance against proteases (Chen et al. 1998), which is supported by our finding that the α-helical structure extends into the extracellular space, possibly forming a well-defined structure for the entrance of ions or osmolytes. While our model sheds light on the proposed function of PLM as a transmembrane channel permeable to ions and small molecules (Davis et al. 2004), the function as a regulator of the Na+/K+-ATPase or the Na+/Ca2+-exchanger found in cardiac and skeletal muscle cells remains unexplained. It should, however, be noted that long-term cell volume regulation is due to the maintenance of ion gradients by the Na+/K+-ATPase (Lang et al. 1998).
Figure 4.
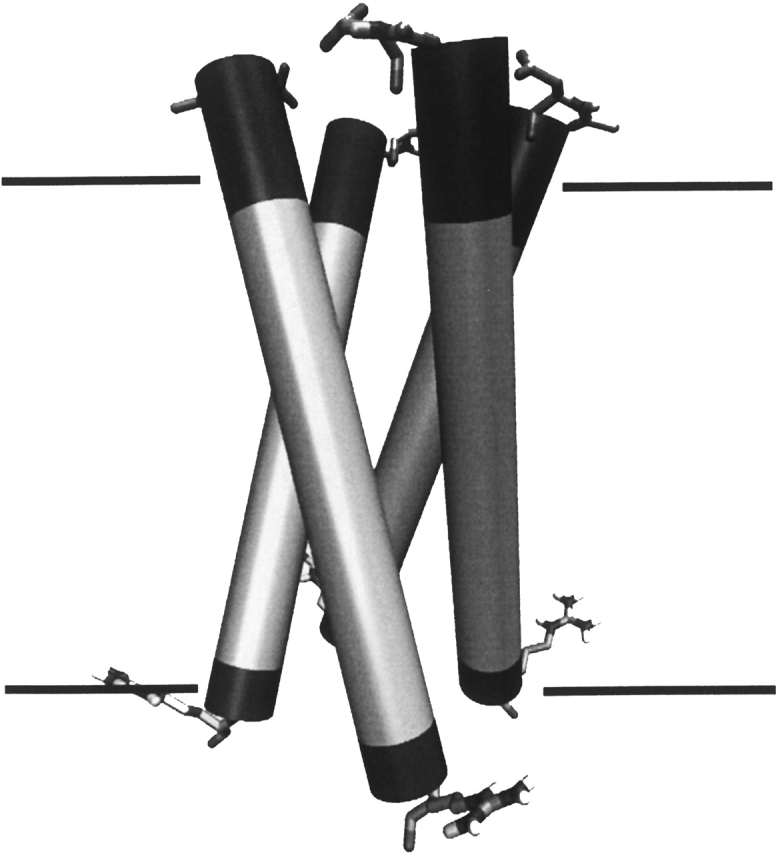
Model of the PLM transmembrane domain, representing α-helices as cylinders. The light gray shading highlights the hydrophobic amino acid residues, while the hydrophilic residues are shaded in dark gray. The approximate position of the lipid bilayer is indicated. The top part of the figure represents the extracellular region, and the bottom part, the intracellular region. The N-terminal Asp (top) and C-terminal Arg residues of the transmembrane peptide oligomer are highlighted. This figure was created with VMD (Humphrey et al. 1996).
Conclusion
This work presents the first experimental evidence that PLM is α-helical and inserts into lipid membranes in a trans-bilayer fashion, forming a tetramer. Further experiments are necessary to resolve the detailed transmembrane structure, as it is possible with the method of site-specific infrared dichroism (Kukol 2005). The ion channel properties of PLM have been studied so far with full-length PLM and a truncated version (residues 1–43). Given that the C terminus 1–18 is highly protease resistant, it may have a substantial effect on the channel properties. Electrical conductance measurements of the transmembrane domain on its own would help to understand the function of the C-terminal domain. While an increasing amount of structural and functional information is emerging, significantly more experimental data are necessary to understand this seemingly simple protein.
Materials and methods
Peptide purification and reconstitution
Two synthetic peptides corresponding to the predicted transmembrane domain of human PLM of the sequence DYQSLQIGGLVIAGIL*FI-LGILIVLSRR (Mr = 3042) were obtained by standard solid-phase FMOC-chemistry (Advanced Biotechnology Centre). The second peptide contained a 13C18O carbonyl group labeled Leu residue at the position 16, indicated with a star, but it is otherwise chemically identical. The Leu label was produced from 1-13C-labeled Leu (Cambridge Isotopes) by acid catalyzed oxygen exchange in 95% enriched H218O (Campro Scientific) as described previously (Torres et al. 2001). The peptides were further purified, as described elsewhere (Kukol et al. 1999), for analogous transmembrane peptides. Briefly, the peptide was dissolved in trifluoroacetic acid and purified by reversed-phase chromatography (Jupiter 5C4–300 Å column, Phenomenex). Peptide elution was achieved with a linear gradient to a final solvent composition of 5% H2O, 38% acetonitrile, and 57% 2-propanol. All solvents contained 0.1% (v/v) trifluoroacetic acid. The correct molecular mass of the peptide in each fraction was checked by positive ion electrospray mass spectrometry. After lyophilization of the pooled fractions, the peptide was dissolved in 1,1,1,3,3,3-hexafluoro-2-propanol, containing the lipid dimyristoylphosphocholine (Sigma), to a peptide-to-lipid ratio of 1:25 (w/w). The organic solvent was removed by rotational evaporation under vacuum at room temperature. Lipid vesicles were formed by adding water to a lipid concentration of 10 mg/mL and gentle rotation of the flask for 20 min followed by 2-min sonication. Subsequently, the mixture was frozen and thawed three times to achieve a homogenous peptide/lipid distribution and stored frozen for further analysis.
Gel electrophoresis
The standard tris-tricine peptide separation method of Schagger and von Jagow (1987) was employed. Samples were run on precast tris-tricine 10%–20% polyacrylamide gradient gels obtained from Bio-Rad Laboratories. Depending on the gel in question, sample buffers contained either 4% (w/v) SDS or 4% (w/v) PFO. Likewise, cathode running buffers contained either 0.1% (w/v) SDS or PFO. Lipid–peptide samples were mixed 1:1 with sample buffers, centrifuged at 10,000 rpm for 5 min, and then loaded on the gel (Ramjeesingh et al. 1999). For SDS-PAGE, the sample was heated for 5 min to 95°C prior to mixing with sample buffers. Gels were run at a constant voltage of 50 V. In the case of PFO-PAGE, the gel was run in a controlled temperature environment of ∼4°C, in order to maintain weakly associated complexes. Molecular mass markers were obtained from Sigma Laboratories. Gels were stained with colloidal Coomassie blue. The relative mobility Rf of a band was obtained by dividing the distance for the particular band by the maximum distance for the sample buffer.
Infrared spectroscopy
Fourier transform infrared spectra (FTIR) were recorded on a Bruker Tensor spectrometer (Bruker Optics) equipped with a high-sensitivity liquid nitrogen–cooled MCT/A detector and purged with dry air at a dew point of −73°C (Parker Purge Gas Generator). Attenuated total reflection (ATR)–FTIR spectra were measured with a 25-reflections ATR accessory from Graseby Specac and a wire grid polarizer (0.25 μm, Graseby Specac). One hundred microliters of the peptide/lipid solution in hexafluoroisopropanol was dried onto a germanium trapezoidal internal reflection element (50 × 2 × 20 mm) under a stream of nitrogen. After the solvent was removed, the lipid/protein film was hydrated for 12 h with a water-saturated stream of nitrogen. Dichroic ratios similar to lipid vesicle solutions in water were achieved through this procedure (data not shown). After removal of excess water, the FTIR spectrum of a semi-dried lipid film was obtained from 1000 averaged interferograms and one point zero filling Happ-Genzel apodization. Absorption spectra were recorded at parallel (Aparallel) and perpendicular polarization (Aperpendicular). Typically three independent measurements were performed.
For hydrogen/deuterium exchange, the lipid/protein film was subjected to a stream of deuterium oxide–saturated nitrogen for up to 24 h, while spectra were measured every 3 h.
Data analysis
For secondary structure analysis, a polarization-independent spectrum was obtained by combining the spectra at parallel and perpendicular polarization (Marsh 1999):
A spectrum obtained at one polarization alone cannot be used, because intensities may depend on orientation rather than the amount of a specific secondary structure element. The so-obtained polarization-independent spectrum is equivalent to a transmission spectrum obtained without polarization.
Fourier self-deconvolution (Kauppinen et al. 1981) was applied to the amide I region of the spectrum in order to resolve the fine structure of the absorption band. The enhancement factor used was 2.0 and the half-height bandwidth was set at 13 cm−1, as reported previously for secondary structure analysis (Byler and Susi 1986).
For orientational analysis, the dichroic ratio, R, was calculated as the ratio between the integrated absorption, A, of parallel and perpendicular polarized light of the amide I absorption band between 1670 and 1645 cm−1:
 |
The dichroic ratio is related to the order parameter S (Fringeli and Gunthard 1981):
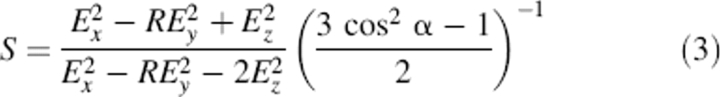 |
whereby α = 39° is the angle between the molecular director and the transition dipole moment of the amide I vibration mode (Marsh et al. 2000), and Ex, Ey, and Ez are the electric field components of the evanescent field given by Harrick (1967) as Ex = 1.399, Ey = 1.514, and Ez = 1.621, assuming that the thickness of the deposited film is much larger than the penetration depth of the evanescent field. For α-helical peptides, the order parameter S can be used to calculate the tilt angle β between the helix and the axis normal to the membrane plane (Fringeli and Gunthard 1981):
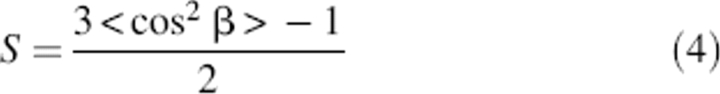 |
The helix tilt obtained in this way is only a maximum value, assuming that the protein sample is completely ordered, as pointed out by Arkin et al. (1997).
To analyze the hydrogen/deuterium exchange, the amide II band between 1525 and 1570 cm−1 of the polarization-independent spectrum was integrated, and its area, AII, was corrected by dividing by the total amide I area (y = AII/AI) in order to account for changes in band intensities due to swelling of the sample. The amount of D2O exchange was then calculated by dividing the corrected amide II area in D2O by the corrected amide II area in H2O.
Acknowledgments
We thank Dr. David Roper and Anne Blewett for helpful suggestions about gel-electrophoresis and Dr. Teresa Pinheiro for generous access to the FTIR spectrometer funded by the Medical Research Council, UK, grant no. G9901445. This work has been funded by the Biotechnology and Biological Sciences Research Council, UK, grant no. 88/B19450.
Footnotes
Reprint requests to: Dr. Andreas Kukol, Department of Biological Sciences, The University of Warwick, Coventry CV4 8HE, United Kingdom; e-mail: a.kukol@warwick.ac.uk; fax: 44 (0)-24-7652-3701.
Article published online ahead of print. Article and publication date are at http://www.proteinscience.org/cgi/doi/10.1110/ps.051899406.
References
- Arkin I.T., MacKenzie K.R., Brünger A.T. 1997. Site-directed dichroism as a method for obtaining rotational and orientational constraints for orientated polymers J. Am. Chem. Soc. 119: 8973–8980. [Google Scholar]
- Byler D.M. and Susi H. 1986. Examination of the secondary structure of proteins by deconvolved FTIR spectra Biopolymers 25: 469–487. [DOI] [PubMed] [Google Scholar]
- Chen Z., Jones L.R., O'Brian J.J., Moorman J.R., Cala S.E. 1998. Structural domains in phospholemman: A possible role for the carboxyl terminus in channel inactivation Circ. Res. 82: 367–374. [DOI] [PubMed] [Google Scholar]
- Chen Z.H., Jones L.R., Moorman J.R. 1999. Ion currents through mutant phospholemman channel molecules Receptors Channels 6: 435–447. [PubMed] [Google Scholar]
- Davis C.E., Patel M.K., Miller J.R., John J.E. III, Jones L.R., Tucker A.L., Mounsey J.P., Moorman J.R. 2004. Effects of phospholemman expression on swelling-activated ion currents and volume regulation in embryonic kidney cells Neurochem. Res. 29: 177–187. [DOI] [PubMed] [Google Scholar]
- Franzin C.M., Choi J., Zhai D., Reed J.C., Marassi F.M. 2004. Structural studies of apoptosis and ion transport regulatory proteins in membranes Magn. Reson. Chem. 42: 172–179. [DOI] [PMC free article] [PubMed] [Google Scholar]
- Fringeli U.P. and Gunthard H.H. 1981. Infrared membrane spectroscopy In Membrane spectroscopy (ed. Grell E.) . pp. 270–332. Springer Verlag, Berlin.
- Harrick N.J. In Internal reflection spectroscopy . 1967. Interscience Publishers, New York.
- Humphrey W., Dalke A., Schulten K. 1996. VMD: Visual molecular dynamics J. Mol. Graph. 14: 33–38. [DOI] [PubMed] [Google Scholar]
- Kadowaki K., Sugimoto K., Yamaguchi F., Song T., Watanabe Y., Singh K., Tokuda M. 2004. Phosphohippolin expression in the rat central nervous system Brain Res. Mol. Brain Res. 125: 105–112. [DOI] [PubMed] [Google Scholar]
- Kauppinen J.K., Moffat D.J., Mantsch H.M., Cameron D.G. 1981. Fourier self-deconvolution: A method for resolving intrinsically overlapped bands Appl. Spectrosc. 35: 271–276. [Google Scholar]
- Kowdley G.C., Ackerman S.J., Chen Z., Szabo G., Jones L.R., Moorman J.R. 1997. Anion, cation, and zwitterion selectivity of phospholemman channel molecules Biophys. J. 72: 141–145. [DOI] [PMC free article] [PubMed] [Google Scholar]
- Kukol A. 2005. Site-specific IR spectroscopy and molecular modelling combined towards solving transmembrane protein structure Spectroscopy 19: 1–16. [Google Scholar]
- Kukol A. and Arkin I.T. 2000. Structure of the Influenza C CM2 protein transmembrane domain obtained by site-specific infrared dichroism and global molecular dynamics searching J. Biol. Chem. 275: 4225–4229. [DOI] [PubMed] [Google Scholar]
- Kukol A., Adams P.D., Rice L.M., Brunger A.T., Arkin I.T. 1999. Experimentally based orientational refinement of membrane protein models: A structure for the influenza A M2 H+channel J. Mol. Biol. 286: 951–962. [DOI] [PubMed] [Google Scholar]
- Lang F., Busch G.L., Ritter M., Votkl H., Waldegger S., Gulbins E., Haussinger D. 1998. Functional significance of cell volume regulatory mechanisms Physiol. Rev. 78: 247–306. [DOI] [PubMed] [Google Scholar]
- Marsh D. 1999. Quantitation of secondary structure in ATR infrared spectroscopy Biophys. J. 77: 2630–2637. [DOI] [PMC free article] [PubMed] [Google Scholar]
- Marsh D., Muller M., Schmitt F.-J. 2000. Orientation of the infrared transition moments for an α-helix Biophys. J. 78: 2499–2510. [DOI] [PMC free article] [PubMed] [Google Scholar]
- Mirza M.A., Zhang X.Q., Ahlers B.A., Qureshi A., Carl L.L., Song J., Tucker A.L., Mounsey J.P., Moorman J.R., Rothblum L.I.et al. 2004. Effects of phospholemman downregulation on contractility and Ca2+i transients in adult rat cardiac myocytes Am. J. Physiol. Heart Circ. Physiol. 286: H1322–H1330. [DOI] [PubMed] [Google Scholar]
- Moorman J.R., Ackerman S.J., Kowdley G.C., Griffin M.P., Mounsey J.P., Chen Z., Cala S.E., O'Brian J.J., Szabo G., Jones L.R. 1995. Unitary anion currents through phospholemman channel molecules Nature 377: 737–740. [DOI] [PubMed] [Google Scholar]
- Palmer C.J., Scott B.T., Jones L.R. 1991. Purification and complete sequence determination of the major plasma membrane substrate for cAMP-dependent protein kinase and protein kinase C in myocardium J. Biol. Chem. 266: 11126–11130. [PubMed] [Google Scholar]
- Ramjeesingh M., Huan L.-J., Garami E., Bear C. 1999. Novel method for evaluation of the oligomeric structure of membrane proteins Biochem. J. 342: 119–123. [PMC free article] [PubMed] [Google Scholar]
- Schagger H. and von Jagow G. 1987. Tricine-sodium doceyl sulfate–polyacrylamide gel electrophoresis for the separation of proteins in the range from 1 to 100 kDa Anal. Biochem. 166: 368–379. [DOI] [PubMed] [Google Scholar]
- Silverman B.Z., Fuller W., Eaton P., Deng J., Moorman J.R., Cheung J.Y., James A.F., Shattock M.J. 2005. Serine 68 phosphorylation of phospholemman: Acute isoform-specific activation of cardiac Na/K ATPase Cardiovasc. Res. 65: 93–103. [DOI] [PubMed] [Google Scholar]
- Sweadner K.J. and Rael E. 2000. The FXYD gene family of small ion transport regulators or channels: cDNA sequence, protein signature sequence, and expression Genomics 68: 41–56. [DOI] [PubMed] [Google Scholar]
- Tamm L.K. and Tatulian S.A. 1997. Infrared spectroscopy of proteins and peptides in lipid bilayers Q. Rev. Biopyhs. 30: 365–429. [DOI] [PubMed] [Google Scholar]
- Tatulian S.A. 2003. Attenuated total reflection Fourier transform infrared spectroscopy: A method of choice for studying membrane proteins and lipids Biochemistry 42: 11898–11907. [DOI] [PubMed] [Google Scholar]
- Therien A.G. and Deber C.M. 2002. Oligomerization of a peptide derived from the transmembrane region o the sodium pump γ-subunit: Effect of the pathological mutation G41R J. Mol. Biol. 322: 583–590. [DOI] [PubMed] [Google Scholar]
- Torres J., Kukol A., Arkin I.T. 2001. Site specific examination of secondary structure and orientation determination in membrane proteins: The peptidic 13C=18O group as a novel infrared probe Biopolymers 59: 396–401. [DOI] [PubMed] [Google Scholar]