

Abstract
Biological polymers are expected to exhibit functionally relevant, global, and subglobal collective modes in the terahertz (THz) frequency range (i.e., picosecond timescale). In an effort to monitor these collective motions, we have experimentally determined the absorption spectrum of solvated bovine serum albumin (BSA) from 0.3 to 3.72 THz (10–124 cm−1). We successfully extract the terahertz molar absorption of the solvated BSA from the much stronger attenuation of water and observe in the solvated protein a dense, overlapping spectrum of vibrational modes that increases monotonically with increasing frequency. We see no evidence of distinct, strong, spectral features, suggesting that no specific collective vibrations dominate the protein's spectrum of motions, consistent with the predictions of molecular dynamics simulations and normal mode analyses of a range of small proteins. The shape of the observed spectrum resembles the ideal quadratic spectral density expected for a disordered ionic solid, indicating that the terahertz normal mode density of the solvated BSA may be modeled, to first order, as that of a three-dimensional elastic nanoparticle with an aperiodic charge distribution. Nevertheless, there are important detailed departures from that of a disordered inorganic solid or the normal mode densities predicted for several smaller proteins. These departures are presumably the spectral features arising from the unique molecular details of the solvated BSA. The techniques used here and measurements have the potential to experimentally confront theoretical calculations on a frequency scale that is important for macromolecular motions in a biologically relevant water environment.
Keywords: other spectroscopies, biopolymers, collective vibrational modes, far infrared, free electron laser, submillimeter wave, terahertz
Biological polymers are expected to exhibit broad vibrational spectral features in the terahertz regime corresponding to functionally relevant, global and subglobal collective modes with periods on the picosecond timescale. This hypothesis is supported by theoretical molecular dynamics studies and normal mode calculations that paint a picture consistent with the biological relevance of low-frequency biopolymer dynamics and suggest the existence of a large number of terahertz collective modes in biomaterials (Brooks and Karplus 1983, 1985; Go et al. 1983; Chen and Prohofsky 1995; Hinsen 1998; Dauber-Osguthorpe et al. 1999; van Vlijmen and Karplus 1999; Tama et al. 2000).
Terahertz absorption spectroscopy directly probes such collective modes and provides valuable experimental data to test the validity of these theoretical calculations. While mostly limited to frequencies <2 THz, previous investigations confirm the postulated broad terahertz absorption of various proteins (Markelz et al. 2000, 2002; Whitmire et al. 2003; Zhang et al. 2004), nucleic acids (DNA and RNA) (Markelz et al. 2000; Fisher et al. 2002; Globus et al. 2003), and whole tissues (Han et al. 2000; Fitzgerald et al. 2003; Woodward et al. 2003; Walker et al. 2004). Unfortunately, however, due to the strong frequency-dependent terahertz attenuation of water, these studies have been limited to dry, or at best, partially hydrated samples. While partial hydration with water vapor may approximate aqueous biopolymer dynamics, such solid samples may not faithfully reproduce the biologically relevant, fully solvated condition. Here we report, in contrast, the terahertz absorption and low-frequency collective dynamics of a protein in aqueous solution at room temperatures from 0.3 to 3.72 THz.
Results
For this study we have chosen bovine serum albumin (BSA) as a representative biomolecule. BSA is a monomeric protein of molecular weight 66.4 kDa and shares 76% sequence homology with human serum albumin (PDB code 1AO6) (Huang et al. 2004).
Effect of concentration and Beer's Law behavior
Consistent with Beer's Law, the 1.56-THz absorption of BSA solutions varies linearly with concentration (Fig. 1). Of note, because the terahertz absorption of BSA is not as large as that of the solvent it displaces, the net solution absorption reduces with increasing concentration of the solute (Fig. 1). Upon subtraction of the strong background from water, we find that the molar absorption of solvated BSA does not vary significantly with solution concentration (Fig. 2). This is consistent with the assumption of Beer's Law that molar absorption is a concentration-independent optical property unique for each frequency. For the studies outlined below, we focus on the more concentrated solutions (∼27% BSA [w/w]) to achieve higher measurement accuracy (Fig. 2).
Figure 1.

The terahertz absorption of BSA solutions at 1.56 THz varies linearly with solute concentration, consistent with Beer's Law. Of note, the observed extinction decreases with increasing solution concentration, indicating that the terahertz absorption of BSA is not as great as that of the water it displaces.
Figure 2.

The extracted molar absorption of solvated BSA at 1.56 THz does not vary significantly with concentration. This allows us to focus on more concentrated, more readily measured solutions (∼27% BSA [w/w]) in this study.
Terahertz absorption spectrum of solvated BSA
We have measured the terahertz absorption spectrum of both our buffer blank and buffered BSA solutions (Fig. 3). By calculating the amount of buffered water displaced by the BSA solute and neglecting potentially important issues related to the hydration shell, we estimated the solvent baseline arising from the remaining bulk water. This baseline is consistently lower than the measured solution extinction, indicating that BSA solute does not simply displace solvent but also contributes to the absorption of terahertz radiation. We then extracted this contribution and obtained a measure of the corresponding molar absorption of the solvated BSA (Fig. 4). We observe a broad spectrum with strong monotonic frequency-dependent increase up to at least 3.72 THz without any distinct resonances apparent at the resolution of our spectra.
Figure 3.

We measure the absorptions of both buffer blanks (•) and BSA solutions (○), and estimate the solvent baseline arising from the bulk water remaining in solution (♦). This baseline is consistently lower than the measured solution extinction, indicating that the BSA solute does not simply displace water but also contributes to the absorption of terahertz radiation. Correction to account for hydration would further reduce the solvent baseline (data not shown).
Figure 4.

We examine the hydration effect of the solvated protein via two assumptions—with (○) and without (•) correction to account for hydration layer surrounding each BSA molecule in solution. Uncertainty in the actual hydration suggests that we should use the region between these two extremes, with (○) and without (•) hydration-shell correction, as the absorption spectrum of solvated BSA. The monotonic frequency-dependent increase previously reported below 2 THz in dry samples (solid line) (Markelz et al. 2000) continues to at least 3.72 THz in solution phase (this study). (The apparent sharp resonances in dry BSA measurements are artifacts arising from the large noise-to-signal ration at the higher frequencies, as pointed out by Markelz et al. [2000].) Whereas below ∼1 THz the spectrum of solvated BSA is within error of that reported for the dry protein pellets (solid line) (Markelz et al. 2000), significant deviations are observed at higher frequencies where solvation may have served to enhance the terahertz dynamics of BSA. It is perhaps worth noting that the correspondence observed below 1 THz is quantitative; that is, the absolute absorbance of dry and solvated BSA are within error of one another, and no scaling was required in order to produce these effectively overlapping spectra.
Effect of bound water on terahertz vibrational dynamics: Hydration shell
The above analysis assumes that the solvent behaves as if it were in a BSA-free environment, but some of the water in solution will interact strongly with the protein and is perhaps best described as part of the protein dynamics (García de la Torre 2001; Perkins 2001; Peon et al. 2002). (Even as solid, lyophilized powders, proteins retain ∼1%–2% [w/w] residual water [Kim and Kim 1996; El Moznine et al. 2003].) If we treat this bound water as an integral component of the solvated protein, the absorption background arising from the remaining bulk water would reduce accordingly (Fig. 3).
In an effort to account for the effect of hydration, we assume a strongly adsorbed, dynamically linked water layer surrounding each BSA molecule in solution. Following previous serum albumin modeling efforts (García de la Torre 2001) and using 10 nm as the diameter of a native BSA molecule (Mattison and Kaszuba 2004), we estimate that this hydration layer contains ∼300 water molecules. The resulting terahertz molar absorption of the solvated BSA increases accordingly with additional contribution from the bound water, but the overall spectrum is not largely altered (Fig. 4). Uncertainty in the actual hydration suggests that we should consider the region between these two extremes, with and without hydration-shell correction, as the terahertz absorption spectrum of solvated BSA.
Solvated versus dry BSA
The monotonic frequency-dependent increase previously reported below 2 THz for dry samples of BSA (Markelz et al. 2000) continues to at least 3.72 THz in solution phase (this study). We do not observe any discrete spectral features in either dry or solvated BSA. (The apparent sharp resonances in dry BSA measurements are artifacts arising from the large noise-to-signal ratio at higher frequencies, as pointed out by Markelz et al. [2000].) We observe effectively quantitative agreement (without any scaling) between the spectra of dry and solvated BSA below ∼1 THz. In contrast, we observe significant discrepancies at higher frequencies where solvation may serve to enhance the terahertz dynamics of the BSA protein (Fig. 4).
Validity of measurement protocol: Solvated BSA versus water
The solvated BSA spectrum does not simply reproduce the spectral shape observed in water (Kindt and Schmuttenmaer et al. 1996; Xu et al. 2006) (Fig. 5), suggesting that even though the terahertz absorption of BSA solutions is dominated by that of water, careful background subtraction recovers the true spectrum of the solute. Furthermore, the observed Beer's Law behavior (Figs. 1,2) indicates that the extracted molar extinctions of the solvated BSA are proportional to their true values, and the quantitative agreement between our spectrum and that obtained for dry BSA (Markelz et al. 2000) (Fig. 4) indicates that the proportionality constant is effectively unity. It thus appears that our spectroscopic approach successfully extracts the low-frequency dynamics of a protein in liquid water even against the enormously larger background caused by the terahertz absorbance of the solvent.
Figure 5.

The terahertz absorption spectrum of the solvated protein (shaded area) is very distinct from that of water (▾ [Kindt and Schmuttenmaer 1996] and • [Xu et al. 2006]). Taken together with the demonstrated Beer's law behavior (Figs. 1,2) and the quantitative agreement between the extinction coefficients of solvated (this study) and dry (Markelz et al. 2000) BSA, this supports the validity of the spectroscopic measurement protocol that we developed and used in this work to extract low-frequency dynamics of a protein against the significantly larger background absorption by liquid water.
Discussion
We have successfully characterized the terahertz absorption of a representative protein, BSA, in water. We observe a broad, monotonic increase with frequency without any discrete spectral features apparent at the used spectral resolution. Remarkably, without any scaling, the spectrum of solvated BSA is within error of that reported for the dry protein below ∼1 THz. Above this frequency, however, solvation-dependent deviations are apparent (Fig. 4).
The relatively featureless spectrum of solvated BSA is also in excellent agreement with previously published measurements in dry samples of BSA (Markelz et al. 2000), hen egg white lysozyme (HEWL), myoglobin, and bacteriorhodopsin (BR) (Markelz et al. 2002). As pointed out by Markelz and colleagues, the apparent sharp resonances in dry BSA measurements are artifacts arising from the large noise-to-signal ratio at higher frequencies(Markelz et al. 2000), and the regularly spaced peaks overlaying the smooth broad spectra of dry HEWL and myoglobin are due to interference effects in experimental setup (Markelz et al. 2002). Even though interference effects are minimized for measurements in dry BR, the three available spectra for wild-type BR at room temperature reproduce each other only in their broad linear frequency dependence and not in terms of their potential resonant peaks (Figs. 6 and 7 in Markelz et al. 2002). (Absolute molar extinction for these dry proteins is available only for BSA; hence, quantitative comparison is only carried out between the solvated [this study] and the dry [Markelz et al. 2000] BSA).
Figure 6.

The shape of the BSA spectrum closely resembles that of the previously published terahertz spectrum of fused quartz (○) (Parker et al. 1977) and an ideal quadratic spectral density expected for a disordered ionic solid (Kittle 1996). The spectrum of the low-lying vibrational modes of the native BSA protein may be modeled, to first order, as a three-dimensional, elastic nanoparticle with aperiodic charge distribution. Small but significant departures from the simple quadratic behavior of a disordered solid are, however, observed for the solvated protein. These deviations are presumably the spectral signatures arising from the unique molecular details of the solvated BSA.
Figure 7.

Solution density increases linearly with BSA concentration up to ∼30% BSA weight per solution weight. For this work, we used fairly large concentrations of BSA (27% BSA [w/w]), approaching the protein solubility limit. The error bars (○) are standard deviations of approximately eight measurements. Some data are derived from only one measurement (•) and thus lack uncertainty estimation.
Similarly, the largely featureless spectrum observed for solvated BSA is consistent with prior studies of damp myoglobin (42% water [w/w]) (Zhang et al. 2004) that also reports a lack of identifiable sharp features between 0.2 and 2 THz, even at a spectral resolution of 15 GHz. In contrast to these studies of dry and damp proteins, however, Globus et al. (T. Globus, D. Woolard, T.W. Crowe, T. Khromova, B.L. Gelmont, and J. Helser, pers. comm.) recently reported that aqueous DNA exhibits multiple, narrow resonances over the 0.3–0.75 THz frequency range. Whether this discrepancy represents fundamental differences between the collective vibrational modes of DNA and proteins will require further study, but, given the periodic distribution of charges on DNA, it is perhaps not surprising that, unlike proteins, DNA may exhibit significant deviations from the simple, quadratic spectral density of vibrational modes expected for a disordered solid (see below).
The relatively featureless, monotonically increasing terahertz absorption observed for solvated BSA largely resembles the quadratic spectral density expected for a simple disordered ionic solid (Kittle 1996), as observed for fused quartz (Randall and Rawcliffe 1967; Bagdade and Stolen 1968; Parker et al. 1977; Grischkowsky et al. 1990) (Fig. 6). Such a dependency is understood as follows: The density of the available low-lying vibrational modes increases quadratically with frequency for a three-dimensional solid (Kittle 1996). The aperiodic charge distribution present in disordered material allows the nearly uniform terahertz electric field to couple to all of these available modes, and the vibrational spectral shape thus reflects this underlying quadratic mode density. While there are important departures from simple quadratic behavior expected for a homogeneously disordered solid, there are no sharp, strong features dominating the protein's spectrum of motions over the observed frequency range, which suggests that the low-lying vibrational mode density of the solvated BSA protein may also be modeled, to first order, as that of a three-dimensional elastic nanoparticle with aperiodic charge distribution. On the other hand, these small but statistically significant departures from the quadratic behavior (Fig. 6) presumably arise from the unique molecular details of the solvated protein and may be the spectral signature of the solvated BSA. This is consistent with the assessment by Markelz et al. (2002) that protein identification by THz absorption spectroscopy will be difficult.
We should note, however, that the lack of sharp resonances does not imply the lack of observable collective vibrational modes in the solvated BSA. On the contrary, rather than a few distinct resonances, the observed monotonic increase in absorption with increasing frequency is consistent with the postulated densely populated, largely overlapping vibrational modes of biopolymers in the terahertz frequency range (Brooks and Karplus 1983, 1985; Go et al. 1983; Chen and Prohofsky 1995; Hinsen 1998; Dauber-Osguthorpe et al. 1999; van Vlijmen and Karplus 1999; Tama et al. 2000; Markelz et al. 2002; Whitmire et al. 2003). Specifically, molecular dynamics simulation and normal mode analysis have been performed for several small proteins, including bovine pancreatic trypsin inhibitor (Brooks and Karplus 1983; Go et al. 1983; Hinsen 1998), lysozyme (Hinsen 1998; Markelz et al. 2002), myoglobin (Markelz et al. 2002), and bacteriorhodopsin (Whitmire et al. 2003). They suggest a common trend: a rapid rise with frequency in the density of vibrational modes, followed by a plateau or saturation at higher frequencies. In contrast, the absorption of solvated BSA continues to increase strongly to at least 3.72 Thz, indicating that, if it occurs at all, the high-frequency saturation, or “roll over,” of the macromolecular vibrations may be at much higher frequencies in BSA than is predicted for the aforementioned proteins.
The ability to measure terahertz absorbance of biomolecules in solution has the potential to experimentally confront molecular dynamics calculations on the frequency scale of biologically relevant macromolecular motions. Experiments are underway to document other proteins, the effect of solvent pH, and the effect of denaturing agents. Further, if we consider the folded protein as a nanoparticle with aperiodic charge distribution, the vibrational mode density will experience a low-frequency cutoff as the effective mode wavelength exceeds the protein size. Experiments that explore the solvated protein absorption in this limit (0.075–0.3 THz) are compelling and are being pursued.
Materials and methods
Materials and solution preparation
BSA (Cohn Fraction V, lyophilized powder without further purification from Sigma-Aldrich) was taken up in pH 8 buffer (50 mM phosphate in distilled deionized water) with 0.05% azide (added to prevent bacterial growth). A buffer blank was used as the reference. Precise knowledge of the BSA density, hence molarity, is required to reliably extract the molar extinction. For this work, we have used fairly large concentrations of BSA, approaching the solubility limit, with solution being ∼27% BSA (w/w). Uniform and successful solvation of BSA in water was verified by examining the linearity of solution density versus concentration (Fig. 7).
Absorption measurements
We have developed a terahertz absorption spectrometer appropriate for strongly absorbing liquid medium, such as water, with frequency-dependent absorption lengths on the order of tens of micrometers (Xu et al. 2006). Our spectrometer combines kilowatt-power terahertz radiation from the UCSB free-electron lasers with an ultrasensitive cryogenic detector (noise equivalent power ∼ 10−12 watts/Hz1/2) and is able to recover transmitted radiation after strong attenuation (transmittance ∼ 10−5–10−3). We incorporated into our spectrometer a reference pyroelectric detector to monitor the fluctuations in incident laser power, and a precision variable path-length cell (Kindt and Schmuttenmaer 1996; Fitzgerald et al. 2003) to reproducibly control the sample thickness, accurate to ∼0.5 μm.
The variable path-length cell consisted of two parallel windows, one immobile, while the other moved via a translation stage. Both cell windows were made of high-density polyethylene that is transparent to terahertz radiation (Smith and Loewenstein 1975), and were individually held in opaque walls in order to prevent any leakage of stray light. Liquid samples were sealed in polyethylene bags and squeezed between the two polyethylene windows. Fine adjustment of the distance between the two cell windows allows precise changes in sample path length.
At each terahertz frequency, we measured the change in sample absorbance with changing path length (Fig. 8). To mitigate any multiple reflections (standing waves, etalon effect) between the cell windows, we carefully choose paths that insure strong attenuation of the incident radiation (transmittance < 10−3) at even the smallest sample thickness. We determined the extinction coefficients, α, of our samples from linear fits of the change in absorbance, ΔA, with changing path length, Δl,
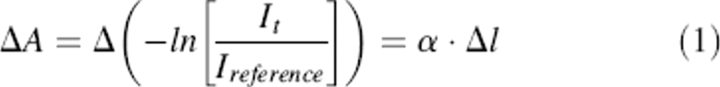 |
where It is the transmitted intensity, and Ireference removes fluctuations in the incident radiation. Typical path length increments were 20 μm, and we examined 5–11 distinct path lengths, depending on the sample absorption strength. Scatter about linear fits allows us to estimate the confidence levels. In this manner, we are able to determine extinction coefficients without precise (and difficult to obtain) information regarding the absolute path length and the intrinsic optical properties of the sample cell. Assured of strong sample attenuation (transmittance < 10−3) and the closely matched indexes of refraction of cell window and liquid water (Smith and Loewenstein 1975), we have eliminated any standing wave artifacts that may contribute to uncertainties in the terahertz absorption.
Figure 8.

Change in absorbance of liquid sample varies linearly with changing path length. The terahertz absorption of water (shown here) and BSA solutions can be precisely determined from linear fits of the absorbance vs. path length data without precise (and difficult to obtain) absolute path length or absorbance information.
Terahertz molar absorption of solvated protein
To ensure successful solvent subtraction, we measured the absorption spectra of both buffer blanks and buffer–BSA solutions, and assumed that extinction is additive,
where αsolution is the measured solution extinction coefficient; MBSA and Mwater are the respective molarities; and σBSA and σwater the respective molar extinctions of the BSA and the buffered water. We obtained the molar extinction of buffered water using the measured extinction of the BSA-free buffer blank. We calculated the amount of buffered water displaced by the BSA solute, and estimated the solvent baseline, represented by σwater · Mwater. The remaining term σBSA · MBSA allows us to estimate the absorption contribution from the BSA molecules in aqueous solutions and to obtain a measure of the molar extinction of the protein. This analysis is extended to include possible change in protein hydration level before and after solvation. The additional hydration layers are estimated and considered to be an integral part of the solvated BSA molecules, and the remaining amount of bulk water, Mwater, is effectively reduced. This leads to a reduction in solvent baseline absorption, σwater · Mwater, and we obtain a somewhat higher estimate of the molar extinction for the solvated BSA with additional hydration shell (Fig. 4).
Acknowledgments
We acknowledge the support from the Army Research Office through Grant nos. DAAD19-02-01-0080 and W911NF0510034, and NASA through Grant no. NAG5-12150.
Footnotes
Reprint requests to: Jing Xu, Department of Physics, University of California, Santa Barbara, CA 93106, USA; e-mail: jingx@physics.ucsb.edu; fax: (805) 893-4170.
Article and publication are at http://www.proteinscience.org/cgi/doi/10.1110/ps.062073506.
Abbreviations:BSA, bovine serum albumin; HEWL, hen egg white lysozyme; BR, bacteriorhodopsin.
References
- Bagdade W. and Stolen R. 1968. Far infrared absorption in fused quartz and soft glass J. Phys. Chem. Solids 29: 2001–2008. [Google Scholar]
- Brooks B. and Karplus M. 1983. Harmonic dynamics of proteins: Normal modes and fluctuations in bovine pancreatic trypsin inhibitor Proc. Natl. Acad. Sci. 80: 6571–6575. [DOI] [PMC free article] [PubMed] [Google Scholar]
- Brooks B. and Karplus M. 1985. Normal modes for specific motions of macromolecules: Application to the hinge-bending mode of lysozyme Proc. Natl. Acad. Sci. 82: 4995–4999. [DOI] [PMC free article] [PubMed] [Google Scholar]
- Chen Y.A. and Prohofsky E.W. 1995. Sequence and temperature dependence of the interbase hydrogen-bond breathing modes in B-DNA polymers: Comparison with low-frequency Raman peaks and their role in helix melting Biopolymers 35: 573–582. [DOI] [PubMed] [Google Scholar]
- Dauber-Osguthorpe P., Osguthorpe D.J., Stern P.S., Moult J. 1999. Low frequency motion in proteins: Comparison of normal mode and molecular dynamics of Streptomyces griseus protease A J. Comput. Phys. 151: 169–189. [Google Scholar]
- El Moznine R, Smith G., Polygalov E., Suherman P.M., Boradhead J. 2003. Dielectric properties of residual water in amorphous lyophilized mixtures of sugar and drug J. Phys. D Appl. Phys. 36: 330–335. [Google Scholar]
- Fisher B.M., Walther M., Uhd Jepsen P. 2002. Far-infrared vibrational modes of DNA components studied by terahertz time-domain spectroscopy Phys. Med. Biol. 47: 3807–3814. [DOI] [PubMed] [Google Scholar]
- Fitzgerald A.J., Berry E., Zinov'ev N.N., Homer-Vanniasinkam S., Miles R.E., Chamberlain J.M., Smith M.A. 2003. Terahertz pulsed imaging of skin cancer in the time and frequency domain J. Biol. Phys. 29: 123–128. [DOI] [PMC free article] [PubMed] [Google Scholar]
- García de la Torre J. 2001. Hydration from hydrodynamics. General considerations and applications of bead modeling to globular proteins Biophys. Chem. 93: 159–170. [DOI] [PubMed] [Google Scholar]
- Globus T.R., Woolard D.L., Khromova T., Crowe T.W., Bykhovskaia M., Gelmont B.L., Hesler J., Samuels A.C. 2003. THz-spectroscopy of biological molecules J. Biol. Phys. 29: 89–100. [DOI] [PMC free article] [PubMed] [Google Scholar]
- Go N., Noguti T., Nishikawa T. 1983. Dynamics of a small globular protein in terms of low-frequency vibrational modes Proc. Natl. Acad. Sci. 80: 3696–3700. [DOI] [PMC free article] [PubMed] [Google Scholar]
- Grischkowsky D., Keiding S., van Exter M., Fattinger Ch. 1990. Far-infrared time-domain spectroscopy with terahertz beams of dielectrics and semiconductors J. Opt. Soc. Am. B 7: 2006–2015. [Google Scholar]
- Han P.Y., Cho G.C., Zhang X.-C. 2000. Time-domain transillumination of biological tissues with terahertz pulses Opt. Lett. 25: 242–244. [DOI] [PubMed] [Google Scholar]
- Hinsen K. 1998. Analysis of domain motions by approximate normal mode calculations Proteins 33: 417–429. [DOI] [PubMed] [Google Scholar]
- Huang B.X., Kim H.-Y., Dass C. 2004. Probing three-dimensional structure of bovine serum albumin by chemical cross-linking and mass spectrometry J. Am. Soc. Mass Spectrom. 15: 1237–1247. [DOI] [PubMed] [Google Scholar]
- Kim J. and Kim B.-G. 1996. Effect of the hydration state of supports before lyophilization on subtilisin-A activity in organic media Biotechnol. Bioeng. 50: 687–692. [DOI] [PubMed] [Google Scholar]
- Kindt J.T. and Schmuttenmaer C.A. 1996. Far-infrared dielectric properties of polar liquids probed by femtosecond terahertz pulse spectroscopy J. Phys. Chem. 100: 10373–10379. [Google Scholar]
- Kittle C. In Introduction to solid state physics pp. 104–111. 1996. 6th ed., John Wiley & Sons, NY.
- Markelz A.G., Roitberg A., Heilweil E.J. 2000. Pulsed terahertz spectroscopy of DNA, bovine serum albumin and collagen between 0.1 and 2.0 THz Chem. Phys. Lett. 320: 42–48. [Google Scholar]
- Markelz A., Whitmire S., Hillebrecht J., Birge R. 2002. THz time domain spectroscopy of biomolecular conformational modes Phys. Med. Biol. 47: 3797–3805. [DOI] [PubMed] [Google Scholar]
- Mattison K.W. and Kaszuba M. 2004. Automated protein characterization Am. Biotechnol. Lab. 22: 8–11. [Google Scholar]
- Parker T.J., Ford J.E., Chambers W.G. 1977. The optical constants of pure fused quartz in the far-infrared Infrared Phys. 18: 215–219. [Google Scholar]
- Peon J., Pal S.K., Zewail A.H. 2002. Hydration at the surface of the protein Monellin: Dynamics with femtosecond resolution Proc. Natl. Acad. Sci. 99: 10964–10969. [DOI] [PMC free article] [PubMed] [Google Scholar]
- Perkins S.J. 2001. X-Ray and neutron scattering analyses of hydration shells: A molecular interpretation based on sequence predictions and modelling fits Biophys. Chem. 93: 129–139. [DOI] [PubMed] [Google Scholar]
- Randall C.M. and Rawcliffe R.D. 1967. Refractive indices of germanium, silicon, and fused quartz in the far infrared Appl. Opt. 6: 1889–1895. [DOI] [PubMed] [Google Scholar]
- Smith D.R. and Loewenstein E.V. 1975. Optical constants of far infrared materials. 3. Plastics Appl. Opt. 14: 1335–1341. [DOI] [PubMed] [Google Scholar]
- Tama F., Gadea F.X., Marques O., Sanejouand Y.-H. 2000. Building-block approach for determining low-frequency normal modes of macromolecules Proteins 41: 1–7. [DOI] [PubMed] [Google Scholar]
- van Vlijmen H.W.T. and Karplus M. 1999. Analysis of calculated normal modes of a set of native and partially unfolded proteins J. Phys. Chem. B 103: 3009–3021. [Google Scholar]
- Walker G.C., Berry E., Smye S.W., Brettle D.S. 2004. Materials for phantoms for terahertz pulsed imaging Phys. Med. Biol. 49: N363–N369. [DOI] [PubMed] [Google Scholar]
- Whitmire S.E., Wolpert D., Markelz A.G., Hillebrecht J.R., Galan J., Birge R. 2003. Protein flexibility and conformational state: A comparison of collective vibrational modes of wild-type and D96N bacteriorhodopsin Biophys. J. 85: 1269–1277. [DOI] [PMC free article] [PubMed] [Google Scholar]
- Woodward R.M., Wallace V.P., Arnone D.D., Linfeild E.H., Pepper M. 2003. Terahertz pulsed imaging of skin cancer in the time and frequency domain J. Biol. Phys. 29: 257–261. [DOI] [PMC free article] [PubMed] [Google Scholar]
- Xu J., Plaxco K.W., Allen S.J. 2006. Absorption spectra of liquid water and aqueous buffers between 0.3 and 3.72 terahertz J. Chem. Phys. 124: 036101-1–036101-3. [DOI] [PubMed] [Google Scholar]
- Zhang C., Tarhan E., Ramdas A.K., Weiner A.M., Durbin S.M. 2004. Broadened far-infrared absorption spectra for hydrated and dehydrated myoglobin J. Phys. Chem. B 108: 10077–10082. [Google Scholar]