

Abstract
3-Nitrotyrosine (NT) is ∼103-fold more acidic than Tyr, and its absorption properties are strongly pH-dependent. NT absorbs radiation in the wavelength range where Tyr and Trp emit fluorescence (300 450 nm), and it is essentially nonfluorescent. Therefore, NT may function as an energy acceptor in resonance energy transfer (FRET) studies for investigating ligand protein interactions. Here, the potentialities of NT were tested on the hirudin thrombin system, a well-characterized protease inhibitor pair of key pharmacological importance. We synthesized two analogs of the N-terminal domain (residues 1 47) of hirudin: Y3NT, in which Tyr3 was replaced by NT, and S2R/Y3NT, containing the substitutions Ser2 → Arg and Tyr3 → NT. The binding of these analogs to thrombin was investigated at pH 8 by FRET and UV/Vis-absorption spectroscopy. Upon hirudin binding, the fluorescence of thrombin was reduced by ∼50%, due to the energy transfer occurring between the Trp residues of the enzyme (i.e., the donors) and the single NT of the inhibitor (i.e., the acceptor). The changes in the absorption spectra of the enzyme inhibitor complex indicate that the phenate moiety of NT in the free state becomes protonated to phenol in the thrombin-bound form. Our results indicate that the incorporation of NT can be effectively used to detect protein protein interactions with sensitivity in the low nanomolar range, to uncover subtle structural features at the ligand protein interface, and to obtain reliable Kd values for structure activity relationship studies. Furthermore, advances in chemical and genetic methods, useful for incorporating noncoded amino acids into proteins, highlight the broad applicability of NT in biotechnology and pharmacological screening.
Keywords: 3-nitrotyrosine, hirudin, thrombin, noncoded amino acids, fluorescence energy transfer, absorption spectroscopy
The development of new spectroscopic tools for studying protein protein interactions is central to many disciplines, including structural biology, biotechnology, and drug discovery (Hovius et al. 2000). Traditionally, the change in tryptophan (Trp) fluorescence has been exploited to study ligand protein interactions (Eftink 1997). However, the fluorescence signal of many proteins is insensitive to ligand binding (Lakowicz 1999; Jameson et al. 2003), since fluorescence changes are mostly restricted to those cases where Trp residues are embedded in the ligand protein interface or when the ligand binding induces conformational changes in the protein, remote from the binding region and involving one or more Trp residues. Furthermore, the presence of multiple tryptophans in proteins may lead to compensating effects that often complicate a unique structural interpretation of the fluorescence data (Eftink 1997).
To overcome these problems, several extrinsic spectroscopic probes, characterized by well-defined spectral properties, have been covalently bound to protein functional groups (i.e., Cys and Lys) to act as energy donors or acceptors in fluorescence resonance energy transfer (FRET) studies (Wu and Brand 1994; Selvin 1995; Hovius et al. 2000; Yan and Marriott 2003). This approach, however, is limited by possible labeling heterogeneity, nonquantitative modification, structural alteration of the proteins resulting from the labeling per se, and perturbation of the binding process, due to the large size of the fluorescent labels used (Wu and Brand 1994; Selvin 1995). In the last decade, advances in both peptide synthetic chemistry (Dawson and Kent 2000; Albericio 2004; Nilsson et al. 2005) and genetic techniques (for recent reviews, see Dougherty 2000; Cropp and Schultz 2004; England 2004; Hendrickson et al. 2004) made the incorporation of noncoded amino acids into even long polypeptide chains a feasible task. With respect to this, several unnatural amino acids, possessing physicochemical properties (e.g., size, polarity, hydrogen bonding properties) similar to those of the corresponding natural amino acids but distinct spectral features, were site-specifically incorporated into proteins to monitor key events such as protein folding and binding (Cornish et al. 1994; Twine and Szabo 2003; De Filippis et al. 2004).
Among the noncoded analogs of tyrosine, 3-nitrotyrosine (NT), which is produced in vivo by reaction of protein tyrosines with peroxynitrite (Halliwell 1997), displays very interesting structural and spectroscopic properties. The NT side chain is only 30 Å3 larger than the unmodified Tyr, and the presence of the electron-withdrawing nitro-group makes the phenolic hydrogen of free NT ∼103-fold more acidic (pKa 6.8) (Riordan et al. 1967). At pH < pKa, where the neutral form is predominant, NT is more hydrophobic than Tyr, whereas at higher pH, where NT exists in the ionized form, it is much more polar (Csizmadia et al. 1997; Abraham et al. 2000). NT can form an internal hydrogen bond (Fig. 1A), and its absorption properties are strongly pH-dependent. In particular, at basic pH, the UV/Vis spectrum of free NT displays a major band at 422 nm, characteristic of the ionized form, whereas at acidic pH a prominent band appears at 355 nm, assigned to the contribution of the neutral form (Riordan et al. 1967). NT is essentially nonfluorescent and absorbs radiation in the wavelength range where Tyr and Trp emit fluorescence, with a Trp-to-NT Förster's distance (i.e., the donor acceptor distance at which the FRET efficiency is 50%) as large as 26 Å (Steiner et al. 1991). For these reasons, NT has great potential as an energy acceptor in FRET studies, and, indeed, direct chemical nitration of Tyr was used to investigate the structural and folding properties of calmodulin (Steiner et al. 1991) and apomyoglobin (Rischel and Poulsen 1995; Rischel et al. 1996; Tcherkasskaya and Ptitsyn 1999). However, very little is known about the possibility of exploiting the unique spectral properties of NT to study molecular recognition (Riordan et al. 1967; Juminaga et al. 1994; Mezo et al. 2001).
Figure 1.

(A) Structure of 3-nitrotyrosine. Bond distances (Å) are taken from the crystallographic structure of free NT (Mostad and Natarajan 1990). (B,C) Spectrophotometric titration of Y3NT by UV/Vis absorption spectroscopy. Absorption spectra (B) and plot of the absorbance values at 430 nm of Y3NT (2 mL, 48 μM) as a function of pH (C). Measurements were carried out in 2 mM citrate-borate-phosphate buffer, at the indicated pH. The data points were fitted to Equation 1, yielding a pKa value for NT of 6.74 ± 0.02.
Thrombin is a serine protease that plays a pivotal role in hemostasis (Davie et al. 1991). Under physiological conditions, it exists in equilibrium (∼50%) between a pro-coagulant (fast) form and an anti-coagulant (slow) form. The slow ↔ fast transition of thrombin is triggered by Na+ binding (for review, see Di Cera et al. 1997), which stabilizes the enzyme into a more open and rigid structure (i.e., the fast form), compared with the more closed and flexible conformation it assumes in the slow form (De Filippis et al. 2002, 2005; Johnson et al. 2005). Hirudin, a 64 amino acid polypeptide isolated from the salivary secretions of medicinal leeches, is the most potent and specific inhibitor of thrombin (Markwardt 1994). It is composed of a C-terminal tail, interacting with the fibrinogen-binding site on thrombin, and a compact N-terminal domain, encompassing residues 1 47 and stabilized by three disulfide bonds, that covers the catalytic pocket and extensively penetrates into the enzyme specificity sites (Rydel et al. 1991).
In the present work, we chose the hirudin thrombin system as a suitable model for evaluating the potentialities of NT as a spectroscopic probe in the study of protein protein interactions. Due to its important pharmacological implications, the hirudin thrombin pair has been the object of thorough biochemical and structural studies. Indeed, the high-resolution crystallographic structures of both free (Pineda et al. 2004; Johnson et al. 2005) and hirudin-bound forms of thrombin are available (Rydel et al. 1991), together with several NMR structures of full-length and truncated hirudin forms (Haruyama and Wuthrich 1989; Szyperski et al. 1992; Nicastro et al. 1997). Hence, taking advantage of the synthetic procedure previously established (De Filippis et al. 1995, 1998), we synthesized two NT-containing analogs of hirudin fragment 1 47: the Y3NT analog, in which Tyr3 was replaced by NT, and the S2R/Y3NT analog, containing the double substitution Ser2 → Arg and Tyr3 → NT. The binding of these analogs to thrombin allosteric forms was probed by FRET and UV/Vis absorption spectroscopy, which allowed us to obtain reliable values for the dissociation constants (Kd) of the enzyme inhibitor complexes and key information on the details of hirudin thrombin interaction in solution. On the whole, our results demonstrate that NT is a suitable spectroscopic probe for investigating ligand protein interactions and suggest that its incorporation into proteins may have vast applications in biotechnology and pharmacological screening.
Results and Discussion
Synthesis and characterization of hirudin analogs
The analogs of hirudin fragment 1 47, Y3NT and S2R/Y3NT, were obtained by combining automated and manual solid-phase peptide synthesis and were allowed to fold under air-oxidizing conditions, as previously detailed (De Filippis et al. 1995, 1998). The disulfide-oxidized species were purified by RP-HPLC (see Supplemental Fig. S1) and their chemical identities were established by enzymatic fingerprint analysis (data not shown), as described elsewhere (De Filippis et al. 1995), and ESI-TOF mass spectrometry, which gave mass values in agreement with the expected amino acid composition within 50 ppm accuracy.
The NT side chain can form an internal hydrogen bond (Fig. 1A), and the absorption properties are strongly dependent on its ionization state (Riordan et al. 1967) (Fig. 1B). At low pH (<6.5), where the neutral ( OH) form of NT is predominant, the spectrum of Y3NT is characterized by two bands centered at 276 and 357 nm and assigned to the π π* transitions of the aromatic ring, denoted as 1A1g → 1B1u and 1A1g → 1B2u, respectively (see Meloun et al. 1968). At higher pH values, where the ionized ( O−) form prevails, the intensity of the 276-nm band decreases, while a new band appears at 430 nm. The position of the band at longer wavelengths (357 or 430 nm) reflects the protonation state of NT in solution, and the change in the intensity of the 430-nm band allowed us to estimate the pKa value of NT in the Y3NT analog, calculated as 6.74 ± 0.02 (Fig. 1C). This value is very similar to that of free NT derivatives (Riordan et al. 1967) and is in keeping with the high surface exposure of Tyr3 in the structure of the natural hirudin fragment 1 47 (WT) (Nicastro et al. 1997).
The spectral properties of Y3NT were investigated by circular dichroism (CD) and fluorescence spectroscopy and compared with those of the natural fragment 1 47 (Fig. 2). The close similarity of the CD spectra of the natural and modified species (Fig. 2A) provides strong evidence that the secondary structure content of the protein is retained upon Tyr3 → NT exchange. The near-UV CD spectrum of WT is dominated by the contribution of the three disulfide bonds, while the spectrum of Y3NT is characterized by a broad positive band centered at 426 nm, assigned to the contribution of the ionized form of NT, indicating that NT3 is located in a rigid and asymmetric environment (Strickland 1974) (Fig. 2B). The fluorescence spectrum of WT (Fig. 2C), taken after excitation at 280 nm, displays a λmax value at 305 nm due to the emission of Tyr3 and Tyr13 in the hirudin sequence (see Supplemental Fig. S1-A) (Lakowicz 1999), whereas the fluorescence intensity of Y3NT is nearly zero. We propose that the emission of Tyr13 (i.e., the donor) is transferred, by a nonradiative energy transfer process, to NT3 (i.e., the acceptor), which is essentially nonfluorescent. As a result, the fluorescence of Y3NT is negligible.
Figure 2.

Conformational characterization of wild-type hirudin fragment 1 47 (WT) and Y3NT analog. Far-UV (A) and near-UV (B) CD spectra of hirudin analogs were taken at protein concentrations of 40 and 200 μM in the far- and the near-UV region, respectively. (C) Superimposition of the fluorescence spectra (continuous lines) of WT and Y3NT with the absorption spectra (dashed/dotted lines) of Y3NT at pH 2.0 and 8.0. All measurements were carried out at 25° in 5 mM Tris-HCl buffer (pH 8.0), containing 0.1% (w/v) PEG 8000 and 0.2 M NaCl.
FRET is a nonradiative decay process occurring between a donor and an acceptor, which interact via electromagnetic dipoles transferring the excitation energy of the donor to the acceptor (Lakowicz 1999). For a one-donor one-acceptor system, the efficiency of energy transfer depends on the extent of spectral overlap of the emission spectrum of the donor with the absorption spectrum of the acceptor, on the donor quantum yield, on the inverse six power of the distance separating the donor and acceptor, and on their orientation (Selvin 1995; Lakowicz 1999). In the case of hirudin, there is significant overlap of the emission of Tyr with the absorption of NT (Fig. 2C). Furthermore, the aromatic rings of Tyr13 and NT3 are almost parallel and are separated by a fairly short distance (∼7 Å) in the inhibitor structure (Nicastro et al. 1997). These observations provide strong support to our proposal that the fluorescence of Tyr13 is quenched by NT3 via resonance energy transfer.
Probing hirudin thrombin interaction by Trp-to-NT fluorescence energy transfer
The fluorescence of thrombin is characterized by a λmax value at 342 nm (Wells and Di Cera 1992; De Filippis et al. 2005), in agreement with the relatively high surface exposure of tryptophans in the enzyme structure (Bode et al. 1992). Earlier Trp → Phe mutagenesis studies have shown that Trp207 is the major contributor to the fluorescence intensity of thrombin (35%), followed by Trp96 (11%), while Trp60d and Trp215 each contribute by only ∼6% (Bell et al. 2000). In the Na+-free (slow) form, the fluorescence intensity is ∼18% lower than that of the enzyme in the Na+-bound (fast) form (Wells and Di Cera 1992; De Filippis et al. 2005). This effect was assigned to the higher conformational flexibility of the slow form compared with that of the more rigid and stable fast form, and to specific changes in the environment of Trp215 in the S3 site of the enzyme (De Filippis et al. 2005; Johnson et al. 2005). In the presence of saturating concentrations of Y3NT or S2R/Y3NT, the fluorescence of thrombin is strongly quenched (Fig. 3A,B) and approaches a similar value under either fast (0.2 M NaCl) or slow (0.2 M ChCl) conditions (Fig. 3B).
Figure 3.

Binding of Y3NT and S2R/Y3NT to thrombin, monitored by Trp-to-NT fluorescence energy transfer. (A) Fluorescence spectra of thrombin alone (50 nM) and in the presence of Y3NT (10 μM). For comparison, the spectrum of the free inhibitor Y3NT (10 μM) is also reported. (B) Change in the fluorescence of thrombin as a function of S2R/Y3NT concentration, under fast (▴-▴, 0.2 M NaCl) and slow (△-△, 0.2 M ChCl) conditions. (C) Superimposition of the fluorescence spectrum of thrombin (continuous line) with the absorption spectra of Y3NT at pH 2 and 8.0 (dashed/dotted lines). (D) Change in thrombin fluorescence as a function of Y3NT concentration (•). As a control, the fluorescence intensity of thrombin in the presence of free NT (○) is reported. The signal of Y3NT alone (△) is also included. All measurements were carried out at 25°C by exciting the protein samples at 295 nm in 5 mM Tris-HCl buffer (pH 8.0), containing 0.1% (w/v) PEG 8000 and 0.2 M salt, as indicated, and recording the fluorescence signal at 342 nm.
As in the case of hirudin, quenching of fluorescence is mainly caused by resonance energy transfer occurring between (some of) the Trp residues of thrombin (i.e., the donors) and the single 3-nitrotyrosine of the inhibitors (i.e., the acceptor). With respect to this, there is an extensive overlap of the emission spectrum of the enzyme (i.e., the donor) with the absorption spectrum of the inhibitor (i.e., the acceptor) (Fig. 3C). In addition, Trp-to-NT energy transfer is also favored by the relatively short distances separating Trp residues and NT in the enzyme inhibitor complex (Rydel et al. 1991) (see Supplemental Fig. S2). To estimate the possible contribution of spectroscopic effects other than FRET (e.g., unspecific binding, dynamic or static quenching), the fluorescence of thrombin was measured in the presence of increasing concentrations of free NT. The data reported in Figure 3D indicate that NT slightly (∼14%) reduces the fluorescence of the enzyme, in keeping with the notion that nitro-compounds (e.g., nitromethane and nitrobenzene) quench the emission of polycyclic aromatic hydrocarbons by a mixed static/dynamic mechanism (Sawicki et al. 1964; Dreeskamp et al. 1975; Lakowicz 1999). However, in the case of the hirudin thrombin interaction this effect is expected to be negligible. Indeed, for either static or dynamic quenching to occur, the quencher must contact the fluorophore within van der Waals distance (Lakowicz 1999). With respect to this, the modeled structure of Y3NT bound to thrombin (see below) reveals that NT does not directly contact any of the Trp residues of thrombin, and that even the closest Trp residues (i.e., Trp215 and Trp60d) are located 7 8 Å from NT in the hirudin thrombin complex (Supplemental Fig. S2). All these considerations allow us to conclude that quenching of thrombin fluorescence by Y3NT (or S2R/Y3NT) is mainly caused by Trp-to-NT energy transfer.
The quenching data reported above were used to obtain quantitative estimates (i.e., Kd values) of the binding strength of Y3NT and S2R/Y3NT to thrombin allosteric forms (Fig. 4; Table 1). For both analogs, the excellent fit of the experimental data to the curve describing a one-site binding mechanism is a stringent, albeit indirect, proof of 1:1 binding stoichiometry (Copeland 2000). The replacement of Tyr3 with NT resulted in a drop in the affinity of Y3NT for thrombin, which was restored in the doubly substituted analog S2R/Y3NT by replacing Ser2 with Arg. The structural model of Y3NT bound to thrombin (Fig. 5), based on the crystallographic structure of the hirudin thrombin complex (4HTC.pdb) (Rydel et al. 1991) (see Materials and Methods), reveals that the NO2 group of NT might be easily accommodated into the S2 specificity site of the enzyme without requiring steric distortion. Likely, the lower affinity of Y3NT reflects the lower hydrophobicity of NT at pH 8.0, where it exists by ∼95% in the ionized form. With respect to this, the logP value (i.e., the logarithm of octanol/water partition coefficient, P) of 2-nitrophenol, taken as a suitable model of the NT side chain, is −1.47 at pH 8.0 (Csizmadia et al. 1997), while that of phenol, taken as a model of Tyr, is +1.50 (Abraham et al. 2000). However, hydrophobicity alone is not sufficient to explain the remarkable decrease in the affinity of Y3NT for thrombin. Indeed, when measurements were carried out at pH 6.0, where NT predominantly (∼82%) exists in the more hydrophobic neutral form (logP +1.79) (Abraham et al. 2000), the affinity of Y3NT for thrombin was only 1.4-fold higher than that determined at pH 8.0 (see Supplemental Fig. S3). Besides hydrophobicity, the presence of the nitro-group introduces a net (i.e., at pH 8.0) or partial (i.e., at pH 6.0) negative charge at position 3 of hirudin, which can oppose binding through unfavorable electrostatic interaction with the strong negative potential of the thrombin active site (Karshikov et al. 1992), in agreement with our previous structure activity relationship studies (De Filippis et al. 2002).
Figure 4.

Determination of the dissociation constant (Kd) of the complexes formed by the synthetic analogs Y3NT (A) and S2R/Y3NT (B) with thrombin, under fast (filled symbols) and slow (hollow symbols) conditions. Fluorescence data were obtained as detailed in Materials and Methods (see also Fig. 3) and expressed as (F° − F)/ΔFmax. Continuous lines represent the best fit of the data points to Equation 2, which allowed us to obtain the Kd values reported in Table 1.
Table 1.
Thrombin binding data of the synthetic hirudin analogs, as obtained by fluorescence energy transferaand enzyme inhibition assaysb

a The Kd values of Y3NT and S2R/Y3NT were obtained by fitting FRET data to Equation 2.
b The inhibitory potency of the wild-type (WT) and S2R analog was determined at 25°C by measuring at 405 nm the release of pNA from the synthetic substrate FPR. Further details are reported in Materials and Methods.
c ΔΔGb is the difference in the free energy change of binding to thrombin between the synthetic analog (ΔGb*) and the natural fragment (ΔGbwt): ΔΔGb = ΔGb* − ΔGbwt. A negative value of ΔΔGb indicates that the mutated species binds to thrombin more tightly than the natural fragment. Errors are ±0.1 kcal/mol or less.
d ΔGc is the free energy of coupling to thrombin, measured as ΔGc = ΔGb,fast −ΔGb,slow (Di Cera et al. 1997). The value of ΔGc is negative if the inhibitor binds to the fast form with higher affinity than to the slow form. Additivity of mutational effects was calculated by the equation, ΔGI = ΔΔGb(S2R/Y3NT) − [ΔΔGb(Y3NT) + ΔΔGb(S2R)], where ΔGI is the free energy term that accounts for the energetic interaction between the mutated sites (Wells 1990). ΔGI values as low as −0.10 and −0.25 kcal/mol were calculated for the binding of S2R/Y3NT to the fast and the slow form, respectively. A value of ΔGI comparable to R · T (∼0.6 kcal/mol, at 25°C) is usually taken as a proof of additivity (Wells 1990).
Figure 5.

Schematic representation of the interaction of the N-terminal tripeptide of Y3NT with thrombin. The inhibitor is color-coded (carbon, gray; nitrogen, blue; oxygen, red), while the relevant residues of thrombin in the S2 (Tyr60a and Trp60d) and S3 site (Trp215, Leu99, and Ile174) are shown in magenta. Tyr3′ of hirudin fills the apolar S3 site of thrombin, Val1′ contacts the S2 site, and Ser2′ covers but does not penetrate the S1 site. The structure of Y3NT was modeled on the structure of hirudin thrombin complex, crystallized under conditions stabilizing the fast form (i.e., sodium acetate) (4HTC.pdb) (Rydel et al. 1991). The structural water molecules (w432, B-factor 36 Å2, occupancy 1.0; w606, B-factor 22 Å2, occupancy 0.52; w672, B-factor 49 Å2, occupancy 0.65) are indicated by green spheres, and lie approximately in the geometrical plane of NT. The nitro-group was easily accommodated at the enzyme inhibitor interface without bump by keeping the orientation of Tyr3 (χ1 = −62° and χ2 = −56°) unchanged, together with the rest of the hirudin thrombin structure. The bond-lengths and angles of NT are derived from the crystal structure of the free amino acid (Mostad and Natarajan 1990). Relevant NT thrombin distances, in the 2.5 3.5 Å range, are indicated by dashed lines. Of note, w606, which in the wild-type hirudin thrombin structure connects Tyr3′ of the inhibitor to Tyr60a of the enzyme, is well suited as a hydrogen bond donor to stabilize the NT ring system (see text).
As expected from our earlier work (De Filippis et al. 1998, 2005), Ser2 → Arg exchange strongly enhances the affinity of the hirudin fragment for thrombin, due to a favorable electrostatic coupling of Arg2′ with Asp189 in the S1 site of the enzyme. Of interest, the effects of the amino acid substitutions on the binding to thrombin are strictly additive (Wells 1990) (see legend to Table 1), as already observed with other cumulative amino acid replacements in hirudin (De Filippis et al. 1999). All these indications suggest that the binding data obtained by FRET measurements are realistic. However, the reliability of these data was verified by comparing the Kd values of Y3NT and S2R/Y3NT, obtained by FRET measurements, with those determined by classical enzyme-inhibition experiments, in which the rate of thrombin-mediated substrate hydrolysis was measured as a function of inhibitor concentration (Supplemental Fig. S4). Strikingly, the Kd values for the binding of Y3NT and S2R/Y3NT to the thrombin fast form were determined as 1.4 ± 0.1 μM and 41 ± 2 nM, respectively, in agreement (8% 10%) with those obtained by FRET (Table 1).
Probing hirudin thrombin interaction by UV/Vis-absorption spectroscopy
The absorption spectra of S2R/Y3NT, recorded in the absence and the presence of thrombin, are reported in Figure 6. Under fast conditions (Fig. 6A), the 430-nm band of S2R/Y3NT, assigned to the contribution of the ionized form of NT at pH 8.0, is reduced by 54%, while an additional band of similar intensity appears at ∼362 nm, characteristic of NT in the neutral form. Of note, the binding of Y3NT to thrombin fast form yields very similar results (see Supplemental Fig. S5). These observations can be explained on the basis of the modeled structure of Y3NT bound to thrombin and assuming that NT interacts with the enzyme in the neutral form.
Figure 6.

Binding of the synthetic analog S2R/Y3NT to the fast (A) or the slow (B) form of thrombin, monitored by UV/Vis absorption spectroscopy. Spectra of the inhibitor (8.6 μM) were taken at 25° in 5 mM Tris-HCl buffer (pH 8.0), containing 0.1% PEG 8000 and 0.2 M NaCl for the fast form, or 0.2 M ChCl for the slow form, in the absence (---) and presence (___) of thrombin (4.1 μM). For clarity, the insets show the spectra in the wavelength range 300 550 nm.
As shown in Figure 5, three structural water molecules at the enzyme inhibitor interface (i.e., w432, w606, and w672), characterized by low thermal factors and high occupancy values, can variably interact with NT. In particular, w606, that in the structure of the wild-type hirudin thrombin complex connects Tyr3′ of the inhibitor to Tyr60a of the enzyme (Rydel et al. 1991), is suitably positioned as a hydrogen bond donor to stabilize the six-membered ring system of NT (Figs. 1A, 5). As a result, the contribution of the protonated NT in the bound form appears as a distinct band at ∼362 nm in the absorption spectrum of the thrombin S2R/Y3NT complex (Fig. 6A). The residual intensity of the 430-nm band is contributed by the ionized form of NT in the free inhibitor that exists in equilibrium with the thrombin-bound form. Hence, we conclude that the phenate moiety of NT in the free state becomes protonated to phenol upon binding to thrombin, and that a water molecule at the hirudin thrombin interface, likely w606, functions as a hydrogen donor. Notably, w432 and w606 are conserved in the structure of thrombin bound to hirugen (i.e., the 53 64 peptide of hirudin) (1HAH.pdb; Vijayalakshmi et al. 1994), where the specificity sites of the enzyme are unoccupied, thus suggesting that these water molecules represent constant spots in the solvation shell of thrombin and, perhaps, key elements for molecular recognition, in keeping with the key role that protein water interactions play in ligand binding (for review, see Mattos 2002).
Similarly to what is observed for the fast form, the interaction of S2R/Y3NT with thrombin slow form reduces the intensity of the 430-nm band by 45% (Fig. 6B), in agreement with the lower affinity of this analog for the Na+-free enzyme (Table 1). Furthermore, a new band appears at 335 nm (Fig. 6B), blue-shifted by ∼27 nm compared with that observed upon binding of the inhibitor to the fast form (Fig. 6A). These results suggest that NT3 interacts with the Na+-free enzyme still in the neutral form, but that the details of this interaction (e.g., side-chain orientation, hydrogen bonding, or solvation) might be slightly different. In particular, the observed spectral changes may reflect the perturbation of the internal hydrogen bond in the NT ring system, possibly caused by some rearrangements of the water molecules at the interface and/or distortion of the NO2 group out of the plane of the aromatic ring. This view is consistent with the absorption spectra of nitrophenols recorded at pH 2.0 (Supplemental Fig. S6), showing that the λmax value decreases from 350 nm of ortho-nitrophenol, where the internal hydrogen bond is formed, to 333 nm and 318 nm of meta- and para-nitrophenol, respectively, where the formation of the intramolecular hydrogen bond is impaired.
Structural studies, conducted either in solution (De Filippis et al. 2005) or in the crystal state (Johnson et al. 2005), highlight some differences in the conformational/flexibility properties of thrombin allosteric forms. In particular, the binding of Na+ specifically stabilizes the enzyme in a more open and rigid conformation, compared with the more closed and flexible structure it assumes in the Na+-free state (De Filippis et al. 2005). It is possible that these conformational changes also alter the structure of the solvation shell of the free enzyme prior to hirudin binding and/or the hydrogen-bond network at the interface in the enzyme inhibitor complex. Strikingly, these changes are precisely pinpointed by the λmax shift in the absorption of NT, from 362 to 335 nm, observed upon binding of the inhibitor to the fast or the slow form of thrombin.
Conclusions
The results of our work on the hirudin thrombin system demonstrate that NT can be used as a Tyr analog to detect protein protein interactions with sensitivity in the low nanomolar range, to uncover subtle details at the ligand protein interface, and to obtain reliable Kd values for structure activity relationships studies. In addition, several considerations support the general applicability of NT in ligand binding studies: First, even though unnatural amino acid mutagenesis is still limited by rather complicated experimental procedures and by the exceedingly low amounts of the resulting mutated proteins (England 2004), many noncoded amino acids, including NT, have been successfully incorporated at specific sites into several different protein systems (Cropp and Schultz 2004; see also introduction to this paper); second, a survey of the distribution frequency of amino acids in proteins reveals that the binding regions in proteins are much richer in aromatic residues (i.e., especially in Trp residues) than the average protein surface (Lo Conte et al. 1999), thus suggesting that protein interfaces could be particularly sensitive to Trp-to-NT energy transfer; third, due to the large Förster's distance (26 Å) of the Trp NT pair (Steiner et al. 1991), fluorescence energy transfer between Trp and NT would operate even when the donor(s) and acceptor are quite distant in the macromolecular complex; and fourth, the small increase in the size of NT, compared with other bulkier fluorescence acceptors (for reviews, see Wu and Brand 1994; Selvin 1995), is expected to introduce only slight structural perturbation at the mutation site, thus providing a more realistic picture of the binding process under study.
In conclusion, our results demonstrate that NT is a suitable spectroscopic probe for investigating ligand protein interactions and suggest that its incorporation into proteins may have vast applications in biotechnology and pharmacological screening.
Materials and methods
Materials
Human α-Thrombin was purchased from Hematologic Technologies Inc. or from Calbiochem. The chromogenic substrate (D)-Phe-Pro-Arg-pNA (FPR) was synthesized as previously described (De Filippis et al. 2002). Nα-Fmoc-3-nitrotyrosine and other protected amino acids, solvents, and reagents for peptide synthesis were purchased from Applied Biosystems or Bachem AG. Nitrophenol isomers were from Sigma, while buffers and organic solvents were of analytical grade and obtained from Fluka.
Methods
Peptide synthesis
Hirudin analogs were synthesized by the solid-phase Fmoc-method in two sequential steps, involving automated synthesis of segment 6 47 on a Lys-derivatized p-alkoxybenzylester polystyrene resin (0.90 mmol/g of resin) and elongation of the peptide by manual solid-phase procedure, as previously described (De Filippis et al. 1995, 1998). After precipitation with diethylether, the crude reduced peptides (2 mg/mL) were allowed to fold for 24 h in 0.1 M NaHCO3 buffer (pH 8.3), under air-oxidation conditions in the presence of 100 μM β-mercaptoethanol (De Filippis et al. 1995), and purified by preparative RP-HPLC (see Supplemental Fig. S1). The chemical identity of the disulfide-oxidized species was established by automated N-terminal sequence analysis and mass spectrometry on a Mariner ESI-TOF instrument from Perseptive Biosystems.
Spectroscopic measurements
Unless otherwise specified, all measurements were carried out at 25 ± 0.2°C in 5 mM Tris-HCl buffer (pH 8.0), containing 0.1% (w/v) PEG-8000 and 0.2 M NaCl for the fast form or choline chloride (ChCl) for the slow form. Temperature correction was applied for Tris buffer. All spectra were subtracted for the corresponding baselines.
Protein concentration was determined by UV absorption at 280 nm (Gill and von Hippel 1989) on a Lambda-2 spectrophotometer from Perkin-Elmer using a molar absorptivity value of 65,770 M−1 · cm−1, for thrombin, and 2920 M−1 · cm−1, for the wild-type fragment 1 47 (WT) and S2R analog. The concentration of NT-containing analogs was determined at 381 nm, using a molar extinction coefficient of 2200 M−1 · cm−1 (Tcherkasskaya and Ptitsyn 1999). The pKa value of NT was determined by spectrophotometric titration of Y3NT at 430 nm. A solution of the hirudin analog (2 mL, 48 μM) in 2 mM citrate-borate-phosphate buffer (pH 8.6), containing PEG-8000 0.1%, was titrated with 0.5 M aqueous HCl (2 6-μL aliquots). The solution pH was measured at 25 ± 0.2°C with a Metrohm model 632 pH meter. Absorbance data were corrected for sample dilution (<2% of the final volume) and fitted to Equation 1:
where a and b are the higher and the lower absorbance limits, respectively, of NT at 430 nm.
CD spectra were recorded on a Jasco model J-810 spectropolarimeter. Far-UV spectra were recorded in a 1-mm cell, at a scan speed of 10 nm/min, with a response time of 16 sec, and resulted from the average of four accumulations. Near-UV spectra were recorded in a 1-cm cell, at a scan speed of 50 nm/min, with a response time of 2 sec, and resulted from the average of 16 accumulations. Ellipticity data were expressed as mean residue ellipticity. Fluorescence spectra were recorded on a Perkin-Elmer spectrofluorimeter model LS-50B. Spectra were taken using a 1-cm path length cuvette, at a scan speed of 120 nm/min by exciting the protein samples at 280 nm, with an excitation/emission slit of 5 nm.
Thrombin-binding measurements
1. Fluorescence.
The interaction of NT-containing hirudin analogs with thrombin was monitored by adding, under gentle magnetic stirring, to a solution of thrombin (2 mL, 50 nM) in 5 mM Tris-HCl buffer (pH 8.0), 0.1% PEG, in the presence of 0.2 M NaCl or ChCl, aliquots (2 10 μL) of inhibitor stock solutions (2 250 μM) in the same buffer. At each inhibitor concentration, protein samples were equilibrated for 5 min at 25°C and excited at 295 nm, using an excitation/emission slit of 5 and 10 nm, respectively, and a scan speed of 240 nm/min. The decrease in fluorescence intensity at the λmax (342 nm) of thrombin was recorded as a function of inhibitor concentration. Fluorescence data were corrected for sample dilution (<5% of the final volume) and expressed as (F° − F)/ΔFmax, where F° and F are the fluorescence of thrombin in the absence and the presence of the inhibitor, respectively, and ΔFmax is the maximum fluorescence change at saturating concentrations of inhibitor. For a simple one-site binding mechanism R + L ↔ RL, the fluorescence intensity (F) of the receptor (R) at a given concentration of ligand (L) is linearly related to the concentration of the complex [RL], F = [RL] · Fbound + [R]free · Ffree. Since [R]free = [R] − [RL], then (F° − F)/ΔFmax = [RL]/[R] (Eftink 1997). The data were fitted to Equation 2 (Copeland 2000), using the program Origin 6.0 (MicroCal Inc.):
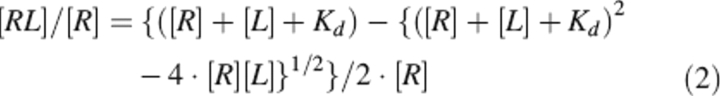 |
where Kd is the dissociation constant of complex and [R] is the total concentration of the receptor.
2. UV/Vis absorption.
Binding of S2R/Y3NT to thrombin allosteric forms was monitored by adding 8 μL of a thrombin stock solution (261 μM) to a solution of hirudin analog (0.5 mL, 8.6 μM), in a 1-cm path-length quartz cuvette (0.2 × 1.0 cm). After 15-min equilibration, spectra were taken at a scan speed of 60 nm/min. In the case of Y3NT, 15 μL of thrombin stock solution (197 μM) was added to the solution of hirudin analog (0.5 mL, 8.6 μM).
Thrombin inhibition assays
The Kd values of NT-containing analogs were also estimated by classical competitive inhibition experiments of thrombin-mediated substrate hydrolysis, according to the tight-binding model (Copeland 2000), as previously detailed (De Filippis et al. 2002). The inhibitor was incubated at 25 ± 0.2°C for 1 h with 100 pM thrombin in 5 mM Tris (pH 8.0), containing 0.1% (w/v) PEG-8000 and 0.2 M NaCl or ChCl. The reaction was started by addition of FPR (20 μM), and the release of p-nitroaniline (pNA) was determined by recording the absorbance increase at 405 nm. The ionic strength was kept constant at 200 mM with NaCl for the fast form or with ChCl when the slow form was being studied. Thrombin inhibition data were fitted to the equation:
 |
to obtain the apparent inhibition constant, KIapp. [E] and [I] are the total enzyme and inhibitor concentrations, and Vi and V0 are the steady-state velocities of substrate hydrolysis by thrombin in the presence (Vi) or the absence (V0) of the inhibitor. KIapp values were corrected for substrate concentration and for the Km value of FPR for thrombin (Km = 0.48 ± 0.03 μM) (Di Cera et al. 1997; De Filippis et al. 2002), according to Equation 4
where KI is equal to the dissociation constant, Kd, of the enzyme inhibitor complex (Copeland 2000).
Computational methods
The structure of the synthetic analogs in the thrombin-bound state was modeled on the crystallographic structure of hirudin thrombin complex (4HTC.pdb) (Rydel et al. 1991), by keeping the position of all atoms unchanged and building the nitro-group on Tyr3, to obtain NT. The geometry of NT in the enzyme inhibitor complex was optimized using the bond length and angle parameters derived from the crystal structure of free NT (Mostad and Natarajan 1990).
Electronic supplemental material
Figure S1, amino acid sequence of the natural hirudin fragment 1 47 and RP-HPLC analysis of the folding reaction of Y3NT and S2R/Y3NT. Figure S2, Trp-NT distances in the Y3NT-thrombin complex. Figure S3-A, binding of Y3NT to thrombin fast form, monitored by FRET at pH 6.0. Figure S3-B, RP-HPLC analysis of purified WT and Y3NT. Figure S4, progress curves for the inhibition kinetics of Y3NT and S2R/Y3NT on thrombin fast form. Figure S5, binding of Y3NT to thrombin fast form, monitored by UV/Vis-absorption spectroscopy. Figure S6, absorption spectra of nitrophenols at pH 2.0.
Acknowledgments
We thank Drs. E. De Dea and F. Lucatello for performing some of the experiments reported in this study and Dr. D. Dalzoppo for critical reading of the manuscript. We also thank Dr. G. Cozza for side-chain volume calculations. The support of Dr. O. Iadicicco is also acknowledged. This work was supported by a grant (PRIN-2003) from the Italian Ministry of University and Scientific Research to V.D.F. Part of this work was presented at the Sixth European Symposium of The Protein Society, Barcelona (Spain), April 30 May 4, 2005. Commun. 08 27.
Footnotes
Supplemental material: see www.proteinscience.org
Reprint requests to: Vincenzo De Filippis, Department of Pharmaceutical Sciences and CRIBI Biotechnology Center, University of Padua, Via F. Marzolo 5, I-35131 Padua, Italy; e-mail: vincenzo.defilippis@unipd.it; fax: +39-049-827-5366.
Enzymes: thrombin (EC 3.4.21.5).
Article and publication are at http://www.proteinscience.org/cgi/doi/10.1110/ps.051957006.
Abbreviations: CD, circular dichroism; ChCl, Choline chloride; ESI, electrospray ionization; Fmoc, 9-fluorenyl-methyloxycarbonyl; FPR, chromogenic substrate (D)-Phe-Pro-Arg-pNA; FRET, fluorescence resonance energy transfer; HM2, hirudin variant isolated from the leech Hirudinaria manillensis; pNA, p-nitroanilide; NMR, nuclear magnetic resonance; NT, 3-nitrotyrosine; PEG, polyethylene glycol; S2R, synthetic analog of the N-terminal fragment 1 47 of hirudin HM2 containing the Ser2Arg substitution; S2R/Y3NT, synthetic analog in which Ser2 was replaced by Arg and Tyr3 by 3-nitrotyrosine; TOF, time of flight; WT, wild-type fragment 1 47 from hirudin HM2; Y3NT, synthetic analog in which Tyr3 was replaced by 3-nitrotyrosine.
References
- Abraham M.H., Du C.M., Platts J.A. 2000. Lipophilicity of the nitrophenols J. Org. Chem. 65: 7114–7118. [DOI] [PubMed] [Google Scholar]
- Albericio F. 2004. Developments in peptides and amide synthesis Curr. Opin. Chem. Biol. 8: 211–221. [DOI] [PubMed] [Google Scholar]
- Bell R., Stevens W.K., Jia Z., Samis J., Coté H.C.F., MacGillivray R.T.A., Nesheim M.E. 2000. Fluorescence properties and functional roles of tryptophan residues 60d, 96, 148, and 215 of thrombin J. Biol. Chem. 275: 29513–29520. [DOI] [PubMed] [Google Scholar]
- Bode W., Turk D., Karshikov A. 1992. The refined 1.9-Å X-ray crystal structure of D-Phe-Pro-Arg chloromethylketone-inhibited human α-thrombin: Structure analysis, overall structure, electrostatic properties, detailed active-site geometry, and structure-function relationships Protein Sci. 1: 426–471. [DOI] [PMC free article] [PubMed] [Google Scholar]
- Copeland R.A. In Enzymes: A practical introduction to structure, mechanism, and data analysis . 2000. 2d ed J. Wiley & Sons, New York.
- Cornish V.W., Benson D.R., Altenbach C.A., Hideg K., Hubbell W.L., Schultz P.G. 1994. Site-specific incorporation of biophysical probes into proteins Proc. Natl. Acad. Sci. 91: 2910–2924. [DOI] [PMC free article] [PubMed] [Google Scholar]
- Cropp A.T. and Schultz P.G. 2004. An expanding genetic code Trends Genet. 20: 625–630. [DOI] [PubMed] [Google Scholar]
- Csizmadia F., Tsantili-Kkoulidou A., Panderi I., Darvas F. 1997. Prediction of distribution coefficient from structure. 1. Estimation method J. Pharm. Sci. 7: 865–871. [DOI] [PubMed] [Google Scholar]
- Davie E.W., Fujikawa K., Kisiel W. 1991. The coagulation cascade: Initiation, maintenance, and regulation Biochemistry 30: 10363–10370. [DOI] [PubMed] [Google Scholar]
- Dawson P. and Kent S.B. 2000. Synthesis of native proteins by chemical ligation Annu. Rev. Biochem. 69: 923–960. [DOI] [PubMed] [Google Scholar]
- De Filippis V., Vindigni A., Altichieri L., Fontana A. 1995. Core domain of hirudin from leech. Hirudinaria manillensis: Chemical synthesis, purification and characterization of a Trp3-analogue of fragment 1-47 Biochemistry 34: 9552–9564. [DOI] [PubMed] [Google Scholar]
- De Filippis V., Quarzago D., Vindigni A., Di Cera E., Fontana A. 1998. Synthesis and characterization of more potent analogues of hirudin fragment 1-47 containing non-natural amino acids Biochemistry 37: 13507–13515. [DOI] [PubMed] [Google Scholar]
- De Filippis V., Russo I., Vindigni A., Di Cera E., Salmaso S., Fontana A. 1999. Incorporation of noncoded amino acids into the N-terminal domain 1 47 of hirudin yields a highly potent and selective thrombin inhibitor Protein Sci. 8: 2213–2217. [DOI] [PMC free article] [PubMed] [Google Scholar]
- De Filippis V., Colombo G., Russo I., Spadari B., Fontana A. 2002. Probing hirudin thrombin interaction by incorporation of noncoded amino acids and molecular dynamics simulation Biochemistry 43: 1537–1550. [DOI] [PubMed] [Google Scholar]
- De Filippis V., De Boni S., De Dea E., Dalzoppo D., Grandi C., Fontana A. 2004. Incorporation of the fluorescent amino acid 7-azatryptophan into the core domain 1 47 of hirudin as a probe of hirudin folding and thrombin recognition Protein Sci. 13: 1489–1502. [DOI] [PMC free article] [PubMed] [Google Scholar]
- De Filippis V., De Dea E., Lucatello F., Frasson R. 2005. Effect of Na+ binding on the conformation, stability, and molecular recognition properties of thrombin Biochem. J. 390: 485–492. [DOI] [PMC free article] [PubMed] [Google Scholar]
- Di Cera E., Dang Q.D., Ayala Y.M. 1997. Molecular mechanisms of thrombin function Cell. Mol. Life Sci. 53: 701–730. [DOI] [PMC free article] [PubMed] [Google Scholar]
- Dougherty D.A. 2000. Unnatural amino acids as probes of protein structure and function Curr. Opin. Chem. Biol. 4: 645–652. [DOI] [PubMed] [Google Scholar]
- Dreeskamp H., Koch E., Zander M. 1975. On the fluorescence quenching of polycyclic aromatic hydrocarbons by nitromethane Z. Naturforsch. 30a: 1311–1314. [Google Scholar]
- Eftink M.R. 1997. Fluorescence methods for studying equilibrium macromolecule ligand interactions Methods Enzymol. 278: 221–257. [DOI] [PubMed] [Google Scholar]
- England P.M. 2004. Unnatural amino acid mutagenesis: A precise tool for probing protein structure and function Biochemistry 43: 11623–11629. [DOI] [PubMed] [Google Scholar]
- Gill S.G. and von Hippel P.H. 1989. Calculation of protein extinction coefficients from amino acid sequence data Anal. Biochem. 182: 319–326. [DOI] [PubMed] [Google Scholar]
- Halliwell B. 1997. What nitrates tyrosine? Is nitrotyrosine specific as a biomarker of peroxynitrite formation in vivo? FEBS Lett. 411: 157–160. [DOI] [PubMed] [Google Scholar]
- Haruyama H. and Wuthrich K. 1989. Conformation of recombinant desulfatohirudin in aqueous solution determined by nuclear magnetic resonance Biochemistry 28: 4301–4312. [DOI] [PubMed] [Google Scholar]
- Hendrickson T.L., de Crécy-Lagard V., Schimmel P. 2004. Incorporation of nonnatural amino acids into proteins Annu. Rev. Biochem. 73: 147–176. [DOI] [PubMed] [Google Scholar]
- Hovius R., Vallotton P., Wohland T., Vogel H. 2000. Fluorescence techniques: Shedding light on ligand receptor interactions Trends Pharmacol. Sci. 21: 266–273. [DOI] [PubMed] [Google Scholar]
- Jameson D.M., Croney J.C., Moens P.D. 2003. Fluorescence: Basic concepts, practical aspects, and some anecdotes Methods Enzymol. 360: 1–43. [DOI] [PubMed] [Google Scholar]
- Johnson D.J., Adams T.E., Li W., Huntington J.A. 2005. Crystal structure of wild-type human thrombin in the Na+-free state Biochem. J. 392: 21–28. [DOI] [PMC free article] [PubMed] [Google Scholar]
- Juminaga D., Albaugh S.A., Steiner R.F. 1994. The interaction of calmodulin with regulatory peptides of phosphorylase kinase J. Biol. Chem. 269: 1660–1667. [PubMed] [Google Scholar]
- Karshikov A., Bode W., Tulinsky A., Stone S.R. 1992. Electrostatic interactions in the association of proteins: An analysis of the thrombin hirudin complex Protein Sci. 1: 727–735. [DOI] [PMC free article] [PubMed] [Google Scholar]
- Lakowicz J.R. In Principles of fluorescence spectroscopy . 1999. 2d ed Kluwer Academic/Plenum, New York.
- Lo Conte L., Chothia C., Janin J. 1999. The atomic structure of protein protein recognition sites J. Mol. Biol. 285: 2177–2198. [DOI] [PubMed] [Google Scholar]
- Markwardt F. 1994. The development of hirudin as an antithrombotic drug Thromb. Res. 74: 1–23. [DOI] [PubMed] [Google Scholar]
- Mattos C. 2002. Protein water interactions in a dynamic world Trends Biochem. Sci. 27: 203–208. [DOI] [PubMed] [Google Scholar]
- Meloun B., Friĉ I., Ŝorm F. 1968. Nitration of tyrosine residues in the pancreatic trypsin inhibitor with tetranitromethane Eur. J. Biochem. 4: 112–117. [DOI] [PubMed] [Google Scholar]
- Mezo A.R., Cheng R.P., Imperiali B. 2001. Oligomerization of uniquely folded mini-protein motifs: Development of a homotrimeric ββα peptide J. Am. Chem. Soc. 123: 3885–3891. [DOI] [PubMed] [Google Scholar]
- Mostad A. and Natarajan S. 1990. Crystal and molecular structure of 3-nitro-4-hydroxy-phenylalanine nitrate Z. Kristall. 193: 127–136. [Google Scholar]
- Nicastro G., Baumer L., Bolis G., Tatò M. 1997. NMR solution structure of a novel hirudin variant HM2, N-terminal 1 47 and N64 → V+G mutant Biopolymers 41: 731–749. [DOI] [PubMed] [Google Scholar]
- Nilsson B.L., Soellner M.B., Raines R.T. 2005. Chemical synthesis of proteins Annu. Rev. Biophys. Biomol. Struct. 34: 91–118. [DOI] [PMC free article] [PubMed] [Google Scholar]
- Pineda A.O., Carrell C.J., Bush L.A., Prasad S., Caccia S., Chen Z.W., Mathews F.S., Di Cera E. 2004. Molecular dissection of Na+ binding to thrombin J. Biol. Chem. 279: 31842–31853. [DOI] [PubMed] [Google Scholar]
- Riordan J.F., Sokolovsky M., Vallee B.L. 1967. Environmentally sensitive tyrosyl residues. Nitration with tetranitromethane Biochemistry 6: 358–361. [DOI] [PubMed] [Google Scholar]
- Rischel C. and Poulsen F.M. 1995. Modification of a specific tyrosine enables tracing of the end-to-end distance during apomyoglobin folding FEBS Lett. 374: 105–109. [DOI] [PubMed] [Google Scholar]
- Rischel C., Thyberg P., Rigler R., Poulsen F.M. 1996. Time-resolved fluorescence studies of the molten globule state of apomyoglobin J. Mol. Biol. 257: 877–885. [DOI] [PubMed] [Google Scholar]
- Rydel T.J., Tulinsky A., Bode W., Huber R. 1991. Refined structure of the hirudin thrombin complex J. Mol. Biol. 221: 583–601. [DOI] [PubMed] [Google Scholar]
- Sawicki E., Stanley T.W., Elbert W.C. 1964. Quenchofluorometric analysis for fluoranthenic hydrocarbons in the presence of other types of aromatic hydrocarbons Talanta 11: 1433–1441. [Google Scholar]
- Selvin P.R. 1995. Fluorescence resonance energy transfer Methods Enzymol. 246: 300–334. [DOI] [PubMed] [Google Scholar]
- Steiner R.F., Albaugh S., Kilhoffer M.-C. 1991. Distribution separations between groups in an engineered calmodulin J. Fluoresc. 1: 15–22. [DOI] [PubMed] [Google Scholar]
- Strickland E.H. 1974. Aromatic contributions to circular dichroism spectra of proteins CRC Crit. Rev. Biochem. 3: 113–175. [DOI] [PubMed] [Google Scholar]
- Szyperski T., Güntert P., Stone S.R., Wüthrich K. 1992. Nuclear magnetic resonance solution structure of hirudin (1 51) and comparison with corresponding three-dimensional structures determined using the complete 65-residue hirudin polypeptide chain J. Mol. Biol. 228: 1193–1205. [DOI] [PubMed] [Google Scholar]
- Tcherkasskaya O. and Ptitsyn O.B. 1999. Direct energy transfer to study the 3D structure of non-native proteins: AGH complex in the molten globule state of apomyoglobin Protein Eng. 12: 485–490. [DOI] [PubMed] [Google Scholar]
- Twine S.M. and Szabo A.G. 2003. Fluorescent amino acid analogs Methods Enzymol. 360: 104–127. [DOI] [PubMed] [Google Scholar]
- Vijayalakshmi J., Padmanabhan K.P., Mann K.G., Tulinsky A. 1994. The isomorphous structures of prethrombin-2, hirugen-, and PPACK-thrombin: Changes accompanying activation and exosite binding to thrombin Protein Sci. 3: 2254–2271. [DOI] [PMC free article] [PubMed] [Google Scholar]
- Wells J.A. 1990. Additivity of mutational effects in proteins Biochemistry 29: 8509–8517. [DOI] [PubMed] [Google Scholar]
- Wells C.M. and Di Cera E. 1992. Thrombin is a Na+-activated enzyme Biochemistry 31: 11721–11730. [DOI] [PubMed] [Google Scholar]
- Wu P. and Brand L. 1994. Resonance energy transfer: Methods and applications Anal. Biochem. 18: 1–13. [DOI] [PubMed] [Google Scholar]
- Yan Y. and Marriott G. 2003. Analysis of protein interactions using fluorescence technologies Curr. Opin. Chem. Biol. 7: 635–640. [DOI] [PubMed] [Google Scholar]