Abstract
The C-terminal phosphorylation domain of the epidermal growth factor receptor is believed to regulate protein kinase activity as well as mediate the assembly of signal transduction complexes. The structure and dynamics of this proposed autoregulatory domain were examined by labeling the extreme C terminus of the EGFR intracellular domain (ICD) with an extrinsic fluorophore. Fluorescence anisotropy decay analysis of the nonphosphorylated EGFR-ICD yielded two rotational correlation times: a longer time, consistent with the global rotational motion of a 60- to 70-kDa protein with an elongated globular conformation, and a shorter time, presumably contributed by segmental motion near the fluorophore. A C-terminally truncated form of EGFR-ICD yielded a slow component consistent with the rotational motion of the 38-kDa kinase core. These findings suggested a structural arrangement of the EGFR-ICD in which the C-terminal phosphorylation domain interacts with the kinase core to move as an extended structure. A marked reduction in the larger correlation time of EGFR-ICD was observed upon its autophosphorylation. This dynamic component was faster than predicted for the globular motion of the 62-kDa EGFR-ICD, suggesting an increase in the mobility of the C-terminal domain and a likely displacement of this domain from the kinase core. The interaction between the SH2 domain of c-Src and the phosphorylated EGFR C-terminal domain was shown to impede its mobility. Circular dichroism spectroscopy indicated that the EGFR C-terminal domain possessed a significant level of secondary structure in the form of α-helices and β-sheets, with a marginal change in β-sheet content occurring upon phosphorylation.
Keywords: protein tyrosine kinase, ErbB, HER, fluorescence anisotropy
The epidermal growth factor receptor (EGFR) is a single-chain transmembrane protein comprised of an extracellular EGF-binding domain, a short transmembrane sequence, and a cytoplasmic region that incorporates a protein tyrosine kinase domain and a C-terminal phosphorylation domain. Growth factor binding to the extracellular domain of the EGFR promotes dimerization of the monomeric receptor and enhances its intrinsic protein tyrosine kinase activity toward intracellular substrates (Schlessinger 2002; Burgess et al. 2003). This ligand-induced receptor activation also stimulates autophosphorylation of key tyrosine residues within the C-terminal domain of the receptor to facilitate the recruitment of Src homology-2 (SH2) and phosphotyrosine-binding (PTB) domains of proximal mitogenic signaling molecules (Pawson 1994, 1995; Schlessinger 2000). The C-terminal phosphorylation domain is thus key to the signaling functions of the EGFR.
Significant progress has been made in recent years in investigating the structure of the EGFR at the molecular level. Crystallographic studies of the EGFR extracellular domain have largely elucidated the mechanism of ligand-induced dimerization (Hubbard and Till 2000; Ogiso et al. 2002; Burgess et al. 2003). Another key discovery came when the long-anticipated crystal structure of the EGFR kinase core revealed aspects of protein tyrosine kinase (PTK) regulation unique to the EGFR. Whereas most receptor PTKs possess low basal kinase activity until the activation loop (A-loop) situated at the catalytic active site becomes phosphorylated, the A-loop of the EGFR kinase adopts a conformation resembling that of the activated state of other receptor PTKs in the absence of A-loop phosphorylation (Stamos et al. 2002; Burgess et al. 2003). In this regard, the EGFR kinase appears to possess catalytic competency independent of ligand-induced receptor activation, and therefore alternative means of modulating its kinase activity have been proposed. Biochemical studies have suggested that the ∼230–amino acid, C-terminal domain of the EGFR plays an integral role in regulation of the kinase. In particular, kinetic analyses of the EGFR kinase indicate that the C-terminal domain modulates receptor function by virtue of repressing kinase activity in the absence of autophosphorylation (Bertics and Gill 1985; Bertics et al. 1988). A model consistent with this observation is one in which the C-terminal domain acts as a reversible inhibitor that is displaced from the active site following its autophosphorylation (Bertics and Gill 1985; Walton et al. 1990; Wedegaertner and Gill 1992; Cheng and Koland 1996).
Although this model would account for the regulation of kinase activity and the assembly of exogenous substrates via SH2 and PTB domain interactions with the C terminus, there is currently limited structural evidence to substantiate this view. Reported kinase domain structures were derived from EGFR proteins with highly truncated (∼40–amino acid) C termini. In one structure, ordered C-terminal segments appear to extend away from the kinase and interact with a crystal neighbor (Stamos et al. 2002). In another structure, similar C-terminal fragments interact intramolecularly with the N- and C-terminal lobes of the kinase core (Wood et al. 2004). A recent modeling study based upon these structures proposed a regulatory mechanism involving the C-terminal phosphorylation domain (Landau et al. 2004). Here, an acidic segment of the C terminus regulates an inhibitory dimerization of the receptor via electrostatic interactions with the kinase core, with phosphorylation destabilizing these interactions (Landau et al. 2004). These structural analyses aside, the tertiary structure and the possible dynamic conformations of the full-length C-terminal domain still remain to be characterized.
Structural changes that accompany the activation of the EGFR-PTK activity have been reported. The effect of autophosphorylation on the conformation of the intracellular domain (ICD) was first investigated by hydrodynamic studies (Cadena et al. 1994). When phosphorylated and dephosphorylated EGFR-ICD proteins were compared, the Stokes radius of the phosphorylated protein was significantly larger, indicating a conformational change to an extended form. Our recent fluorescence resonance energy transfer studies indicated that phosphorylation results in a significant displacement of the C terminus from the kinase active site (Lee and Koland 2005). However, the structural elements involved in this conformational change remain unclear.
The present study investigates the structure and dynamics of the C terminus of the EGFR and the effect of autophosphorylation on the conformation of this proposed regulatory domain. A method for site-specific labeling of the extreme C terminus of the EGFR-ICD with fluorescent probe molecules was devised to enable multifrequency phase/modulation anisotropy decay studies. These fluorescence studies, in conjunction with circular dichroism (CD) analyses, indicate that the EGFR C-terminal phosphorylation domain interacts with the kinase core in the nonphosphorylated state and is relatively structured. A significant change in the conformation of the C-terminal domain was detected upon phosphorylation, indicative of a region of the C terminus adopting a form of higher local mobility.
Results
Generation of C-terminally labeled EGFR intracellular domain proteins with an intein-based expression system
To examine the structural characteristics of the EGFR C-terminal phosphorylation domain, we developed a procedure for site-specific labeling of recombinant EGFR proteins at their extreme C termini with a fluorescent probe molecule (Chong et al. 1997; Mukhopadhyay et al. 2001). The bacterial intein-expression protocol (New England Biolabs) was modified to functionally express and purify two recombinant proteins, the 62-kDa EGFR intracellular domain (EGFR-ICD; amino acid residues 644–1186) and the 38-kDa kinase core (EGFR-ΔCT; amino acid residues 644–964), in the context of the baculovirus/insect cell expression system. Residues 644 and 964 were chosen as the limits of the kinase core after examining the sequences conserved in the PTK family. Also, published crystal structures of the EGFR intracellular domain show that the ordered residues of the kinase core are included in the EGFR-ΔCT construct. The expression strategy entailed generating EGFR-ICD and EGFR-ΔCT in Sf21 insect cells as tripartite proteins fused N-terminally to the intein-chitin binding domain (CBD) module and subsequently immobilizing them on a chitin matrix. EGFR-ICD and EGFR-ΔCT were cleaved via intein-based catalysis from the intein-CBD protein with an exogenous thiol (Fig. 1A). To induce the cleavage reaction and allow the irreversible incorporation of a fluorophore at the C terminus of the EGFR-ICD and EGFR-ΔCT proteins, a cysteine-conjugated EDANS (CEDANS) fluorophore was synthesized (Fig. 1B).
Figure 1.
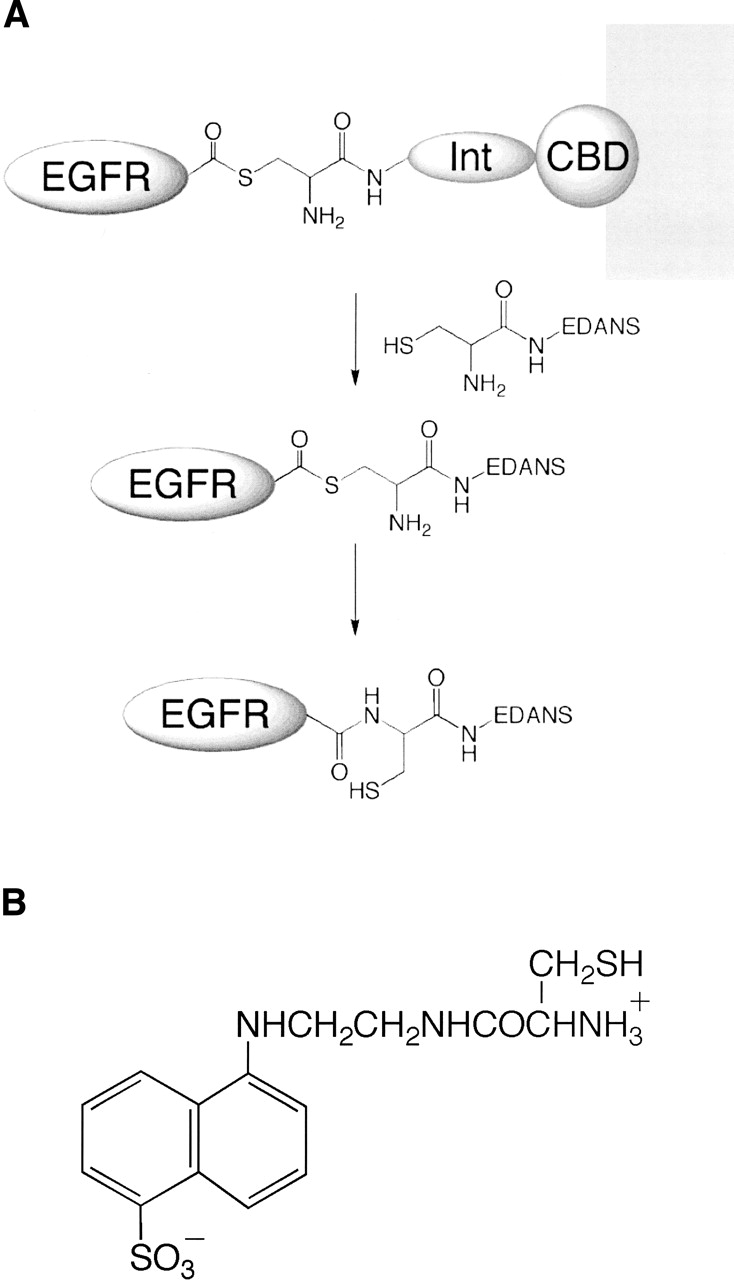
(A) A schematic of the intein-based protein expression and fluorescent-labeling method. EGFR-ICD and EGFR-ΔCT are each expressed as tripartite fusion proteins with intein (Int) and chitin-binding domain (CBD) sequences and immobilized on a chitin matrix. The thiol-ester intermediate is cleaved with an exogenous thiol (cysteine conjugate of the fluorophore EDANS), resulting in the release of the EGFR protein. The cysteine-conjugated EDANS is irreversibly incorporated at the extreme C terminus of EGFR-ICD/ΔCT proteins as a result of an S–N acyl transition to form a stable amide bond. (B) Structure of the cysteine-EDANS conjugate (CEDANS) used in intein-mediated labeling of the EGFR C terminus.
CEDANS was synthesized by a two-step reaction in which the carboxyl group of a cysteine derivative (N-α-trityl-S-trityl-L-cysteine N-hydroxysuccinimide ester) was conjugated with the free primary amino group of the EDANS fluorophore, followed by deblocking the thiol and the amine groups of cysteine (Tolbert and Wong 2000; Mukhopadhyay et al. 2001; Mekler et al. 2002). The chemical structure of CEDANS was confirmed by thin-layer chromatography, electrospray ionization mass spectrometry, and H-NMR (data not shown).
Characterization of EGFR intracellular domain proteins fluorescently labeled with CEDANS
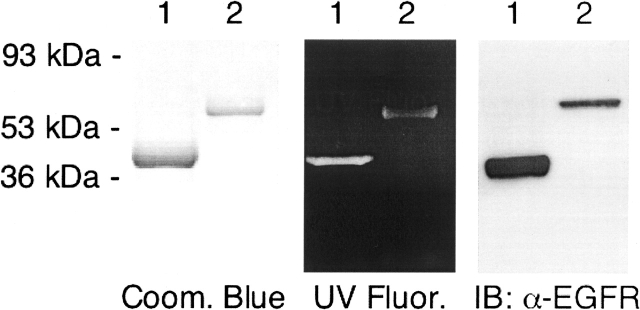
Purified EGFR-ICD and EGFR-ΔCT proteins C-terminally labeled with CEDANS (EGFR-ICD–CEDANS and EGFR-ΔCT–CEDANS) were analyzed by SDS-PAGE (Fig. 2). Single protein bands of ∼38 kDa and ∼62 kDa were observed with Coomassie Blue staining, corresponding to the expected sizes of EGFR-ΔCT–CEDANS and EGFR-ICD–CEDANS, respectively (Fig. 2, left panel). SDS-PAGE followed by visualization with UV illumination showed single bands with the apparent sizes of ∼38 kDa and ∼62 kDa fluorescing in their respective lanes (Fig. 2, middle panel), which confirmed the irreversible incorporation of the CEDANS probe via intein-mediated amide bond formation. An antibody recognizing the intracellular domain of the EGFR was used in immunoblotting to confirm the identity of the purified proteins (Fig. 2, right panel).
Figure 2.
Characterization of purified CEDANS-labeled EGFR-ICD and EGFR-ΔCT. EGFR-ΔCT–CEDANS (1 μg) (lane 1) and EGFR-ICD–CEDANS (0.5 μg) (lane 2) were resolved by 12% SDS-PAGE and visualized with Coomassie Blue staining (left panel), UV illumination (middle panel), and immunoblotting with anti-EGFR antibody (right panel).
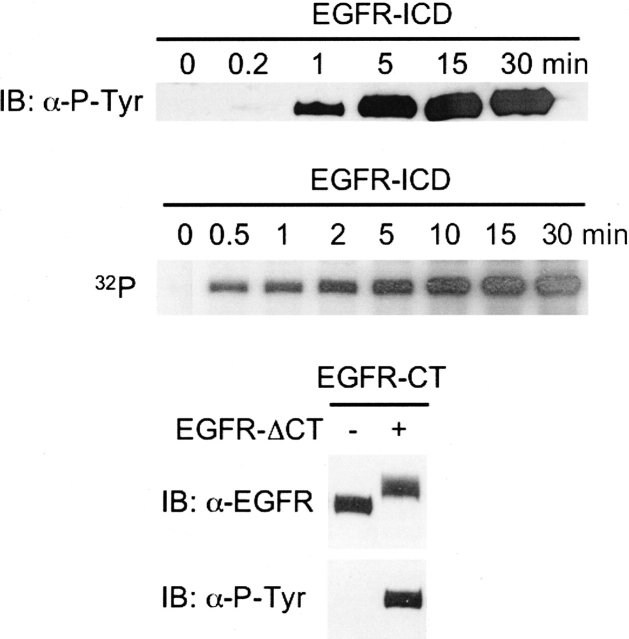
The integrity of the intrinsic PTK activity of the EGFR-ICD–CEDANS and EGFR-ΔCT–CEDANS proteins was examined by in vitro phosphorylation assays, in which phosphorylation was detected either by anti-phosphotyrosine immunoblotting or radiolabeled phosphate incorporation (Fig. 3). It is known that sites of autophosphorylation in the EGFR reside primarily in the C-terminal domain, where at least four tyrosine residues are phosphorylated upon receptor activation (Gill et al. 1987). In order to assess the enzymic activity of EGFR-ΔCT–CEDANS, which is devoid of the C terminus, EGFR-ΔCT–CEDANS was incubated with the purified C-terminal domain of the EGFR (EGFR-CT) to serve as an exogenous substrate. As shown in Figure 3, EGFR-ΔCT–CEDANS efficiently phosphorylated EGFR-CT.
Figure 3.
In vitro phosphorylation activities of EGFR-ICD–CEDANS and EGFR-ΔCT–CEDANS. The time course of EGFR-ICD–CEDANS autophosphorylation was assayed in the presence of Mn2+ and ATP (see Materials and Methods). The reactions were carried out by addition of ATP and [γ-32P]ATP (top and middle panels, respectively) and quenched at the noted times with sample buffer, resolved by SDS-PAGE, and immunoblotted with anti-phosphotyrosine antibody (top panel) or autoradiographed (middle panel). The kinase activity of EGFR-ΔCT–CEDANS was assayed via its ability to phosphorylate the C-terminal phosphorylation domain substrate, EGFR-CT (see Materials and Methods). Phosphorylated EGFR-CT was subsequently purified and compared with untreated EGFR-CT samples by SDS-PAGE and immunoblotting with either anti-EGFR or anti-phosphotyrosine antibody.
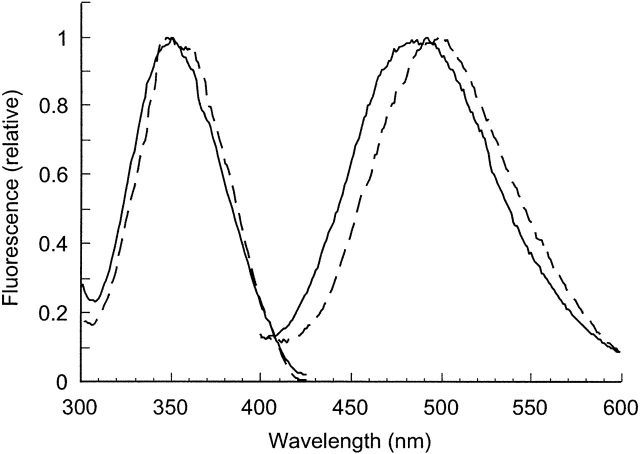
Subsequently, the steady-state fluorescence excitation and emission spectra of the labeled proteins were recorded (Fig. 4). The excitation spectra of EGFR-ΔCT–CEDANS and EGFR-ICD–CEDANS were quite similar and typical of the EDANS fluorophore. The emission spectra of the two proteins differed, with a blueshift in the maximal emission of EGFR-ICD–CEDANS (483 nm) relative to that of EGFR-ΔCT–CEDANS (498 nm).
Figure 4.
Fluorescence spectra of EGFR-ICD–CEDANS and EGFR-ΔCT–CEDANS. The excitation and emission spectra of EGFR-ICD–CEDANS (—) and EGFR-ΔCT–CEDANS (---) were recorded with 8 nm excitation and emission band passes and corrected by subtraction of a buffer blank.
Structural characterization of the EGFR C-terminal domain analyzed by circular dichroism spectroscopy
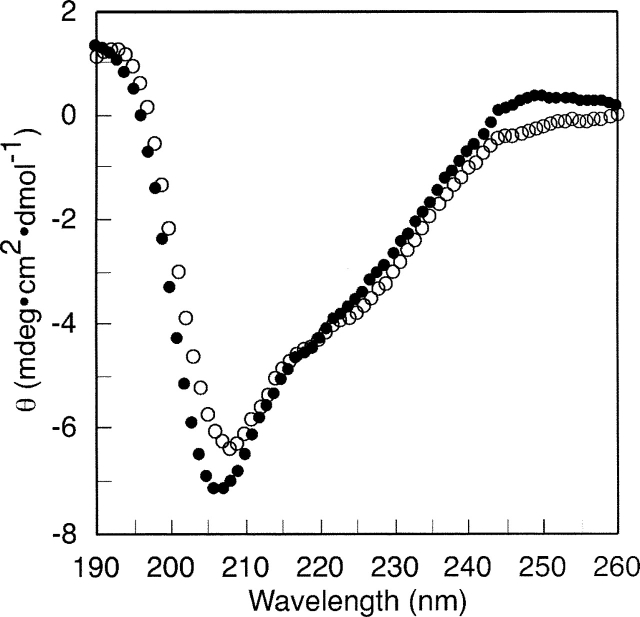
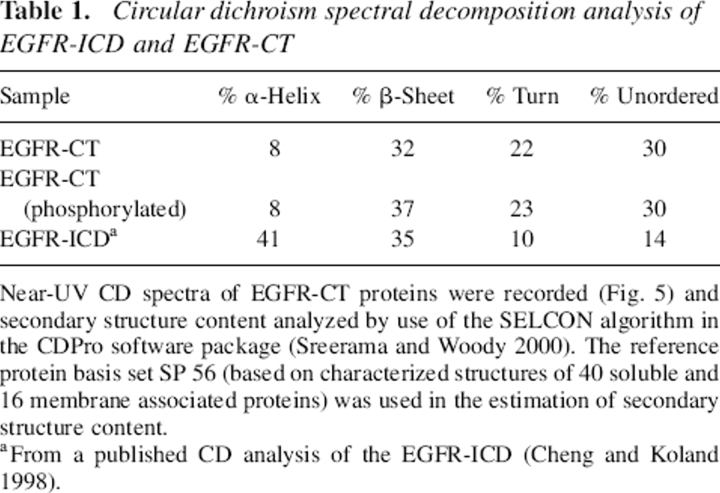
To characterize the structure of the EGFR C-terminal domain (EGFR-CT; residues 972–1186) and assess possible secondary structure changes resulting from its phosphorylation, circular dichroism (CD) spectroscopy was employed. The CD spectra of the nonphosphorylated and phosphorylated forms of the purified recombinant EGFR-CT are shown in Figure 5. Differences in the CD spectra of the two EGFR-CT forms were slight but reproducible in that phosphorylated EGFR-CT displayed an ∼2-nm blueshift in the negative peak (206 nm) when compared with that of nonphosphorylated EGFR-CT (208 nm). Their peak intensities were also marginally affected, as indicated by the more negative molar ellipticity value of phosphorylated EGFR-CT (Fig. 5). Quantitative structural analyses of the CD spectra were performed by use of the SELCON algorithm in the CDPro software package (Sreerama and Woody 1993; http://www.lamar.colostate.edu/∼sreeram/CDPro/). The results from these analyses are summarized in Table 1. The deduced secondary structure content of EGFR-CT showed the presence of α-helical (8%) and β-sheet (32%) structures in addition to an unordered fraction (30%). Phosphorylation of EGFR-CT, on the basis of these analyses, appeared to have no impact on the fractional α-helical and unordered content, while fractional β-sheet content increased modestly. We note that the phosphorylation of the EGFR-CT in these experiments appeared to be stoichiometric (as indicated by an upward gel shift in SDS-PAGE as seen in Fig. 3). However, given the presence of several identified sites of tyrosine residue phosphorylation in the C-terminal phosphorylation domain (cf. Vega et al. 1992), it is possible that a higher stoichiometry of phosphorylation could be achieved in the context of the native receptor, and thus our analysis of the phosphorylation-dependent conformational changes described here could underestimate what might be seen under other conditions.
Figure 5.
Circular dichroism spectroscopic analysis of the EGFR C-terminal domain (EGFR-CT). EGFR-CT was subjected to CD analysis in nonphosphorylated (○) or phosphorylated (•) condition. EGFR-CT was preincubated with EGFR-ΔCT–CEDANS (1 μM) in the presence or the absence of Mn and ATP. Both nonphosphorylated and phosphorylated samples were applied to a cobalt metal resin column for purification of the hexahistidine-tagged EGFR-CT from EGFR-ΔCT–CEDANS (see Materials and Methods). EGFR-CT was dialyzed against 10 mM sodium phosphate (pH 7.4), 5 mM NaCl, and then the CD spectra were recorded. Spectra were corrected by subtraction of a sodium phosphate buffer blank spectrum.
Table 1.
Circular dichroism spectral decomposition analysis of EGFR-ICD and EGFR-CT
Near-UV CD spectra of EGFR-CT proteins were recorded (Fig. 5) and secondary structure content analyzed by use of the SELCON algorithm in the CDPro software package (Sreerama and Woody 2000). The reference protein basis set SP 56 (based on characterized structures of 40 soluble and 16 membrane associated proteins) was used in the estimation of secondary structure content.
a From a published CD analysis of the EGFR-ICD (Cheng and Koland 1998).
Differential phase/modulation anisotropy decay analyses of CEDANS-labeled recombinant EGFR proteins
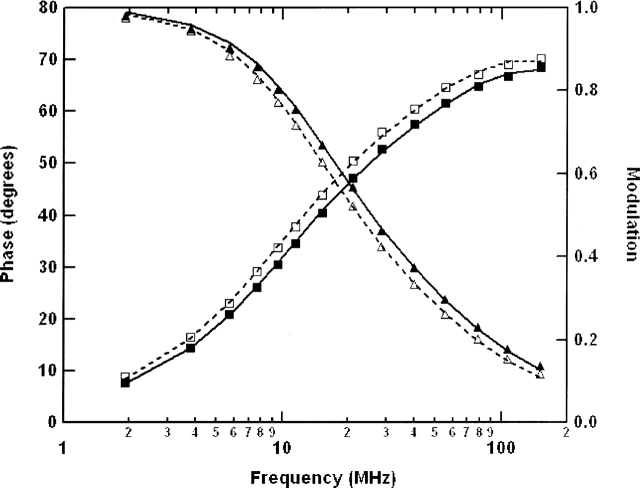
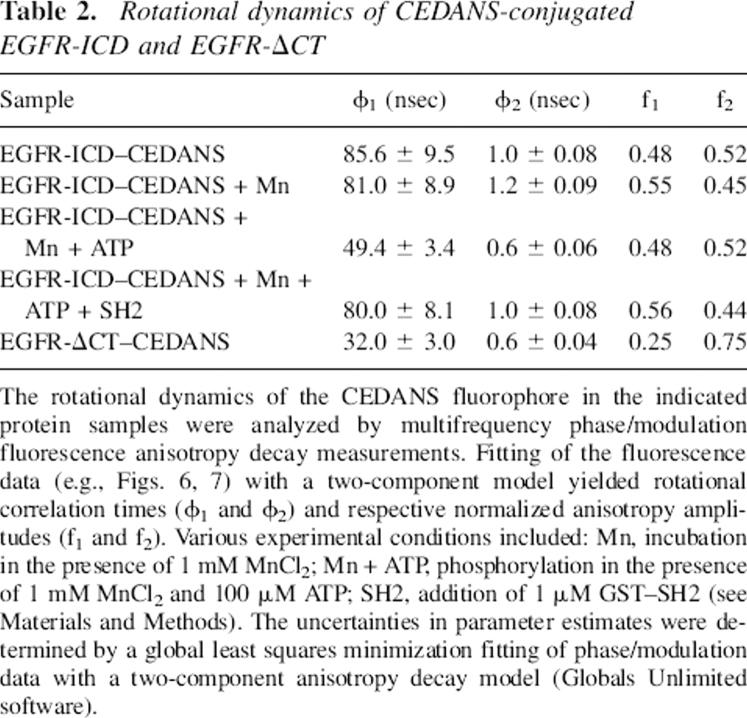
Multifrequency phase/modulation fluorimetery was utilized to measure the fluorescence lifetime and rotational dynamics of EGFR-ICD–CEDANS and EGFR-ΔCT–CEDANS. The frequency domain phase/modulation method was first used to analyze the fluorescence decay kinetics of the fluorescently labeled proteins (Fig. 6). The best fits of the phase and modulation versus frequency data for the CEDANS-labeled proteins yielded two lifetime components, ∼15 nsec and 6 nsec. These fluorescence lifetime values were subsequently used in phase/modulation anisotropy decay analysis (Fig. 7). The results of the phase/modulation experiments are summarized as rotational correlation times in Table 2. The nonphosphorylated form of EGFR-ICD–CEDANS showed a long correlation time (ϕ1) of 86 nsec and a second, shorter component (ϕ2) of 1.0 nsec, with fractional anisotropy amplitudes of 0.48 and 0.52, respectively. Phase/modulation anisotropy data were collected for EGFR-ICD–CEDANS under two additional conditions, in the presence of Mn2+ (kinase activated, nonphosphorylated state) and in the presence of Mn2+ and ATP (activated and phosphorylated state). Addition of Mn2+ (1 mM) altered the component correlation times slightly to ϕ1 = 81 nsec and ϕ2 = 1.2 nsec, with amplitudes of 0.55 and 0.45, respectively. In the phosphorylated state these correlation times decreased markedly to ϕ1 = 49 nsec and ϕ2 = 0.6 nsec, with fractional anisotropy amplitudes of 0.48 and 0.52, respectively. This significant decrease in the larger correlation time upon phosphorylation indicated an increase in the local dynamics of the C-terminal domain and was consistent with reports of conformational changes accompanying autophosphorylation of the EGFR (see Discussion). The correlation times for EGFR-ΔCT–CEDANS were also measured to assess the impact of C-terminal truncation. Here, the correlation time components were ϕ1 = 32 nsec and ϕ2 = 0.6 nsec, with relative amplitudes of 0.25 and 0.75, respectively.
Figure 6.
Frequency domain fluorescence lifetime analysis of CEDANS-conjugated EGFR-ICD proteins. Samples of EGFR-ICD–CEDANS and EGFR-ΔCT–CEDANS were analyzed by multifrequency phase/modulation spectroscopy and by fitting of the data with a two-component model for fluorescence decay (see Materials and Methods). Shown are representative phase (□, ▪) and modulation (△, ▴) data for the EGFR-ICD–CEDANS protein in nonphosphorylated (□, △) or phosphorylated (▪, ▴) condition.
Figure 7.
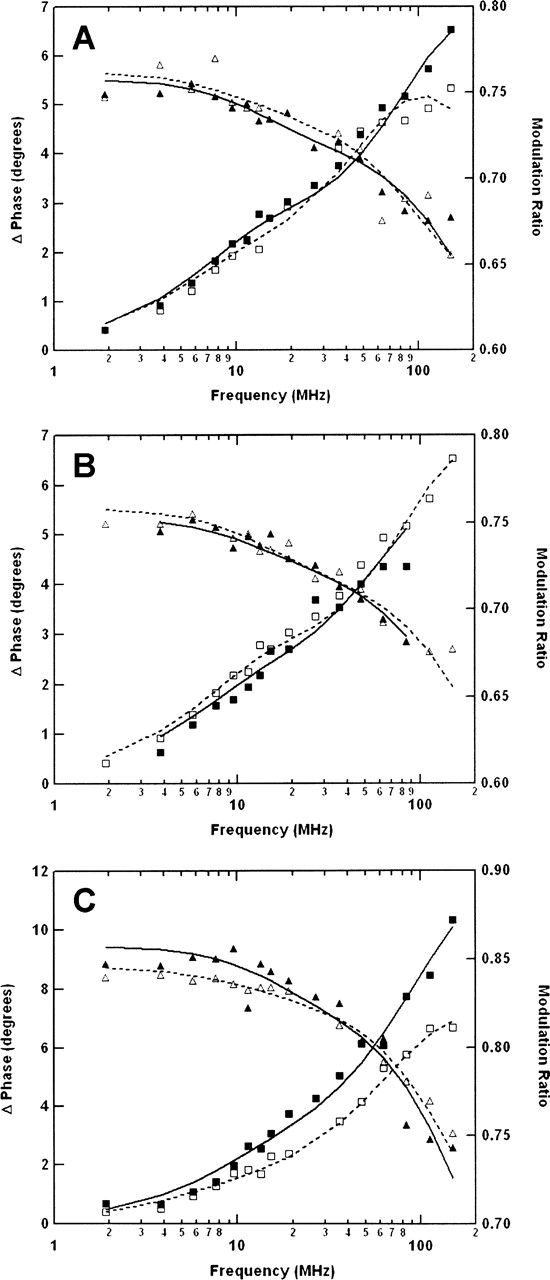
Frequency domain anisotropy decay analysis of CEDANS-conjugated EGFR-ICD proteins. The rotational dynamics of the C-terminal fluorophore in the EGFR-ICD–CEDANS and EGFR-ΔCT–CEDANS proteins (0.5 μM) were analyzed by multifrequency phase/modulation fluorescence anisotropy measurements (see Materials and Methods). Shown are representative phase (□, ▪) and modulation (△, ▴) data for the proteins under various conditions. (A) EGFR-ICD–CEDANS protein incubated in the presence of 1 mM MnCl2 (□, △) or phosphorylated in the presence of 1 mM MnCl2 and 100 μM ATP (▪, ▴). (B) EGFR-ICD–CEDANS phosphorylated in the presence of 1 mM MnCl2 and 100 μM ATP without (□, △) or with (▪, ▴) the subsequent addition of 1 μM recombinant GST–SH2 protein. (C) Comparison of EGFR-ICD–CEDANS (□, △) and EGFR-ΔCT–CEDANS (▪, ▴) proteins. Fitting of these data with a two-component anisotropy decay model yielded the parameters given in Table 2.
Table 2.
Rotational dynamics of CEDANS-conjugated EGFR-ICD and EGFR-ΔCT
The rotational dynamics of the CEDANS fluorophore in the indicated protein samples were analyzed by multifrequency phase/modulation fluorescence anisotropy decay measurements. Fitting of the fluorescence data (e.g., Figs. 6, 7) with a two-component model yielded rotational correlation times (ϕ1 and ϕ2) and respective normalized anisotropy amplitudes (f1 and f2). Various experimental conditions included: Mn, incubation in the presence of 1 mM MnCl2; Mn + ATP, phosphorylation in the presence of 1 mM MnCl2 and 100 μM ATP; SH2, addition of 1 μM GST–SH2 (see Materials and Methods). The uncertainties in parameter estimates were determined by a global least squares minimization fitting of phase/modulation data with a two-component anisotropy decay model (Globals Unlimited software).
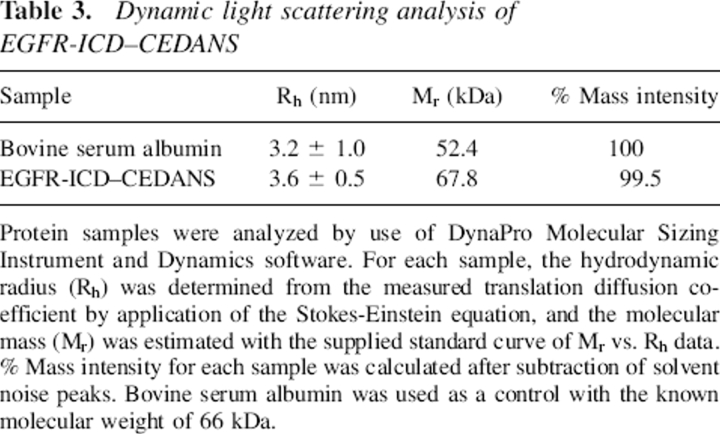
The first rotational correlation time (ϕ1 = 32 nsec) observed for EGFR-ΔCT–CEDANS was consistent with the global rotational motion of a globular protein of its known molecular mass (38 kDa) with average hydration and in aqueous 20% (v/v) glycerol. However, for the C-terminally complete EGFR-ICD–CEDANS protein in the nonphosphorylated state, ϕ1 assumed the value of 86 nsec, which is significantly larger than the predicted global rotational correlation time for a 62-kDa protein (50–60 nsec). The possible dimerization of the EGFR-ICD–CEDANS protein was ruled out by dynamic light scattering measurements (see Table 3), which indicated a homogenous molecular mass distribution of 68 kDa. The most reasonable interpretation of its large ϕ1 value is that the EGFR-ICD–CEDANS assumes a highly asymmetric, relatively rigid structure in solution. The smaller ϕ2 value under various conditions ranged from 0.6 to 1.2 nsec and likely represented the segmental motion of a small, relatively flexible peptide domain near the fluorophore or the local motion of the CEDANS fluorophore. Both ϕ1 and ϕ2 for EGFR-ICD–CEDANS were significantly reduced with phosphorylation, indicating an enhanced mobility of the C-terminal domain (see Discussion). The relative amplitudes of the slow and the fast components remained constant throughout the experiments, with each contributing roughly 50% of the overall anisotropy decay.
Table 3.
Dynamic light scattering analysis of EGFR-ICD–CEDANS
Protein samples were analyzed by use of DynaPro Molecular Sizing Instrument and Dynamics software. For each sample, the hydrodynamic radius (Rh) was determined from the measured translation diffusion coefficient by application of the Stokes-Einstein equation, and the molecular mass (Mr) was estimated with the supplied standard curve of Mr vs. Rh data. % Mass intensity for each sample was calculated after subtraction of solvent noise peaks. Bovine serum albumin was used as a control with the known molecular weight of 66 kDa.
EGFR-ICD–CEDANS interaction with an SH2 domain substrate
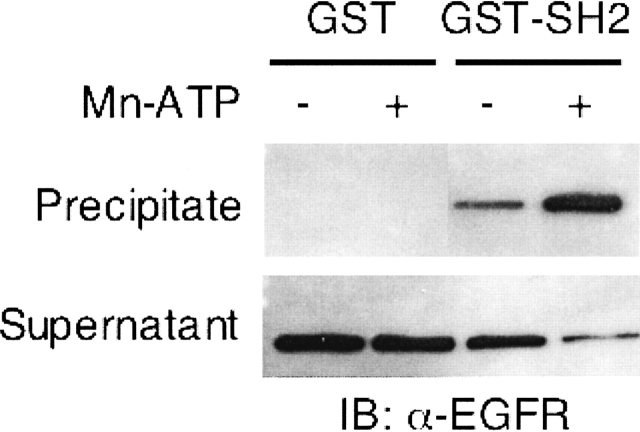
The EGFR C terminus, upon receptor activation and autophosphorylation, is known to recruit intracellular proteins to form signal transduction complexes. Many of the intracellular substrates binding to the C terminus contain the second Src homology (SH2) domain, which recognizes specific phosphotyrosines within the EGFR C terminus. Our previous studies have characterized the interaction of EGFR and SH2 domain proteins (Sierke and Koland 1993; Sierke et al. 1993). To test whether interaction with an SH2 domain-containing protein effected a change in the rotational correlation times of phosphorylated EGFR-ICD–CEDANS, the SH2 domain of c-Src was bacterially expressed as a recombinant glutathione S-transferase (GST) fusion protein (Sierke and Koland 1993; Sierke et al. 1993). Prior to multifrequency phase/modulation anisotropy analysis, a binding assay was performed to demonstrate the interaction of the phosphorylated EGFR-ICD–CEDANS and the SH2 domain substrate. As shown in Figure 8, phosphorylated EGFR-ICD–CEDANS showed a strong interaction with the GST-fused SH2 domain, whereas in the nonphosphorylated state the interaction was minimal. Next, the phosphorylated form of EGFR-ICD–CEDANS was allowed to interact with GST–SH2 as anisotropy decay measurements were taken (Fig. 7). As shown in Table 2, the correlation times of phosphorylated EGFR-ICD–CEDANS in the presence of the SH2 domain increased to 80 nsec and 1 nsec, with relative anisotropy amplitudes of 0.56 and 0.44, respectively.
Figure 8.
Interaction between EGFR-ICD–CEDANS and an SH2 domain substrate. An in vitro binding assay was performed by incubating nonphosphorylated or phosphorylated EGFR-ICD–CEDANS with the GST-fused SH2 domain of c-Src or GST alone. The GST and GST–SH2 proteins were precipitated by the addition of glutathione-agarose, and fractions of the precipitates and supernatants were subjected to SDS-PAGE, followed by immunoblotting with anti-EGFR (see Materials and Methods).
Discussion
The spatial and temporal regulation of the EGFR is crucial to cellular growth and development. Overexpression and/or improper regulation of the EGFR kinase activity have been strongly implicated in cancerous transformation. The first published crystallographic structure of the EGFR catalytic domain suggested that it adopts an active conformation independent of EGF binding and receptor dimerization (Stamos et al. 2002). This and the results of biochemical studies have shown that the EGFR kinase is not regulated by A-loop phosphorylation. Self-phosphorylation of the EGFR C terminus is thus still proposed as a mode of modulating its kinase activity. The molecular mechanism for this modulation is not known, and there currently exist limited structural data for the C-terminal domain itself. Two independently determined crystal structures have been published that include limited segments of the C terminus displaying very different conformations (Stamos et al. 2002; Wood et al. 2004). The EGFR C terminus functioning as a reversible inhibitor accounts for how the EGFR selectively targets its substrates, but implicit in this view is that significant conformational changes must accompany C-terminal autophosphorylation.
In our previous work, we characterized the nucleotide binding properties of the EGFR using a fluorescent nucleotide analog, 2′(3′)-O-(2,4,6-trinitrophenyl)-adenosine 5′-triphosphate (TNP-ATP). Here, it was shown that truncation of the C-terminal domain enhanced the affinity of the nucleotide binding site for TNP-ATP, suggesting that the C-terminal autophosphorylation domain of the EGFR modulates the nucleotide-binding properties of the protein tyrosine kinase domain (Cheng and Koland 1996). Previous steady-state kinetic studies of EGFR kinase activity also indicated a negative interaction between the nucleotide and the peptide substrates, which like the C-terminal phosphorylation domain must interact with the catalytic site (Posner et al. 1992; Cheng and Koland 1996). Furthermore, phosphorylation of the C terminus has been shown to enhance the affinity of exogenous peptide substrates for the active site (Bertics et al. 1988). These results are consistent with the enhancement of PTK activity observed upon autophosphorylation, but precisely how these apparent interactions of the C-terminal domain with the kinase active site are affected by autophosphorylation remains unclear. Recently, our fluorescence resonance energy transfer measurements suggested that the C-terminal domain adopts a folded conformation with the extreme C terminus in close proximity to the catalytic site, and that phosphorylation causes a significant displacement of this domain away from the active site (Lee and Koland 2005).
In the present work we devised a method for site-specific labeling of the extreme C termini of the EGFR-ICD and truncated EGFR-ΔCT proteins with an extrinsic fluorescent probe. This C-terminal labeling enabled us to investigate the molecular dynamics of the C-terminal domain of the receptor via fluorescence anisotropy decay measurements. The intein-based protein expression system was modified to simultaneously express and purify functional EGFR-ICD and EGFR-ΔCT proteins with the baculovirus/insect cell system and effect the irreversible incorporation of a cysteine-conjugated fluorophore (CEDANS) at their C termini. EGFR-ICD–CEDANS and EGFR-ΔCT–CEDANS proved to be successfully expressed and fluorescently labeled via the modified intein-based expression method, as indicated by SDS-PAGE with Coomassie Blue staining and immunoblotting and by spectral analyses of the CEDANS-labeled proteins. Furthermore, their catalytic activity did not appear to be compromised as a result of fluorescent labeling, as EGFR-ICD–CEDANS and EGFR-ΔCT–CEDANS showed efficient autophosphorylation and substrate phosphorylation, respectively.
To determine the effects of phosphorylation on the structure and dynamics of the EGFR C terminus, the EGFR-ICD–CEDANS and EGFR-ΔCT–CEDANS proteins were subjected to differential phase/modulation fluorescence anisotropy decay analysis. The analysis yielded two rotational correction times characterizing the motion of the C-terminal probe. The larger correlation time (ϕ1) for EGFR-ΔCT–CEDANS was as predicted for a protein of its size and with its known globular structure as determined by X-ray crystallography (Stamos et al. 2002) (Table 2). There was a striking difference in the rotational dynamics of the phosphorylated and nonphosphorylated EGFR-ICD. In the absence of phosphorylation, ϕ1 of EGFR-ICD–CEDANS was consistent with a global tumbling of a 62-kDa globular protein displaying significant asymmetry. Previous measurement of the Stokes radius of EGFR-ICD also indicated a significant elongation of the protein, which became even more pronounced upon phosphorylation (Cadena et al. 1994). The ϕ1 of EGFR-ICD–CEDANS was cut nearly in half upon phosphorylation, which suggested that the C-terminal domain became mobile in relation to the kinase core, possibly as a result of being displaced from the enzyme active site. The decreased rotational correlation time (ϕ1) of phosphorylated EGFR-ICD–CEDANS might appear inconsistent with the increase in the Stokes radius of the EGFR-ICD observed upon its phosphorylation (Cadena et al. 1994). However, while the Stokes radius is a measure of the translation motion of the EGFR-ICD as a whole, when modeled as a rigid spherical particle, the rotational correlation times reported here reflect the rotational motion of the CEDANS probe and would be significantly reduced by an increased flexibility and mobility of the C-terminal domain with respect to the kinase core.
Consistent with our interpretation was the observed increase in the ϕ1 of the C-terminally phosphorylated EGFR-ICD–CEDANS upon interaction with the SH2 domain. It is reasonable that SH2 domain interactions would impede the mobility of the C terminus. The marked reduction also in ϕ2 upon phosphorylation of the C-terminal domain suggests that mobility in the immediate vicinity of the CEDANS probe is increased. This finding also argues against the possibility of ϕ2 reflecting only the local motion of the CEDANS fluorophore at the point of its attachment. It should be noted that while the stoichiometry of phosphorylation of the EGFR-ICD–CEDANS protein as analyzed in these experiments was estimated to be ∼1.0, based on phosphorylation assays performed under similar conditions, it is possible that a higher stoichiometry of phosphorylation could be achieved in other contexts, such as in the case of the native receptor. Thus, it is possible that larger phosphorylation-induced changes in EGFR C-terminal domain dynamics could occur under some circumstances.
In addition to characterizing the dynamics of the EGFR C terminus, we provide here the first secondary structural information for the C-terminal domain. Our circular dichroism data indicated the presence of a significant level of secondary structure in the form of α-helices and β-sheets (>40%), although roughly one-third of this ∼230–amino acid protein was estimated to be unordered. This is somewhat in contrast to the results obtained from a number of quantitative secondary prediction programs when applied to the EGFR C-terminal domain (http://www.ExPASY.org). While there were some discrepancies between individual programs in their secondary structure predictions, averaging these predictions yielded the following: ∼12% α-helix, ∼9% β-sheet, and ∼80% random coil and unordered structure. Phosphorylation on C-terminal tyrosine residues yielded a small but reproducible reduction in molar ellipticity accompanied by a blueshift in its spectral peak. Quantitative analysis yielded no major changes in the secondary structures other than a small increase in β-sheet content upon phosphorylation. These findings suggest that phosphorylation enhances the mobility of the C-terminal domain without effecting a significant disordering of secondary structure.
Taken together our results are consistent with a model in which, in the basal state, one or more segments of the EGFR C-terminal domain interact physically with the kinase core, while in the activated/phosphorylated state of the receptor, these interactions are abrogated. Such interactions were implicit in the earlier proposal (Bertics and Gill 1985) that phosphorylation sites in the EGFR C-terminal domain function as alternative substrates/competitive inhibitors prior to their phosphorylation, presumably by binding directly to the kinase catalytic site. Recent crystallographic structures of the EGFR-ICD proteins with significantly truncated C-terminal domains show limited ordered segments of the remaining C terminus physically interacting with the kinase core. In one structure (Wood et al. 2004), two separate sequences of the C terminus (residues 971–980 and 986–994) make intramolecular interactions with the kinase core. In a second structure (Stamos et al. 2002), a single-ordered C-terminal segment (residues 977–995) interacts intermolecularly with neighboring EGFR-ICD molecules in the crystal unit cell (although all of these interactions might be influenced by crystal packing). Both of these interacting C-terminal sequences include the most N-terminal of known EGFR phosphorylation sites (Tyr 992, Tyr 1068, Tyr 1086, Tyr 1148, and Tyr 1173) (cf. Vega et al. 1992), which suggests that these interactions could be influenced by phosphorylation.
In summary, current models for the regulation of the catalytic activity inherent to the EGFR kinase propose crucial roles for the C-terminal phosphorylation domain. Thus, the C-terminal domain, prior to its phosphorylation, is proposed to somehow negatively regulate kinase activity toward exogenous substrates (cf. Landau et al. 2004). Despite the tremendous success in recent years in characterizing the structures of the EGFR extracellular and protein tyrosine kinase domains, limited structural information exists for the C terminus of the EGFR or of its homologous family members. We have in this study provided the first secondary structural analysis of the EGFR C terminus by circular dichroism. Our analysis revealed a surprising amount of secondary structure within this domain and modest structural changes induced by phosphorylation. Employing a novel method for C-terminally labeling the EGFR-ICD with a small unobtrusive exogenous fluorophore, we were also able to characterize the dynamics of the C-terminal domain in the context of receptor activation and autophosphorylation. Our results indicate that upon phosphorylation the C-terminal autophosphorylation domain of the EGFR undergoes a structural rearrangement and displays higher mobility. These phosphorylation-dependent structural and dynamic changes of the C-terminal domain may have important implications with respect to the regulation of EGFR kinase activity.
Materials and methods
Materials
TNM-FH insect cell medium and triethylsilane were purchased from Sigma. 5-((2-Aminoethyl)amino)naphthalene-1-sulfonic acid (1,5-EDANS) was purchased from Molecular Probes. N-α-Trityl-S-trityl-L-cysteine N-hydroxysuccinimide ester was purchased from Novabiochem. The Bac-to-Bac baculovirus expression system kit including the pFastBac1 donor plasmid and CellFECTIN reagent were purchased from Life Technologies. Triethylamine, dimethylformamide (DMF), trifluoroacetic acid, benzene, and dichloromethane were supplied by Fisher Scientific. Bovine serum albumin (BSA) was obtained from Pierce Biotechnology.
Generation of recombinant baculoviruses
The baculovirus expression system was used to generate recombinant EGFR domains, either as hexahistidine-tagged proteins to be purified by metal ion-chelation chromatography or as tripartite EGFR-intein-chitin binding domain (CBD) fusion proteins for application of the intein-mediated purification/labeling strategy (see below). All recombinant baculoviruses were constructed using the Bac-to-Bac system (Life Technologies). A vector for the expression of an N-terminally hexahistidine-tagged EGFR C-terminal domain (EGFR-CT) (human EGFR amino acids 972–1186) was constructed by a recombinant PCR method. Here, a methionine start codon followed by six histidine codons were fused upstream of the EGFR-CT-encoding cDNA and cloned behind the polyhedron promoter in the pFastBac1 Bac-to-Bac donor plasmid. Vectors for expression of EGFR-ICD-intein-CBD and EGFR-ΔCT-intein-CBD fusion proteins, carrying EGFR sequences corresponding to amino acid residues 644–1186 and 644–964, respectively, were generated as follows: First, the intein-CBD cDNA sequence was excised with SalI and PstI from the vector pTyb2 (New England Biolabs) and subcloned into pFastBac1 to generate the pFastBac1-intein-CBD donor plasmid. Then, a cDNA encoding the full-length human EGFR served as a template for PCR-based cloning of the EGFR cytoplasmic domain cDNAs into the SalI and SmaI restriction sites of pFastBac1-intein-CBD, upstream and in frame with the intein-CBD cDNA sequence. Subsequent generation of recombinant baculovirus from each recombinant pFastBac1 donor plasmid was performed according to manufacturer protocols. Purified recombinant viruses were amplified with three rounds of infection in Sf21 cells grown at 27°C using a multiplicity of infection (MOI) of 0.1. Viral supernatants were harvested 48–72 h post-infection.
Purification of recombinant EGFR proteins
Sf21 cells were infected with baculovirus at an MOI of 2. Forty-eight hours post-infection, cells were harvested by centrifugation at 1000g for 5 min, gently washed with resuspension buffer (20 mM HEPES at pH 7.4, 0.5 M NaCl, 250 mM sucrose, and protease inhibitors [5 μg/mL aprotinin, 5 μg/mL leupeptin, 2 μM pepstatin A, 1 mM PMSF]). Cells were again pelleted and then resuspended with sucrose-free resuspension buffer (minus sucrose) and then lysed using a microsonicator (4, 15-sec bursts). Sonication and all subsequent steps were performed at 4°C or on ice. After sonication, the cell lysate was centrifuged at 40,000g for 20 min, and the supernatant was collected and supplemented with 0.05% Triton X-100. In the case of the hexahistidine-tagged EGFR-CT protein, the lysate was run through a Talon cobalt resin column (Clontech) equilibrated with 20 mM HEPES (pH 7.4), 0.5 M NaCl, 8 mM imidazole, and 0.05% Triton X-100 at a 0.5-mL/min flow rate. The column was then washed with 20 column volumes of wash buffer (20 mM HEPES at pH 7.4, 0.5 M NaCl, 12 mM imidazole, 0.05% Triton X-100), then washed with an additional 10 column volumes of Triton X-100-free wash buffer. Hexahistidine-tagged proteins were eluted with 20 mM HEPES (pH 7.4), 0.5 M NaCl, 150 mM imidazole. Upon elution, hexahistidine-tagged proteins were dialyzed exhaustively against 20 mM HEPES (pH 7.4), 50 mM NaCl.
When recombinant EGFR proteins were to be simultaneously purified and labeled via intein-mediated cleavage (Chong et al. 1996, 1997; Xu and Perler 1996; Mukhopadhyay et al. 2001; Mekler et al. 2002), insect cell lysates containing EGFR-intein-CBD fusion proteins were passed through a chitin affinity column (New England Biolabs) equilibrated with column buffer (20 mM HEPES at pH 7.4, 0.5 M NaCl, 1 mM EDTA, 0.05% TX-100) at a 0.5-mL/min flow rate. The chitin column was washed with 20 column volumes of column buffer, followed by 10 volumes of Triton X-100-free column buffer. The column was quickly equilibrated with three volumes of reaction buffer (20 mM HEPES at pH 7.4, 200 mM NaCl, 0.5 mM EDTA, 50 mM DTT, 50 μM CEDANS) and incubated for 16–20 h at 4°C. The cleaved EGFR-ICD proteins were eluted with Triton X-100-free column buffer. CEDANS-labeled proteins were purified from free probe by gel filtration using a Sephadex G-25 column eluted with 20 mM HEPES (pH 7.4), 200 mM NaCl. The eluted proteins were dialyzed exhaustively against 20 mM HEPES (pH 7.4), 100 mM NaCl, 10% glycerol. Protein concentrations were determined using the micro BCA assay (Pierce), with bovine serum albumin as the standard.
Synthesis of a cysteine-conjugated EDANS fluorophore (CEDANS)
1,5-EDANS starting material (0.1 mM) was reacted with N-α-trityl-S-trityl-L-cysteine N-hydroxysuccinimide ester (0.15 mM) in 4 mL anhydrous dimethylformamide (DMF) and 10 μL triethylamine with stirring for 6 h in the dark. The solution was dried to solid by rotary evaporation and redissolved in dichloromethane:ethanol (5:1). The reacted intermediate product was purified from starting materials by flash chromatography (dichloromethane:EtOH, 5:1) and checked for purity by TLC. The solution was dried to solid and redissolved in 1 mL of 10% triethylsilane/dichloromethane and 1 mL of trifluoroacetic acid, stirred for 30 min, and then again dried. The intermediate materials were removed from the final cysteine-EDANS (CEDANS) conjugate by extraction with dichloromethane, followed by benzene.
Protein tyrosine kinase assays
Kinase assays were typically performed at 25°C by preincubating a 0.5-μM concentration of protein in 1 mM MnCl2 for 5 min in buffer A (20 mM HEPES at pH 7.4, 50 mM NaCl) and then initiated by addition of 100 μM ATP. The reactions were quenched after the noted time periods (0.2–30 min) with 5 mM EDTA. Proteins were resolved by SDS-PAGE and immunoblotted with EGFR (Ab12, Lab Vision) and phosphotyrosine (PY20, BD Transduction Laboratories) antibodies with enhanced chemiluminescence detection (ECL, Amersham Biosciences). Autophosphorylation activity was also assessed by autoradiography. Here, phosphorylation reactions were carried out by preincubating a 0.5-μM concentration of protein in 10 mM MnCl2 for 5 min at 25°C in a 20-μL volume in 20 mM HEPES (pH 7.4), 50 mM NaCl. The reaction was initiated by addition of 2 μM [γ-32P]ATP (100,000 cpm/pmol), and then quenched after noted time periods (0.5–30 min) by addition of 5 μL of SDS-PAGE sample buffer. Samples were resolved by SDS-PAGE, and the gel was dried and autoradiographed. The kinase activity of EGFR-ΔCT–CEDANS was determined by assessing its ability to phosphorylate the C-terminal phosphorylation domain substrate, EGFR-CT. EGFR-ΔCT–CEDANS (1 μM) and EGFR-CT (3 μM) were preincubated in the presence of 1 mM MnCl2 in 20 mM HEPES (pH 7.4), 50 mM NaCl, and the reaction was initiated by addition of 100 μM ATP and allowed to proceed for 30 min before quenching the reaction with SDS-PAGE sample buffer. Both nonphosphorylated and phosphorylated EGFR-CT substrate were resolved by 10% SDS-PAGE and immunoblotted with anti-EGFR and anti-phosphotyrosine.
Steady-state fluorescence excitation and emission measurements
Steady-state emission spectra were recorded with an SLM4800C spectrofluorimeter. All measurements were made at 25°C with 8 nm slits for excitation and emission and in the ratio mode. Excitation spectra of the CEDANS-labeled proteins were recorded with fixed emission at 485 nm and scanned from 300 to 425 nm. The emission spectra were obtained with excitation at 340 nm and scanned from 400–600 nm. Both excitation and emission spectra were corrected by subtraction of a blank buffer (20 mM HEPES at pH 7.4, 50 mM NaCl, 10% glycerol) spectrum.
Circular dichroism (CD) spectroscopy
CD spectra of EGFR-CT were recorded at 20°C in a 1-mm path length quartz cell over the wavelength range 190–260 nm at 1-nm intervals with an OLIS (CARY-17) CD spectrometer model 62DS with the aid of OLIS GlobalWorks software for data acquisition. Prior to analysis, EGFR-CT (4 μM) was incubated with EGFR-ΔCT–CEDANS (1 μM) and 1 mM MnCl2 in the presence or the absence of 100 μM ATP for 30 min. Subsequently, both phosphorylated and nonphosphorylated EGFR-CT were purified with a cobalt resin column to remove EGFR-ΔCT–CEDANS, as previously described for the purification of hexahistidine-tagged proteins. Following purification, EGFR-CT samples were dialyzed exhaustively against 10 mM sodium phosphate (pH 7.4), 5 mM NaCl.
Three spectra were taken for each sample and averaged, then corrected for the buffer spectrum containing 10 mM sodium phosphate (pH 7.4), 5 mM NaCl. The final protein concentration of nonphosphorylated and phosphorylated EGFR-CT was determined post-dialysis by micro BCA assay to normalize the data to molar ellipticity units (mdeg·cm2·dmol−1). The secondary structure contents of the proteins were determined using the SELCON algorithm in the CDPro program (Sreerama and Woody 1993).
Time-resolved fluorescence measurements
Fluorescence decay and anisotropy decay data were collected using a home-built, multifrequency cross-correlation phase and modulation fluorimeter (Gratton et al. 1984a,b). The 342-nm light source for exciting the EDANS-labeled protein conjugates, EGFR-ICD–CEDANS and EGFR-ΔCT–CEDANS, was from the pulsed output of a frequency-doubled, cavity-dumped, DCM dye laser (Coherent, Model 700) pumped by a mode-locked ND:YAG laser (Coherent, Antares). The emission from the labeled protein samples (0.5 μM) in 20 mM HEPES (pH 7.4), 50 mM NaCl, 20% (v/v) glycerol was collected through a low fluorescence, KV408 longpass filter (Schott) to eliminate scattered light. POPOP in ethanol, τ = 1.35 nsec, was used as a lifetime reference. To eliminate polarization artifacts, fluorescence lifetime measurements were performed under magic angle conditions in which the excitation beam was polarized normal to the laboratory plane (0°) and the emission polarizer was set to 54.7°. The data were fitted to a multiexponential decay model using the analysis software package Globals Unlimited (Laboratory for Fluorescence Dynamics, University of Illinois, Urbana, Champaign). Differential phase and modulation data (frequency domain anisotropy decay data) were collected immediately following lifetime data collection in the same instrument, under identical conditions. The data were plotted versus modulation frequency and subsequently analyzed with Globals Unlimited. A two-component anisotropy decay model was used to yield two rotational correlation times, their respective anisotropy amplitude values (pre-exponential values), and the time-zero anisotropy, (r0). Constant errors of 0.004 for modulation and 0.2° for phase were set in the analysis routines for the time-resolved data.
Dynamic light scattering analysis of EGFR-ICD–CEDANS
Light scattering measurements were made with a DynaPro Molecular Sizing Instrument with Dynamics software. EGFR-ICD–CEDANS (1.5 μM) and bovine serum albumin (0.2 mg/mL) were analyzed in 20 mM HEPES (pH 7.4), 100 mM NaCl at 4°C. Each protein sample was measured four times with 20 counts per measurement. Data reflect the subtraction from solvent noise peaks present in the samples.
Acknowledgments
We thank Drs. S. Ramaswamy and Lokesh Gakhar for their assistance with dynamic light scattering measurements, Dr. Michael W. Duffel for his assistance with our chemical synthesis, and Drs. Yon Ebright and Richard H. Ebright for providing protocol information for intein-mediated C-terminal labeling. This research was supported by the National Institutes of Health Grants DK44684 and RR03155, the University of Iowa Biological Sciences Funding Program, and a predoctoral fellowship to N.Y.L. from the United States Army Breast Cancer Research Program (grant DAMD17-98-1-8199).
Footnotes
Reprint requests to: John G. Koland, Department of Pharmacology, University of Iowa, Bowen Science Building, Iowa City, IA 52242-1109, USA; e-mail: john-koland@uiowa.edu; fax: (319) 335-8930.
Article published online ahead of print. Article and publication date are at http://www.proteinscience.org/cgi/doi/10.1110/ps.052045306.
Abbreviations:EGFR, epidermal growth factor receptor; SH2, Src homology-2; PTB, phosphotyrosine binding; PTK, protein tyrosine kinase; A-loop, activation loop; ICD, intracellular domain; CD, circular dichroism; ΔCT, C-terminal truncation; CBD, chitin-binding domain; EDANS, 5-((2-aminoethyl)amino)naphthalene-1-sulfonic acid; CEDANS, cysteine-conjugated EDANS; EGFR-CT, C-terminal domain of EGFR; GST, glutathione-S-transferase; TNP-ATP, 2′(3′)-O-(2,4,6-trinitrophenyl)-adenosine 5′-triphosphate.
References
- Bertics P.J. and Gill G.N. 1985. Self-phosphorylation enhances the protein-tyrosine kinase activity of the epidermal growth factor receptor J. Biol. Chem. 260: 14642–14647. [PubMed] [Google Scholar]
- Bertics P.J., Chen W.S., Hubler L., Lazar C.S., Rosenfeld M.G., Gill G.N. 1988. Alteration of epidermal growth factor receptor activity by mutation of its primary carboxyl-terminal site of tyrosine self-phosphorylation J. Biol. Chem. 263: 3610–3617. [PubMed] [Google Scholar]
- Burgess A.W., Cho H.S., Eigenbrot C., Ferguson K.M., Garrett T.P., Leahy D.J., Lemmon M.A., Sliwkowski M.X., Ward C.W., Yokoyama S. 2003. An open-and-shut case? Recent insights into the activation of EGF/ErbB receptors Mol. Cell 12: 541–552. [DOI] [PubMed] [Google Scholar]
- Cadena D.L., Chan C.L., Gill G.N. 1994. The intracellular tyrosine kinase domain of the epidermal growth factor receptor undergoes a conformational change upon autophosphorylation J. Biol. Chem. 269: 260–265. [PubMed] [Google Scholar]
- Cheng K. and Koland J.G. 1996. Nucleotide binding by the epidermal growth factor receptor protein-tyrosine kinase. Trinitrophenyl-ATP as a spectroscopic probe J. Biol. Chem. 271: 311–318. [DOI] [PubMed] [Google Scholar]
- Cheng K. and Koland J.G. 1998. Nucleotide-binding properties of kinase-deficient epidermal-growth-factor-receptor mutants Biochem. J. 330: 353–359. [DOI] [PMC free article] [PubMed] [Google Scholar]
- Chong S., Shao Y., Paulus H., Benner J., Perler F.B., Xu M.Q. 1996. Protein splicing involving the Saccharomyces cerevisiae VMA intein. The steps in the splicing pathway, side reactions leading to protein cleavage, and establishment of an in vitro splicing system J. Biol. Chem. 271: 22159–22168. [DOI] [PubMed] [Google Scholar]
- Chong S., Mersha F.B., Comb D.G., Scott M.E., Landry D., Vence L.M., Perler F.B., Benner J., Kucera R.B., Hirvonen C.A.et al. 1997. Single-column purification of free recombinant proteins using a self-cleavable affinity tag derived from a protein splicing element Gene 192: 271–281. [DOI] [PubMed] [Google Scholar]
- Gill G.N., Bertics P.J., Santon J.B. 1987. Epidermal growth factor and its receptor Mol. Cell. Endocrinol. 51: 169–186. [DOI] [PubMed] [Google Scholar]
- Gratton E., Jameson D.M., Hall R.D. 1984a. Multifrequency phase and modulation fluorometry Annu. Rev. Biophys. Bioeng. 13: 105–124. [DOI] [PubMed] [Google Scholar]
- Gratton E., Limkeman M., Lakowicz J.R., Maliwal B.P., Cherek H., Laczko G. 1984b. Resolution of mixtures of fluorophores using variable-frequency phase and modulation data Biophys. J. 46: 479–486. [DOI] [PMC free article] [PubMed] [Google Scholar]
- Hubbard S.R. and Till J.H. 2000. Protein tyrosine kinase structure and function Annu. Rev. Biochem. 69: 373–398. [DOI] [PubMed] [Google Scholar]
- Landau M., Fleishman S.J., Ben-Tal N. 2004. A putative mechanism for downregulation of the catalytic activity of the EGF receptor via direct contact between its kinase and C-terminal domains Structure 12: 2265–2275. [DOI] [PubMed] [Google Scholar]
- Lee N.Y. and Koland J.G. 2005. Conformational changes accompany phosphorylation of the epidermal growth factor receptor C-terminal domain Protein Sci. 14: 2793–2803. [DOI] [PMC free article] [PubMed] [Google Scholar]
- Mekler V., Kortkhonjia E., Mukhopadhyay J., Knight J., Revyakin A., Kapanidis A.N., Niu W., Ebright Y.W., Levy R., Ebright R.H. 2002. Structural organization of bacterial RNA polymerase holoenzyme and the RNA polymerase-promoter open complex Cell 108: 599–614. [DOI] [PubMed] [Google Scholar]
- Mukhopadhyay J., Kapanidis A.N., Mekler V., Kortkhonjia E., Ebright Y.W., Ebright R.H. 2001. Translocation of σ(70) with RNA polymerase during transcription: Fluorescence resonance energy transfer assay for movement relative to DNA Cell 106: 453–463. [DOI] [PubMed] [Google Scholar]
- Ogiso H., Ishitani R., Nureki O., Fukai S., Yamanaka M., Kim J.H., Saito K., Sakamoto A., Inoue M., Shirouzu M.et al. 2002. Crystal structure of the complex of human epidermal growth factor and receptor extracellular domains Cell 110: 775–787. [DOI] [PubMed] [Google Scholar]
- Pawson T. 1994. Signal transduction: Look at a tyrosine kinase Nature 372: 726–727. [DOI] [PubMed] [Google Scholar]
- Pawson T. 1995. Protein-tyrosine kinases: Getting down to specifics Nature 373: 477–478. [DOI] [PubMed] [Google Scholar]
- Posner I., Engel M., Levitzki A. 1992. Kinetic model of the epidermal growth factor (EGF) receptor tyrosine kinase and a possible mechanism of its activation by EGF J. Biol. Chem. 267: 20638–20647. [PubMed] [Google Scholar]
- Schlessinger J. 2000. Cell signaling by receptor tyrosine kinases Cell 103: 211–225. [DOI] [PubMed] [Google Scholar]
- Schlessinger J. 2002. Ligand-induced, receptor-mediated dimerization and activation of EGF receptor Cell 110: 669–672. [DOI] [PubMed] [Google Scholar]
- Sierke S.L. and Koland J.G. 1993. SH2 domain proteins as high-affinity receptor tyrosine kinase substrates Biochemistry 32: 10102–10108. [DOI] [PubMed] [Google Scholar]
- Sierke S.L., Longo G.M., Koland J.G. 1993. Structural basis of interactions between epidermal growth factor receptor and SH2 domain proteins Biochem. Biophys. Res. Commun. 191: 45–54. [DOI] [PubMed] [Google Scholar]
- Sreerama N. and Woody R.W. 1993. A self-consistent method for the analysis of protein secondary structure from circular dichroism Anal. Biochem. 209: 32–44. [DOI] [PubMed] [Google Scholar]
- Sreerama N. and Woody R.W. 2000. Estimation of protein secondary structure from circular dichroism spectra: Comparison of CONTIN, SELCON, and CDSSTR methods with an expanded reference set Anal. Biochem. 287: 252–260. [DOI] [PubMed] [Google Scholar]
- Stamos J., Sliwkowski M.X., Eigenbrot C. 2002. Structure of the epidermal growth factor receptor kinase domain alone and in complex with a 4-anilinoquinazoline inhibitor J. Biol. Chem. 277: 46265–46272. [DOI] [PubMed] [Google Scholar]
- Tolbert T.J. and Wong C.H. 2000. Intein-mediated synthesis of proteins containing carbohydrates and other molecular probes J. Am. Chem. Soc. 122: 5421–5428. [Google Scholar]
- Vega Q.C., Cochet C., Filhol O., Chang C.P., Rhee S.G., Gill G.N. 1992. A site of tyrosine phosphorylation in the C terminus of the epidermal growth factor receptor is required to activate phospholipase C Mol. Cell. Biol. 12: 128–135. [DOI] [PMC free article] [PubMed] [Google Scholar]
- Walton G.M., Chen W.S., Rosenfeld M.G., Gill G.N. 1990. Analysis of deletions of the carboxyl terminus of the epidermal growth factor receptor reveals self-phosphorylation at tyrosine 992 and enhanced in vivo tyrosine phosphorylation of cell substrates J. Biol. Chem. 265: 1750–1754. [PubMed] [Google Scholar]
- Wedegaertner P.B. and Gill G.N. 1992. Effect of carboxyl terminal truncation on the tyrosine kinase activity of the epidermal growth factor receptor Arch. Biochem. Biophys. 292: 273–280. [DOI] [PubMed] [Google Scholar]
- Wood E.R., Truesdale A.T., McDonald O.B., Yuan D., Hassell A., Dickerson S.H., Ellis B., Pennisi C., Horne E., Lackey K.et al. 2004. A unique structure for epidermal growth factor receptor bound to GW572016 (Lapatinib): Relationships among protein conformation, inhibitor off-rate, and receptor activity in tumor cells Cancer Res. 64: 6652–6659. [DOI] [PubMed] [Google Scholar]
- Xu M.Q. and Perler F.B. 1996. The mechanism of protein splicing and its modulation by mutation EMBO J. 15: 5146–5153. [PMC free article] [PubMed] [Google Scholar]


